
Abstract
The present study aimed to investigate the effect of obstructive sleep apnea (OSA) and its treatment with continuous positive airway pressure (CPAP), the gold standard treatment for OSA on changes of telomere length and its associated mechanisms. In this mechanistic pilot study of a selective patient population (middle-aged men, BMI < 35 kg/m2, moderate–severe OSA), a 6-month randomized, double-blind, and sham-controlled clinical trial was conducted (Clinical Trials: NCT04872816, April 29, 2021 retrospectively registered). Participants were randomized to CPAP or sham-CPAP (randomization schema 2:1) and attended 7 visits, undergoing clinical assessments and blood collection to determine mean leukocyte telomere length (LTL) and assess metabolic and inflammatory markers. Among 127 individuals contacted, 46 met the inclusion criteria (n = 30 in the CPAP group and n = 16 in the sham-CPAP group). At baseline, individuals in both groups were homogeneous with respect to LTL (p = 0.106). Adherence during the intervention was measured in hours per night, recorded as 5.29 ± 1.09 hours/night for the sham-CPAP group and 5.71 ± 0.19 hours/night for the CPAP group, representing the last 30 days prior to the final visit. Three measurements of LTL were taken at baseline, 3 months, and 6 months. After 6 months of intervention, a statistically significant effect of treatment was observed (p = 0.001) on LTL, with the sham-CPAP group showing a greater reduction (1.0117 ± 0.1552, 0.9457 ± 0.0747, 0.8482 ± 0.2163) compared with the CPAP group (1.0960 ± 0.1122, 1.0521 ± 0.1094, 1.0675 ± 0.1225). Furthermore, a negative correlation between delta LTL and delta TNF-α at Visit 7 and Visit 1 was found (ρ = −0.216, p = 0.003), primarily attributed to the sham-CPAP intervention (ρ = −0.383, p = 0.009) compared with CPAP use (ρ = 0.021, p = 0.800). We conclude that CPAP, compared with sham-CPAP placebo, was associated with stabilization in LTL, potentially through modulation of TNF-α.
Introduction
The accumulation of damage from elevated levels of inflammation and reactive oxygen species impacts key aspects of the aging process, contributing to physiological function impairment, increased disease incidence, and reduced lifespan, thereby damaging vital biomolecules. 1 Specific types of damage include double-strand breaks in deoxyribonucleic acid (DNA) and telomere shortening, both crucial triggers for cell senescence. 2
Telomeric DNA consists of tandem repeats of the 6-nucleotide unit (TTAGGG(n)), located at the ends of chromosomes to protect these terminal regions from degradation and prevent genetic material loss. 3 In human aging, telomere length decreases due to cumulative cell replication throughout the lifespan, correlating strongly with mortality risk, and serving as a key biomarker of aging and related diseases intertwined with replicative history and environmental exposures. 4
Given that oxidative stress is a critical modulator of telomere maintenance and that telomere-driven replicative senescence primarily results from stress responses, 5 a systematic review with meta-analysis indicated that cross-sectional studies observed an association between OSA and shorter telomeres. 6 However, no studies have evaluated the impact of CPAP, the gold-standard treatment for OSA, on telomere length. Thus, this study aims to investigate the effects of OSA and CPAP treatment on variations in telomere length and their associated health implications.
Methods
Type of study
This was a randomized, double-blind, sham-controlled 6-month clinical trial.
Selection of participants
Participants were selected at the sleep–breathing disorders medical clinic of the Department of Psychobiology at the Universidade Federal de São Paulo—UNIFESP. The study adhered to the rules of clinical research according to resolution 466/2012 and received approval from the Research Ethics Committee of UNIFESP (CEP n° 0232/2018). The protocol was registered in Clinical Trials (NCT04872816). Following the informed consent process, participants were only included after agreeing to all study procedures, with CPAP offered free of charge.
Male participants included had a body mass index (BMI) of less than 35 kg/m2, were aged between 35 and 65 years, and were diagnosed by polysomnography (PSG) with moderate-to-severe OSA (apnea–hypopnea index, AHI ≥20 events/hour of sleep). The rationale for limiting inclusion to male participants was based on literature indicating that sex influences telomere attrition rates, primarily due to the protective effects of estrogen against reactive oxygen species. 7
Exclusion criteria included illiteracy, participants with more than 50% of respiratory events being central apneas, participants with central AHI >5 events/hour, sleepiness measured by the Epworth sleepiness scale ≥14, severe otorhinolaryngological diseases preventing CPAP use, other sleep disorders, prior treatments for OSA, claustrophobia, CPAP intolerance, and those unable to complete participation.
Study design
Participants were evaluated seven times during the 6-month study period.
After signing the informed consent, participants performed PSG at baseline and/or titration. Randomization was executed in a planned 2:1 ratio using Random software (https://www.random.org/), allocating participants to either:
Group 1: CPAP treatment Group 2: Sham-CPAP control
Visit 1 involved a clinical interview and history evaluation, where blood samples were collected. Visit 4 (3 months into the protocol) involved adherence assessment and follow-up questionnaires. Visit 7 (6 months) featured final assessments and additional blood collection. Visits 2, 3, 5, and 6 consisted of monthly evaluations on CPAP adherence and overall feedback.
Clinical evaluation
Clinical interviews included physical examinations, measuring systolic/diastolic blood pressure, weight, height (for BMI), and circumferences (neck, waist, hip). The Pittsburgh Sleep Quality Index (PSQI), 8 Epworth Sleepiness Scale (ESS), 9 and Morningness-Eveningness questionnaire 10 were administered. Sociodemographic and health data were obtained from various questionnaires assessing health parameters and lifestyle habits: socioeconomic questionnaire, 11 general health questionnaire, 12 International Physical Activity Questionnaires (IPAQ), 13 Beck’s depression inventory, 14 and anxiety questionnaire. 15
Objective sleep evaluation
Polysomnography
All subjects underwent PSG with the EMBLA® N7000 system (Embla Systems Inc., USA) before and after the treatment. Sleep staging followed standardized AASM criteria. Hypopneas were defined as a 30% reduction in respiratory flow associated with either an awakening or a 3% oxygen desaturation, while the desaturation index indicated 3% desaturations per hour. AHI was defined by the total number of apneas/hypopneas per hour. 16 The study included individuals classified with moderate to severe OSA (AHI ≥20 events/hour).
CPAP use and adherence
Following OSA diagnosis confirmation, participants were referred for PSG titration with CPAP or sham-CPAP. Only technicians were aware of group allocations. The examination analysis was performed by a sleep specialist who determined CPAP titration pressure and maintained sham-CPAP pressure at 10 cm H2O to simulate similar airflow.
In this study, the sham CPAP developed for this study was refined from the model of Farré and colleagues. 17 A resistor made from a silicone stopper that sealed the generator outlet was adapted to the device, and a 4.5 mm hole was made inside the stopper. This resistor was inserted into the internal circuit of the CPAP, making it impossible for the patient to see, and it increased the resistance to the generator’s outgoing flow. A connector was inserted between the mask and the circuit, creating a leakage system that was not perceptible to the patient. Four holes, totaling 12 mm, were made in this “swivel” to increase air escape, producing a nontherapeutic pressure level in the nasal mask. Despite the absence of therapeutic pressure at the mask, the pressure on the generator’s display was maintained at the normally prescribed level (10 cm H2O), which was tested by manometry in the laboratory and helped maintain the sensation of ventilation at the mask. The final pressure in the circuit was 0.5–1.5 cm H2O.
Laboratory measurements
Blood collection
Blood samples were collected in ethylenediaminetetraacetic acid (EDTA) tubes for DNA extraction and dry tubes for measuring inflammatory, oxidative, and metabolic markers during visits 1, 4, and 7.
Measurement of leukocyte telomere length
DNA was extracted via the salting-out method (Miller et al., 1988), with some modifications. The DNA samples were quantified and diluted to 50 ng/uL. Leukocyte telomere length (LTL) measurement was performed by quantitative real-time polymerase chain reaction, as described by Cawthon. 18 Measurement consists of determining the relative ratio (T/S ratio) of ng of telomeres (T) to ng of albumin (single-copy gene, S) in experimental samples using a standard curve. The T/S ratio is proportional to the average TL.
The final volume in the reaction wells was 25 μL and contained: 12.5 μL of 2x SYBR® Select Master Mix (Life- Thermo Fischer Scientific, 4472920); 1 μL sample DNA; 0.9 μL of 25 μM telg (final concentration 900 nM); 0.6 μL of 25 μM telc (600 nM); 0.9 μL of 25 μM albu (900 nM); 0.9 μL of 25 μM albd (900 nM) 19 ; and 8.2 μL of UltraPureTM DNase/RNase-Free Distilled Water (Life-Thermo Fischer Scientific, 10977035). The standard curve was built based on a 5-point 1:3 serial dilution DNA from a single individual (range from 150 to 1.85 ng). The samples and standard curve were all run in triplicate in a ViiATM 7 real-time polymerase chain reaction system with a fast 96-Well Block (Thermo Fischer Scientific, USA). Outliers were excluded from the analysis.
The conditions of polymerase chain reaction amplifications were: 15 minutes at 95°C, 2 cycles of 15 seconds at 94°C, 15 seconds at 49°C, 35 cycles of 15 seconds at 94°C, 10 seconds at 68°C and 15 seconds at 74°C with acquisition of fluorescence (detection of telomere amplification), 10 seconds at 85°C, 15 seconds at 88°C with acquisition of fluorescence (detection of albumin amplification) and the melting curve. In all runs, a seriated dilution from a standard DNA was added in order to construct a standard curve used to relatively quantify TL in relation to albumin gene (T/S Ratio).
Intra-assay and interassay coefficient of variation were calculated through the formula: coefficient of variation = 100 × (standard deviation/mean). A single sample was used for interassay calculation. This sample was run on all the plates. For the intra-assay reported, it reflects the average value calculated from the individual coefficient of variation for all the triplicates. The values of coefficient of variation were 2.45% (intra-assay) and 3.63% (interassay).
Measurement of laboratory parameters
Proinflammatory biomarkers (TNF-α, IL-6) were measured using enzyme-linked immunosorbent assay (ELISA) (R&D Systems, Inc., USA). Oxidative stress markers (asymmetrical dimethylarginine [ADMA], 8-oxodG) were also measured by ELISA (DLD Diagnostika GMBH®, Germany; R&D Systems, Inc., USA). ELISA assessed biochemical dosages adhering to manufacturers’ specifications.
Statistical analysis
Descriptive analyzes characterized the participant profile. We defined the primary endpoint as the between-group difference in the change in mean LTL from baseline to 6 months. The primary analysis used a generalized estimating equations model with factors Group (CPAP vs. sham), Time (baseline, 3 months, 6 months), and Group × Time interaction, adjusting for age, BMI, and baseline LTL. In sensitivity analyses, baseline TNF-α and triglycerides were added as covariates to address potential baseline imbalances; results remained significant. All p-values for treatment effect, time, and interactions in the results derive from this model unless otherwise specified.
Analysis was supplemented by generalized linear model (GLzM) for single-point analyses, with Bonferroni’s post hoc adjustments when necessary. Chi-square tests were used for categorical variable analyses, while Spearman′s correlation was applied for continuous variables.
PASW Statistics 20 (SPSS Inc., USA) was used, and a significance threshold of α = 0.05 was adopted.
Results
Among the total sample (n = 127) contacted between July 2018 and March 2021, 76 individuals met the inclusion/exclusion criteria (59.8%). Withdrawal rate reached 9.2% (n = 7), with 4 subjects withdrawing preprotocol. Of the 46 participants included, 65.2% (n = 30) were randomized to CPAP and 34.8% (n = 16) to sham. Three individuals withdrew consent midway (2 CPAP, 1 sham). Participant flow is presented in Figure 1 using an adapted CONSORT-style diagram to clearly show numbers screened, excluded (with reasons), enrolled, and included in analyses.

Flow diagram showing participant screening, eligibility assessment, exclusions, enrollment, group assignment, follow-up, and analysis. The diagram follows the CONSORT 2010 flow diagram format and has been adapted to reflect the design and participant flow of this study. Numbers indicate participants at each stage and reasons for exclusion.
Baseline evaluation
Table 1 illustrates the sociodemographic profiles of the randomized CPAP and sham groups, revealing homogeneity across evaluated aspects. Tables 2-4 showcase baseline assessments during Visit 1. Significant differences were noted between groups for neck circumference (B = 0.045, 95% CI = 0.003–0.087, p = 0.035), chronotype (X2 = 6.158, df = 2, p = 0.046), and PSQI (B = −0.495, 95% CI = −0.495 to 0.010, p = 0.046), with the sham group exhibiting worse sleep quality. Laboratory measurements indicated that the CPAP group had elevated glucose (B = 0.183, 95% CI = 0.005–0.362, p = 0.044), VLDL cholesterol (B = 0.427, 95% CI = 0.427–0.710, p = 0.003), and triglycerides (B = 0.445, 95% CI = 0.145–0.745, p = 0.004), alongside lower TNF-α levels compared with sham (B = −1.427, 95%CI = −1.967 to 0.887, p < 0.001). No significant differences emerged in polysomnographic parameters. Differences in CPAP titration were anticipated (B = 0.777, 95% CI = 0.041–0.094, p < 0.001). No statistically significant differences in LTL were recorded between groups (B = 0.085, 95% CI = −0.007 to 0.177, p = 0.106).
Unadjusted Mean ± Standard Deviation and Frequency (%) of the Sociodemographic Parameters of the Study Participants according to Randomization for SHAM or CPAP Groups

p-value: statistical significance.
Unadjusted Mean ± Standard Deviation and Frequency (%) of the Physical Evaluation Conducted at Visit 1 of the Study Participants According to Randomization for SHAM or CPAP Groups
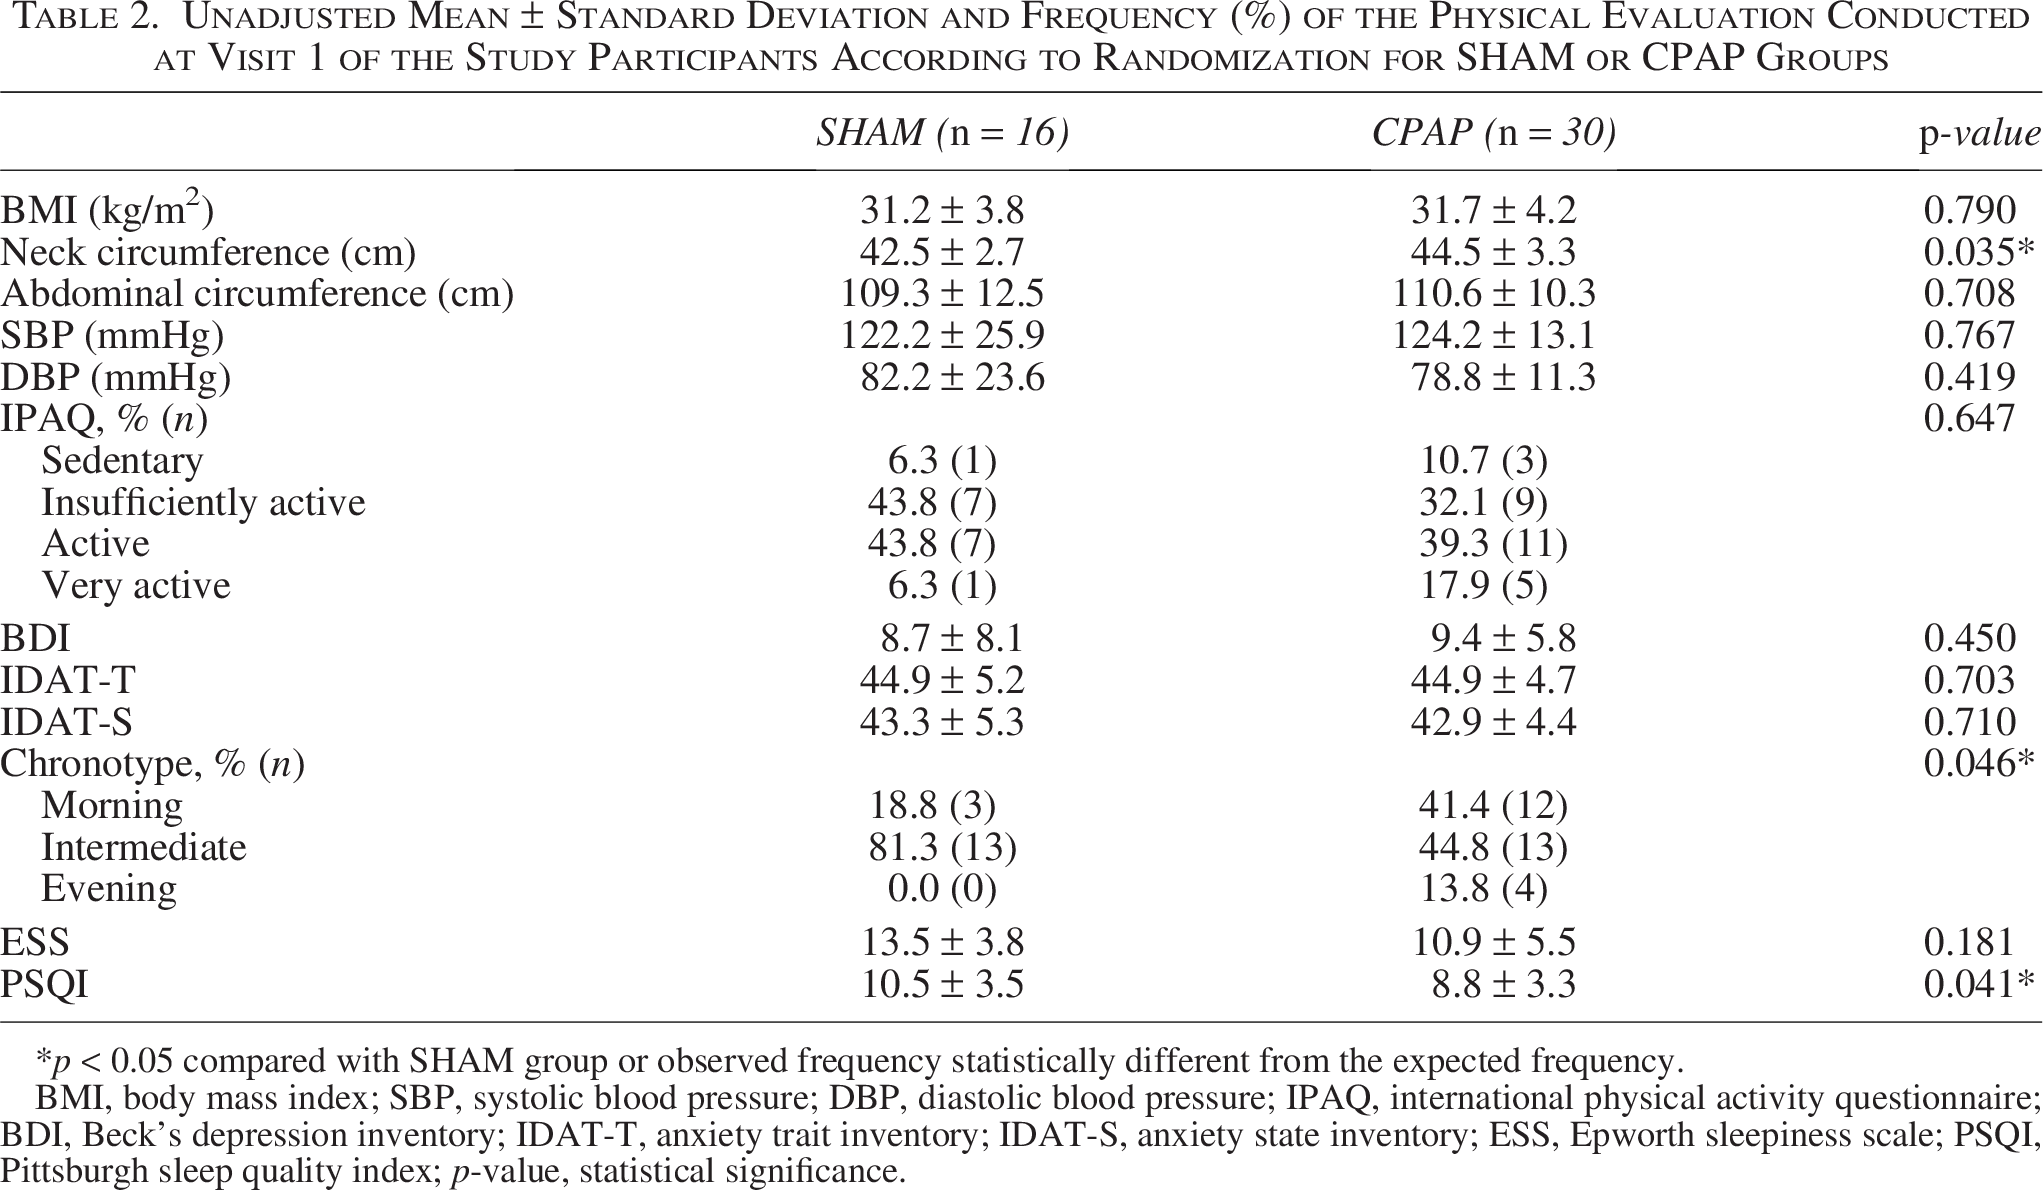
p < 0.05 compared with SHAM group or observed frequency statistically different from the expected frequency.
BMI, body mass index; SBP, systolic blood pressure; DBP, diastolic blood pressure; IPAQ, international physical activity questionnaire; BDI, Beck’s depression inventory; IDAT-T, anxiety trait inventory; IDAT-S, anxiety state inventory; ESS, Epworth sleepiness scale; PSQI, Pittsburgh sleep quality index; p-value, statistical significance.
Unadjusted Mean ± Standard Deviation and Frequency (%) of Laboratory Measurements Performed on Visit 1 of Study Participants according to Randomization for SHAM or CPAP Groups
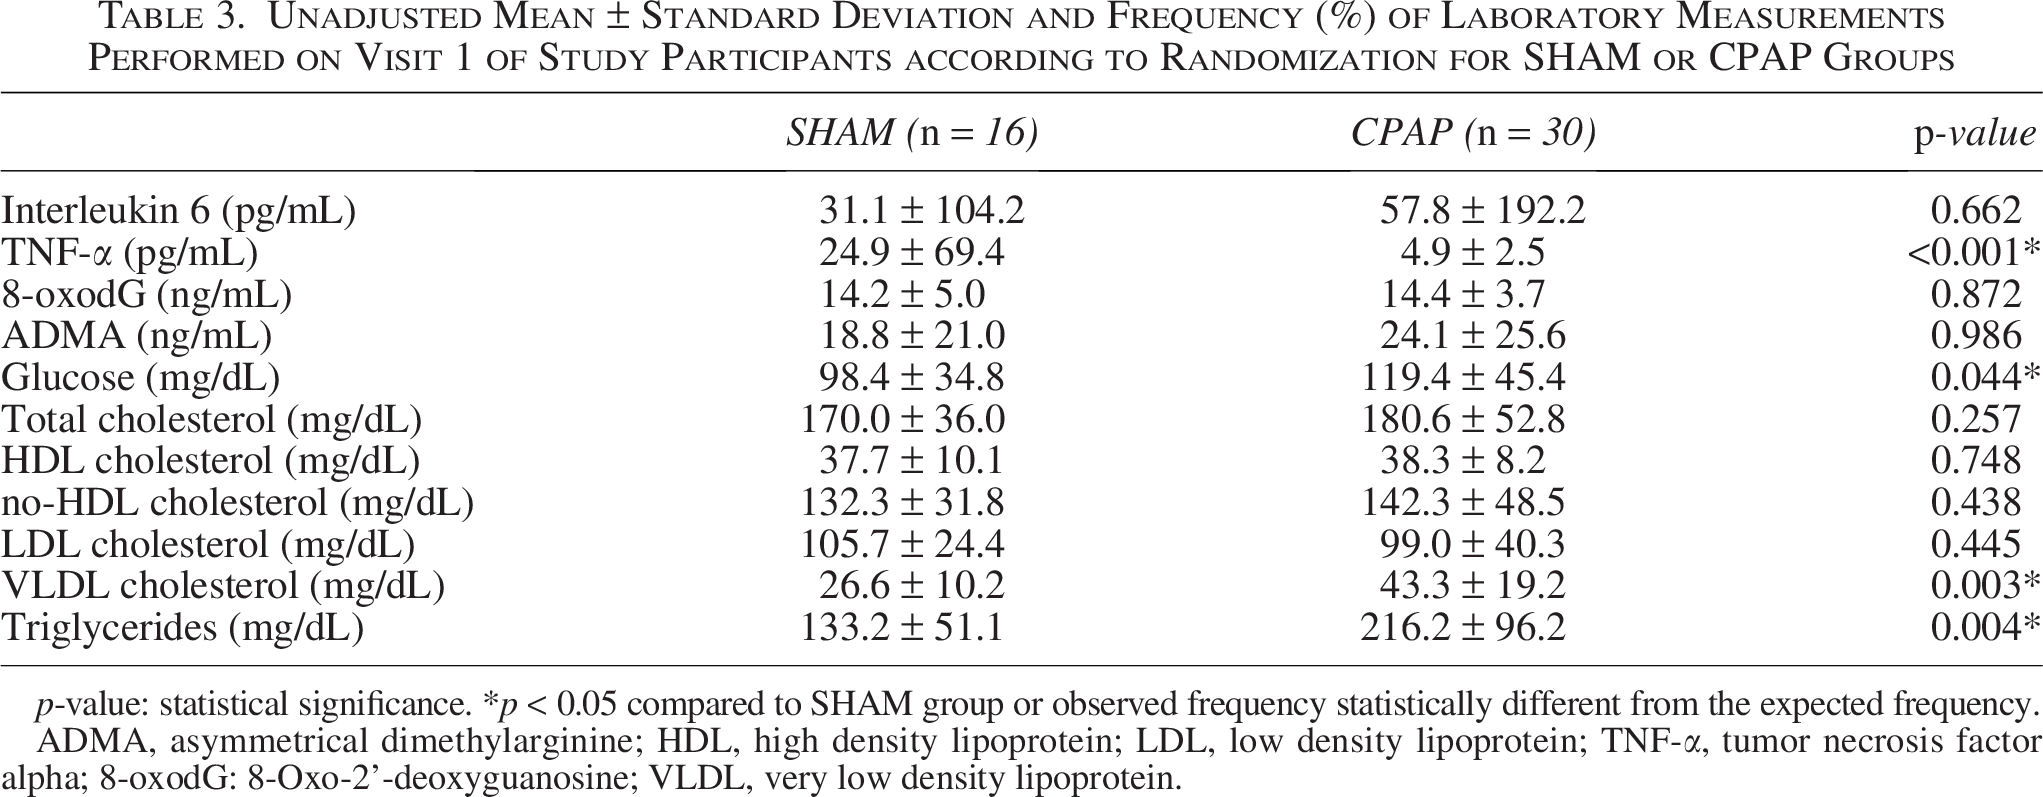
p-value: statistical significance. *p < 0.05 compared to SHAM group or observed frequency statistically different from the expected frequency.
ADMA, asymmetrical dimethylarginine; HDL, high density lipoprotein; LDL, low density lipoprotein; TNF-α, tumor necrosis factor alpha; 8-oxodG: 8-Oxo-2’-deoxyguanosine; VLDL, very low density lipoprotein.
Unadjusted Mean ± Standard Deviation and Frequency (%) of Polysomnographic Parameters at Visit 1 of Study Participants according to Randomization for SHAM or CPAP Groups
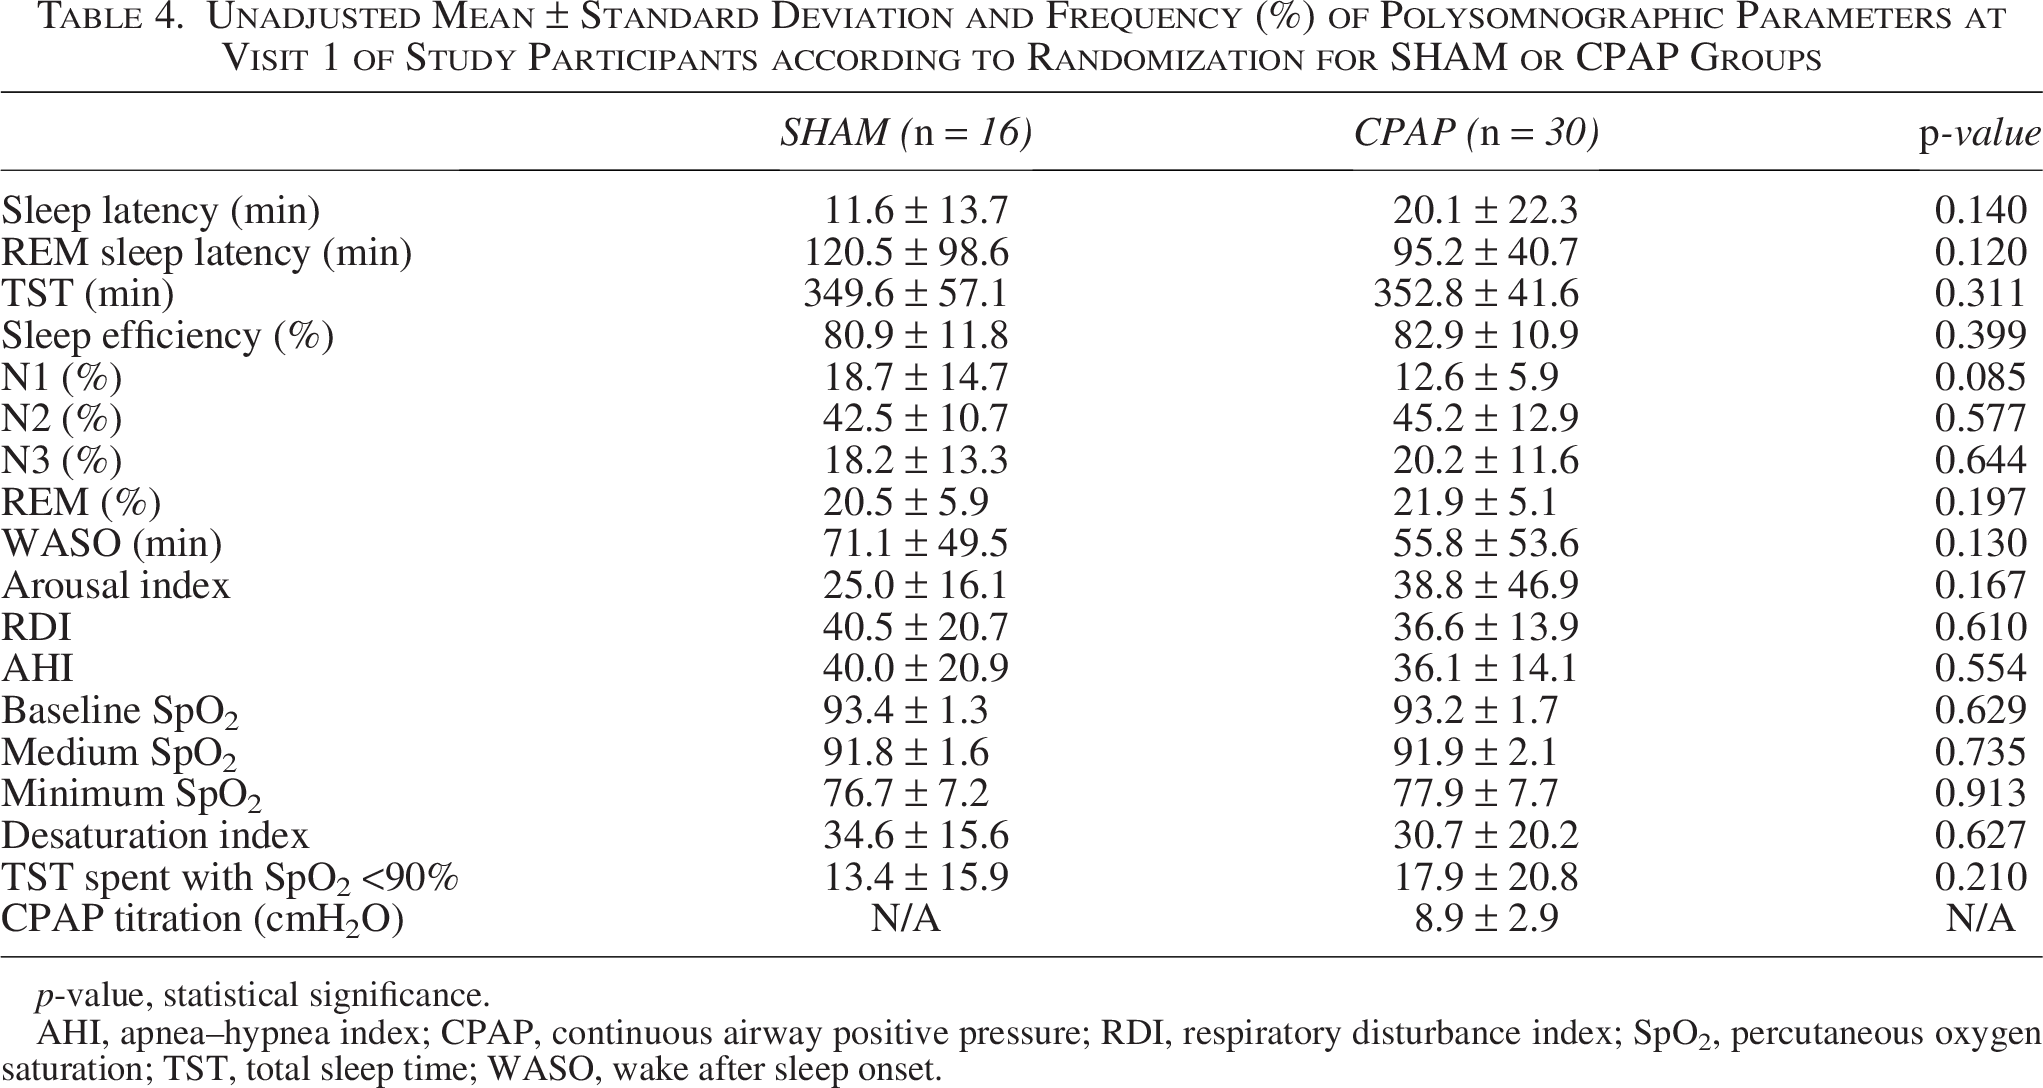
p-value, statistical significance.
AHI, apnea–hypnea index; CPAP, continuous airway positive pressure; RDI, respiratory disturbance index; SpO2, percutaneous oxygen saturation; TST, total sleep time; WASO, wake after sleep onset.
Comparison of SHAM and CPAP groups: Baseline and after 3 months
The treatment displayed a statistically significant effect (B = −0.085, 95% CI = −0.190 to 0.020, p = 0.011) on LTL with the sham group (1.0117 ± 0.1552 vs. 0.9457 ± 0.0747) showing a greater reduction compared with the CPAP group (1.0960 ± 0.1122 vs. 1.0521 ± 0.1094). Another model was run adjusting for baseline TNF-α and triglycerides in addition to LTL, age, and BMI. This sensitivity analysis confirms that the treatment effect remains statistically significant (B = −0.075, 95% CI = −0.184 to 0.019, p = 0.023), indicating robustness to these baseline differences.
Analysis of deltas revealed a significant correlation between LTL and TNF-α (ρ = −0.354, p < 0.001), with a lack of correlation observed in the CPAP group (ρ = −0.150, p = 0.195). Furthermore, a stronger negative correlation emerged between sham and TNF-α (ρ = −0.475, p = 0.08) without significant correlations noted for LTL and IL-6, 8-oxo-dG, or ADMA.
Comparison of SHAM and CPAP groups: Baseline, after 3, and 6 months
Supplementary Tables S1–S2 present physical, questionnaire, and laboratory evaluations of participants across all visits. Supplementary Table S4 compares polysomnographic parameters pre and posttreatment within the CPAP group, noting that PSG evaluations for sham-CPAP were affected by coronavirus disease (COVID-19) restrictions.
The objective evaluation of the use by directly extracting data from the device showed that the average usage for all days for the SHAM group was 4.52 ± 0.65 and for the CPAP group, it was 5.53 ± 0.29. We found an effect of time, specifically when comparing Visits 2 and 5 (B = 0.167, 95% CI = 0.026–0.308, p = 0.021) and Visits 2 and 6 (B = 0.148, 95% CI = 0.013–0.283, p = 0.031). In addition, we observed an effect of treatment × time interaction between SHAM group × Visit 5 (B = −0.448, 95% CI = −0.865 to −0.032, p = 0.035) and between SHAM group × Visit 6 (B = −0.850, 95% CI = −1.213 to −0.487, p < 0.001). We found no effect of the intervention (SHAM or CPAP).
A statistically significant effect of treatment on LTL was found, with the sham group displaying a greater reduction (1.0117 ± 0.1552, 0.9457 ± 0.0747, 0.8482 ± 0.2163) compared with the CPAP group (1.0960 ± 0.1122, 1.0521 ± 0.1094, 1.0675 ± 0.1225), as noted in Table 5. Notably, a time effect on LTL emerged (B = −0.098, 95% CI = −0.174 to −0.022, p = 0.012), with no significant time × treatment interaction observed (p = 0.659). This analysis used a simple model (B = 0.137, 95% CI = 0.066–0.094, p = 0.010) considering age and BMI as covariates (B = 0.136, 95% CI = 0.053–0.219, p = 0.001), as illustrated in Figure 2.
Unadjusted Mean ± Standard Deviation of the Leukocyte Telomere Length Conducted at Visits 1, 4, and 7 of the Participants in SHAM and CPAP Groups
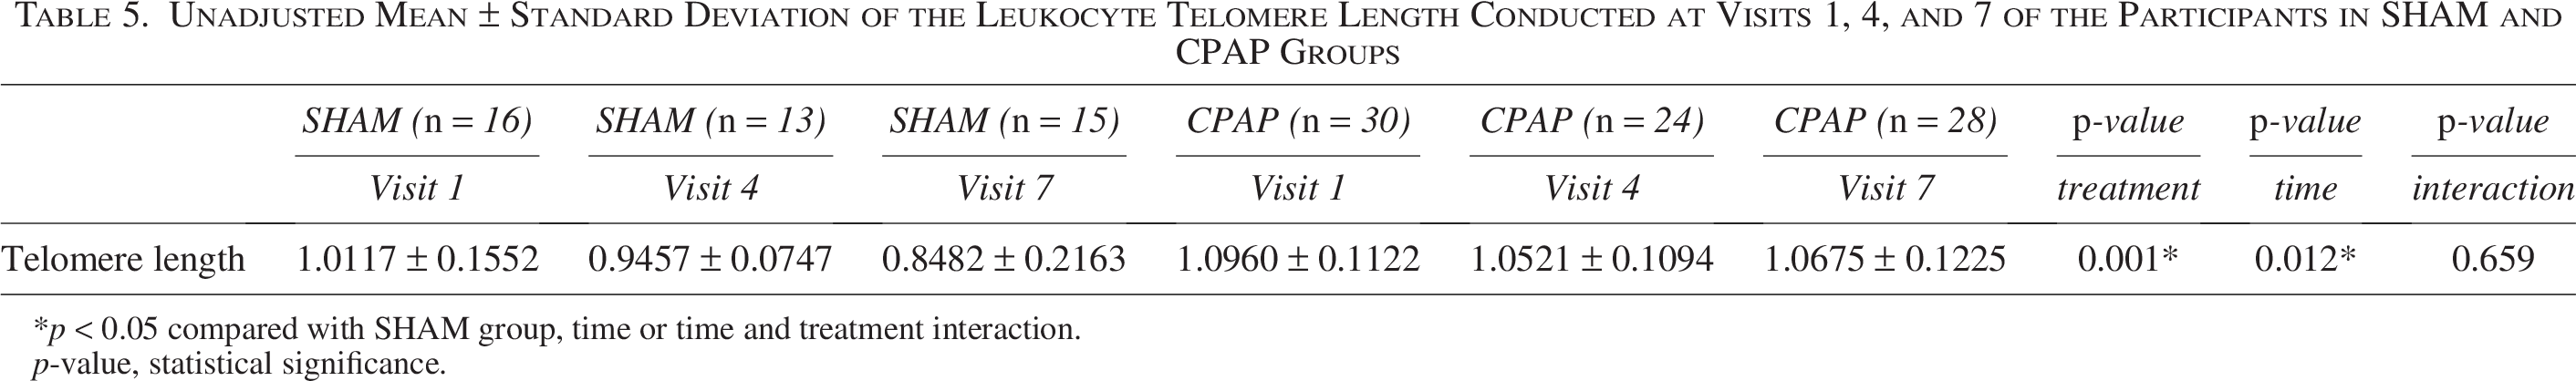
p < 0.05 compared with SHAM group, time or time and treatment interaction.
p-value, statistical significance.
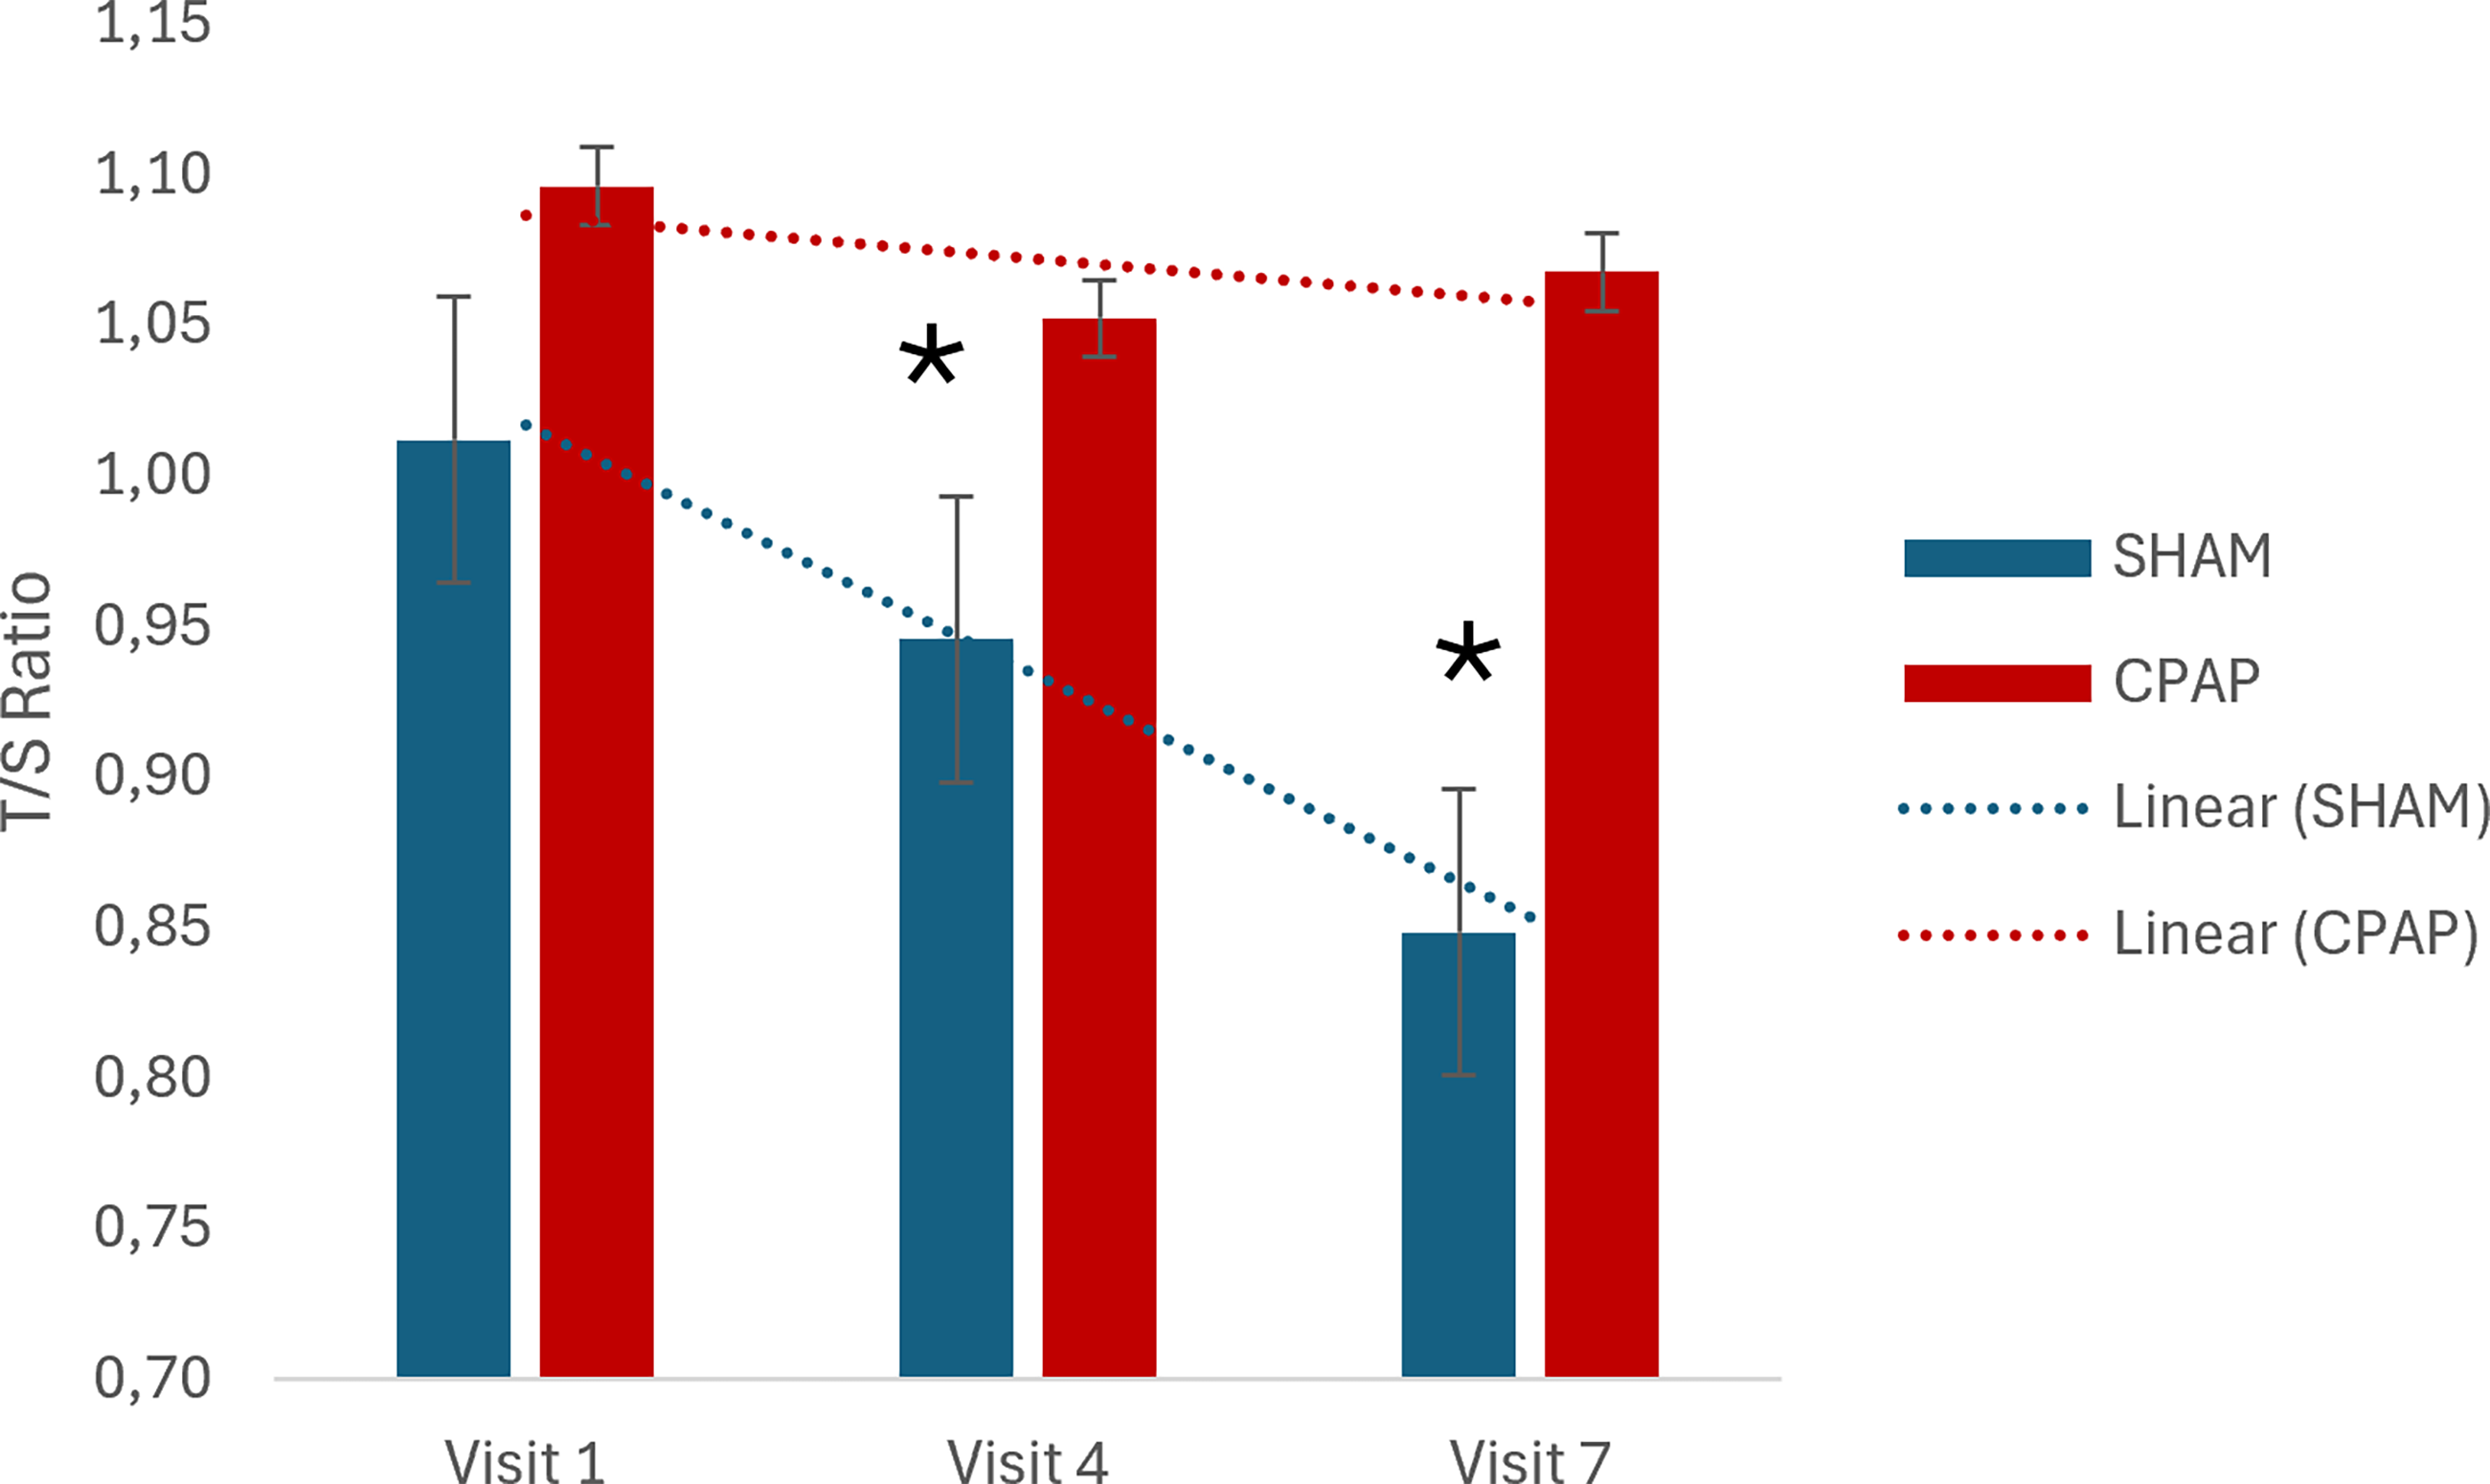
Mean leukocyte telomere length (LTL) expressed by the mean of the T/S ratio between SHAM and CPAP groups at baseline, 3 months, and 6 months; error bars represent standard deviation; p-values from primary generalized estimating equations (GEE) model adjusted for age, BMI, and baseline LTL; *statistically different compared to visit 1. BMI, body mass index; CPAP, continuous positive airway pressure; GEE.
Including TNF-α and triglycerides in addition to LTL, age, and BMI, we observed that the treatment effect remains statistically significant (B = −0.093, 95% CI = −0.152 to −0.037, p = 0.010).
The negative correlation between deltas of LTL and TNF-α was significant (ρ = −0.216, p = 0.003) and prominent with sham intervention (ρ = −0.383, p = 0.009). No significant correlations emerged for delta LTL and deltas IL-6, ADMA, or 8-oxo-dG.
Discussion
The present study demonstrates that before the start of intervention, participants of both groups were similar. Notably, LTL was also not statistically different between groups. After the start of interventions, we found an effect of CPAP on the maintenance of LTL when compared with SHAM.
It is known that OSA is capable of stimulating oxidative stress and inflammation, as well as activating the sympathetic nervous system and contributing to endothelial dysfunction through mechanisms directly linked to sleep fragmentation and intermittent hypoxia.19–21 The main factors associated with the pathophysiology of OSA contribute to the exacerbation of inflammation and oxidative stress pathways. 1
Barceló et al. demonstrated for the first time that patients with OSA had lower LTL when compared to controls. 22 Later, several studies found an association between the presence of OSA and a shorter telomeric length.23–25 However, Kim et al., in a study investigating the relationship between LTL and OSA in children, demonstrated that children with OSA had a higher LTL when compared with control children. 26 Similarly, Polonis et al. found an association between longer telomeres and OSA, challenging the hypothesis that telomere shortening is a unidirectional process related to age/disease. 27 Later, a meta-analysis has been conducted and concluded that there is an association between the presence of OSA and a shorter telomeric length. 6 To date, the only study that evaluated the relationship between OSA and telomeric length in a longitudinal way used the intraoral device as a treatment intervention. It was observed that compared with control subjects, individuals with OSA at the beginning of the study had a shorter telomeric length. After 3 months of intervention, OSA participants designated as treatment responders increased their median telomeric length (increased from 0.556 [0.393–0.748] to 0.708 [0.5330.893]). 28
We found a statistically significant effect of treatment under LTL, which the SHAM group showed a more expressive reduction than the group CPAP. To date, there is no evidence in the literature to show the effectiveness of CPAP treatment in relation to telomere length, with only cross-sectional studies showing the association of OSA and shorter telomere length. Thus, the conduct of this controlled clinical study allowed us to assess the causality of this association with an appropriate methodology.
The proposed mechanism by which CPAP could be related to the attenuation of telomere shortening caused by OSA relies on its effect on inflammation decrease. One of the mechanisms associated with a higher rate of telomeric attrition is inflammation. Chronic systemic inflammation increases leukocyte turnover. This event leads to the activation of hematopoietic stem cells, increasing cell replication and consequently shortening telomeres. In addition, the proinflammatory cytokine TNF-a may promote telomere shortening due to its role in regulating telomerase. 29 We measured inflammatory and oxidative-stress markers (IL-6, ADMA, and 8-oxo-dG) and found no significant effects of treatment or time. Although there was no overall treatment effect on TNF-α, changes in TNF-α (delta TNF- α) were significantly correlated with changes in leukocyte telomere length (delta LTL). After stratifying by intervention, the correlation disappeared in the CPAP group but strengthened as a negative correlation in the SHAM group. These findings should be interpreted cautiously with respect to our inflammatory-related hypothesis.
This study has some limitations worth acknowledging. We highlight that our sample consisted solely of middle-aged men with BMI <35 kg/m2, moderate-to-severe OSA, and relatively mild sleepiness, recruited from a single sleep center, limiting generalizability to women, more obese patients, milder OSA, or lower CPAP adherence, which represents a significant portion of individuals with OSA. Second, we had some issues due to the COVID-19 pandemic: the PSG after the intervention was highly impacted. In the CPAP group, only 11 individuals performed the PSG, and this procedure was not performed with the sham-CPAP group because PSG with CPAP was interrupted in order to ensure the safety of the participants, considering the potential formation of aerosols in this type of test. Finally, baseline metabolic and inflammatory marker differences despite randomization could influence LTL trajectories. In this sense, a replication analysis is of great importance. Future studies should use larger, more diverse populations, ensure complete postintervention PSG for all study arms, and extending follow-up beyond 6 months would clarify long-term CPAP effects on telomere biology.
We can conclude that CPAP, when compared with the sham-CPAP, was effective in normalizing the polysomnographic parameters and the complaints normally reported by individuals with OSA. Regarding the main outcome of the study, we observed an association of treatment with CPAP on the stability of the LTL, corroborating the initial hypothesis of the study.
Authors’ Contributions
P.F.T. and S.T. designed the study protocol. P.F.T., V.A., L.B., and S.T. coordinated and managed the study. P.F.T. and S.M.A.S. conducted the trial and performed the data analysis. P.F.T., V.A., S.M.A.S., L.B., and S.T. interpreted the results and drafted, critically revised, and approved the final manuscript. All authors read and approved the final version of the manuscript and agree to be accountable for all aspects of the work.
Footnotes
Funding Information
This work was supported by Associação Fundo de Incentivo à Pesquisa (AFIP), Conselho Nacional de Desenvolvimento Científico e Tecnológico (CNPq; fellowship to VDA and ST), Coordenação de Aperfeiçoamento de Pessoal de Nível Superior (CAPES), and Fundação de Amparo à Pesquisa do Estado de São Paulo (FAPESP, 2018/00955-4, scholarship to PFT).
Supplemental Material
References
Supplementary Material
Please find the following supplemental material available below.
For Open Access articles published under a Creative Commons License, all supplemental material carries the same license as the article it is associated with.
For non-Open Access articles published, all supplemental material carries a non-exclusive license, and permission requests for re-use of supplemental material or any part of supplemental material shall be sent directly to the copyright owner as specified in the copyright notice associated with the article.