



Abstract
A review of 37 studies that included both objective and subjective measures of situation awareness (SA) was conducted. Objective and subjective measures of SA were found to diverge across a wide range of measurement techniques. Reasons for these differences include a lack of meta-awareness about one’s own SA, poor SA/confidence calibration, and confounds with workload among some measures. A model that shows how objective and subjective SA combine to affect performance is presented.
Introduction
Since its original inception as a field of scientific study, the ability to measure situation awareness (SA) has played a prominent role in the field, allowing it to be operationalized to support research on the effects of interface designs, automation approaches, training interventions, and technology trade studies, as well as to better understand the construct itself. Although some measurement approaches have attempted to infer SA from observable processes (such as communications or visual eye scanning), or from actions taken, the most frequently used approaches have focused on directly measuring SA through either objective or subjective techniques (Endsley & Garland, 2000).
Objective SA Measures
The Situation Awareness Global Assessment Technique (SAGAT) is the most frequently used and heavily validated objective measure of SA (Endsley, 1995a, 2000). SAGAT assesses SA based on a battery of relevant SA queries provided during periodic freezes in task simulations while the simulation displays are blanked. Queries can be provided verbally, via pencil and paper, or on a computer or tablet. SAGAT queries are designed to assess how well people understand the ongoing situation, based on their SA requirements as determined from the results of an SA requirements’ analysis, such as a Goal-Directed Task Analysis (Endsley, 1993; Endsley & Jones, 2012). SAGAT includes queries across a wide range of operator SA requirements, including Level 1 (perception of data), Level 2 (comprehension of meaning), and Level 3 (projection of the near future). This includes a consideration of system functioning and status, as well as relevant features of the external environment and team as appropriate. The answers to the queries are then compared with ground truth, as collected from simulation computers or from subject matter experts with perfect knowledge of the situation, to provide an objective assessment of SA accuracy. SAGAT metrics are usually scored as percent correct on each query or are sometimes combined into SA Level 1, SA Level 2, and SA Level 3 scores, creating a diagnostic assessment of the SA of study participants under different experimental conditions. Other scoring variants of SAGAT include the following:
Situation Awareness Control Room Inventory (SACRI), which computes a d’ sensitivity and bias score based on signal detection theory (SDT; Hogg, Follesø, Strand-Volden, & Torralba, 1995);
Quantitative Assessment of Situation Awareness (QUASA), which poses probes in the form of true/false statements and adds an assessment of confidence in each answer (Edgar, Edgar, & Curry, 2003; McGuinness, 2004);
Situation Awareness Verification and Analysis Tool (SAVANT), which provides a partial display to ask questions about missing information and includes an assessment of time to answer each question along with accuracy (Willems & Heiney, 2001); and
SALSA (Measuring Situation Awareness of Area Controllers within the Context of Automation), which attempts to weight each query type in computing an overall score (Hauss & Eyferth, 2003).
Real-time probes and the Situation Present Assessment Method (SPAM) provide SA probes one at a time during the performance of a task with displays in view and measure both time to respond and accuracy of responses (Durso et al., 1998). In addition to these real-time SA probes, the SPAM technique also provides a ready prompt prior to the probe that allows participants to defer answering until they are ready. SPAM probes are designed to assess participants’ knowledge of past, present, and future. Overall response time and response accuracy are provided as indices of SA across experimental conditions.
Subjective SA Measures
Subjective SA ratings may be obtained from operators on simple Likert-type scales or may use a scale developed specifically to assess a person’s assessment of their SA. The Situation Awareness Rating Technique (SART) is one of the oldest and most used subjective measures (Selcon & Taylor, 1990). It combines a subjective assessment of three factors believed to be relevant to SA: operator understanding (U), supply (S), and demand (D) of attentional resources. Other, newer subjective metrics for self-rating of SA include the following:
Crew Awareness Rating Scale (CARS; McGuinness & Foy, 2000) or the related Mission Awareness Rating Scale (MARS; Matthews & Beal, 2002), which create subjective ratings for each of the three levels of SA as well as an overall SA rating;
Situation Awareness Subjective Workload Dominance (SA-SWORD; Vidulich, 1989), which uses forced rankings of the SA provided by comparative system designs; and
Low-Event Task Subjective Situation Awareness (LETSSA; Rose, Bearman, & Dorrian, 2018), which asks operators to indicate the degree to which they agree with statements that describe behaviors associated with SA in the domain.
In addition, some techniques have sought to have outside observers rate operator SA, including the following:
Situation Awareness Rating System (SARS; Bell & Lyon, 2000) and
Situation Awareness Behavioral Rating System (SABARS; Strater, Endsley, Pleban, & Matthews, 2001), which provides a set of behaviors associated with good SA that observers can use in making their ratings.
Confidence in SA
Related to the measurement of SA, there has also been a growing body of work examining how a person’s confidence in their own SA (i.e., meta-awareness) may be related to their performance. Endsley, Selcon, Hardiman, and Croft (1998) showed that subjective SA is highly related to a person’s level of confidence in their understanding of the situation, as well as subjective performance ratings. Other researchers have discussed the importance of meta-awareness or confidence in SA as an independent contributor to performance (Endsley & Jones, 1997; Lee, 1999; Rousseau, Tremblay, Banbury, Breton, & Guitouni, 2010; Sethumadhavan, 2011). This view asserts that subjective SA and SA confidence ratings are dependent on a person’s insights into their ability to monitor and understand key information in a situation. At least one measure of SA, QUASA, has attempted to combine both an objective assessment of SA (via SAGAT like probes), along with a subjective rating of how confident the person is in their answers (Edgar, Edgar, & Curry, 2003; McGuinness, 2004). Related to the issue of meta-awareness, the appropriate calibration of a person’s confidence level (e.g., degree of underconfidence or overconfidence) has also received attention (Lichacz, 2008, 2009; Sulistyawati, Wickens, & Chui, 2009, 2011).
Comparison of Techniques
Objective SA measures, such as SAGAT, have been shown to have good construct and predictive validity, as well as reliability and sensitivity (Endsley, 1990b, 1995a, 2000); however, they also require more work to implement than do subjective metrics. A detailed cognitive task analysis is needed for the domain and user role to be assessed to determine the appropriate queries to provide during the simulation freezes. The answers to each query must be scored based on ground truth data collected from the simulation computer or from a subject matter expert with full knowledge of scenario information. Although SAGAT and SPAM have occasionally been used in real-world environments and exercises, they are primarily employed in simulations and microworld studies.
SAGAT provides an objective, unbiased assessment of SA by providing the queries at random times across a scenario. SA queries are provided during both high workload and low workload periods. By assessing operator SA at different points during the scenario, SAGAT avoids the problem of relying on memory of events after the trial (Nisbett & Wilson, 1977). As SAGAT includes queries across the full spectrum of an individual’s SA requirements, this approach also minimizes the possible biasing of attention, as people cannot prepare for the queries in advance (Endsley, 1995a).
A number of researchers have criticized SAGAT claiming that the freezes to collect data are intrusive and that it relies too much on working memory (Chiappe, Rorie, Moran, & Vu, 2013; Durso et al., 1998; Salmon, Stanton, & Young, 2011; Sarter & Woods, 1991). A recent meta-analysis of 243 studies that utilized SAGAT showed these concerns to be unwarranted, however. The meta-analysis found that SAGAT was predictive of performance in 90% of the studies that used it (mean Pearson’s r = .459) and was sensitive to study manipulations (including display design, training, and automation concepts) in 94% of the studies in which it was employed (Endsley, in press). Furthermore, SAGAT was shown to have no intrusiveness on primary task performance in all 11 studies that evaluated its potential intrusiveness.
In this meta-analysis, SAGAT was also found not to be highly memory dependent; people had ready access for reporting on their perceptions of the situation when using the SAGAT methodology in realistic domain task simulations (Endsley, in press). No relationship between SAGAT and working memory was shown in at least six studies, particularly for experienced subjects (Endsley, 1990a; Endsley & Bolstad, 1994; Gonzalez & Wimisberg, 2007; Gutzwiller & Clegg, 2013; Jipp & Ackerman, 2016; Sulistyawati et al., 2011). Although two studies do show a correlation between SAGAT and a complex span memory measure (Cak, Say, & Misirlisoy, 2019; Durso, Bleckley, & Dattel, 2006), other research shows that complex span measures more closely reflect a persons’ attentional control and retrieval abilities (Shipstead, Lindsey, Marshall, & Engle, 2014), which are known to be relevant to SA. For experienced participants, collection of SAGAT data is not working memory constrained when the information is collected immediately following a freeze, for at least 2 to 3 min afterward (Endsley, 1995a). Although inexperienced participants may experience more reliance on working memory for their SA, the meta-analysis also demonstrated that there was not any lowered sensitivity associated with SAGAT for inexperienced participants compared with experienced participants (Endsley, in press).
Although also highly predictive of performance (mean Pearson’s r = .411), the meta-analysis found that SPAM had lower sensitivity to study manipulations compared with SAGAT (64% vs 94%; Endsley, in press). Concerns have also been raised about the intrusiveness of real-time probes and SPAM, in that they require people to multi-task to answer SA probes while simultaneously performing operational tasks, which could negatively affect task performance (Endsley, 1995a; Jones & Endsley, 2000a; R. S. Pierce, 2012). The meta-analysis found that 40% of the studies that used SPAM or real-time probes reported a negative effect on operator performance or workload, even though SPAM allows operators to defer answering questions (Endsley, in press). The ability to wait to answer probes until the participant is ready was also found to create a problem, systematically biasing SPAM results toward lower workload periods (Cunningham et al., 2015; Loft et al., 2016; Trapsilawati, Wickens, Qu, & Chen, 2016). In addition, problems with speed-accuracy tradeoffs were found (Alexander & Wickens, 2004, 2005; Jones & Endsley, 2004; Morgan, Chiappe, Kraut, Strybel, & Vu, 2012; Taber, McCabe, Klein, & Pelot, 2013), showing that the ability to look at displays while answering questions via SPAM fails to capture SA as an ongoing understanding of the world, but rather measures people’s ability to look up information.
Subjective SA measurement techniques enjoy the advantage of being easy to apply, and most can be readily adapted across different domains without modification. They can be used in both simulation-based studies and exercises as well as real-world scenarios. Subjective measures of SA have been criticized, however, as more reflective of subjective assessments of performance (Endsley, 1995a). In addition, people’s awareness of their own SA may be limited: people often do not know what they do not know (Endsley, 1995a).
The question to be addressed by this analysis is how do objective and subjective measures of SA relate to each other? Questions have arisen as to whether they measure the same thing, and if not, how do these different classes of SA measures contribute to performance? To answer these questions, a literature review and meta-analysis of studies that included both objective and subjective measures of SA were conducted.
Method
A literature search was conducted on Google Scholar, Scopus, and Science Direct with the key words situation awareness, SAGAT, SPAM, or one of their variants (real-time probes, SACRI, QUASA, SAVANT, and SALSA). Papers that collected experimental data with one of these techniques, with sufficient data reported (including experimental environment, domain area, type of participants, number of participants, and statistical findings of the study), were first collected. Duplicate studies were eliminated where they could be identified. From within this group, papers that also included a concurrent subjective measure of SA (SART, CARS, MARS, SABARS, SA-SWORD, LETSSA, SA rating, or SA confidence level) were included in this review. Details of each study along with correlations between objective and subjective measures of SA, as reported by the study authors, were recorded, along with the significance of those correlations. (Note: reported correlations generally included variance due to both study conditions and participants, which were not separable in the reported statistics.)
A meta-analysis was then conducted to assess the mean correlation between each pairing of objective measure of SA and subjective measure of SA where correlation data were present for two or more studies. The degree of strength of the correlations between each objective–subjective SA measure pairing across studies was calculated by converting Pearson’s r in each study to Fisher’s Z. The mean Pearson’s r and confidence intervals were then calculated providing an assessment of mean correlation strength between objective and subjective measures of SA.
Results and Discussion
A total of 243 studies were found that included data collection using an objective measure of SA (SAGAT, SPAM, or a variant). Of these, 37 studies were found that also included at least one subjective measure of SA. Results are presented for each class of subjective measures.
SART
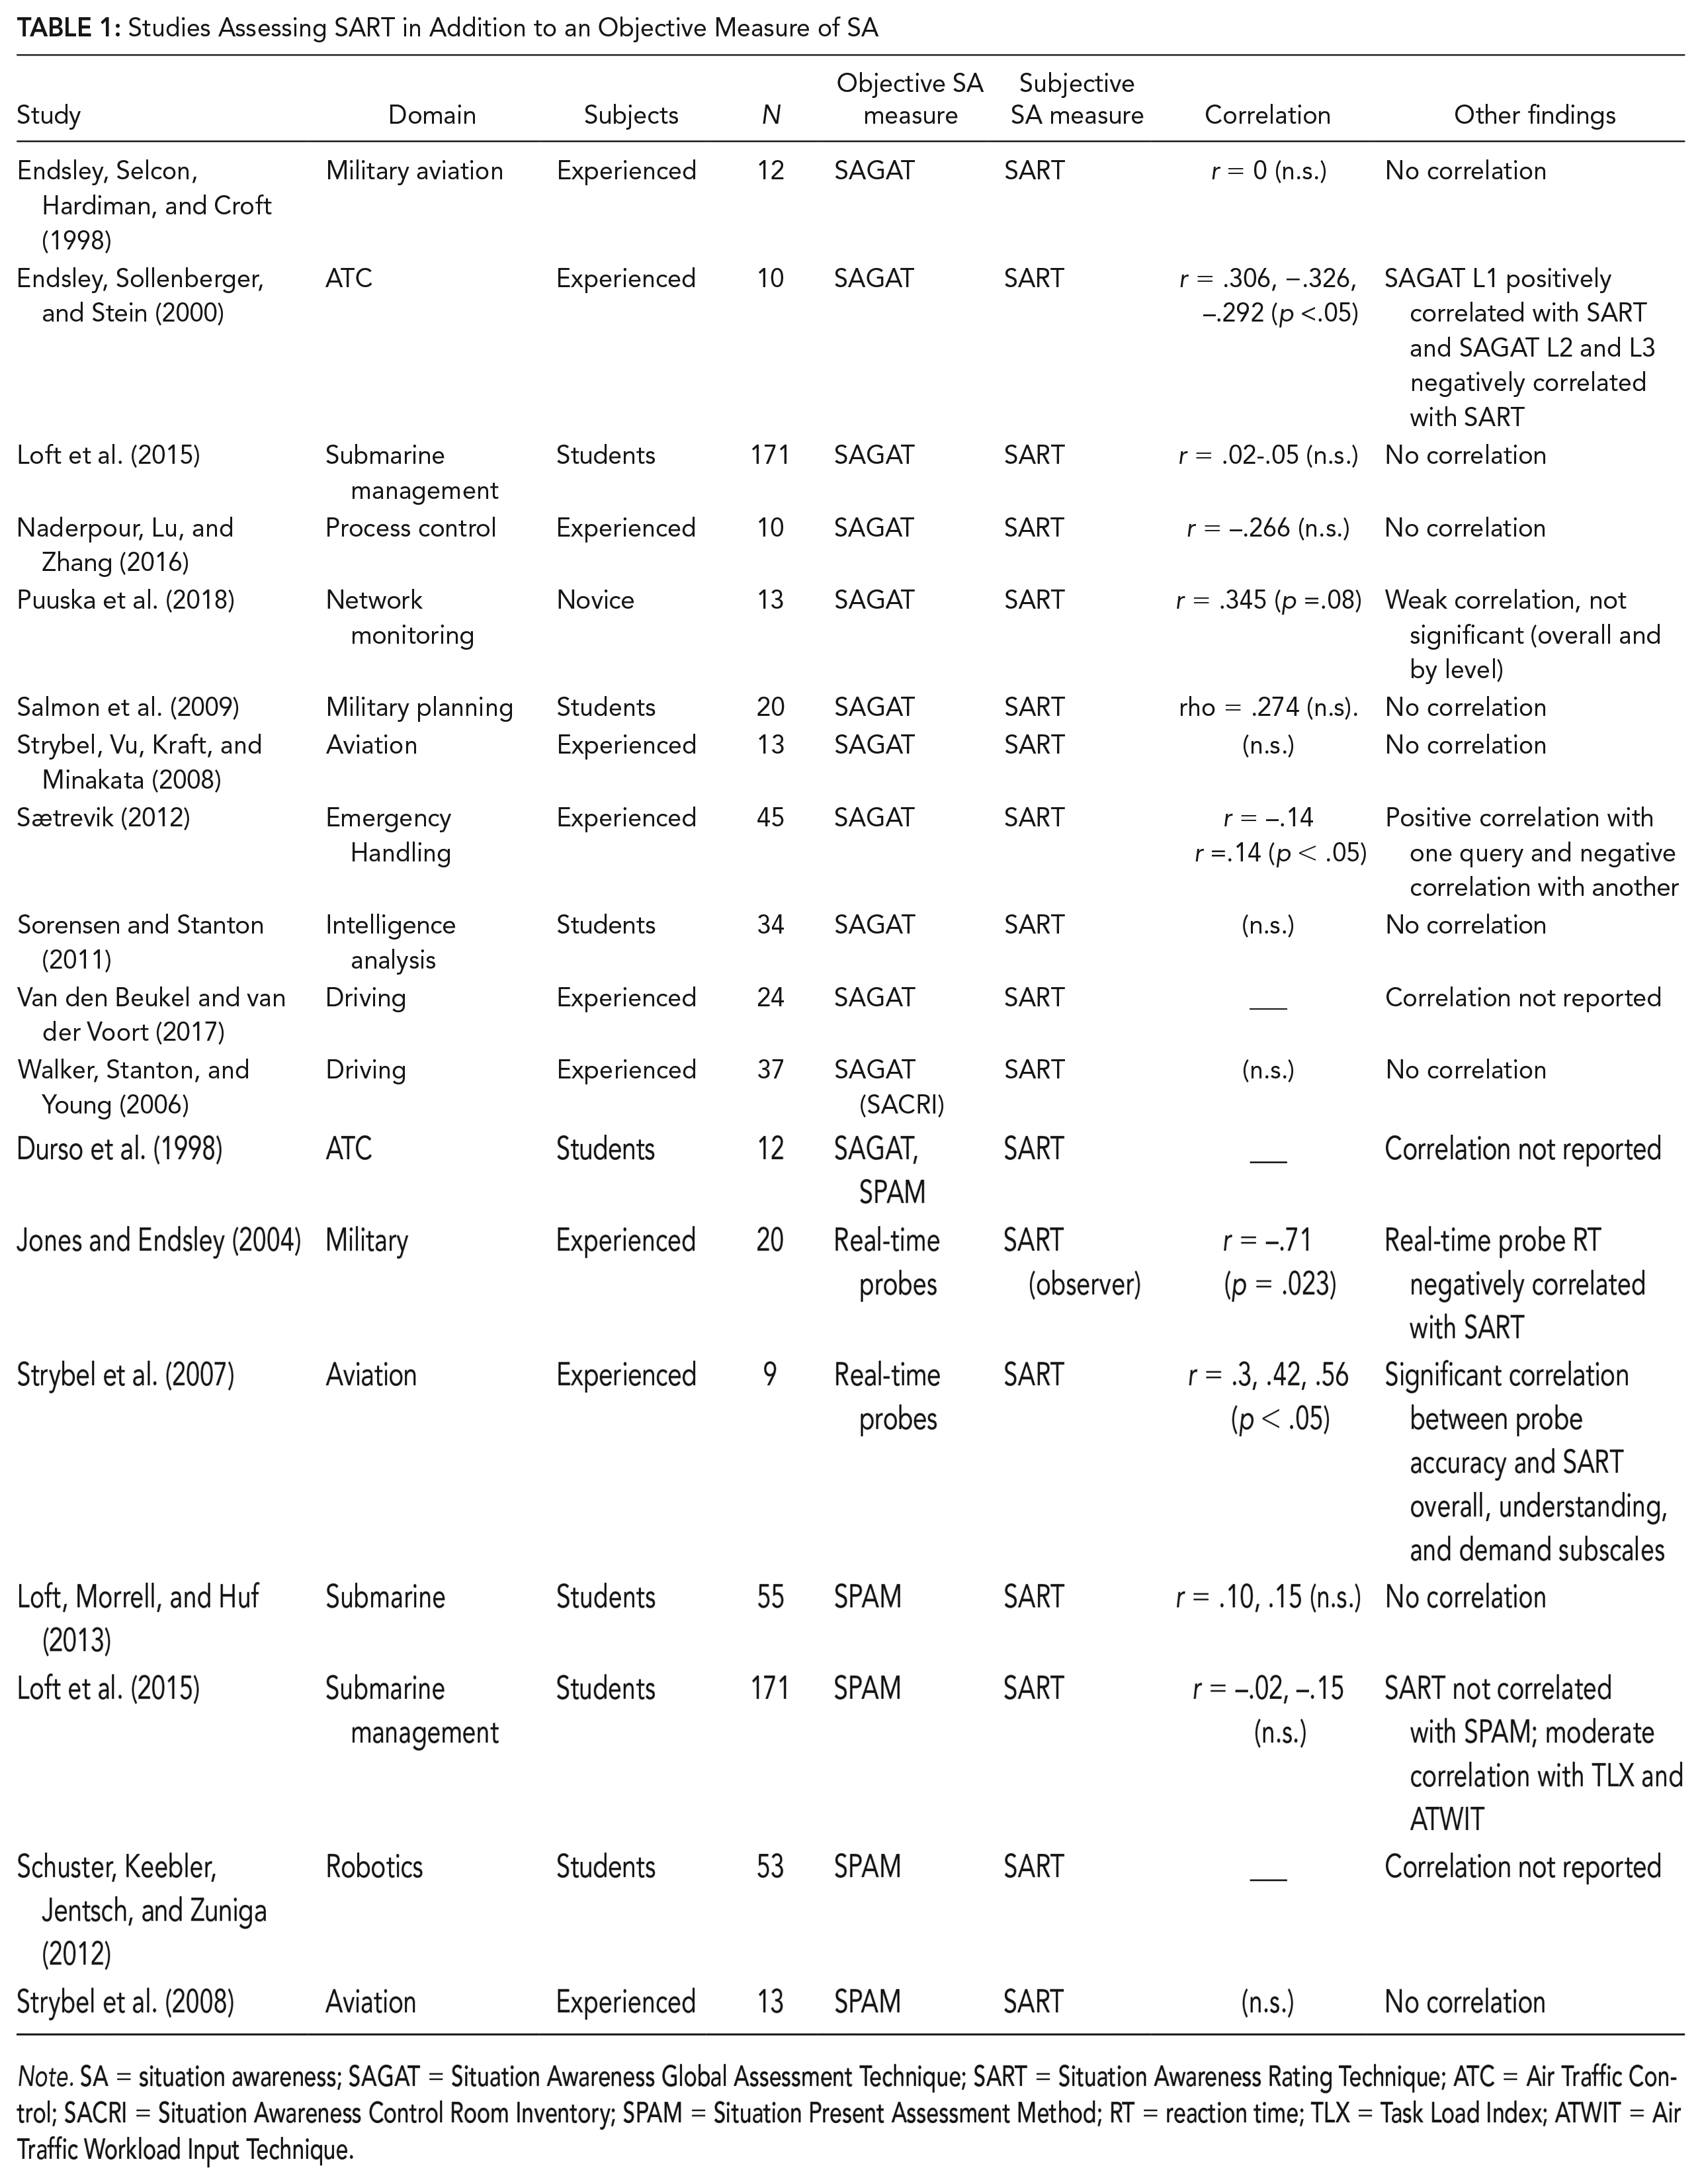
Papers that included SART as the subjective measure of SA are shown in Table 1. Of the 18 studies involving SART, 12 also measured SA objectively via SAGAT, two utilized real-time probes, and five utilized SPAM (one study included both SAGAT and SPAM).
Studies Assessing SART in Addition to an Objective Measure of SA
Note. SA = situation awareness; SAGAT = Situation Awareness Global Assessment Technique; SART = Situation Awareness Rating Technique; ATC = Air Traffic Control; SACRI = Situation Awareness Control Room Inventory; SPAM = Situation Present Assessment Method; RT = reaction time; TLX = Task Load Index; ATWIT = Air Traffic Workload Input Technique.
Of the 12 studies including both SART and SAGAT, two did not report on correlations between the two measures (Durso et al., 1998; Van den Beukel & van der Voort, 2017). One study reported a moderate positive correlation between Level 1 SA and SART and a negative correlation between Level 2 and Level 3 SA and SART (Endsley, Sollenberger, & Stein, 2000). Another study also showed mixed results, with one query positively correlated with SART and another negatively correlated (Sætrevik, 2012). The remaining eight studies found no significant correlation between these two measures (Endsley et al., 1998; Loft et al., 2015; Naderpour, Lu, & Zhang, 2016; Puuska et al., 2018; Salmon et al., 2009; Sorensen & Stanton, 2011; Strybel, Vu, Kraft, & Minakata, 2008; Walker, Stanton, & Young, 2006). Based on the six studies reporting correlation values, the mean correlation between SART and SAGAT was calculated as Pearson’s r = .094, with a 95% confidence level between .013 and .174. This shows a very low, generally non-significant, relationship between SART and SAGAT.
Two studies compared real-time probes with SART. SART scores were negatively correlated with real-time probe reaction time (Pearson’s r = −.71; Jones & Endsley, 2004), showing faster responses when SA was rated higher. SART was positively correlated with real-time probe accuracy for the SART combined score (Pearson’s r = .30) and for the understanding (Pearson’s r = .42) and demand on resource component sub-scores (Pearson’s r = .55; Strybel et al., 2007). In that real-time probes constitute a secondary task, it is possible that it is tapping into workload, which SART also assesses through its supply and demand components.
Of the five studies that included both SPAM and SART, two did not directly compare these measures (Durso et al., 1998; Schuster, Keebler, Jentsch, & Zuniga, 2012), and the remaining three reported no significant correlation between the two measures (Loft et al., 2015; Loft, Morrell, & Huf, 2013; Strybel et al., 2008). Based on the two studies that provided Pearson’s r correlations, the mean correlation between SART and SPAM was calculated as Pearson’s r = .02, with a 95% confidence level between .008 and .032. This shows a very low, generally non-significant, relationship between SART and SPAM.
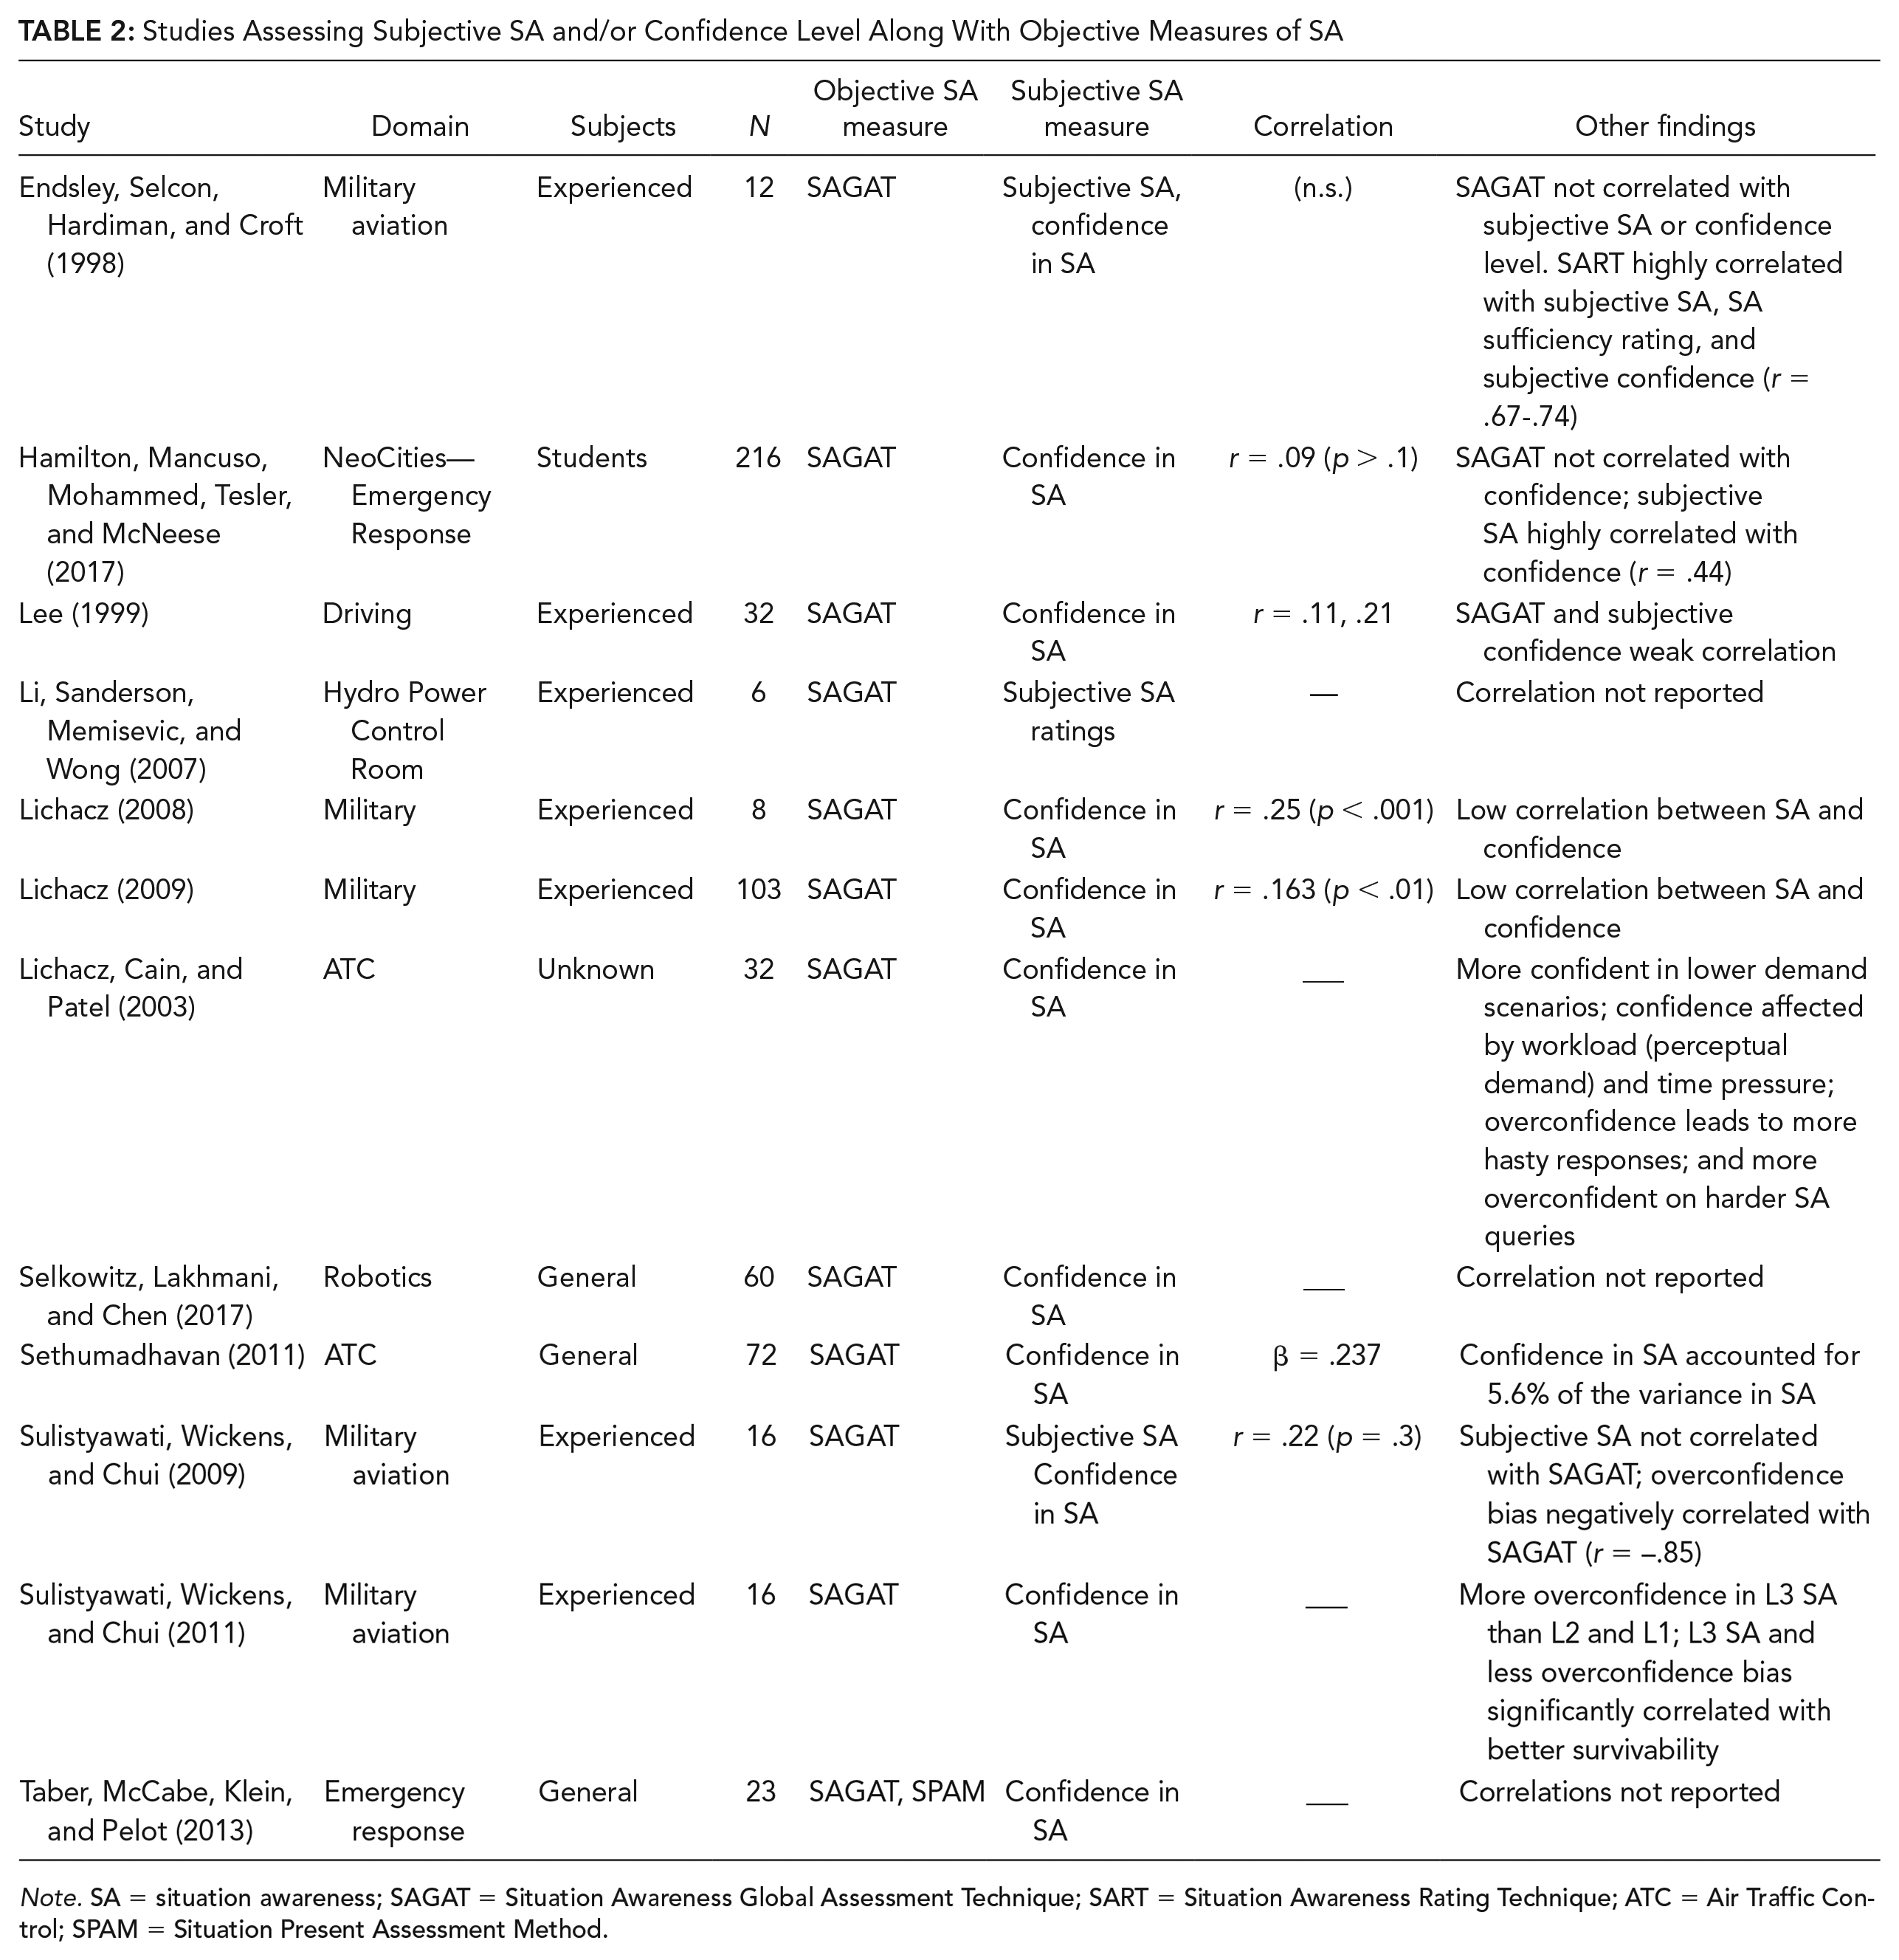
Confidence in SA and Subjective SA
Other studies examined subjective SA on a simple rating scale and/or a person’s confidence in their own SA (Table 2). Subjective SA was shown to be highly correlated with confidence in SA in two studies (Endsley et al., 1998; Hamilton, Mancuso, Mohammed, Tesler, & McNeese, 2017).
Studies Assessing Subjective SA and/or Confidence Level Along With Objective Measures of SA
Note. SA = situation awareness; SAGAT = Situation Awareness Global Assessment Technique; SART = Situation Awareness Rating Technique; ATC = Air Traffic Control; SPAM = Situation Present Assessment Method.
Of the three studies employing simple SA rating scales, two studies found no correlation between SAGAT and subjective SA ratings (Endsley et al., 1998; Sulistyawati et al., 2009), and one did not report correlations (Li, Sanderson, Memisevic, & Wong, 2007).
In examining the nine studies that measured both SAGAT and subjective confidence in SA, five studies did not report correlation assessments (Lichacz, Cain, & Patel, 2003; Selkowitz, Lakhmani, & Chen, 2017; Sulistyawati et al., 2009, 2011; Taber et al., 2013). Two studies reported no significant correlation between subjective confidence level and SAGAT (Endsley et al., 1998; Hamilton et al., 2017), and three studies reported a weak correlation (Lee, 1999; Lichacz, 2008, 2009). For the five studies reporting on correlation values between SAGAT and confidence, the mean Pearson’s r = .177, with a 95% confidence interval between .119 and .236, showing a very small correlation.
Other Subjective Metrics
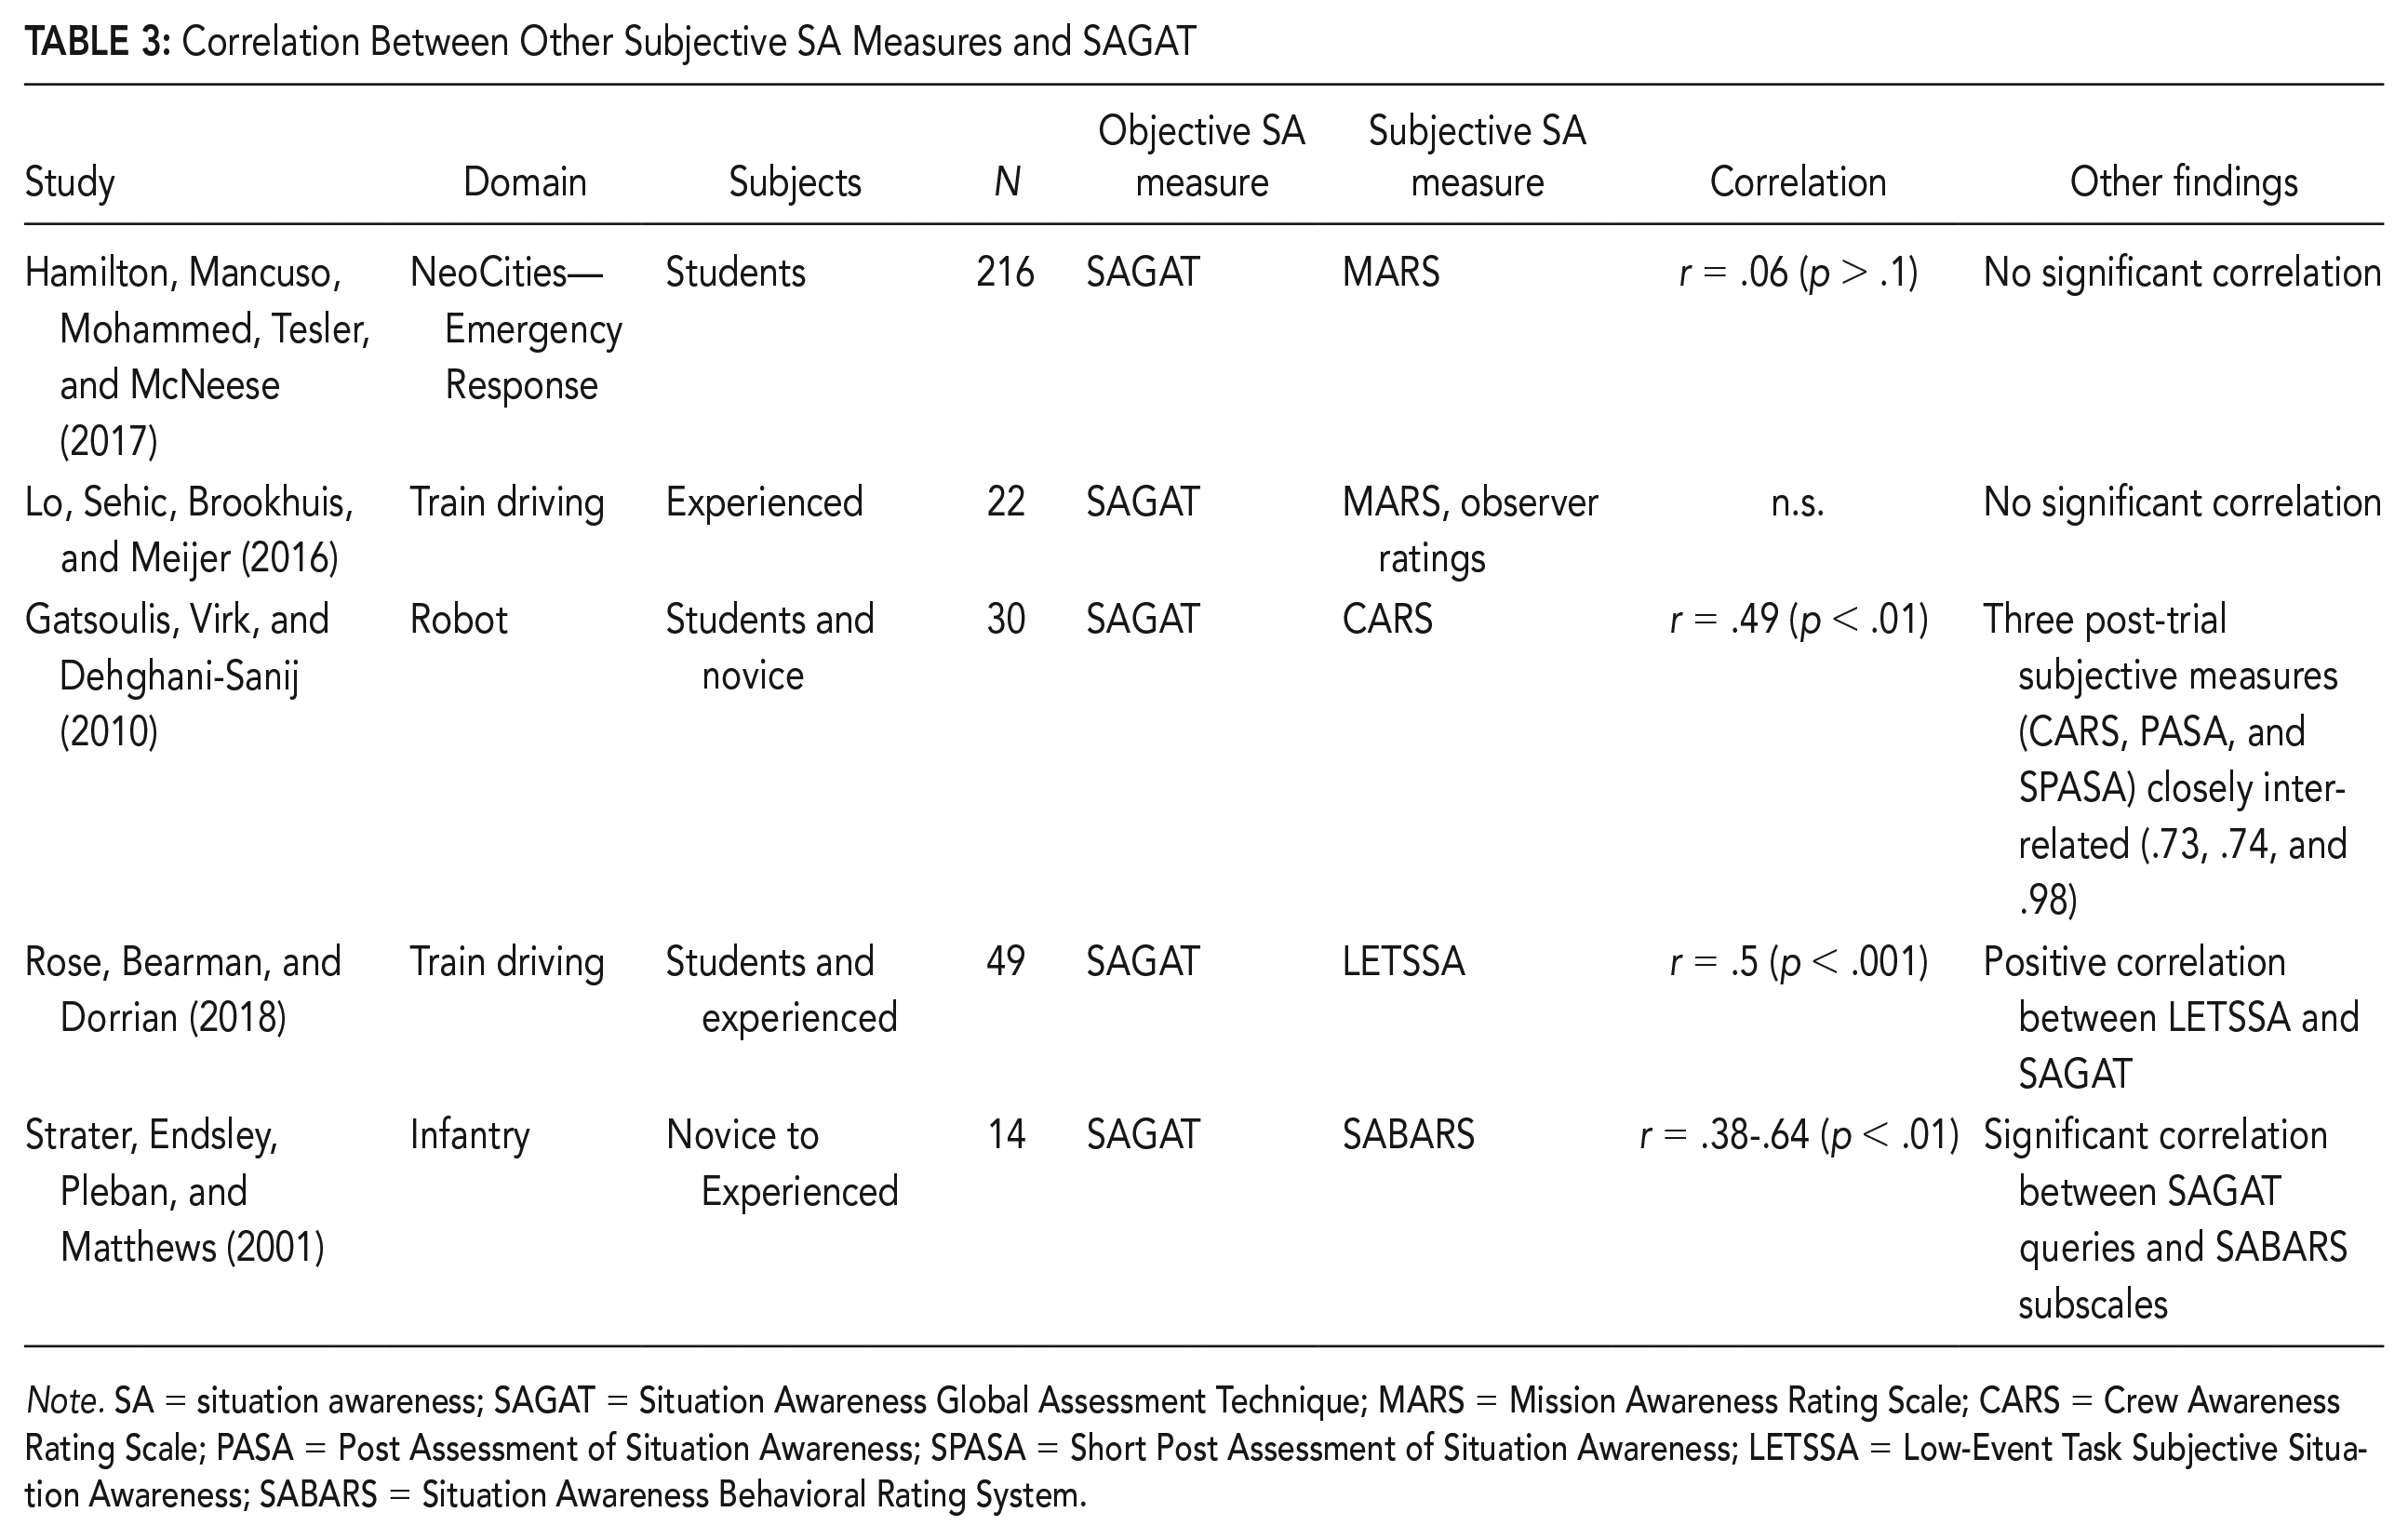
In addition to SART, several other subjective SA rating scales have been developed more recently that have been compared with objective measures of SA (Table 3). MARS was found not to be significantly correlated with SAGAT in two studies (Hamilton et al., 2017; Lo, Sehic, Brookhuis, & Meijer, 2016). Other studies found more positive correlations between objective and subjective measures of SA. Gatsoulis, Virk, and Dehghani-Sanij (2010) found a positive correlation between SAGAT and CARS in a robotics simulation, and Rose et al. (2018) found a positive correlation between SAGAT and LETSSA in a train driving simulation. Strater et al. (2001) also found a positive correlation between SAGAT and SABARS, in which observers rate the presence of behaviors associated with good SA.
Correlation Between Other Subjective SA Measures and SAGAT
Note. SA = situation awareness; SAGAT = Situation Awareness Global Assessment Technique; MARS = Mission Awareness Rating Scale; CARS = Crew Awareness Rating Scale; PASA = Post Assessment of Situation Awareness; SPASA = Short Post Assessment of Situation Awareness; LETSSA = Low-Event Task Subjective Situation Awareness; SABARS = Situation Awareness Behavioral Rating System.
Combined Objective/Subjective Measures
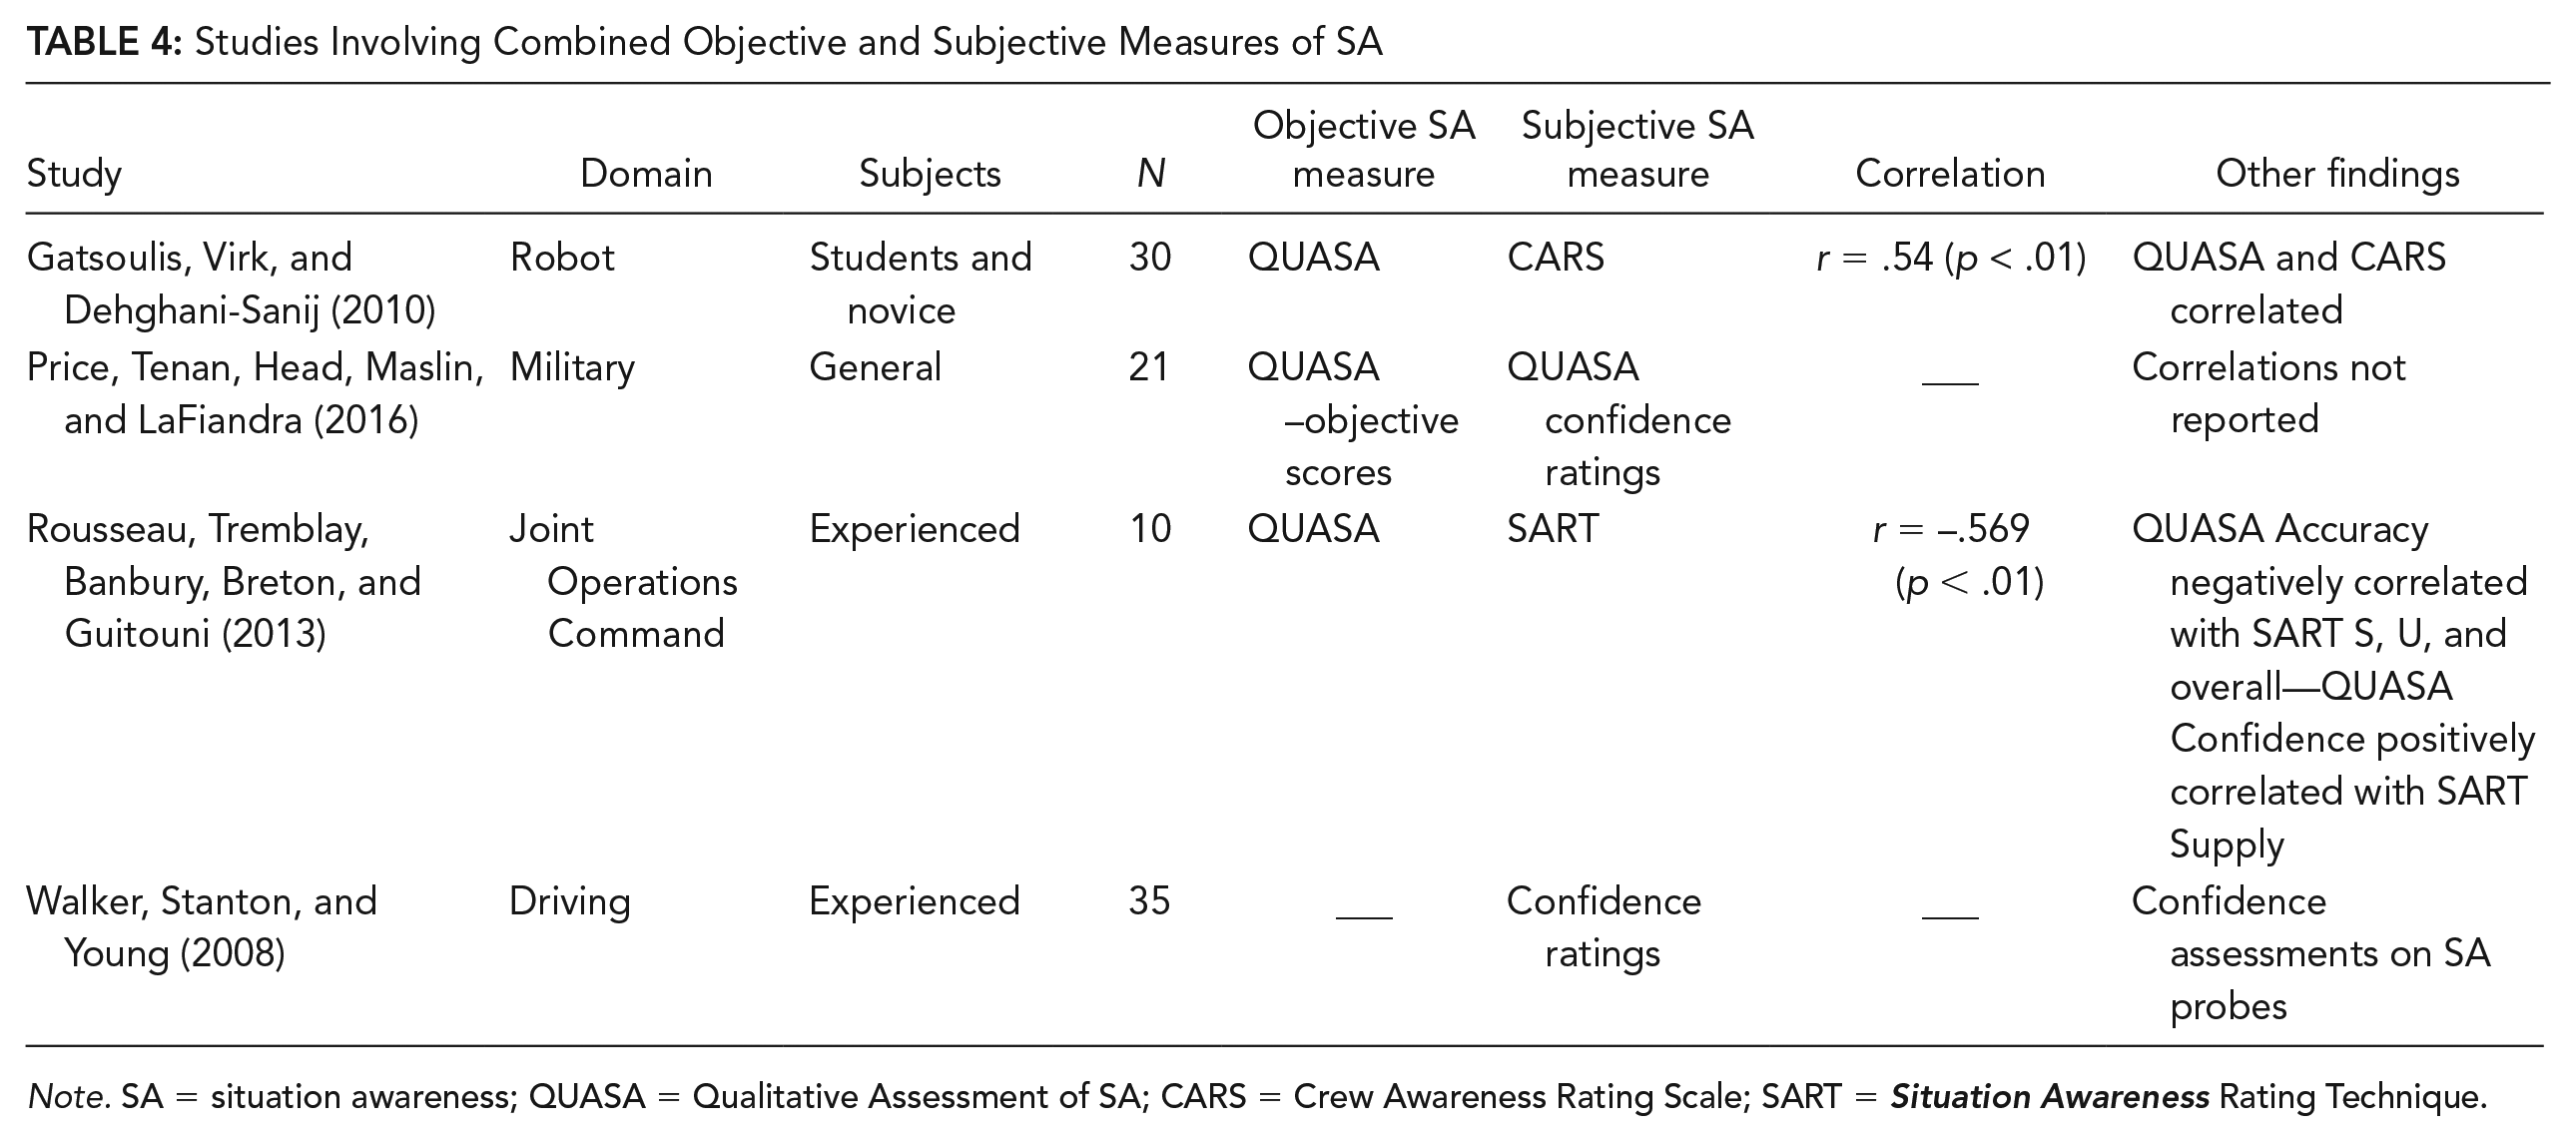
Table 4 shows four studies that included measures of SA that combine both subjective and objective techniques. Although many researchers have elected to collect separate measures of SA, QUASA combines both measurement of objective SA queries (similar to SAGAT) and a rating of confidence level on each query. Not surprisingly, Gatsoulis et al. (2010) found a 90% correlation between QUASA and SAGAT and a positive correlation between QUASA and CARS (r = .54). Although they found no relationship between SA accuracy and SA confidence as measured by QUASA, Rousseau et al. (2010) found that QUASA accuracy scores were negatively correlated with SART (r = −.57), meaning that more accurate objective SA was associated with less accurate subjective SA (which is the opposite of what would be expected), but that QUASA confidence ratings were positively correlated with SART understanding scores. Using a different approach, Walker, Stanton, and Young (2008) attempted to have participants rate their confidence in the presence of key environmental features during SAGAT like pauses; however, their approach combines these both subjective and objective assessments in such a way as to obscure their unique contributions.
Studies Involving Combined Objective and Subjective Measures of SA
Note. SA = situation awareness; QUASA = Quantitative Assessment of SA; CARS = Crew Awareness Rating Scale; SART = Situation Awareness Rating Technique.
Discussion
As a whole, these studies show a large divergence between subjective and objective measurements of SA. In particular, SART appears to not measure the same thing as objective measures of SA (either SAGAT or SPAM). This may be due to the poor validity of SART for assessing SA in that it combines measures of workload (supply and demand of attention) within the measure (Endsley et al., 1998). A number of studies have demonstrated a significant correlation between SART and NASA Task Load Index (NASA-TLX; Jones & Endsley, 2004; Loft et al., 2015; R. S. Pierce, Strybel, & Vu, 2008; Selcon, Taylor, & Koritsas, 1991). The fact that QUASA was negatively correlated with SART is difficult to reconcile, unless SART was actually capturing workload.
The meta-analysis also indicates that people’s subjective assessment of the accuracy of their own SA (i.e., their meta-awareness) is likely poor (Endsley, 1995a; Lee, 1999). Subjective SA ratings are more clearly reflective of people’s confidence in their SA. This assessment appears to not be reflective of actual SA, but rather of other to be determined factors.
This analysis also shows that much of the research on the relationship between objective and subjective SA has been largely based on SART or simple SA ratings. It may be that other subjective SA measures (such as CARS, LETSSA, or SABARS) are more able to capture aspects of SA that better align with objective SA. Much more research will be needed to further evaluate this possibility. Given the disassociation of objective and subjective SA, it seems that separating these measures, rather than combining them with QUASA, is warranted.
Calibration of Subjective SA and Confidence Level
Overall, these findings support the contention that in many cases people may have fairly poor calibration in assessing their own SA. The Endsley (1995b) model of SA identifies a person’s confidence level in their SA (represented by uncertainty factors linked to the situation model) as critically important for affecting how people chose to act on that SA. A number of factors affect how confident people are in their SA, associated with perception (Level 1 SA), comprehension (Level 2 SA), and projection (Level 3 SA; Endsley & Jones, 2012).
Confidence in SA Level 1
Confidence in information gathered to form SA has been shown to be important for SA across a wide range of domains. People gage the level of confidence to place on data based on the known reliability of the information (i.e., sensor or test reliability, data source, or provenance), the presence of missing information, the presence of incongruent or conflicting information, the timeliness of the data, and the presence of ambiguous or noisy data (Endsley & Jones, 2012).
Confidence in SA Level 2
People also form an internal level of confidence associated with their combined assessment of what is happening. The degree of fit of the present situation to known classes of situations (categorization mapping) may form a part of this assessment, as well as the ability to integrate data to form comprehension based on mental models of the environment.
Confidence in SA Level 3
Finally, people have differing levels of confidence in what they think will happen in the future. Projecting what will happen in the future is inherently uncertain in most systems and is based on not only confidence in lower level assessments but also the predictiveness of the schema or mental model used to make the projections. Like Level 2 SA, confidence in projections may reflect familiarity with the situation or similar situations, as well as the level of variability in outcome possibilities.
SA confidence calibration
In addition to confidence in SA, this analysis shows that inaccurate calibration of that confidence (under- or overconfidence) is important to performance. A number of studies have examined this calibration issue more directly. Lichacz (2009, 2003) found that SA confidence levels are affected by time pressure and workload, and confidence calibration was affected by perceptual demand, question difficulty, sleepiness, team nationality, and task stage. McGuinness (2004) similarly showed between team confidence bias differences by nationality. Furthermore, Price, Tenan, Head, Maslin, and LaFiandra (2016) demonstrated that stress affects objective SA, but not subjective SA, leading people to be more overconfident in their SA in stressful situations and to take more risks. Sulistyawati et al. (2011) showed that overconfidence bias was higher for Level 3 SA (projections) than for Level 1 or 2 SA, reflecting the greater difficulty associated with predictions. Sulistyawati et al. (2009) showed that more overconfidence bias in one’s SA was strongly associated with lower SA as measured by SAGAT (r = .85, p<.001). People with low SA were more likely to be overconfident than those with high SA. Lichacz (2008) and Rousseau et al. (2010) attribute overconfidence in SA to people’s level of experience with similar, but unrelated tasks (i.e., general overconfidence in the performance of the task itself). (See also work by Einhorn & Hogarth, 1981 and Kruger & Dunning, 1999 on overconfidence.).
More research is needed to better understand the factors that may contribute to the ability of people to correctly calibrate their internal assessments of SA confidence to their actual levels. What are the cues that people use in meta-awareness of SA? For example, are there cues in the performance of a task that may let people know that their SA is inaccurate or incomplete, such as being surprised by events that do not match expectations? Can they use awareness of being overloaded and unable to keep-up, or conversely being aware of fatigue that affects attention to adjust their SA confidence assessments? How is it affected by expertise, and are there personality factors that contribute to overconfidence or underconfidence in SA? Finally, given its contribution to performance, are there ways to train people to be better at assessing how confident they should be in their SA (i.e., meta-awareness)?
Sources of Divergence in Objective and Subjective SA
One potential basis for the divergence between objective and subjective measures of SA rests on the multifactorial nature of SA itself. Although measures like SAGAT and SPAM assess SA across its many different subcomponents (i.e., multiple queries address awareness of many different elements of the environment and different aspects of comprehension and projection), many subjective SA assessments are more unitary in nature. Thus, people could be making an SA rating based on different features of the situation than is tapped into by multifactored objective measures. The fact that some studies reviewed here closely linked subjective confidence ratings to specific objective SA query responses and still found no significant correlation (Lichacz, 2008, 2009; Price et al., 2016; Sulistyawati et al., 2009) makes this factor unlikely as the main source of divergence.
Another potential source of divergence lays in the nature of confidence assessments themselves. The topic of confidence has been examined with respect to decision making for quite some time (C. S. Pierce & Jastrow, 1885). Einhorn and Hogarth (1981) discuss how overconfidence in poor judgments can be maintained in many real-world situations due to limited feedback, and task-related factors including not understanding base rates (paying attention to non-occurrences of events as well as occurrences), variations in selection ratios, and self-fulfilling treatment effects. In addition, Kruger and Dunning (1999) show that some people are particularly poor at being able to assess their own incompetence—with high levels of confidence accompanying very poor performance. These same factors may also very likely contribute to a poor mapping between confidence in SA and SA quality.
Yeung and Summerfield (2012) show evidence that decision-related confidence assessments are based on both accumulated evidence (the quality of information signals and sufficiency of information) and post-decisional error monitoring processes. The research indicates that confidence assessments may be at least partially dependent on different brain structures than those involved in the decisional process (Grimaldi, Lau, & Basso, 2015).
It is unknown how these findings, based on simple decisions associated with presented visual stimuli in laboratory settings, will extrapolate to decisions in far more complex environments, or to the concept of SA. For example, in the more complex scenarios associated with SA research, it may be very unclear to people how much information should be present in a given situation (i.e., unknown unknowns). A person would have no way of knowing that an important report or radio transmission was not received, for example, or of processes going astray that are hidden from view by a complex information display. Additional challenges brought on by anchoring and confirmation biases will also lead to selective information sampling that is unlikely to alert people to mistakes in their SA (Endsley, 2018a; Jones & Endsley, 1996; Nickerson, 1998).
Furthermore, SA relates not just to perception of needed information but also to the ability to integrate that information to find appropriate meaning. The individual who has a poor mental model for determining information priority or significance will generally have little basis for knowing that during the normal course of events. Learning processes may be quite slow, with improvements occurring only gradually over time (Endsley, 2018b). In one compelling experiment, Jones and Endsley (2000b) showed that 65% of the time experienced air traffic controllers failed to notice, or explained away, information that conflicted with a mental model that was initially adopted even when the new information was in significant disagreement. They found ways to explain away conflicting data that disagreed with their existing mental model, either consciously or subconsciously. In that the direction of attention, as well as comprehension and projection, is so highly dependent on an accurate mental model (Endsley, 1995b), this finding does not bode well for people’s ability to detect fallacies in their own SA.
In addition, feedback loops needed for error monitoring may be very poor in many real-world situations. Poor SA may not be followed by poor outcomes in many cases due to the probability distributions of events. For example, pedestrians could successfully cross the street with their eyes closed a number of times either because there was no traffic at the time or because the traffic slowed and avoided the pedestrian (demonstrating the probabilistic link between SA and decision making). Thus, there would not be sufficient information to lead to a correction in the pedestrians’ poor SA. These examples demonstrate that in the real-world, typical meta-cognitive processes associated with assessing confidence in one’s own knowledge may be insufficient for achieving good meta-SA. These many shortcomings likely contribute to the generally poor correspondence between objective SA and confidence found in this review.
The Combined Effect of Objective and Subjective SA
The level of over- or underconfidence in SA can be important for performance in addition to the objective accuracy of a person’s SA. Sulistyawati et al. (2011) found that overconfidence in SA decreased survivability in a military aviation study, with SAGAT scores plus overconfidence bias accounting for 57% of the variance in performance. Hamilton et al. (2017) also found that both objective SA and subjective SA were independently relevant for team performance. These studies support Christ, McKeever, and Huff (1994) and Endsley and Jones (1997) who depict objective SA and SA confidence level as working together to affect decision making and performance (Figure 1).

Relationship between SA and confidence.
If SA is good and confidence in that SA is high, a good outcome is more likely as it will have been possible to make good decisions and plans based on that SA. If, even with good SA, people have a low level of confidence (underconfidence bias), however, they most likely delay, gathering more information or acting protectively, thus reducing their effectiveness.
If someone has poor SA, but realizes that it is poor (i.e., an appropriately calibrated low-confidence level), they will correctly choose not to act and will continue gathering more information to improve SA, thus averting bad outcomes, but not necessarily supporting good ones (i.e., delays may be good or bad). For example, in health care settings physicians may run more tests to collect data before making a diagnosis. In military operations, pilots or soldiers may continue to seek cover or not engage enemy combatants until their SA is high enough (Endsley, 1990b; Sulistyawati et al., 2009). In other cases, however, that option may not be possible (such as in an ambush).
The person who has poor SA but has a high level of confidence (overconfidence bias) is likely to act boldly and incorrectly, and may even draw in others who will be fooled by the misplaced confidence (i.e., the SA black hole; Endsley & Jones, 2012). This overconfidence bias combined with low SA leads to the worst outcomes.
Hamilton et al. (2017) present data that partially support this model. They showed that objective and subjective SA each contribute separately to performance. The combination of high objective SA/high subjective SA scored the best outcomes, followed by similar levels of performance in teams with high objective SA/low subjective SA and low objective SA/high subjective SA. They found the worst performance among teams with both low objective SA and low subjective SA, however. It may be that their task environment (NeoCities emergency management microworld) did not allow the option for acting conservatively to minimize poor outcomes, as this is not realistic in that domain, compared with other domains such as military combat or aviation.
The present analysis clearly presents a strong divergence between objective and subjective measures of SA. Although SART may be more closely measuring workload, simple subjective SA scales appear to be assessing a person’s confidence in their own SA (meta-awareness). This confidence bias independently affects performance in addition to actual SA.
A model such as that depicted in Figure 2 more closely shows how these different classes of measures interact to affect SA. The accuracy of a person’s SA has a direct and positive influence on performance, with a mean Pearson’s r = .46 across 30 papers that provided correlation data (Endsley, in press). In addition, performance will be affected by both a person’s willingness to act and their ability to act. The willingness to act includes a person’s confidence in their SA, as well as other factors such as arousal level and personality characteristics. If a person is unwilling to make a decision or act (because their confidence is low or due to other reasons), the value of that SA is wasted. The willingness to act even when SA is low (e.g., due to misplaced overconfidence or due to system demands), conversely, can lead to negative outcomes.
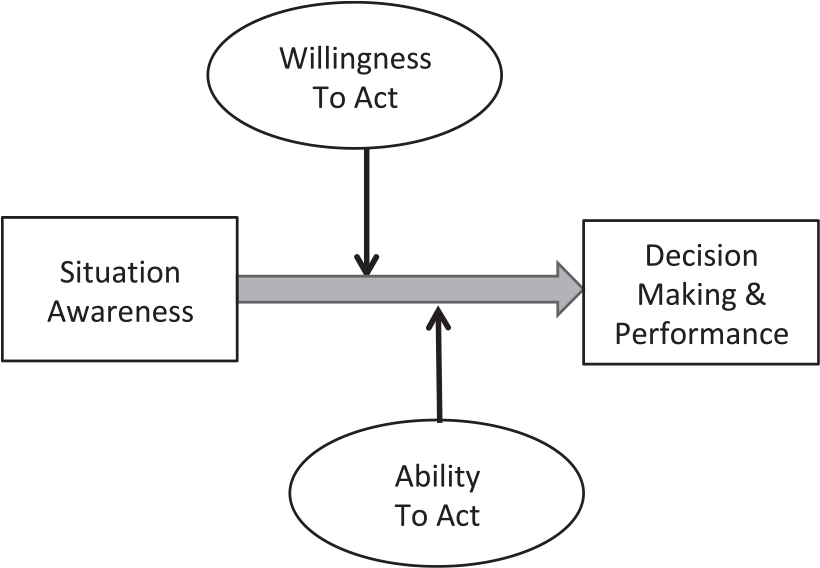
Factors affecting performance outcomes.
The ability to make good decisions and to act on one’s SA is also important. This is known to be affected by another set of factors including workload and stress levels; fatigue; the skills, expertise, and training of the individual to perform well both cognitively and physically; tactics, doctrine, or procedures that affect how people act on their SA; and other system and environmental constraints that can affect performance outcomes by even those with the best SA and training.
From the standpoint of the present discussion, it seems likely that subjective SA (i.e., confidence level) is independently affecting performance through the willingness to act. Although not many papers reviewed provided data on the magnitude of this effect, Sulistyawati et al. (2011) showed at least an additional 10% of the variance in performance, over and above objective SA (46%), could be attributed to overconfidence. Sethumadhavan (2011) show that a person’s confidence in their SA accounted for an additional 5.9% of the variance in performance, in addition to objective SA (23.8%) in an Air Traffic Control (ATC) task. More research is needed to determine how well these findings hold over different domains and situations.
Other measures, such as SART, may be primarily tapping into the ability to act (via its supply of resources and demand on resources subscales) and possibly willingness to act (via its understanding subscale). Given that the effect of workload on performance is non-linear (Yerkes & Dodson, 1908), the contribution of workload and stress to performance outcomes is more complicated, and performance decrements may only be found under low workload (e.g., low arousal and vigilance conditions) or when resources are exceeded (Wickens, 2008).
Methodological Considerations
Fleming and Lau (2014) make the case that simple correlations may be insufficient for understanding the degree of correspondence between accuracy and meta-cognitive processes, due to the presence of response biases (i.e., the general propensity toward over- or underconfidence of the individual). In addition, confidence assessments may be influenced by task difficulty, with people being more underconfident with harder tasks. They argue for analysis of metacognition utilizing SDT and response operating characteristics (ROC) curves to better separate out response bias (the overall over- or underconfidence of the responder) from sensitivity (ability to distinguish between good and poor performance) and efficiency (sensitivity relative to a given level of performance).
A number of studies reviewed here were in line with these recommendations, for example, focusing on overall over- or underconfidence in SA rather than simple correlations (Lichacz, 2008, 2009; Lichacz et al., 2003; Sulistyawati et al., 2009, 2011). Others attempted to separate response bias from sensitivity assessments using d’ and ROC curves (Edgar, Edgar, & Curry, 2003; McGuinness, 2004).
Although these arguments have some mathematical merit, such approaches do risk clouding a fuller understanding of how objective SA and confidence levels operate as independent agents in the decision process, as discussed in Figures 1 and 2. This was illustrated by the analysis of Hamilton et al. (2017), which examined not just the correspondence or lack of correspondence between objective SA and meta-SA but also how performance outcomes were affected by various combinations of the two.
Future research may want to more explicitly break out considerations of individual differences (e.g., overall response bias), from the differential effects of experimental conditions on sensitivity in alignment between objective SA and meta-SA. However, it should not sacrifice a more detailed analysis of the ways in which these two factors interact to affect performance, and the processes that are used to help some people more accurately align them.
Conclusion
As subjective ratings of SA and SART are shown to diverge so substantially from objective SA measures, it is recommended that this class of measures should be discontinued, or renamed as SA confidence and more clearly presented in the research to better reflect the constructs being assessed. Newer subjective measures of SA, such as CARS, LETSSA, and SABARS, need further research to better understand their validity for measuring SA.
Future research on SA would be better served to rely on well-validated objective measures of SA. People’s confidence in their SA, along with how well calibrated that confidence is in comparison with objective SA, may also be assessed to provide a further understanding of performance for research that is interested in this aspect of cognition. Finally, more research is needed to better understand the factors that people rely on when assessing the quality of their own SA and for improving this meta-awareness if possible.
Major Points
Subjective SA metrics show a strong disassociation with objective measures of SA, demonstrating that people have low self-awareness of this construct.
Subjective SA appears to better reflect a person’s confidence in their SA.
SART displays poor construct validity as a measure of SA and is more strongly associated with its workload components.
A model showing the inter-relationship between objective SA and subjective SA in affecting performance outcomes is presented.
Research is needed to better understand the factors used to form SA confidence and to train people to be more accurate in their assessments.
Footnotes
Acknowledgment
I am the developer of SAGAT. I do not receive any royalties or other payments for its use.

Mica R. Endsley is president of SA Technologies and is the former chief scientist of the U.S. Air Force. She received a Ph.D. in Industrial and Systems Engineering from the University of Southern California. She has published extensively on situation awareness, automation, and system design.