
Abstract
How might analytic reasoning in intelligence reports be substantially improved? One conjecture is that this can be achieved through a combination of crowdsourcing and structured analytic techniques (SATs). To explore this conjecture, we developed a new crowdsourcing platform supporting groups in collaborative reasoning and intelligence report drafting using a novel SAT we call “Contending Analyses.” In this paper we present findings from a large study designed to assess whether groups of professional analysts working on the platform produce better-reasoned reports than those analysts produce when using methods and tools normally used in their organizations. Secondary questions were whether professional analysts working on the platform produce better reasoning than the general public working on the platform; and how usable the platform is. Our main finding is a large effect size (Cohen’s d = 1.37) in favor of working on platform. This provides early support for the general conjecture. We discuss limitations of our study, implications for intelligence organizations, and future directions for the work as a whole.
Introduction
Intelligence organizations produce many tens of thousands of intelligence reports every year (Priest & Arkin, 2010). These reports are the main way that intelligence organizations inform decision makers. As such, they are central to the web of intelligence activities intended to promote national security and interests.
Following some well-publicized intelligence failures, there has been considerable interest in improving the quality of intelligence reports (Gentry, 2015). Doing so is challenging, and some authorities doubt significant gains can be made (Lowenthal & Marks, 2015).
A good intelligence report displays rigorous analytic reasoning (ODNI, 2015a). This paper describes a test of a new platform intended to improve analytic reasoning in intelligence reports. The platform was designed to implement a theoretical conjecture as to how analytic reasoning might be substantially improved. We articulate that conjecture, then describe the new platform and our study, and present high-level results. We conclude with general discussion, limitations of the study, some implications for intelligence, and future directions.
Our main finding is that the analytic reasoning produced by teams of analysts working on the new platform was substantially better than the reasoning they produced using methods similar to those they would normally use for such tasks. This provides encouraging initial support for the theoretical conjecture just mentioned and some basis for optimism that significant gains in analytic reasoning performance in intelligence organizations are achievable.
The Conjecture: Combining Crowdsourcing and Structured Analytic Techniques
The Intelligence Advanced Research Projects Activity (IARPA) is responsible for scientific research aimed at improving U.S. intelligence capability. IARPA has instigated many research programs focusing on intelligence analysis. One was Crowdsourcing Evidence, Argumentation, Thinking and Evaluation (CREATE). This ran from 2017 to 2019 with the aim of achieving a “fundamental advance” in analytic reasoning (IARPA, 2016).
The CREATE program was designed around the conjecture that analytic reasoning might be dramatically improved through a combination of crowdsourcing and one or more structured analytic techniques (SATs). As explained later, both crowdsourcing and SATs hold some promise for improving analytic reasoning. The CREATE program’s bold bet was that crowdsourcing might help strengthen certain SATs, and suitable SATs might unleash the power of crowdsourcing for analytic reasoning.
Crowdsourcing
The term “crowdsourcing” is used in many ways (Estellés-Arolas & González-Ladrón-de-Guevara, 2012). For our purposes, crowdsourcing is using a relatively large group of people (a “crowd”) for tasks which might otherwise be performed by an individual or much smaller group.
It is well established that groups or crowds can perform considerably better than individuals on a range of analytic and logical tasks (Burgman, 2016). In general, the raw intelligence of nominal groups is much higher than the average individual IQs of the group’s participants (Vercammen et al., 2019) and groups that interact do even better (Graefe & Armstrong, 2011).
For intelligence work, crowds could have two important advantages. First, they may be able to do more analytic work than individuals or small teams. Analysis and report drafting can be arduous, particularly when the intelligence challenge is large and complex. The larger the group of workers, the more intellectual effort can, potentially, be applied to the task. Second, crowds are more diverse than individuals or smaller groups. Crowd members are likely to have, between them, a wider range of information, more forms of expertise, more divergent perspectives, and more varied thinking styles. Properly exploited, this diversity can improve the group’s collective outputs (Page, 2007).
Crowdsourcing has been successful in many domains (Howe, 2008; Weiss, 2018) and is already used in some ways in the U.S. intelligence community, including the IC Prediction Market and Intellipedia (Treverton, 2016). However, we are unaware of crowdsourcing having been applied to intelligence report generation, and there are reasons to doubt that high-quality analytic reasoning and report drafting could be crowdsourced.
One is the challenge of coherence. A good intelligence report will have a coherent overall structure, though this structure may vary from one report type to another. Coherence can be improved by strategies such as using a template to ensure that certain components are present and in a suitable order. However, good reports also generally reflect the effort of a primary author shaping the whole document to maintain multiple, layered “arcs of coherence” (Pinker, 2014). In particular, analytic reports should be logically cohesive, presenting chains of clear and compelling argumentation. These kinds of coherence may be difficult to achieve via crowdsourcing, where authors generally contribute with little coordination. In short, for some of the same reasons that crowds cannot write good novels (Nielsen, 2012), they may struggle to deliver well-reasoned intelligence reports.
Another reason for skepticism is the challenge of timely delivery. Intelligence reports must frequently be completed and submitted by a deadline, sometimes allowing analysts only a few hours to complete their work. A crowd generally cannot be trusted to show up and complete a report on a tight schedule. This problem does not arise in many applications of crowdsourcing, such as Wikipedia or Intellipedia, where there are no delivery deadlines.
Finally, there are bureaucratic and cultural barriers to crowdsourcing report generation in intelligence organizations. For example, given the sensitive nature of intelligence work, access restrictions may mean only a small number of people can work on a given problem. Another example is the problem of attribution. Analysts’ performance is often judged in part on how many reports they deliver (Nolan, 2013). Crowdsourcing may make it hard to determine what, or how much, a particular analyst contributed. Analysts may be reluctant to work hard on a crowdsourced report for which they get little or no direct credit. Alternatively, they might be tempted to free-ride, aiming to get credit for a collective effort to which they contributed little.
Structured Analytic Techniques
SATs are procedures or frameworks intended to improve analytic thinking. They have been a mainstay of the intelligence community’s response to the challenge of improving the quality of analysis. Their use in the United States is mandated by the Intelligence Reform and Terrorism Prevention Act of 2004. Scores of SATs have been codified (Dhami et al., 2016; Heuer & Pherson, 2015), and they are part of standard training for analysts in major intelligence organizations (Chang et al., 2018).
SATs certainly seem like a promising way to improve analysis. Intelligence analysts, like all people, are afflicted by cognitive biases and capacity limitations (Heuer, 1999). SATs are often designed to correct such problems. For example, one of the most well-known SATs, the Analysis of Competing Hypotheses (ACH), is intended to mitigate the pervasive problem of confirmation bias (Cook & Smallman, 2008; Whitesmith, 2019). It is superficially plausible that SATs have the effects they were designed to have. Further, SATs frequently operate by making explicit aspects of analytic thinking which might otherwise remain hidden. An analyst using ACH, for example, constructs a table with columns for hypotheses, rows for items of evidence, and a cell for every pairing. They must then record a judgment of consistency in every cell. When made explicit in this way, these aspects of the thinking are available for scrutiny by the analyst or others, and the basis for conclusions more easily identified.
Unfortunately, there is little evidence that SAT use actually improves analytic quality. The U.S. intelligence community does not systematically evaluate SATs (Artner et al., 2016), and the little available research presents a mixed picture (Coulthart, 2017). Chang et al. (2018) argue that SATs in general are based on deep misconceptions about the nature of biases and about how noise in judgments can be reduced. Others argue that highly structured approaches to analysis can severely disrupt experts’ intuitive skill (Klein, 2009; Van Gelder, 2012).
Another problem with SATs is that analysts are often reluctant to use them (Coulthart, 2016). [Coulthart studied this issue at a U.S. intelligence agency and reports that “the survey responses and interview data suggested that SATs are not commonly used at INR. In fact, approximately one-third of analysts report never using the technique on the job. The remaining two-thirds of analysts are split between those that rarely (33%) or sometimes (21%) use the techniques” (Coulthart, 2016, p. 8). On the other hand, Artner et al. report that “some regional IC offices use SATs widely” (Artner et al., 2016, p. 3)]. The amount of work SATs often demand may be an impediment. For example, for a problem with n hypotheses and m items of evidence, ACH requires analysts to make n × m discrete judgments of consistency. This number can become formidably large, even in quite modest intelligence problems. Analysts frequently report that SATs take too much time, particularly when deadlines are tight (Artner et al., 2016). Whatever the explanation, it is clear that SATs cannot improve analysis if they are not being used.
Combining Crowdsourcing and SATs
As mentioned, the CREATE conjecture is that a judicious combination of crowdsourcing and suitable SATs might substantially improve analytic reasoning in reports, where each on its own might be insufficient.
Crowdsourcing might help overcome the problem of SATs often being so laborious because, with relatively more people, a crowd can apply more effort. If the problem and the SAT allow the task to be at least partially broken down into components which can be carried out in parallel, a suitably coordinated crowd can achieve more in a given time. Crowdsourcing might also improve the quality of the judgments required by a SAT. The wisdom of crowds, in one important sense, is the increase in quality of judgments often obtained by combining the judgments of many people (Surowiecki, 2004). As noted, ACH requires discrete judgments of consistency between evidence and hypotheses. These might be improved by having many crowd members make these judgments individually and then aggregating the results.
Conversely, using SATs in a crowdsourcing environment might help overcome some of crowdsourcing’s inherent challenges. A SAT might mitigate the problem of coherence by providing crowd members with a framework within which to contribute. Also, by more clearly delineating the work to be done, a SAT might help with the allocation and timing of subtasks, and thereby help a crowd complete analysis and report drafting by a deadline. Finally, a structured approach might make it easier to ascertain who did what, and so help analysts garner credit for contributions.
Testing the Conjecture
The CREATE conjecture would be confirmed if at least one combination of crowdsourcing and SATs turns out to substantially improve analytic reasoning in real intelligence work. To verify this, such a combination would need to be defined, implemented in a working system, and rigorously tested.
Ideally, this testing would happen in situ, that is, in an actual intelligence workplace, and it would determine whether the quality of reports produced using the new method is substantially better than the quality of reports produced using normal methods, with everything else held equal. However, it is difficult to conduct such research inside intelligence organizations (Nolan, 2018). Much intelligence work is classified; outside researchers usually do not have appropriate clearances, and information about activities in the organization often cannot be shared through normal channels such as journal publication. More mundane problems also arise: intelligence organizations are often under great pressure and cannot afford to allocate significant amounts of analysts’ time to participating in research, even where it might improve quality or productivity.
In the following sections, we describe a research exercise designed to be as similar as possible to in situ testing. We recruited teams of professional analysts, gave them realistic intelligence-type problems, and asked them to complete written reports displaying their reasoning. For some reports, we asked analysts to use their normal methods; for others, they worked on a new platform combining crowdsourcing and a SAT.
The SWARM Platform
In late 2016, IARPA selected four teams to participate in the CREATE program, tasked to develop systems combining crowdsourcing and SATs and to conduct related research (Tecuci, 2018). Our research group, The SWARM Project, was one of those teams. This section provides a brief, high-level description of the platform we developed (SWARM). [The swarm concept, and variations on the term “swarm,” are increasingly common in research in areas such as artificial intelligence, collective intelligence, and military conflict. The SWARM Project and system have no relation to any other organizations or technologies using “SWARM” or similar terms. In particular, SWARM as used in this paper should not be confused with “SWARM AI” (Rosenberg & Pescetelli, 2017). For our project, the acronym SWARM initially stood for “Smartly Assembled Wiki-style Argument Marshalling,” which described our initial best-guess as to what combination of crowdsourcing and SATs would have the best prospects for achieving CREATE’s ambition. Early testing showed that this approach had serious problems so we quickly pivoted to the approach described in this paper. In the research described in this paper, we retained the term “SWARM” despite the severing of its acronymic roots, partly because the SWARM system has some similarity to the way swarms of bees make decisions (van Gelder, 2018).] We describe the particular combination of crowdsourcing and SATs used in SWARM and provide a glimpse of its interface.
Crowdsourcing in SWARM
Crowdsourcing in SWARM is a version of the question and answer (Q&A) model found in popular websites such as Stack Overflow and Quora. On these sites, anyone on the internet can pose questions, and others post answers. Users can also rate and comment on answers, and the authors can revise answers. The crowd’s wisdom (aggregated ratings) ranks the answers, and the best answer is made most prominent.
Similarly, on SWARM, an analytic reasoning exercise commences when an intelligence-type problem is posed to a crowd. The intended outcome is a finished report presenting findings and supporting reasoning. Candidate reports are posted, other crowd members can provide comments and ratings, and the best report floats to the top. When the deadline arrives, the platform takes the highest rated report to be the crowd’s output.
In this process, crowd members can post two types of responses to the problem. One is a Report, which should be a candidate for selection by the crowd as their final report. Other users can rate the draft Report for readiness for submission as the crowd’s final report. The second kind is a Resource that holds other contributions which might be useful in helping the group move toward a good final report. For example, a crowd member might post a Resource containing a timeline of events relevant to the problem. Resources are rated by the crowd for usefulness, with the most useful Resources gaining prominence.
An important difference between SWARM and popular Q&A sites is that the latter allow any member of an indefinitely large crowd to engage with any question. On SWARM, users are assigned to groups or teams, and different groups can produce final reports for the same problem. Within a group, however, SWARM is very like Stack Overflow and Quora and many other crowdsourcing platforms such as Wikipedia, in that, by default, users are allowed considerable latitude (van Gelder et al., 2018). Roughly, this means that they are free to contribute however and whenever they want. This design feature is driven by the idea that users themselves are best able to tell how and when they can usefully contribute to the collective effort. One consequence is that, when a group must deal with a series of problems, different subgroups can emerge in self-organizing manner to tackle different problems. We call this pattern groupsourcing to distinguish it from more traditional crowdsourcing. Subgroups in a groupsourcing approach are similar to what Hackman describes as “sand dune” teams in the intelligence workplace:
Sand dune teams are dynamic social systems that have fluid rather than fixed composition and boundaries. Just as sand dunes change in number and shape as winds and tides change, teams of various sizes and kinds form and re-form within a larger organizational unit as external demands and requirements change. Sand dune teams can assume different forms for different tasks, which may make them especially well-suited for intelligence work that does not lend itself to the formation of simple, stable teams… The organizational units within which sand dune teams operate typically are small (perhaps fewer than 30 members) and have reasonably stable membership, which permits the development of unit-wide norms and routines that allow teams to form and re-form smoothly and efficiently. (Hackman, 2011, pp. 33–34)
SATs in SWARM
SWARM supports a single high-level SAT, tightly integrated with the crowdsourcing method just described, called “Contending Analyses” (van Gelder & de Rozario, 2018). The essence of Contending Analyses is generating multiple different analyses of the problem, selecting one as the most promising, and collaboratively developing that analysis into a final report. The different analyses thus “contend” to be chosen as the best way to think about the problem, and so to be the basis of the report.
In this context, an analysis is a write-up of one way of constructing and presenting the reasoning related to an intelligence problem. When using Contending Analyses, the different analyses might be built around more specific SATs. For example, one analysis might be based on argument mapping (Heuer & Pherson, 2015, Chapter 7), while another might apply the ACH. [Note that Contending Analyses and the Analysis of Competing Hypotheses (ACH) are two different SATs. Contending Analyses is a new SAT, developed by our team as part of the SWARM Project (van Gelder & de Rozario, 2018). ACH has been well-known in the intelligence community for decades (Heuer, 1999). ACH can be used under the umbrella of Contending Analyses, but not the other way around.] An analysis in this sense need not be—and initially should not be—a full draft report. It only needs to be substantial enough for others in the group to understand the approach and evaluate it in comparison with alternative analyses. The idea is that the group should develop alternative analyses to the point where their merits can be assessed, but not so much that effort is wasted elaborating an approach that will be abandoned.
Contending Analyses contrasts with the way intelligence reports are often produced. Typically in intelligence agencies, a single analyst is wholly or primarily responsible for producing a given report (Johnston, 2005; Nolan, 2013). Usually, a draft report will embody a particular analytic approach. The report is circulated for input from others before delivery to the decision maker. This input may improve the report incrementally, but it usually would not challenge the author’s analytic approach in a deep way or offer any significant alternative.
The key idea behind Contending Analyses is that good analytic reasoning in the final report is more likely when several different ways of thinking about the problem are developed and collectively assessed. This simple idea has important epistemological antecedents. It is similar to the scientific method, in which different theories arise and contend for adoption by the community of scientists (Kuhn, 2012). It also mirrors the classic argument for freedom of speech: it must be possible for multiple viewpoints to be presented, so that society as a whole can adjudicate truth (Mill, 1865).
The need for multiple perspectives and a contest of ideas is also well recognized in the intelligence community. A number of existing SATs attempt to exploit this principle; these include Devil’s Advocacy and Red Teaming (Heuer & Pherson, 2015). The widely used Delphi technique and its recent adaptation in the IDEA Protocol (Hanea et al., 2018) incorporate the initial expression of multiple independent viewpoints. Contending Analyses has deep kinship with all these methods, but has been designed for use in the context of a scalable, cloud-based platform for crowdsourcing intelligence report development and, as a result, is different in detail and practice (van Gelder & de Rozario, 2018).
Under the umbrella of Contending Analyses, SWARM encourages the use of any other SATs analysts deem useful in developing their reports. Indeed, the critical difference between two analyses might be that they are constructed around different SATs. SWARM supports the use of a wide range of SATs by providing a “Lens Kit.” This is a compendium of resources we call “logical lenses,” where a logical lens is anything, such as a SAT, that analysts might find helpful in developing and presenting their reasoning. SWARM guidance materials emphasize the use of logical lenses, and indeed the use of multiple lenses in a single analysis, which we call the “multi-focal” method (van Gelder et al., 2018).
SWARM Interface
SWARM supports the combination of Q&A-style crowdsourcing and Contending Analyses with a cloud platform incorporating a distinctive user interface (Sinnott et al., 2019), shown in Figure 1.
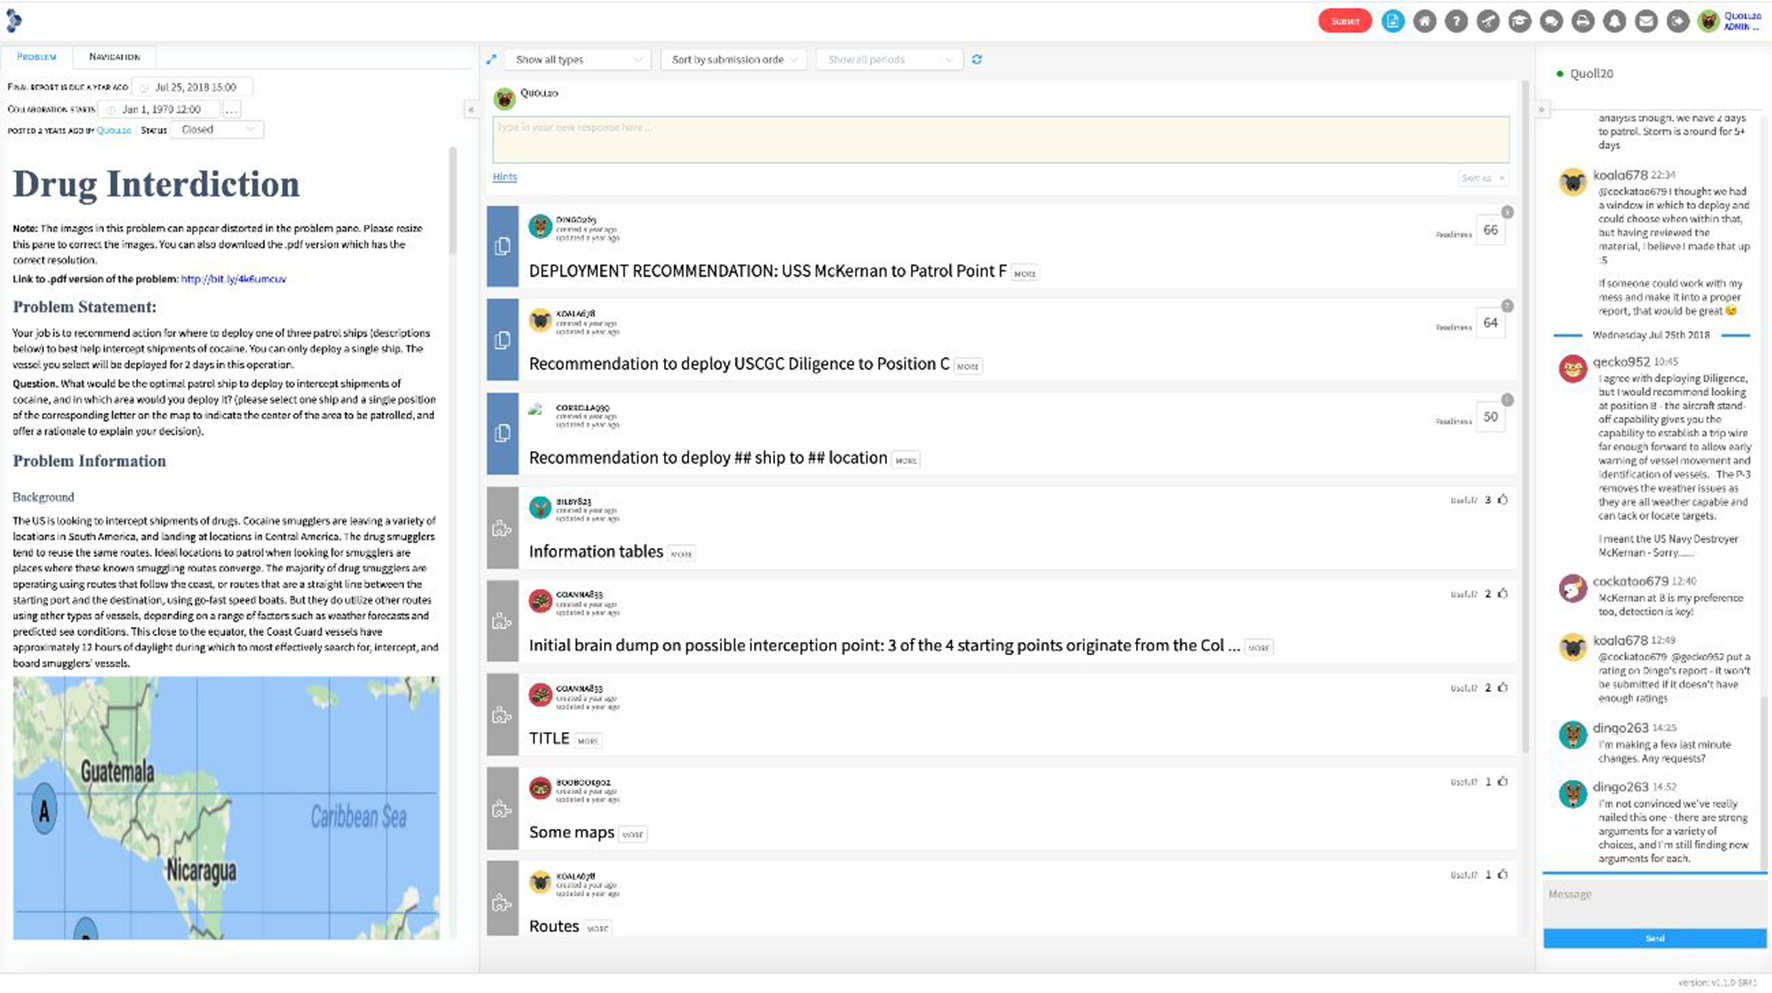
The primary user interface of the SWARM platform as used in the 2018 Challenge.
The interface is dominated by three resizable panels. The left panel presents information about the intelligence challenge the group is currently tackling. The right panel is a simple chat facility for discussion relating to that challenge. This tends to be heavily used, consistent with other evidence on the importance of supporting informal conversation in platforms for collaborative problem solving (Iandoli et al., 2016).
The center panel is the primary workspace. This is where group members create, edit, and share their responses (Resources and Reports), and rate and comment on those provided by others. In Figure 1 the group is well underway in the Contending Analyses process, with quite a few responses already shared. In the figure these responses are being viewed in “collapsed” format so that the set of responses can be easily scanned. Responses can be filtered and sorted in various ways using the drop-downs at the top of the panel. One useful sorting is by rating, so the most ready Reports and the most useful Resources, as rated by the group, float to the top. Another useful sorting is by how recently the resource was last updated, so group members can review new changes. These are some of the ways the interface helps users efficiently allocate their attention.
Figure 2 shows a closer view of the center panel, with one Report expanded to reveal its content. Also shown is the Report’s current readiness rating (59 out of 100), the number of raters so far (6), and a drop-down showing a histogram of the detailed ratings on 7 dimensions loosely corresponding to major analytic tradecraft standards (ODNI, 2015a). Ratings are entered, or adjusted, via a rating widget (not shown). The histogram presents a snapshot of the group’s current assessment of how ready the Report is for submission as the group’s final report. Such assessments serve two main functions. They provide useful feedback for Report authors, who can continue to improve their Report; and they enable ranking of Reports so that the best Report can be submitted at the appropriate time.
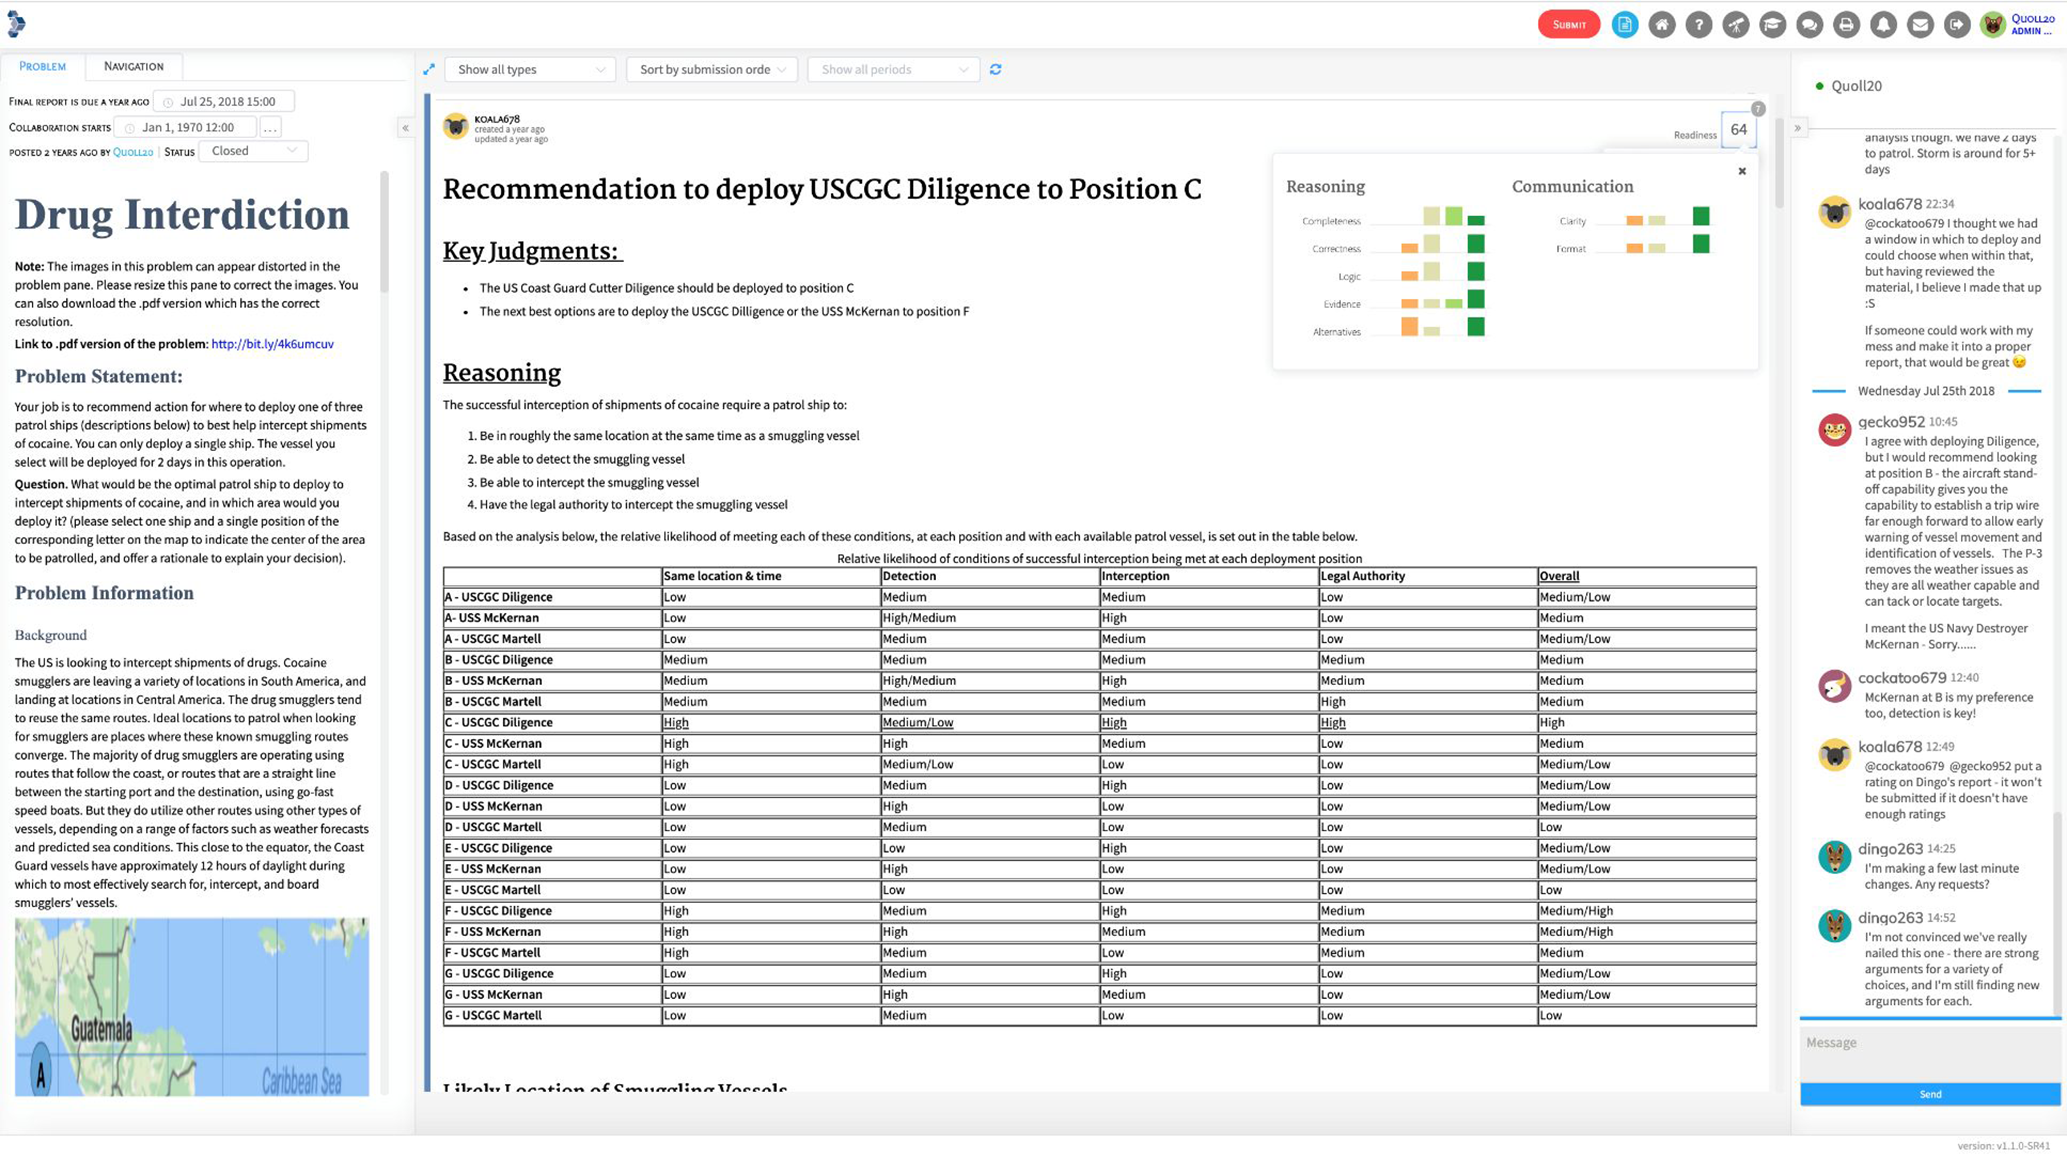
Closer view of the center panel, showing an expanded Report and the readiness rating display.
Anonymity is a noteworthy feature of SWARM in its current form. Each user is assigned a unique pseudonym. Anonymity is intended to help users’ contributions to be assessed on their merits, mitigating biases due to factors such as social status and gender. It also helps reduce unproductive behaviors such as self-censoring of divergent viewpoints or avoiding disagreement with high-status group members (Straus et al., 2011). Of course, in many online contexts, anonymity can lead to problems such as vandalism or abuse (Levmore, 2012), but in our experience these problems do not arise on SWARM to any significant extent.
Evaluating SWARM
In 2018 we conducted a large-scale tournament-style experimental evaluation of SWARM, called the SWARM 2018 Challenge. [The pre-registration for this study, along with our materials and data, are available on the Open Science platform (Fraser et al., 2018).]
Research Questions
Our primary research question was whether SWARM helps analysts produce relatively well-reasoned reports. Specifically, we asked: How does the quality of reasoning (QofR) of professional analyst teams using SWARM compare with the QofR of the same professional analysts using normal methods and tools? We hypothesized that the SWARM reports would be better with an effect size (Cohen’s d) of .42 or more. [Since there were no directly relevant prior studies or literature, the figure of 0.42 was derived using a crude “wisdom of crowds” approach: averaged estimates provided semi-independently by members of our team.]
We were also interested in how professional analysts perform in comparison to members of the public who are not professional analysts. Specifically: How does the QofR of professional analyst teams using SWARM compare with the QofR of general public (GP) teams using SWARM? We hypothesized that professional analyst teams’ reports would be better by d = .25 or more.
Third, we wanted to know how useable professional analysts found SWARM. We hypothesized that professional analysts would rate SWARM as having high marginal (60+) or greater usability on the System Usability Scale (SUS; Kortum & Bangor, 2013).
We addressed these research questions by having professional analysts, and non-analyst members of the public, tackle four difficult intelligence-type problems over 4 weeks and deliver reports. In the first week, analysts were asked to tackle a problem using normal methods of their own choosing. In the remaining weeks, analysts worked in teams on SWARM. Non-analysts worked in teams on SWARM for all four problems. Reports were rated for QofR, and the results compared for the various conditions. Participants completed four surveys, including the SUS.
Participants and Teams
The 2018 Challenge commenced with 641 participants assigned to 24 teams of three kinds. Nine Organizational Analyst (OA) teams were made up of professional analysts drawn from organizations. Six Public Analyst (PA) teams were made up of analysts recruited via the internet and participating independently of any organization; and nine General Public (GP) teams were comprised of non-analyst recruited via the internet or via security studies programs.
Fourteen organizations, predominantly Australian and New Zealand government bodies with intelligence functions, contributed to the nine OA teams. In six cases, a whole team was drawn from a single organization; in three cases, a team combined analysts from similar organizations. We recruited organizations by various means including approaching organizations directly and presenting in seminars arranged by a professional association (The Australian Institute of Professional Intelligence Officers). We began targeting professional intelligence analysts, but to increase the statistical power of our study we widened the net to include analysts in related fields such as biosecurity, risk, and financial services. We ended up with an even split between intelligence analysts, with an average of 7.1 years’ experience, and other kinds of analysts (6.1 years). Organizations agreed that participating staff could not be required to participate as part of their job, and that they would be allowed time away from regular duties to participate.
We recruited participants for the public teams via a Facebook campaign conducted with help from our university communications office. Volunteers were recruited as individuals and randomly allocated to teams of 30 or more. We classified individuals as analysts or GP (non-analyst) based on their answers to three questions in the entry survey. [The three questions were: “Do you have experience working as an intelligence analyst?”; “Do you have experience working as an analyst, though not in intelligence? (e.g., a risk analyst, policy analyst, etc.)”; and “Please briefly describe your experience as an analyst.”] Two undergraduate security studies programs at other universities also provided a team each. Since the members of these teams did not have experience as professional analysts, we classified these teams as GP.
Demographically, based on our entry survey data, the participants were relatively young, with 33% in the 25–34 bracket and 22% in the 35–44 bracket; were almost evenly split between male and female; had mostly attained a bachelor’s or master’s degree; and were mostly located in Australia. We excluded participants if they had previously been involved in SWARM research activities, but imposed no other restrictions. We did not offer or provide any payment or other extrinsic incentive to participants.
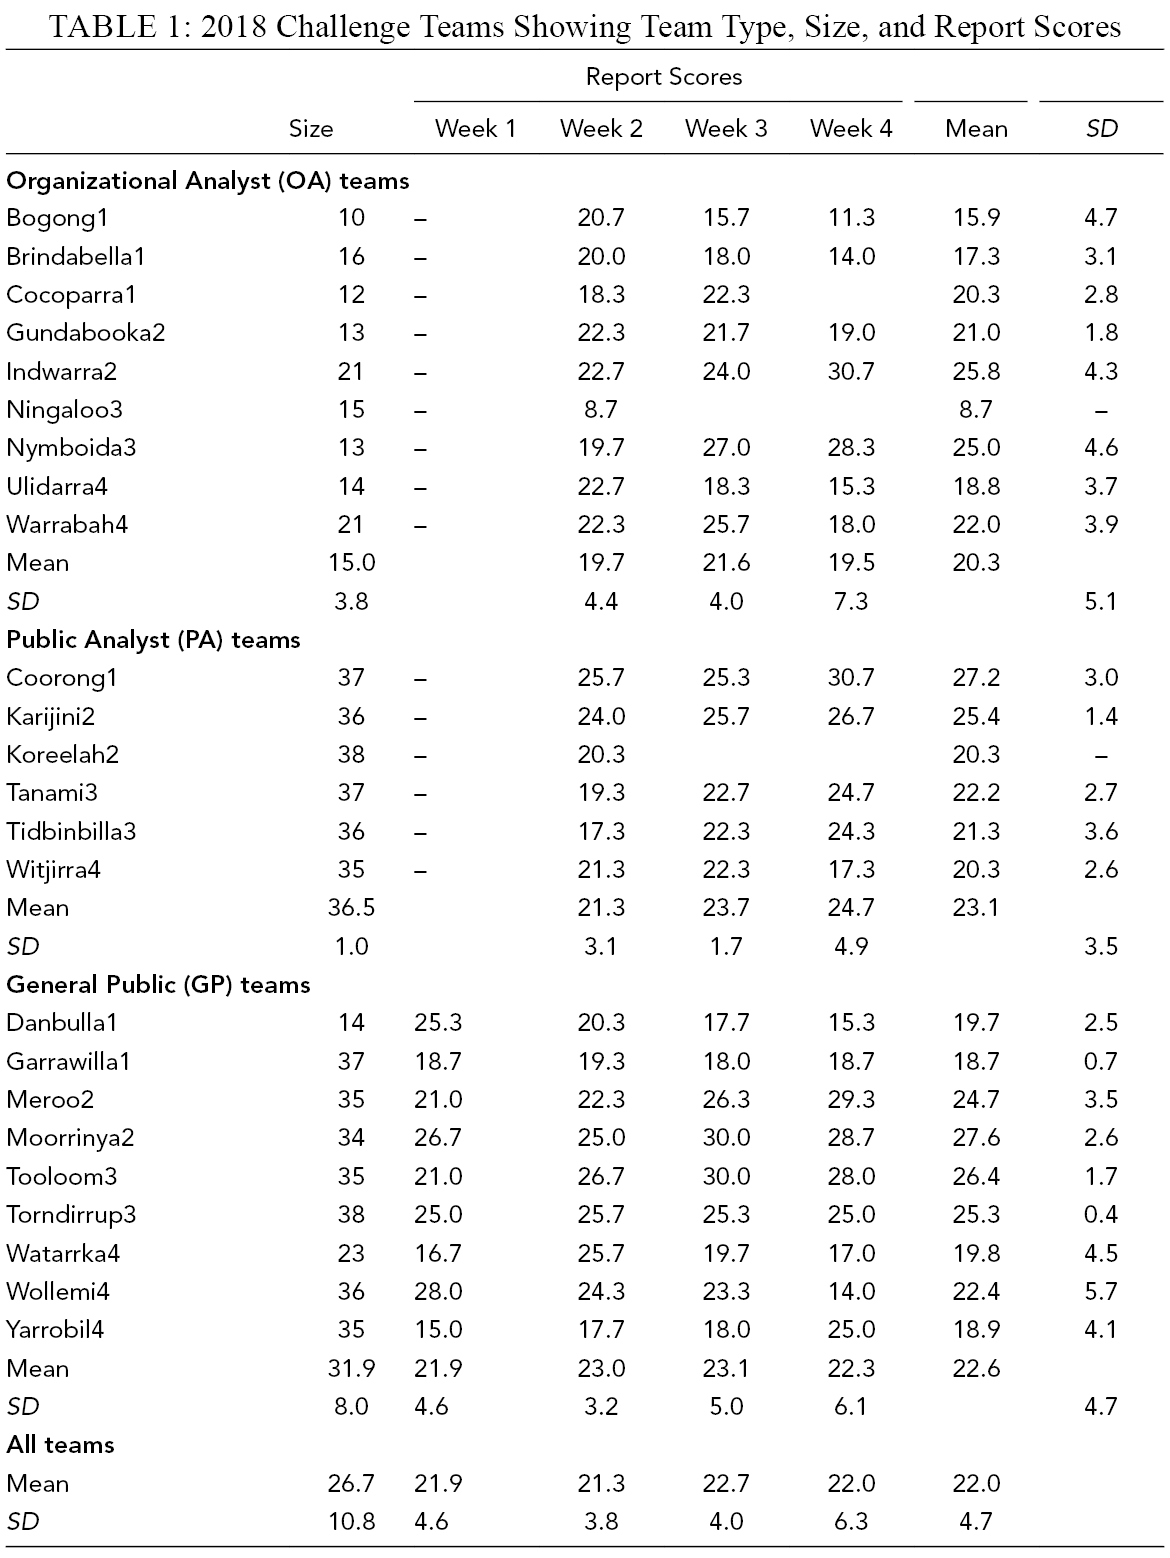
Team sizes varied (Table 1). Organizational team sizes were mostly determined by what the organizations could manage to provide, though we recommended that they field at least 12 people per team. The public team sizes were set by us, based on two considerations. First, informal observation of previous exercises on SWARM suggested that, for the platform to function as designed, a minimum of around five people must work actively on a problem, and that teams had a small core of very active people while other participants were either inactive or only peripherally involved. This is broadly consistent with the literature on online participation (Klug & Bagrow, 2016; Shirky, 2008). Second, we wanted to minimize the risk that public teams would fail to have critical mass. These considerations led us to assign around 30 or more people to public teams.
2018 Challenge Teams Showing Team Type, Size, and Report Scores
Materials
Problems
We used four challenging fictional intelligence-type problems. These problems were “constrained” in the sense that all information needed to tackle the problem was provided in the problem description. Participants could use only this information, plus common knowledge and plausible assumptions, in developing their reports. The four problems were quite different in their settings and in the reasoning challenges they posed. For example, one problem was set in the fictional central Asian country of Kalukistan and focused on evidence evaluation and hypothesis testing in relation to counterterrorism. A second problem focused on hypothesis generation and testing with regard to poisoning of a politician. A third involved predicting the optimal placement of assets for interdiction of drug smuggling (Clegg et al., 2018); and the fourth dealt with the likelihood of two countries having acquired a dangerous weapon and required updating probabilities in accordance with Bayes’ theorem. [This was a modified version of a problem provided by the BARD Project, Monash University.] Only this problem had an objectively correct answer.
Surveys
We used an entry survey to gather demographic data and data about individual differences between participants of potential relevance to understanding differences in QofR in final reports. When analysts submitted their off-platform reports at the end of Week 1, they completed a brief survey covering how they worked during that week. After completion of the Week 4 problem, we asked all participants to complete two surveys. One was the SUS, which asks subjects for their reaction to 10 statements like “I think that I would like to use this system frequently” and “I found the system unnecessarily complex” (Bangor et al., 2008). The other was a general user experience survey focusing on SWARM, including Likert-scale questions asking for level of agreement with the following five statements:
Using SWARM as a team enabled us to produce better reasoned reports than the methods I would normally use.
My team’s reports were better than I could have produced on my own.
SWARM (suitably developed) has great potential for intelligence analysis.
If my organization introduced SWARM, I would want to use it.
Participating in the 2018 Challenge was a valuable learning or professional development experience.
Procedure
The challenge unfolded over 4 weeks, with teams tackling one problem each week. To minimize the potential impact of presenting the problems in a particular order, we distributed the 24 teams across four blocks and assigned problems to the blocks in Latin square (Bradley, 1958). We distributed each of the three types (OA, PA, and GP) approximately evenly across blocks. In Week 1, GP teams tackled their problem as groups on SWARM, as did all teams in Weeks 2–4. At an appointed time, a problem was opened for a team to work on, and team members were notified by email. A week later the problem closed, and the platform took the team’s highest rated Report as the team’s collective answer.
In Week 1, we asked analysts in the OA and PA teams to deliver a report completed using methods and tools normal in their organizations. [Their instructions included the following: “The SWARM 2018 Challenge is part of a broader research project. We’re trying to find out if the platform we’ve been developing can help improve analytical reasoning. To find this out, we need to compare problems tackled by analysts using normal methods, with problems tackled by teams on the SWARM Platform. That’s why we’re asking you to do your first problem off-platform and using your normal methods.”] We encouraged them to collaborate with others, but for statistical reasons asked them to avoid collaborating with anyone who was also participating in the 2018 Challenge.
Participants were asked to complete a SWARM training module prior to commencing work on SWARM. GP teams did their training before Week 1, and analyst (OA and PA) teams did theirs at the start of Week 2. This was to ensure that the methods analysts used for their Week 1 reports would not be confounded by exposure to the SWARM approach.
Soon after a problem closed, we provided an example of a good answer as one form of feedback. (We did this to help maintain engagement in the study; model answers would not, of course, be available to teams using a future version of SWARM in real work contexts.) When their answer had been scored (see later), we provided the scores and comments. A public leaderboard showed the overall scores for each team for each report, plus a cumulative total score, which determined their ranking on the leaderboard. Team names on the leaderboard were pseudonyms (e.g., Bogong1) to avoid revealing the identity of participating organizations.
Analysis
Scoring
Reports were assessed using the the Intelligence Community (IC) Rating Scale for Evaluating Analytic Tradecraft Standards (ODNI, 2015b). This document provides guidance for evaluating the extent to which an intelligence report meets the nine analytic tradecraft standards specified in ODNI’s Intelligence Community Directive 203: Analytic Standards (ODNI, 2015a). Those tradecraft standards require that an intelligence report:
Properly describes quality and credibility of underlying sources, data, and methodologies
Properly expresses and explains uncertainties associated with major analytic judgments
Properly distinguishes between underlying intelligence information and analysts’ assumptions and judgments
Incorporates analysis of alternatives
Demonstrates customer relevance and addresses implications
Uses clear and logical argumentation
Explains change to or consistency of analytic judgments (with those presented in previous reports)
Makes accurate judgments and assessments
Incorporates effective visual information where appropriate
For each of these standards, the Rating Scale provides two pages of guidance, including the definition; instructions for evaluating a report as Poor, Fair, Good, or Excellent; and some clarificatory notes.
We simplified the Rating Scale slightly by dropping the seventh standard (“Explains change to or consistency of analytic judgments”) since this was not relevant in a laboratory study. Thus, using our version, reports were given a score from 1 to 4 on each of eight dimensions, which we combined into a single score of between 8 and 32 points. Three raters assessed each report, and we averaged their scores to produce the overall score. Aggregating scores from three trained raters has been found to substantially improve interrater reliability with ODNI Rating Scale (Marcoci et al., 2018). We hired and trained raters specifically for this task; they were not part of the main SWARM Project team. To blind raters as to how a report was produced or by whom, we put all reports into a neutral format and varied the order of presentation to raters. The raters also provided brief comments on reports.
Effect size calculation
For research questions 1 and 2, we want to compare the QofR between two sets of reports. Effect size (Cohen’s d) is broadly appropriate for such comparisons, but the specific version of Cohen’s d depends on the details of the experimental design. For research question 1, we are comparing QofR scores for reports developed by analysts using normal methods with scores for reports developed by those same analysts, working in teams on SWARM. Each team on SWARM delivered multiple reports. Given these features, the appropriate form is Cohen’s d for repeated measures, d rm (Lakens, 2013). For research question 2, we are comparing QofR scores of reports produced on SWARM by analyst teams and GP teams. For this we can use Cohen’s d for independent groups (Cohen, 1988). Our study preregistration (Fraser et al., 2018) explains in more detail how these formulas are applied in our case.
Results
Reports and scores
Teams on SWARM submitted almost all of their expected reports (76 out of 81, or 94%). Three teams failed to complete at least one report. In most cases, these reports were substantial, well-organized pieces of work, and included tables and graphics of various kinds. Report lengths, in words, ranged from 36 to 6,981, with a mean of 1,932 (SD = 1,415). Table 1 shows the overall scores for reports submitted by teams on SWARM. The mean overall score was 22.0 (SD = 4.7) out of a maximum 32. There was a small variation in mean score across team types, with OA teams scoring 20.3 (SD = 5.1), PA teams 23.1 (SD = 3.5), and GP teams 22.6 (SD = 4.7).
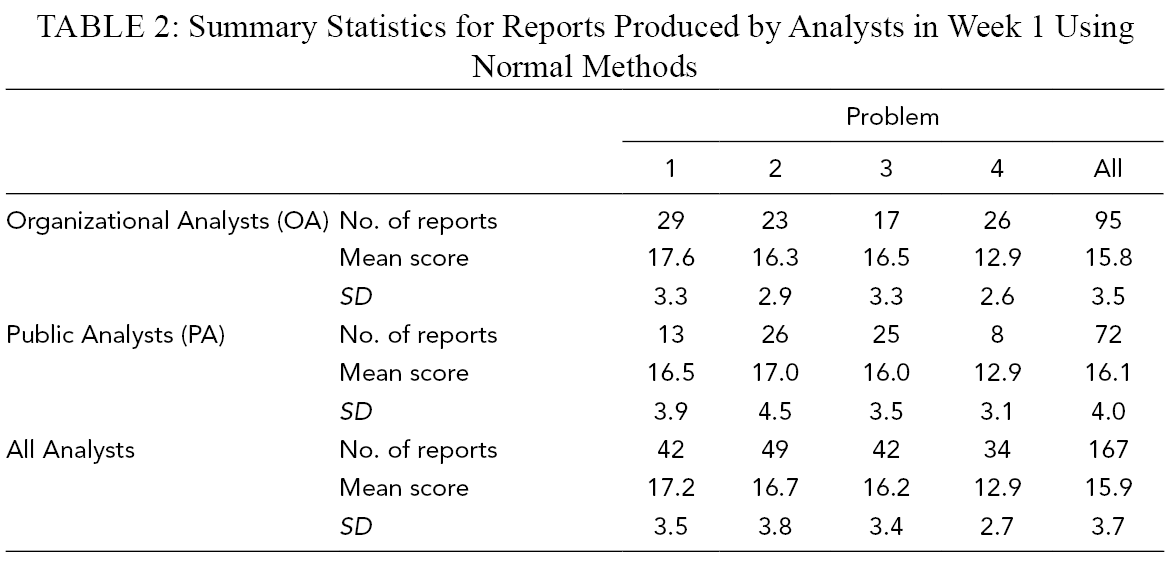
As shown in Table 2, 167 reports were submitted by analysts using normal methods in Week 1, with a mean score of 15.9 (SD = 3.7). Since the analyst teams started with 354 total members, the submission rate was 45%. Reports were only about half as long as those produced by teams on SWARM; lengths ranged from 58 to 3,622 words, with mean of 910 (SD = 650). There was little difference in score between OA teams (M = 15.8, SD = 3.5) and PA teams (M = 16.1, SD = 4.0).
Summary Statistics for Reports Produced by Analysts in Week 1 Using Normal Methods
Research question 1: normal methods versus SWARM
The mean score for the 40 reports produced by analyst (both OA and PA) teams on SWARM was 21.4. The difference between this and the mean score of 15.9 for the normal methods reports is significant (p < .01, t = 6.86, df = 51.2). The effect size (Cohen’s d rm) is 1.37 with a 95% two-tailed confidence interval of [0.56, 2.23] (Figure 3). [As discussed in our preregistration [Fraser et al., 2018], figures were calculated with a team’s missing reports being assigned a score equal to the average of the scores for reports submitted by that team. It could be argued that this is generous; if a team had been forced to submit a report for every problem, the scores for reports they did not in fact submit would probably have been lower, though not zero. Consequently for an alternative perspective we calculated the effect size with missing reports being assigned a score equal to half of the average for submitted reports. Since there were not many missing reports, this made little difference: the result was drm = 1.2 with a 95% two-tailed confidence interval of [0.42, 2.03].]
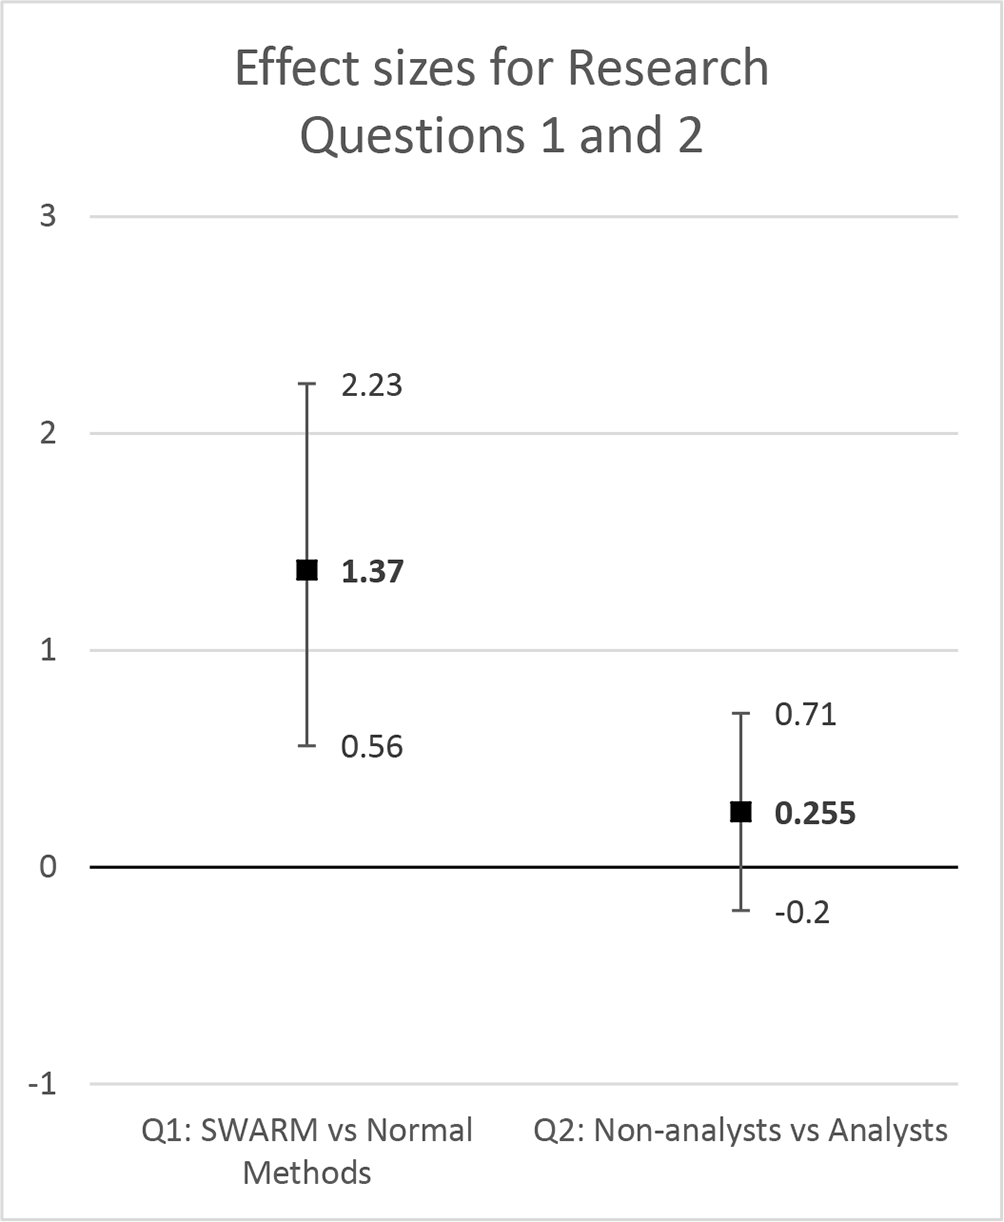
Effect sizes and 95% confidence intervals for research questions 1 and 2. The left column shows Cohen’s d rm for the scores of reports produced by teams on SWARM versus those produced using normal methods. The right column shows Cohen’s d for scores of reports produced by General Public teams versus those produced by analyst teams.
Research question 2: analysts versus non-analysts (General Public)
The mean score for for the 36 reports produced by GP teams on SWARM was 22.6. This is superior to the mean score of 21.4 for analyst (OA and PA combined) teams with an effect size (Cohen’s d) of 0.25 (95% confidence interval [-0.20, 0.71]; p = 0.27, t = 1.11, df = 74).
Research question 3: attitudes to SWARM
As part of their exit survey, 122 participants completed the SUS. The mean SUS score for SWARM was 61.1 on a scale of 0–100. There were noticeable differences in SUS scores awarded by the different participant types; for OA the mean was 51.6 (n = 29); for PA 59.7 (n = 39); and for GP 67.2 (n = 29).
Participants’ answers to the five Likert-scale questions about SWARM in the general experience survey, shown in Figure 4, show largely positive attitudes toward SWARM and its potential utility for intelligence analysis. Converting to a five-point scale, the mean score was 3.9, with little difference between team types; for OA the mean was 3.8 (n = 40); for PA 3.7 (n = 30); and for GP 4.0 (n = 56).
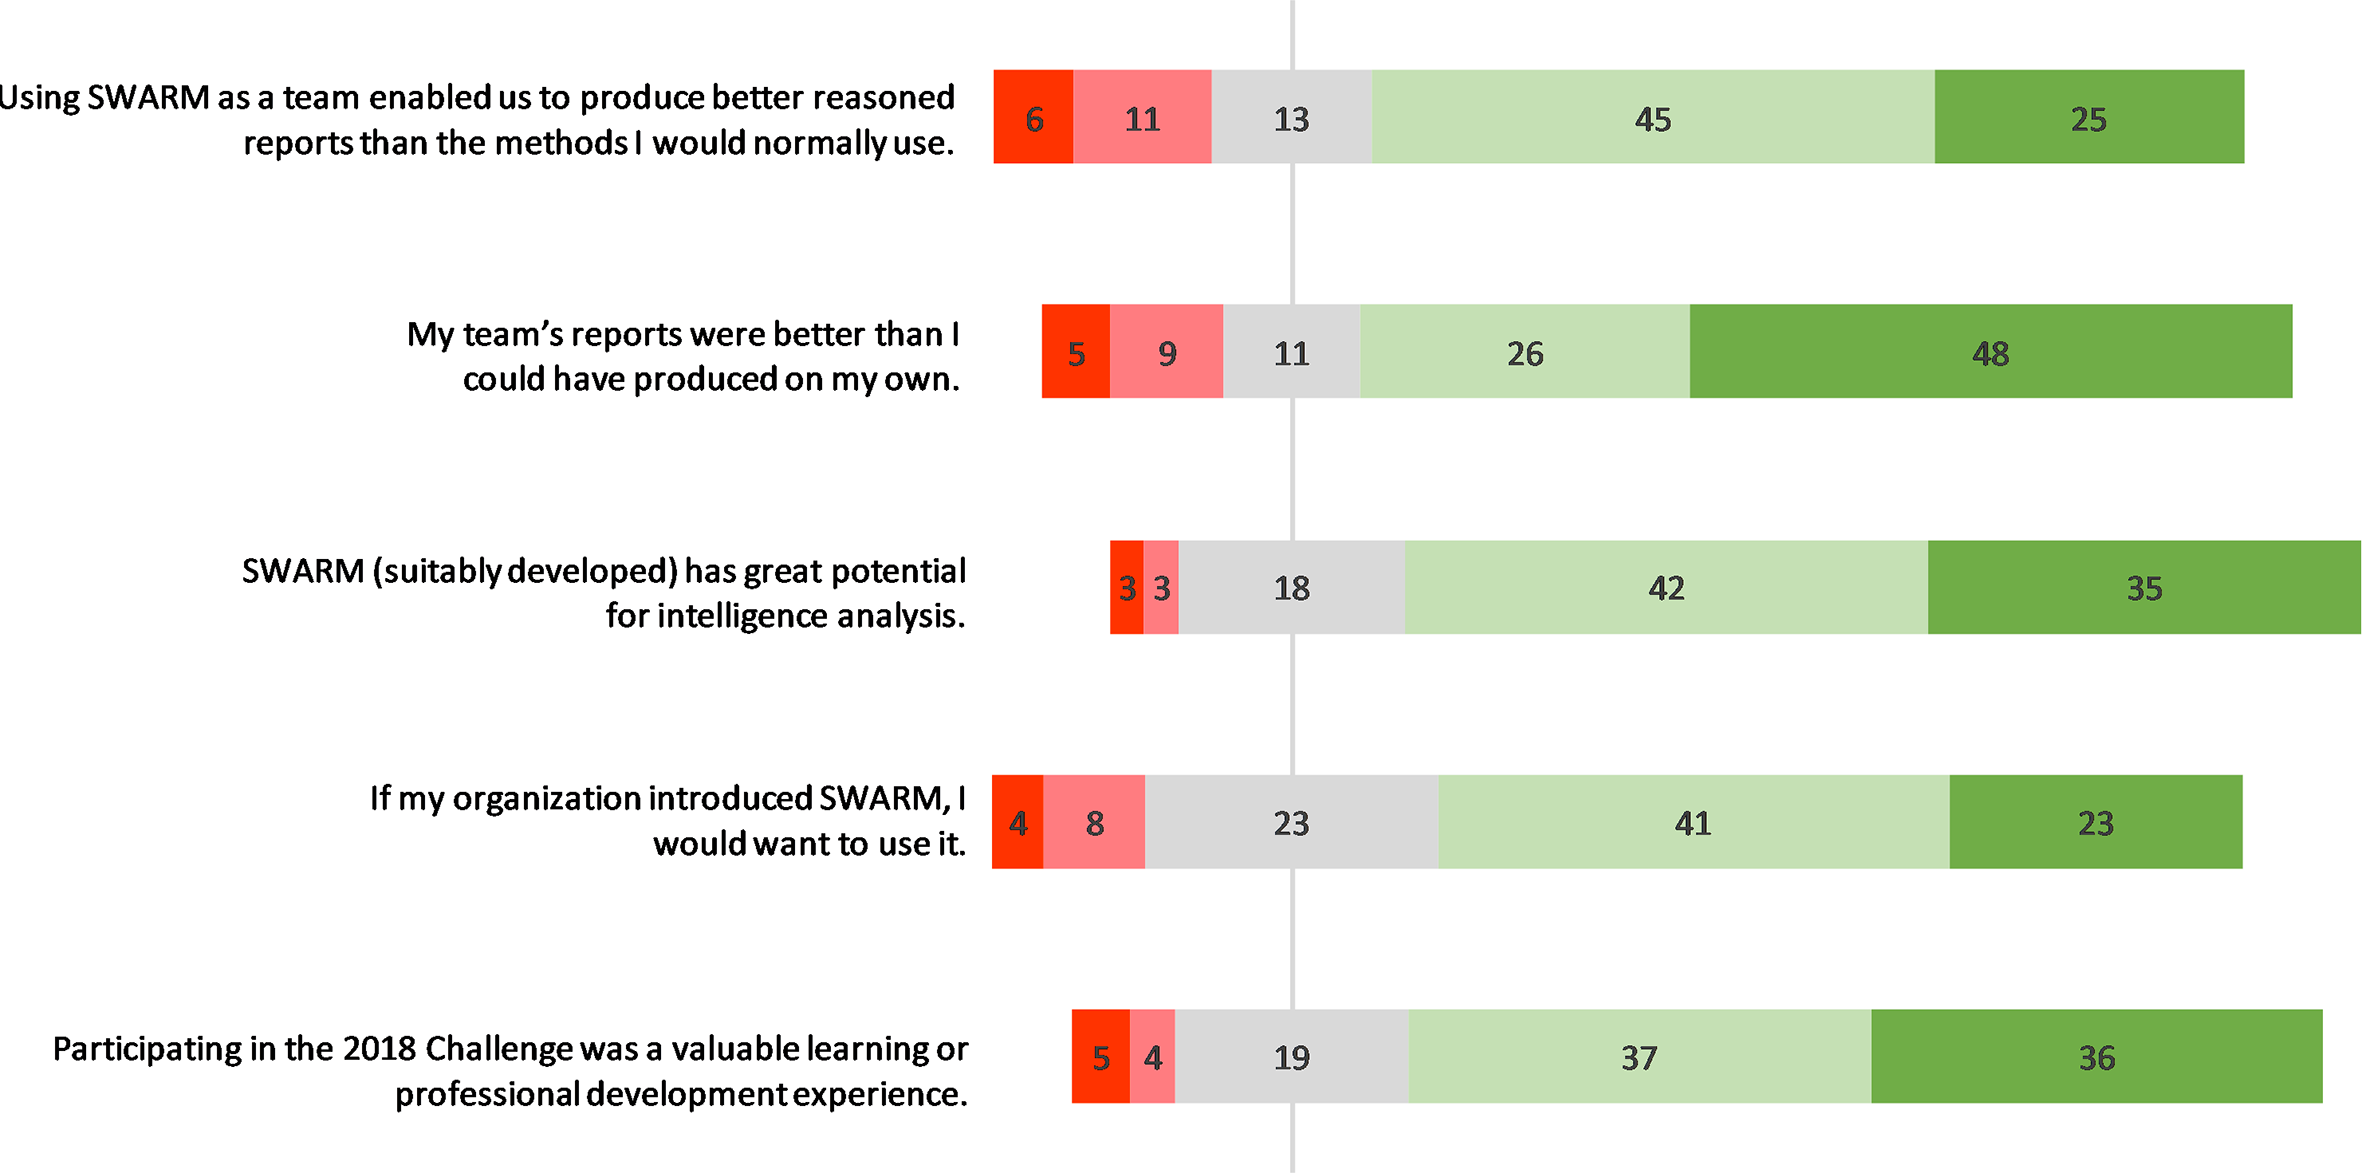
Summary of all 122 responses to five questions about SWARM in the exit survey. Segments from left to right are strongly disagree, somewhat disagree, neither agree nor disagree, somewhat agree, strongly agree. The numbers within the segments are percentages of respondents selecting that option.
Participation
The mean individual participation rate across all weeks, problems, and team types was 38%, or 35% for teams on SWARM. For this purpose we define participation as the number of participants showing any activity at all on SWARM for a given problem or submitting a normal methods report (Week 1, OA and PA teams). Figure 5 shows a breakdown of participation rates by week and team type.
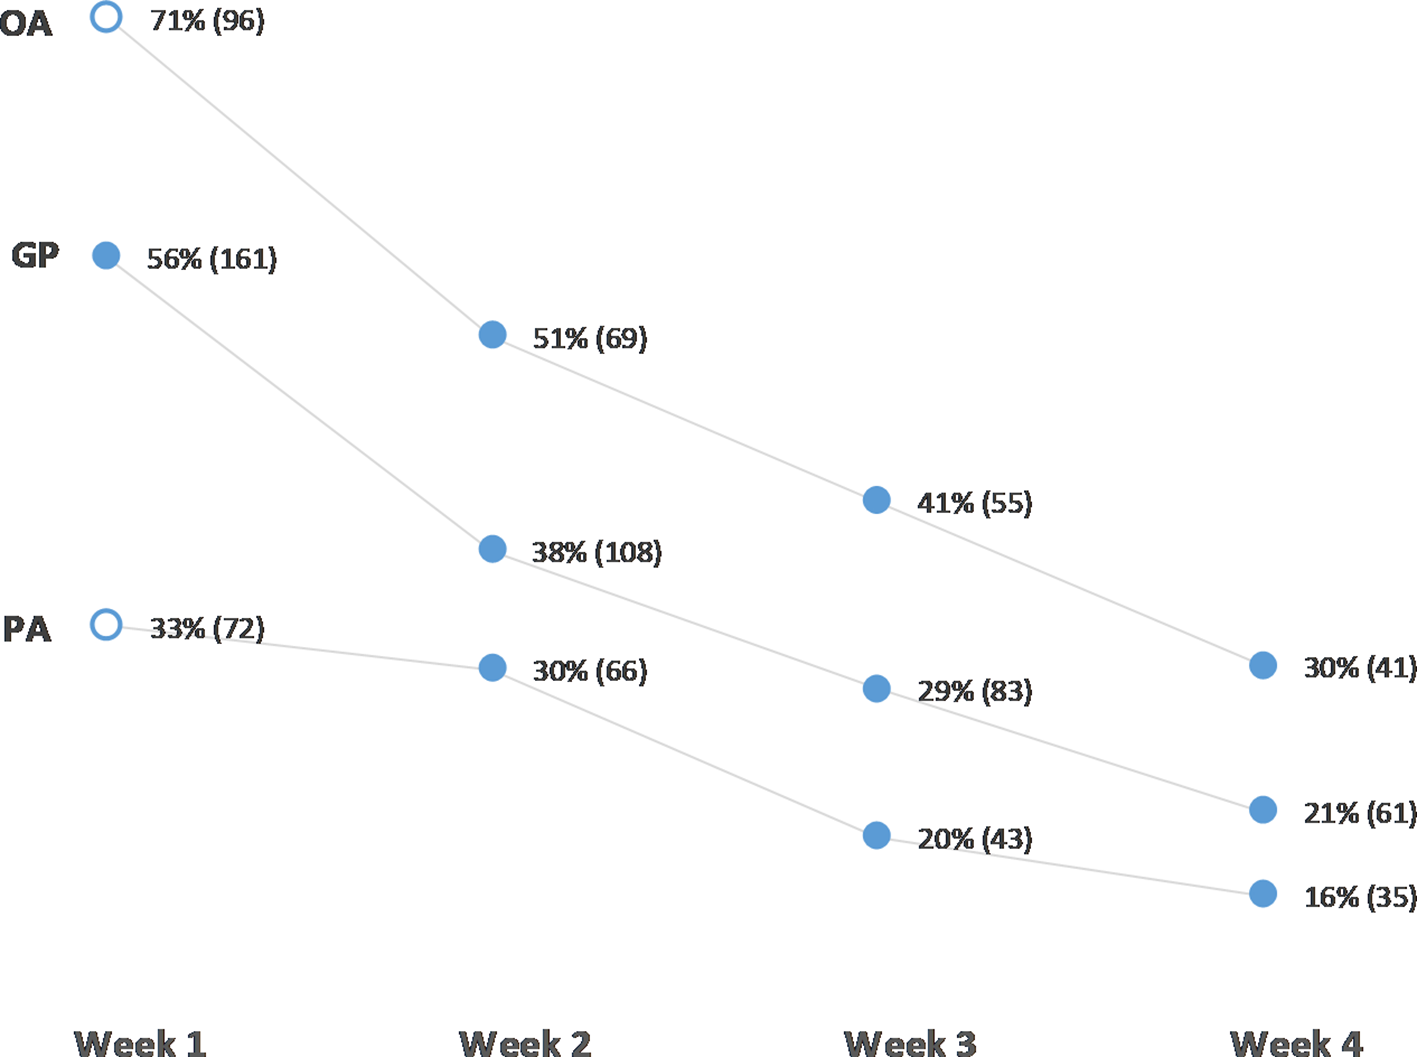
Participation by week and team type, expressed as percentages, and raw numbers (in parentheses). OA is Organizational Analyst teams; GP is General Public teams; and PA is Public Analyst teams. Solid dots are participation on SWARM; rings are submission of a normal methods report.
Among those who did participate in any given week, the level of involvement varied widely. This is reflected in participants’ estimates of the time they put in per week. When analysts submitted their Week 1 (normal methods) report, they estimated that they personally had spent an average of 3.3 hr (SD = 2.3) working on their report. In the exit survey, we asked participants how much time they spent in each week. The mean for Weeks 2–4, when all participants were using SWARM, was 5.3 hr (SD = 6.2). The large standard deviation reflects the skewed distribution of participation, with a long tail to the right. The highest estimated time spent by a single person on a problem on SWARM was 40 hr, and participants reported spending 10 hr or more on a problem around 12% of the time. The means of 3.3 hr for analysts in Week 1 and 5.3 hr for all problems on SWARM are close to what we advised participants at the outset. In onboarding materials, they were told “We estimate that you will need to spend, on average, about 3 hr per week participating in the 2018 Challenge.”
How much time was taken to produce reports? When analysts submitted their Week 1 (normal methods) report, they estimated that the total time spent working on their report, by all collaborators, was on average 3.7 hr (SD = 4.8). For reports produced on SWARM, we can estimate the total time taken for a report by multiplying the number of active participants by the mean estimated time spent per week. These figures are shown in Table 3. Overall, this was 48.2 hr (SD = 25.7). Notably, however, it appears that by Week 4, teams of all types were converging on spending, in aggregate, about 30–35 hr per report.
Mean (SD) Number of Active Participants and Mean (SD) Estimated Time Taken to Complete the Final Report, for All Problems Completed on the SWARM Platform, by Week and Team Type.
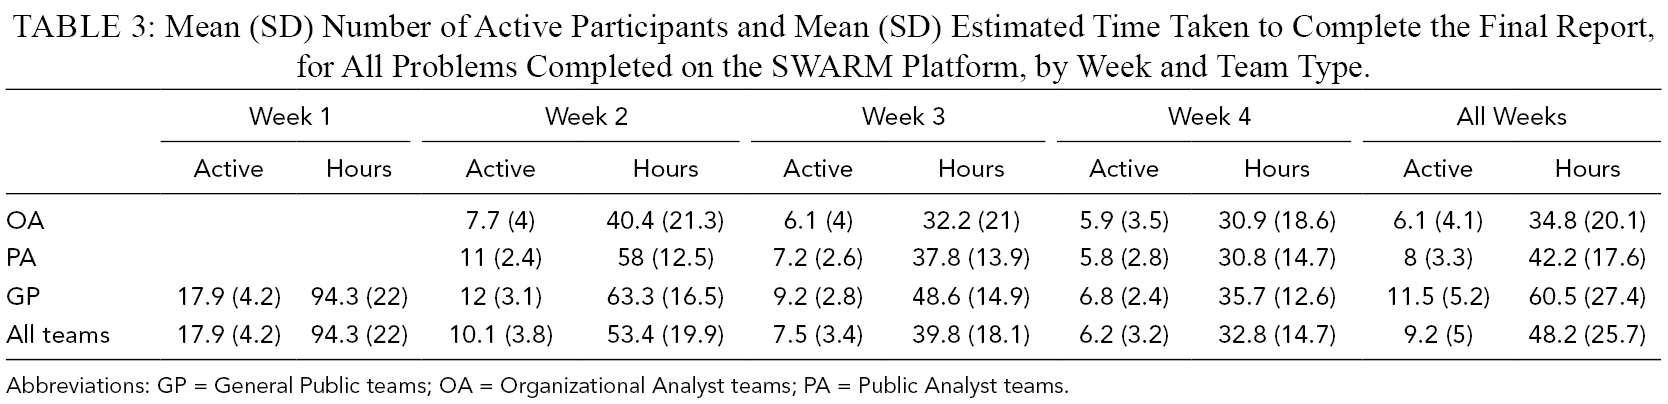
Abbreviations: GP = General Public teams; OA = Organizational Analyst teams; PA = Public Analyst teams.
Interface use
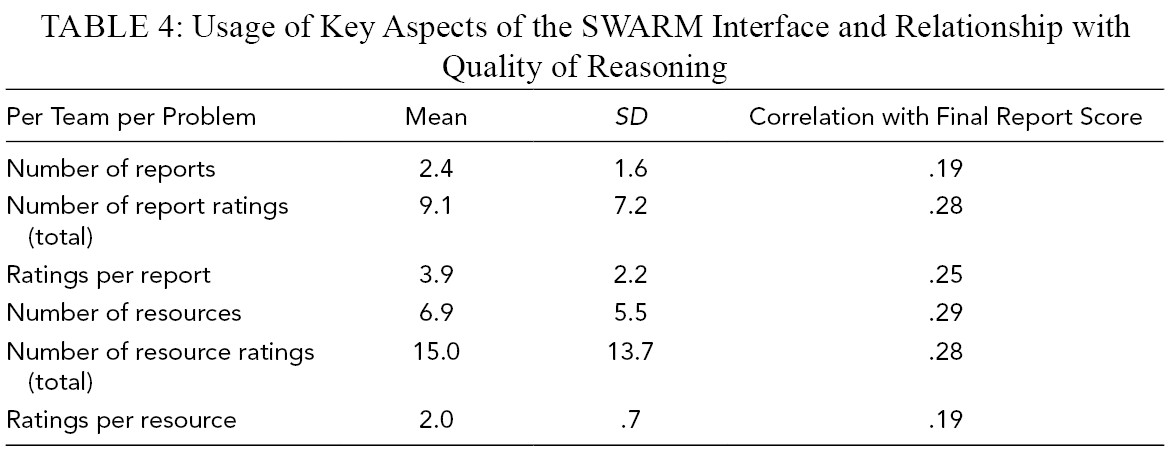
How did teams use the SWARM interface, and how did this relate to QofR? As described in an earlier section (SWARM Interface), the platform was designed to support groups to use the Contending Analyses technique. This technique requires that the group generate multiple alternative analytic “takes” on a problem and collectively assess which of these is most promising. The interface supports these group activities with two major features. The first feature is the central pane where group members can share different responses (draft Reports and Resources) in a central workspace. The second feature consists of the rating widgets enabling other group members to publicly rate others’ responses. We should therefore look at the usage of these major features and how that usage relates to report scores.
Table 4 summarizes this data. Generally, teams were producing around two Reports per problem, with each of those Reports given around four ratings. They were also producing multiple Resources, with each of those getting about two ratings. This activity all correlates weakly but consistently with the QofR score for the final Report.
Usage of Key Aspects of the SWARM Interface and Relationship with Quality of Reasoning
Discussion
Interpretation of Results
Report scores
The mean score for Week 1 (normal methods) reports of 15.9 out of 32 (50%) can be interpreted as indicating that those reports were on average Fair in the degree to which they were meeting the ODNI analytic tradecraft standards. Similarly, reports produced on SWARM (22.0 out of 32, or 69%) were on average just under Good. How does this compare with the quality of reports in real intelligence work? We cannot answer this, since to our knowledge no organization has released any data on how well their reports score on the IC Rating Scale. Average scores of 50% or 69% may seem low, but intelligence analysis is demanding cognitive work, and scoring well simultaneously across all eight dimensions in the modified IC Rating Scale is very challenging.
Most of the reports in the top score bracket (26–32 points) were produced on SWARM. These top-end reports are worth some attention. In our judgment they were superb pieces of analytic work. According to three trained raters, they scored full marks, or nearly full marks, on all eight dimensions of the modified IC scale. Beyond that, they showed considerable analytic sophistication, in that they were very clear about the analytic methods, or combination of such methods, they were bringing to the problem, and they used those methods with impressive proficiency.
Research question 1: normal methods versus SWARM
In this study, analyst teams on SWARM substantially outperformed those same analysts using normal approaches. The measured effect size of d rm = 1.37 is very large by standard reckoning (Cohen, 1988); is much larger than our preregistered estimate of .42; and appears to meet the benchmarks of the CREATE program as a whole, which aimed for an effect size of d ≥ 1 relative to suitable controls (IARPA, 2016).
In some respects, our experimental design would have artificially inflated the effect size in SWARM’s favor. For example, as the experiment progressed, analysts may have learned how to perform better. One way this may have occurred is through the provision of exemplar answers. These were provided to help maintain engagement over the 4 weeks of the study. However, they may have helped participants better understand what a good report looks like, and this may have helped them perform better in subsequent weeks. Since the SWARM reports were developed in Weeks 2–4, any such learning would advantage SWARM reports over the Week 1 normal methods reports.
At the same time, our design might have artificially deflated the effect size in other ways. In a study of this kind, relying on volunteers working hard over many weeks, participant attrition is a severe problem and can affect results in many ways. For example, submission of reports in Week 1 was voluntary, and there were no consequences for failing to submit. Only around half the analysts submitted reports. If submitters were, on average, more capable, the impact of SWARM would be understated; conversely, if those submitting reports were less capable, the impact of SWARM would be exaggerated.
The net impact of these design flaws is unclear. Our view is that the d = 1.37 figure should be treated only as indicating that the true effect size is probably large by conventional standards (i.e., .8 or greater; Cohen, 1988).
Research question 2: analysts versus non-analysts (General Public)
A surprising result in this study was the apparent superiority of QofR of reports produced by GP on SWARM over that of reports produced by professional analyst teams (OA and PA combined).Superficially, it seems that barely trained members of the public can outperform professionals at analytic reasoning on realistic intelligence-type problems. Such a conclusion would be premature. Incidental factors may explain the apparent superiority of the GP teams. For example, the GP teams were larger, on average, than the analyst teams and they invested considerably more hours per report.
Setting aside the comparison with analysts, our results establish that it is possible to get very good analytic reasoning from people recruited through social media, assigned randomly into large groups, given very basic training, and offered no payment or other extrinsic reward. Some implications of this are discussed briefly below.
Research question 3: attitudes to SWARM
The mean SUS score of 61.1 was in line with our preregistered hypothesis that users would rate SWARM as having high marginal (60+) or greater usability. Comparing with the benchmark data reported in Kortum and Bangor (2013), the SUS scores from our participants indicate that SWARM is approximately as usable as Microsoft Excel but much less so than other widely used systems such as Microsoft Word, Gmail, and the Amazon website. Since the version of SWARM used in our study was essentially a research prototype, this evaluation is promising, even as it highlights the considerable room for improvement.
Of more interest is participants’ attitudes to SWARM as a way to improve analytic reasoning. The data shown in Figure 4 suggest that participants generally felt that SWARM enabled them to produce better reasoning, which broadly agrees with the picture painted by the QofR results.
Note, however, that both the SUS and exit survey data may be biased in favor of a positive attitude toward SWARM, because participants who disliked SWARM or found it unhelpful may have been more likely to drop out without completing the exit surveys.
The data suggest that the GP participants looked on SWARM more favorably than did the professional analysts, particularly those on organizational teams. We speculate that this is due in part to the professional analysts already having toolsets they standardly use for tackling the kinds of problems posed in the challenge. Some of the major differences between SWARM and these familiar toolsets may be experienced negatively, at least initially.
Participation
The overall picture for participation on SWARM is, on average, about a third of participants were active on any given problem; participation decreased steeply at first then monotonically over remaining weeks; and some people participated far more than most others. This might seem disappointing, if you assume that, ideally, everyone in the study would be quite active. In fact we think that these patterns suggest that teams on SWARM actually were falling into a groupsourcing version of crowdsourcing as described in Section Crowdsourcing in SWARM. In almost all cases, teams managed to deliver a report, whose quality was on average much better than those of the professional analysts using more normal methods. This was achieved by starting with large groups, out of which much smaller groups spontaneously emerged for each problem.
Teams on SWARM put far more time into their reports than analysts using more normal methods (indeed, the estimates earlier suggest this difference is around an order of magnitude). This was expected. Recall that, earlier, we mentioned the potential for a crowd to put much more effort into a task as the first of two reasons to think that crowdsourcing might help improve intelligence reports, if the problem of coordinating that effort can be solved. Broadly, our results suggest that the coordination problem can in fact be solved. That said, two important issues arise. One is whether and how much crowdsourcing on SWARM improves quality over and above using normal methods for a similar amount of time. Our view is that the mere fact of additional effort could account for some of the difference in quality, but not all of it. General theoretical considerations and our own empirical findings in this study, both described elsewhere in this paper, point toward the SWARM approach playing a positive role. However, it would require a further study or studies, of different design, to get a more accurate fix on the relative contributions here.
The second important issue is whether crowdsourcing is a practical way to improve QofR in the intelligence workplace, given how much more effort it apparently requires. This is addressed below.
Interface use
The data on interface use described in Section Interface use suggested that teams were in fact taking advantage of the major features of SWARM intended to support Contending Analyses, and that doing so was conducive to better QofR in their final output. We did some supplementary analysis to further explore whether the use of Contending Analyses was contributing to QofR. The essence of Contending Analyses is trying out multiple different ways of thinking about a problem. Genuinely different ways of thinking ought to be reflected in differences in the wording of draft Reports. We found a weak positive correlation between the extent to which a team’s draft Reports were differently worded and the QofR score for their final Report. [Specifically, we calculated difference in wording between any two Reports using Cosine Difference, which can be understood as a distance measure between texts treated as “bags of words.” The average Cosine Difference between any two Reports produced by a team for problem, normalized [i.e., divided] by the length of the Reports, was used as the “text diversity” measure. A linear regression analysis of the text diversity against the final QoR score found an R-squared of 0.19 [p < 0.0001].] Thus, teams tend to perform better not just when they generate more draft Reports, but also when those draft Reports are more different from each other. In other words, the platform does appear to be supporting Contending Analyses, which does appear to improve QofR.
Limitations
Our study has several limitations in addition to those discussed. Ideally we would have conducted a randomized controlled trial, in which professional intelligence analysts are randomly assigned to either tackle all problems with normal approaches or tackle them all as teams on SWARM. When designing the study, we estimated that we would struggle to recruit enough analyst teams because the normal approaches would be less attractive than working on a new platform. Consequently we designed the study so that all analysts were able to use SWARM, but only after completing a problem using normal methods. This had drawbacks including the learning confound described earlier.
Another limitation is that the study does not enable us to estimate the extent to which various aspects of SWARM contributed to the gain in performance relative to normal methods. For example, as described in Section SWARM interface, anonymity on SWARM is intended to mitigate biases and unhelpful personal interactions. To estimate whether this feature in fact improves QofR, we could conduct an experiment using teams on SWARM with an without anonymity. However, many of SWARM’s most important aspects, such as Contending Analyses, make their impact in conjunction with other aspects, such as SWARM’s user interface and Lens Kit. Teasing out the various causal contributions would require a much larger study, or set of studies, with more complex design.
Our study compared reports produced by large groups on SWARM with reports produced by individuals or small groups using normal approaches. It might be claimed that our results are therefore confounded by group size differences. However, CREATE’s conjecture is that a suitable combination of crowdsourcing and SATs can substantially improve analytic reasoning relative to standard practice. This experiment tests that conjecture. As mentioned in Section Crowdsourcing, we interpret “crowdsourcing” as using a relatively large and unstructured group. The larger group size in SWARM teams is an essential element of the hypothesis we have been testing. That said, SWARM facilitates interactions between participants with a particular approach, outlined earlier. It remains to be seen whether the performance gains on SWARM for such problem types can be matched by interacting groups of similar size, working on a generic collaboration platform such as Microsoft Teams.
Another concern is the degree of similarity between the normal methods used by our participants and those used in real organizations. Any major difference would limit our ability to draw conclusions about the CREATE conjecture. Some considerations suggest that the normal approaches used by analysts in Week 1 would in fact have been close to those used routinely in their organizations. The participants were professional analysts, asked to complete an intelligence-type problem. They were specifically asked to use their normal methods, in a context where they had signed up to participate in scientific research aiming to compare normal methods with a new approach. They had sufficient time, could work however or wherever they wanted, and were invited to collaborate with others.
That said, the fidelity to normal approaches in intelligence organizations was surely imperfect. One key difference is likely to be the level of input from others. Intelligence reports are typically circulated to others for review, whether informally or as part of coordination processes or managerial review, with the goal of improving the quality of the report generally and its analytic reasoning in particular. Our survey data indicated that the analysts in our study mostly worked alone on their Week 1 report. These points suggest that real reports in an intelligence organization would have better analytic reasoning than the Week 1 reports in our study.
Various other limitations also hamper our ability to make strong inferences about the likely performance gains in the intelligence workplace.
The analysts in our sample were all volunteers, and so may differ from intelligence analysts generally. Analysts who self-select for a research study involving exercises on a new platform such as SWARM might be more likely than others to use the platform well and show larger gains due to use of SWARM than less adventurous colleagues.
Only about half of our analysts worked in intelligence specifically.
The fictional problems we used, while intentionally diverse, might differ in crucial ways from the problems analysts usually encounter.
The context is different. Analysts under the pressures and expectations of real work may perform better than analysts in a low-stakes research exercise.
Implications
While acknowledging these limitations, we think this research has implications for the intelligence community. First, our finding that crowdsourcing on SWARM produced substantially better reasoning than analysts using (something like) their normal methods lends early support to the CREATE conjecture that substantial gains in analytic reasoning might be obtained by using systems integrating crowdsourcing with appropriate SATs. This implies more broadly that substantial improvements in intelligence reports may still be achievable, contrary to the pessimism expressed in Lowenthal and Marks (2015).
Second, intelligence managers should consider how they might modify existing practices to take advantage of the process at the heart of SWARM, namely Contending Analyses. This approach differs from what we have called “normal methods” (see Section SATs in SWARM) in that it requires the development of separate analytic “takes” on a problem, with the most promising being selected by the group for further development. SWARM offers one way to support this approach, but imaginative redesign of practices and creative redeployment of existing tools might result in satisfactory alternatives.
Our finding that members of the public recruited via Facebook can produce intelligence-type reports showing high-quality analytic reasoning has implications for the management of intelligence analysis. The GP teams in our study may have benefited from having greater cognitive diversity than the analyst teams. Recall that one underpinning for the CREATE conjecture was the idea that more diverse groups may produce better reasoning. Professional analysts are the output of organizations’ extensive and rigorous selection, development, and promotion processes. These processes may inadvertently filter for people who think in similar ways and reinforce this similarity through training and enculturation. It may be worthwhile for managers to explore whether such filters exist and how a more diverse analytic workforce can be accommodated.
Another implication is that intelligence agencies should explore ways to exploit the latent analytic power of the public. In related work, our team has been exploring the emerging phenomenon of citizen intelligence, which we define as intelligence-type work done by citizens operating outside the traditional intelligence ecosystem, and the opportunities and problems this may present for intelligence agencies (van Gelder et al., 2019). One of the opportunities may be supplementing in-house analytic capability by involving crowds of citizen analysts using open-source information. This would obviously require a suitable crowdsourcing system and careful consideration of (a) appropriate analytic challenges and (b) potential problems which might arise, such as attempts by hostile parties to provide false information or deliberately biased analyses.
Future Work
We will be continuing to develop SWARM, retaining its essential design, but extending or modifying it in various ways. In particular we will be reshaping the platform for use in the intelligence workplace, based in part on human factors research (McNeese et al., 2015) and in situ trials. Both will be conducted in collaboration with intelligence organizations.
As part of its normal operation, SWARM logs the activity of users, generating large datasets which can be used to understand how users and groups behave and interact on the platform. We have begun combining the 2018 Challenge user activity data with our other data sources (QofR scores, survey answers) to elucidate the factors which contribute to strong performance (Schwarz et al., 2020) and plan to continue this line of inquiry with current and future datasets. Insights from this research will inform redesign of SWARM.
The extent to which an upgraded platform improves analytic reasoning must be rigorously evaluated. We therefore intend to conduct further studies broadly similar to the one described here, but taking steps to negate or mitigate some of the limitations described above. In addition, we hope to conduct experiments within one or more intelligence agencies, directly comparing the SWARM approach with normal approaches on real intelligence problems.
We earlier noted that reports produced on SWARM, while being much better in quality, also took far more effort to produce. This raises the question of whether the SWARM approach would be viable in real intelligence workplaces with their severe resource constraints. We think it is too early to take a stand on this. We need further research to clarify key issues. One line of research would try to assess just how much more demanding the SWARM approach would actually be, in the full context of real intelligence work. The SWARM approach might not be as costly as it seems. For example, spending additional hours producing better reports might save considerable time and effort in internal review processes. A second line of research would explore ways to make SWARM more efficient. Our team already knows of many potential ways to enhance efficiency; these need to be implemented and tested.
Footnotes
Acknowledgments
This research is based upon work supported in part by the Office of the Director of National Intelligence (ODNI), Intelligence Advanced Research Projects Activity (IARPA), under Contract 2017-16122000002. The views and conclusions contained herein are those of the authors and should not be interpreted as necessarily representing the official policies, either expressed or implied, of ODNI, IARPA, or the U.S. Government. The U.S. Government is authorized to reproduce and distribute reprints for governmental purposes notwithstanding any copyright annotation therein.
Author Biographies
Tim van Gelder is an Enterprise Research Fellow, and director of the Hunt Laboratory for Intelligence Research, at the University of Melbourne. He obtained his PhD in philosophy from the University of Pittsburgh. He is an applied epistemologist with experience developing methods and tools for improving reasoning, critical thinking, and collective intelligence in both educational and workplace contexts.
Ariel Kruger is a postdoctoral researcher at the University of Melbourne and team leader in the Hunt Lab. He obtained his PhD in philosophy from the University of Melbourne in 2018, focusing on the corroboration of causal explanations. His research includes investigating the use of narrative reasoning in intelligence analysis, team dynamics and their relationship to good reasoning, and the effectiveness of structured analytic techniques.
Sujai Thomman is community manager and a research manager with the Hunt Lab at the University of Melbourne. His focus is on large-scale participant recruitment and achieving high levels of engagement in cognitively demanding research.
Richard de Rozario is an Enterprise Research Fellow, and director of analysis in the Hunt Laboratory for Intelligence Research at the University of Melbourne. He previously performed scenario analysis and quantitative modeling of extreme risks, such as cybercrimes and pandemics. He studied computer information systems in the United States, holds a postgraduate diploma in market modeling, and completed his PhD at the University of Melbourne in applied ontology.
Elizabeth Silver is a data scientist at Silverpond, specializing in causal inference from observational data. Previously she was a Research Fellow at the University of Melbourne working on analytics for the SWARM Project. She obtained her PhD in logic, computation, and methodology and her Masters in machine learning from Carnegie Mellon University.
Morgan Saletta is a philosopher of science and technology. He studied anthropology at the Ecole Des Hautes Etudes En Sciences Sociales before moving to Melbourne and completing his PhD in history and philosophy of science. His current research includes narrative reasoning in intelligence analysis, social cognition, and the geopolitics of information technologies, social media, and space.
Ashley Barnett is a PhD student at the University of Melbourne researching the evaluation of arguments.
Richard O. Sinnott is the director of eResearch at the University of Melbourne and professor of applied computing systems. He has a PhD in computing science, an MSc in software engineering, and a BSc in theoretical physics (hons). He has over 400 peer-reviewed publications across a range of computing and application-specific domains. He teaches high-performance computing and cloud computing at the University of Melbourne.
Glenn Tesla Jayaputera is the deputy director of Melbourne eResearch Group—the University of Melbourne. He received PhD degree in computer science, MSc (by research) in computer science, and B.AppSci (Comp. Sci). He has spent 30 years of his career in industry and academia sectors. He has abundant experience in developing and managing software development. His research interests are in the area of distributed artificial intelligence and autonomous software agent systems.
Mark Burgman is director of the Centre for Environmental Policy at Imperial College London and editor-in-chief of the journal Conservation Biology. Previously, he was Adrienne Clarke Chair of Botany at the University of Melbourne, Australia.