
Abstract
The current study examined the effects of security score framing, time pressure, and brand familiarity on mobile application choices. Past research has found the framing of safety versus risk scores affects how potential risks for mobile apps are communicated to users. Both time pressure and brand familiarity have been shown to affect consumers’ purchase behaviors but not yet for app-selection decisions. The current study examined the effects of time pressure and brand familiarity on the effectiveness of risk displays (framed as safety or risk) for mobile apps. Participants were shown screenshots of various apps with these factors manipulated, and they were to choose one out of six apps. Our findings indicate that users rely heavily on brand familiarity when choosing apps, which could lead to insecure decisions. Additionally, security scores guided app choices toward more secure apps when framed as safety than when framed as risk, although this advantage was only evident without time pressure and disappeared under time pressure. The design implications call for more careful screening and user education about the potential risks associated familiar apps, as well as the need of new security design solutions to help users under time pressure.
Introduction
The ubiquity of smartphones and their contained applications (apps) cannot be disputed, with an estimated 6.26 billion smartphone users worldwide as of 2021 (Statista Research Department, 2022) as well as an estimated 3.5 million android apps and 2.2 million for iOS available as of August 2022 (Ceci, 2022). With this large numbers of mobile users and apps, it is critical that users choose the apps that not only function as expected and provide satisfactory user experience (Liu et al., 2021; Park et al., 2013) but also are secure to use. Unfortunately, there are apps that gather user data through illegal or unethical practices, enabled in part by imperfect screening of apps and a lack of consumer scrutiny (Price, 2018). On the one hand, app stores should strive to better screen apps; on the other hands, users can be better informed to make secure decisions regarding the apps they choose to download onto their devices. These types of decisions can be fostered through effective communication of the potential risks associated with mobile apps to the users (Chen, 2020; Chen et al., 2015; Kang et al., 2015).
Users’ decision making can be influenced by various factors. We identified factors that are potentially influential and directly manipulable in mobile apps, which are closely relevant to the majority of the population. These factors include how information is framed (Kahneman & Tversky, 1979; Tversky & Kahneman, 1981), the presence of time pressure (Saqib & Chan, 2015; Young et al., 2012), and brand familiarity (Baker et al., 1986). The current study aimed to examine these factors for mobile app selections to inform risk display designs, with a goal to bolster secure user decision making.
Risk Communication for Mobile Apps
The number of mobile apps downloaded by users has steadily increased over the past few years, reaching 255 billion worldwide in 2022 (Ceci, 2023). There is an average of 2,453 new apps released per day in the Google Play Store and 1,277 in the Apple App Store in 2023. Users have different motivation while using their mobile devices (42matters, 2023a, 2023b). For apps to function properly, they may need access to various sensors and information within a device, such as location, contacts, and the camera (Felt et al., 2012). While certain permissions, such as location for GPS navigation apps, are legitimate when required for the app to function, others may be unrelated to the app’s function. For instance, there are apps that may use the data for ulterior motives or sell data to third parties (Vidas et al., 2011), or gather such information when the app is not actively in use (Nakashima, 2018).
Given the gravity of such data abuse, it is concerning that smartphone users tend not to investigate or fully understand permissions requested by the apps when downloading new apps (Benton et al., 2013; Chin et al., 2012; Felt et al., 2012; Kelley et al., 2012). Although both Android and iOS provide some safeguards in the format of app permissions, smartphone users often ignore or are unaware of permission settings (Almuhimedi et al., 2015; Baarslag et al., 2016; Kang et al., 2015; Tay et al., 2021). One way to educate and empower users is to provide them with simple, explicit displays of risks for mobile apps (Chen et al., 2014, 2015; Choe et al., 2013). These studies have proposed designs for security scores that summarize the safety or risk associated with apps, based on their permission requests. This approach is expected to reduce risky, uninformed app choices and increase more secure choices. However, the framing of such information is of vital importance: whether the system should utilize a safety score (the greater the score, the more secure the app) or a risk score (the greater the score, the less secure the app) (Chen et al., 2015; Chong et al., 2018).
Past research on the risk displays for mobile apps has suggested that the framing of the risk information can influence users’ app-selection behaviors (Chen et al., 2015; Chong et al., 2018; Rajivan & Camp, 2016). For example, Chen and colleague (2015) included a summary risk/safety rating for each app and showed that the rating influenced app selection. They also found that compared to the risk framing, the safety framing was more effective, in terms of eliciting more choices of more secure apps. Rajivan and Camp (2016) and Chong and colleagues (2018) also found that, beyond positively framing a security system with safety scores, users can be influenced to make more secure decisions when primed to think about cyber security prior to choosing an app. In addition, Rajivan and Camp (2016) tested the effectiveness of different iconography on promoting safe decision making, and they found that images of locks resulted in the safest choices, likely due to the familiarity of the icon and existing mental models for lock icons used in web browsers to denote security.
Effects of Time Pressure on Decision Making
Time pressure can affect the way people make decisions by inducing a sense of urgency when attempting a task (Klapproth, 2008; Liu et al., 2016; Young et al., 2012). The general decision-making literature has examined the effect of time pressure on risk taking for decades, yet with a plethora of competing findings. For example, Ben Zur and Breznitz (1981) showed that, under time pressure, participants were risk averse with hypothetical gambles and focused on the negative aspects of each gamble. Similarly, El Haji and colleagues (2016) showed that, compared to no time pressure, people are less likely to bid on a lottery (i.e., more risk averse) under time pressure. On the other hand, Chandler and Pronin (2012) found that, after being prompted to read sentences at a fast pace, participants were more risk-seeking when completing the Balloon Analogue Risk Task (BART) than their slow-paced counterparts. Similarly, Madan and colleagues (2015) showed that participants under time pressure were more risk-seeking in a gambling task. Given these mixed results, further research is needed to understand the influence of time pressure on risky decisions for decisions.
In consumer decision-making literature, Wright’s (1974) foundational research showed that, under time pressure, consumers tend to emphasize negative traits of a product. Since then, other research in various shopping contexts suggests that manipulations of time pressure, such as via scarcity of products (Devlin et al., 2007; Soliman, 2017) or length of sale (Aggarwal & Vaidyanathan, 2003), can dictate the strategy with which consumers approach purchases (Chowdhury et al., 2009; Vlašić et al., 2011) and their acceptance of risk (Shehryar, 2008). Indeed, time pressure has been shown to impact the ability of consumers to investigate product information (Kardes et al., 2006; do Prado & Lopes, 2016) and reduces the amount of time they spend browsing unfamiliar products (Liu et al., 2017). A recent study using eye-tracking measures also showed that participants made faster decisions with fewer eye fixations when making purchases under time pressure, and five-star rating products were chosen more often under time pressure (Ammons et al., 2022).
For mobile app downloads specifically, there has been limited research or report on the scenarios in which users install apps under time pressure or how time pressure affects users’ app choices. Time pressure was manipulated in an online study, where users were displayed with a free app with advertisements and a paid app without advertisements (Dinsmore et al., 2021). The researchers manipulated time pressure through instructions conveying a limited amount of time and a visible clock ticking off 30 seconds while participants viewed descriptions of the two apps. They found that under time pressure, participants had a stronger preference of the paid app when it is presented first than when it is presented second, and this effect was affected by perceived risks associated with the decision. A study on manipulative design features in video games for children found that time pressure induced in-app purchases or prolonged gameplay in about 28% of the game apps studied (Radesky et al., 2022). The researchers found that apps leverage visual indicators to convey scarcity of time, using countdown indicators or messages such as “Limited time only!” This finding is consistent with a recent study that conducted interviews on users in emerging countries and identified time-limited offers to be one of the main drivers of in-app purchase (Buzulukova & Kobets, 2022).
Effects of Brand Familiarity on Consumer Behavior
As previously mentioned, threats to mobile users can come in a variety of forms, from a variety of sources. While some lesser-known developers have been caught writing malware into their apps (Price, 2018), more familiar developers may also choose to collect and sell user data to third parties (Wong, 2019). Both forms of exploitation are cause for concern but may be represented differently in the minds of users, with more familiar apps seeming more innocuous (Harris et al., 2016). Indeed, brand familiarity both increases brand satisfaction, and drives purchase behaviors (Baker et al., 1986; Ha & Perks, 2005; Menon & Kahn, 2003). Brand familiarity also reduces the time that consumers spend when shopping, indicating a reduction in the need for information search (Biswas, 1992). Stocchi and colleagues (2019) studied the motives behind using branded mobile apps, and found that branded apps will have greater usage if they are viewed as protecting users’ privacy and supporting what they do. Pasaribu and colleagues (2013) conducted a survey and found consumers’ attitude toward online advertising and brand recognition on social media affected purchase intention. A recent study by Kumar and Tuli (2021) explored how and why users engage with branded mobile apps. They found that privacy and security, as well as brand-related aspects (e.g., popularity and reputation) of an app were among the main reasons for users’ cognitive and affective engagement with the app. However, this finding was based on subjective reports in user interviews.
To date, though, few studies have examined the effect of brand familiarity on the summary security scores proposed by previous studies (Chen et al., 2014; Chen et al., 2015; Choe et al., 2013). However, previous literature shows a strong effect of brand familiarity on purchase intentions in more general consumer domains (Laroche et al., 1996; Park & Stoel, 2005). Therefore, because of the effect brand familiarity has on purchase intentions, it is expected that brand familiarity may be influential in guiding app choice.
Current Study
The current study aimed to further investigate the security score display proposed by Chen and colleagues (2015), the role that time pressure plays in the decision-making process, and the degree to which brand familiarity predicts app-selection preferences. Most of the previously listed literature on mobile app decisions (Chen et al., 2015; Chong et al., 2018; Gates et al., 2014; Rajivan & Camp, 2016) controlled for brand familiarity by removing the top search results from inclusion in the experimental stimuli, and had participants perform the task using as much time as they needed. However, it is realistic that people may install apps under time pressure and that they may be influenced by brand familiarity. For example, a user may be under time pressure to download a cash transfer app (e.g., Venmo) when they need to pay a contractor waiting in their house but have no cash at hand. This critical decision to download this app is certainly under time pressure. Users may also mistrust apps of familiar brands (Baker et al., 1986; Ha & Perks, 2005). To the best of our knowledge, this study is the first to consider time pressure and brand familiarity in mobile app decisions. If time pressure or brand familiarity impacts the decision-making strategies of mobile users when choosing apps like they do in other domains, the design of the previously proposed security scores may need to be reconsidered.
The Pilot
To obtain brand familiarity ratings for the mobile apps used in the main experiment, a pilot study was first conducted by having a total of 287 participants (217 female, 69 male, 1 declined to identify; age M = 21.72, SD = 4.86) rate their familiarity with a series of apps, among other questions. They were recruited from Old Dominion University’s online SONA system and granted partial course credit for their participation. A total of 25 app-function categories with 12 apps for each function were chosen (banking, bowser, dating, drawing, e-reader, fitness, food delivery, games, housing, language, local business reviews, navigation, messaging, money transfer, music, news, notes, PDF scanner, photo editing, ride sharing, shopping, social media, travel, video streaming, weather; see Appendix A). Participants rated the statement of “This app is familiar” on a 7-point Likert scale, with a score of 1 representing Strongly Disagree, 7 representing Strongly agree, and 4 being Neutral. Three app-function category, flashlight, calendar, and clock that were not planned to be used in the main experiment, were used to serve as attentional catch trials, on which participants were instructed to always rate “disagree.” A total of 171 participants correctly answered at least two of the three catch trials “(75% of them answered all three correctly), and participants missed the three catch trials roughly equally. This suggests that participants missed the attention checks not due to one of them being particularly confusing. Data from these participants were used to select the apps. For the 25 app-function categories, the apps with the three lowest scores (M = 1.77, SD = 0.30) and those with the three highest scores (M = 4.83, SD = 0.30) were chosen from each function for use in the main experiment. A one-way ANOVA comparing the lowest versus the highest scores for each app indicated a significant difference between the two app groups, F(1,148) = 423.88, p < .001, ηp2 = .74, MSE = 2.86.
The Main Experiment
During the main experiment, participants were presented with multiple choice screens, each of which contained an assortment of apps including the three least and three most familiar apps for each app-function category identified in the pilot. The independent variables were security framing (between-subjects), security score (within-subjects), time pressure (between-subjects), and brand familiarity (within-subjects). Security scores were framed as either safety using closed locks or risk using open locks, consisting of one, two, three, four, or five locks; safety scores indicated higher levels of security with increasing locks, while risk scores indicated lower levels of security with increasing locks. The brand familiarity scores were determined before the experiment by the pilot study, which were not shown to the participants. The dependent variable was app choice. Based on prior studies, the main hypotheses of the current study were generated as follows. While other main effects and interaction effects could be interesting, we did not have specific hypotheses regarding them, but included them in the analyses for exploration.
For the main effect of security scores on app choice, increases in safety scores would positively predict app choice, such that, with each additional lock, a participant would be more likely to choose an app; conversely, increases in risk scores would negatively predict app choice, such that, with each additional lock, the app would be less likely to be chosen (Chen et al., 2015; Chong et al., 2018; Rajivan & Camp, 2016).
For the main effect of brand familiarity on app choice, brand familiarity would positively predict app choice, with less familiar apps having a lower likelihood of being chosen, due to a greater sense of trust born out of familiarity (Ha & Perks, 2005).
For the interaction between security framing and security score on app choice, the security scores under the safety frame would be more impactful on app choice (i.e., more secure apps would be chosen more often and less secure apps would be chosen less), while security scores under the risk frame were expected to less clearly guide decision making, possibly due to a confusion of the score’s meaning (Chen et al., 2015).
For the interaction between brand familiarity and time pressure, compared to participants without time pressure, the association between brand familiarity and likelihood of being chosen would be stronger for those under time pressure. This result was expected due to browsing behaviors shown by Liu and colleagues (2017), wherein participants under time pressure focused more on familiar brands with greater observation durations and counts than on their competitors.
There would be an interaction between security scores and brand familiarity on app choice. Based on the strong effect of brand familiarity (Ha & Perks, 2005), it was expected that the effect of security score on the likelihood of an app being chosen would be stronger for apps with lower brand familiarity than for those with higher brand familiarity. In other words, participants would be more reliant upon safety (risk) scores for apps with lower brand familiarity ratings than the more familiar apps. However, the lack of literature on this interaction made this hypothesis exploratory.
There would be an interaction between security score and time pressure. Because there has been no direct research on how time pressure would affect the effect of security scores, this hypothesis was based on Ammons and colleagues’s (2022) finding that five-star rating products were chosen more often under time pressure. An assumption was that the security scores would work similarly to user ratings when the latter was controlled during the experiment. It was expected that participants would choose apps with higher security scores more often with time pressure.
Method
Participants
A total of 128 participants (51 females, 77 males; age M = 40.96, SD = 12.25) were recruited via Amazon’s Mechanical Turk (MTurk) and were compensated $1 each for their participation. The MTurk participants were required to live in the United States of America and to have a 95% approval rate of their prior Human Intelligent Tasks (HITs) in order to ensure quality data collection (see Peer et al., 2014 for recommended qualification requirements). This study was approved by the Institutional Review Board of Old Dominion University.
Materials
The study was hosted and accessed via Qualtrics. Devices were controlled such that only laptop or desktop computers could be used; this ensured the proper display of the stimuli. For the app download screens, the design replicated the desktop version of the Google Play Store at the time of the study (July, 2020) with additional manipulations for the purpose of this study. Participants were instructed to choose apps as if they were for their own device. On each trial, participants were shown six apps displayed on one screen. The function of the apps varied from trial to trial, from social media to note-taking to weather apps, but the apps on each trial had the same function. Participants were informed that the app information displayed in the study were hypothetical. Each app had a user rating (controlled at four stars for all apps) and a security score (randomized across apps), framed as risk or safety. The apps were displayed in two rows of three apps, and the position of the apps on the screen was randomized across the six positions.
At the end of the experiment, an exit survey examined participants’ subjective reasoning for app choice and thoughts regarding the experiment. The survey consisted of rationale questions for app selection, the CyberDOSPERT (Kharlamov et al., 2018), a question that asked the meaning of the locks, a color-blindness question, Likert-scale questions regarding cybersecurity expertise, and an open-ended prompt for additional feedback.
Design of Experiment
The independent variables included brand familiarity (low, high), security framing (risk, safety), security score (one, two, three, four, or five locks), and time pressure (present, absent). Security framing and time pressure were between-subjects, and security score and familiarity score were within-subjects. This design led to four experimental groups, with 32 participants in each group. Brand familiarity was determined based on the data obtained in the pilot study, and the three apps with the lowest scores and three with highest scores for each of the 25 app-function categories used in the pilot were chosen to represent apps with low or high familiarity. Among the 25 categories, “drawing” was randomly chosen to be used on an attentional check trial, and the remaining 24 on experimental trials. The attentional check trial intended to consist of five apps with low brand familiarity and low (high) safety (risk) scores and one app with high brand familiarity and a high (low) safety (risk) score, and participants were expected to choose the one familiar, secure app among the less familiar, riskier options. However, due to a programming error, the safety/risk scores were distributed as other apps (randomly assigned as 1, 2, 3, 3, 4, and 5 for each of the 6 apps), so this attentional check did not work as expected (see Results).
The security scores were framed as risk or safety and consisted of colored locks (see Figure 1). The safety score was represented by the number of teal, locked locks, and the more locks represented more security; the risk score was represented by pink, unlocked locks, and the fewer locks represented more security. The use of locks was inspired by the design of Rajivan and Camp’s (2016) study. The risk and safety scores were inversions of each other (e.g., a risk score of two would be a safety score of four). Security framing was manipulated by presenting either the safety or risk scores using locks (see Figure 1). Those in the safety frame saw scores represented by one to five closed, teal locks, and those in the risk frame saw scores represented by one to five open, pink locks. Teal and pink coloring were chosen because they are not only discernible for those with red-green color blindness, but also similar to green and red, which have associated “go and stop” meanings (Bergum & Bergum, 1981). Among the six apps on each trial, five possibilities of the scores were presented during each trial and the middle scores (three locks) represented twice. A safety score of 5 represented by teal, locked locks (top row), and a risk score of 5 represented by pink, unlocked locks (bottom row). Safety/risk scores ranged from 1 to 5 in the experiment; more locks represented more safety/risks.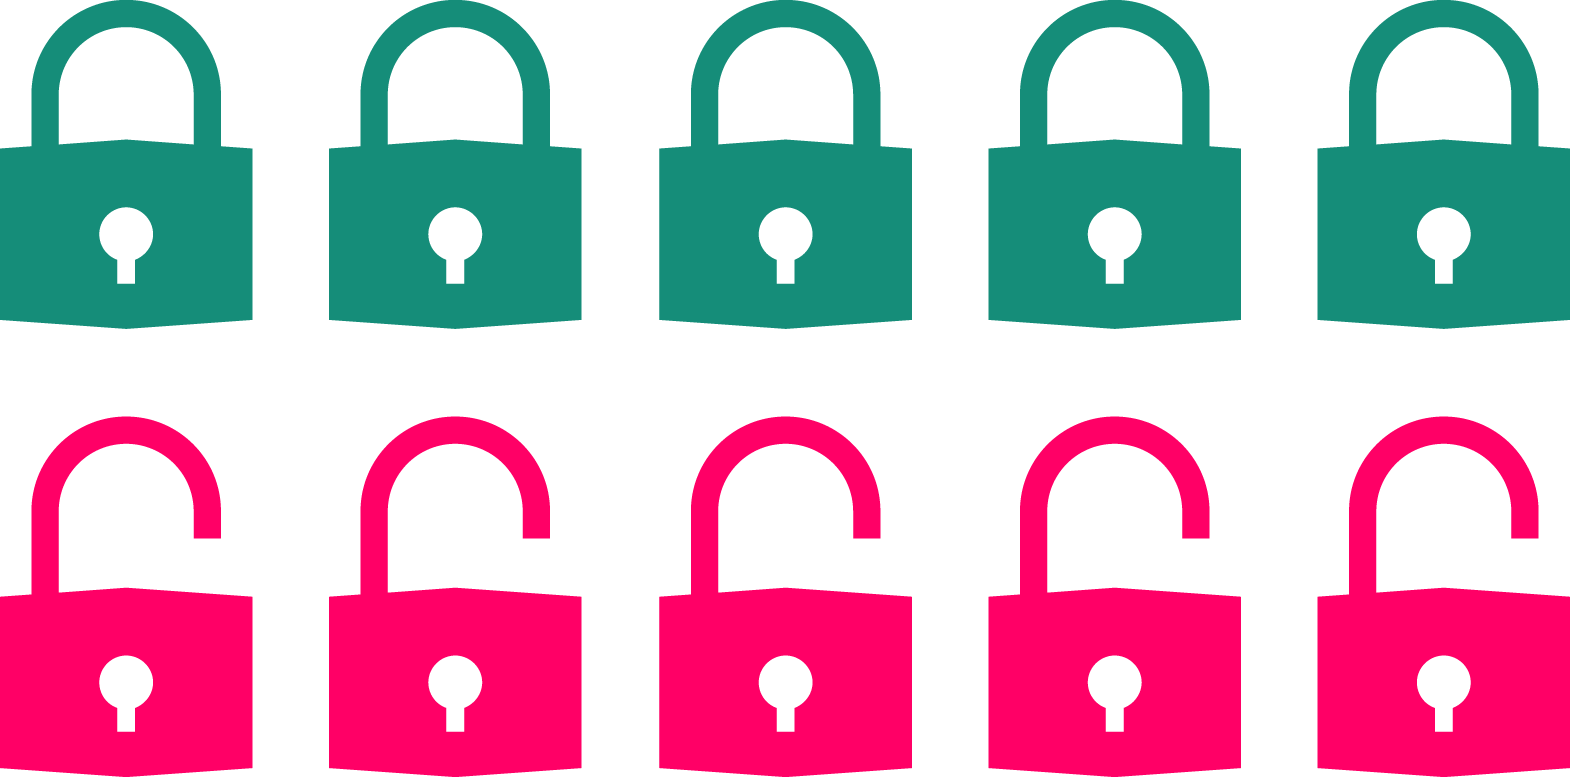
Time pressure was manipulated similarly to the Dinsmore and colleagues’ (2021) study mentioned in Introduction. A countdown timer was included above the app options for those in the time-pressure condition, whereas this countdown timer was absent for those in the non-time-pressure condition. In addition, in the instructions, those in the time-pressure condition were told to make decisions quickly within the time provided on the countdown timer, whereas those in the non-time-pressure condition were told to take as long as necessary to make their decisions. The time allotted for each trial in the time-pressure condition was equal to the mean decision time of that trial in the non-time-pressure conditions (see Chen & Proctor, 2017). Finally, user ratings were controlled by assigning a rating of four stars across all apps to minimize their effect on app choices.
Because risk-taking behaviors were the focus of this study, the main dependent variable was whether an app was chosen. Choices on all six apps were recorded, five of which had a dependent variable value of 0 (not chosen), while one was coded as a 1 (chosen). We also measured decision times for the purpose of validating the time-pressure manipulation. The decision time on a trial was recorded from the beginning of the trial until participants clicked a button to advance the page.
Procedure
The first half of the participants were assigned to the non-time-pressure condition and the second half to the time-pressure condition, because the countdown times for the time-pressure condition were based on data from the non-time-pressure condition. Data for both conditions were collected within the same week. For both the time-pressure and non-time-pressure groups, each participant was randomly assigned to one of the two security framing conditions (safety, risk). At the beginning of the experiment, participants were shown an instruction screen containing the different elements on the screen as well as corresponding explanations. Different from those in the non-time-pressure condition, participants in the time-pressure condition were instructed to make their decisions within the time provided in the countdown timer.
On each trial, participants were instructed to choose an app as if selecting an app for their personal mobile device. If a participant under time pressure took longer to make a decision than the time provided by the timer, the timer ended and showed feedback asking them to respond faster (about 14% of total trials). Participants’ choice was still recorded in this case. This setting allowed for full data collection and was expected to still induce time pressure despite the lack of consequence for slow responses. Participants performed 24 experimental trials; this number of trials was modeled after that was used by Schuster and colleagues (2015), though the current study added one attentional check trial. After completing all 25 trials, participants completed the exit survey, described in Materials, and were compensated.
Results
App Choice Data
Two participants’ choice data were excluded from the analysis due to incomplete data acquisition in the demographics portion of the experiment (1.6% of total participant data). Due to the programming error in the attentional check trial, no data were excluded based on this trial, with the caveats discussed in the limitations of this study. Additionally, the trial containing the weather apps failed to collect choice data for 19 participants (0.63% of the decision data); all other data for these 19 participants were included in the analysis.
A generalized linear mixed-effects regression (GLMER) with the random intercept effects for participants and app function was used in R to analyze the choice data (Baayen et al., 2008; Chen et al., 2018). Participant and app function were included as random factors in an initial analysis, but only app function served as a random factor in the reported analysis due to the random factor variance for participants being zero. Demographic information was included in the model as predictor variables to ensure there were no confounding variables that predicted app choice. None of the demographic information significantly predicted choice, ps > .05.
The Generalized Linear Mixed-Effects Regression (GLMER) and Likelihood Ratio Tests LRT Results.
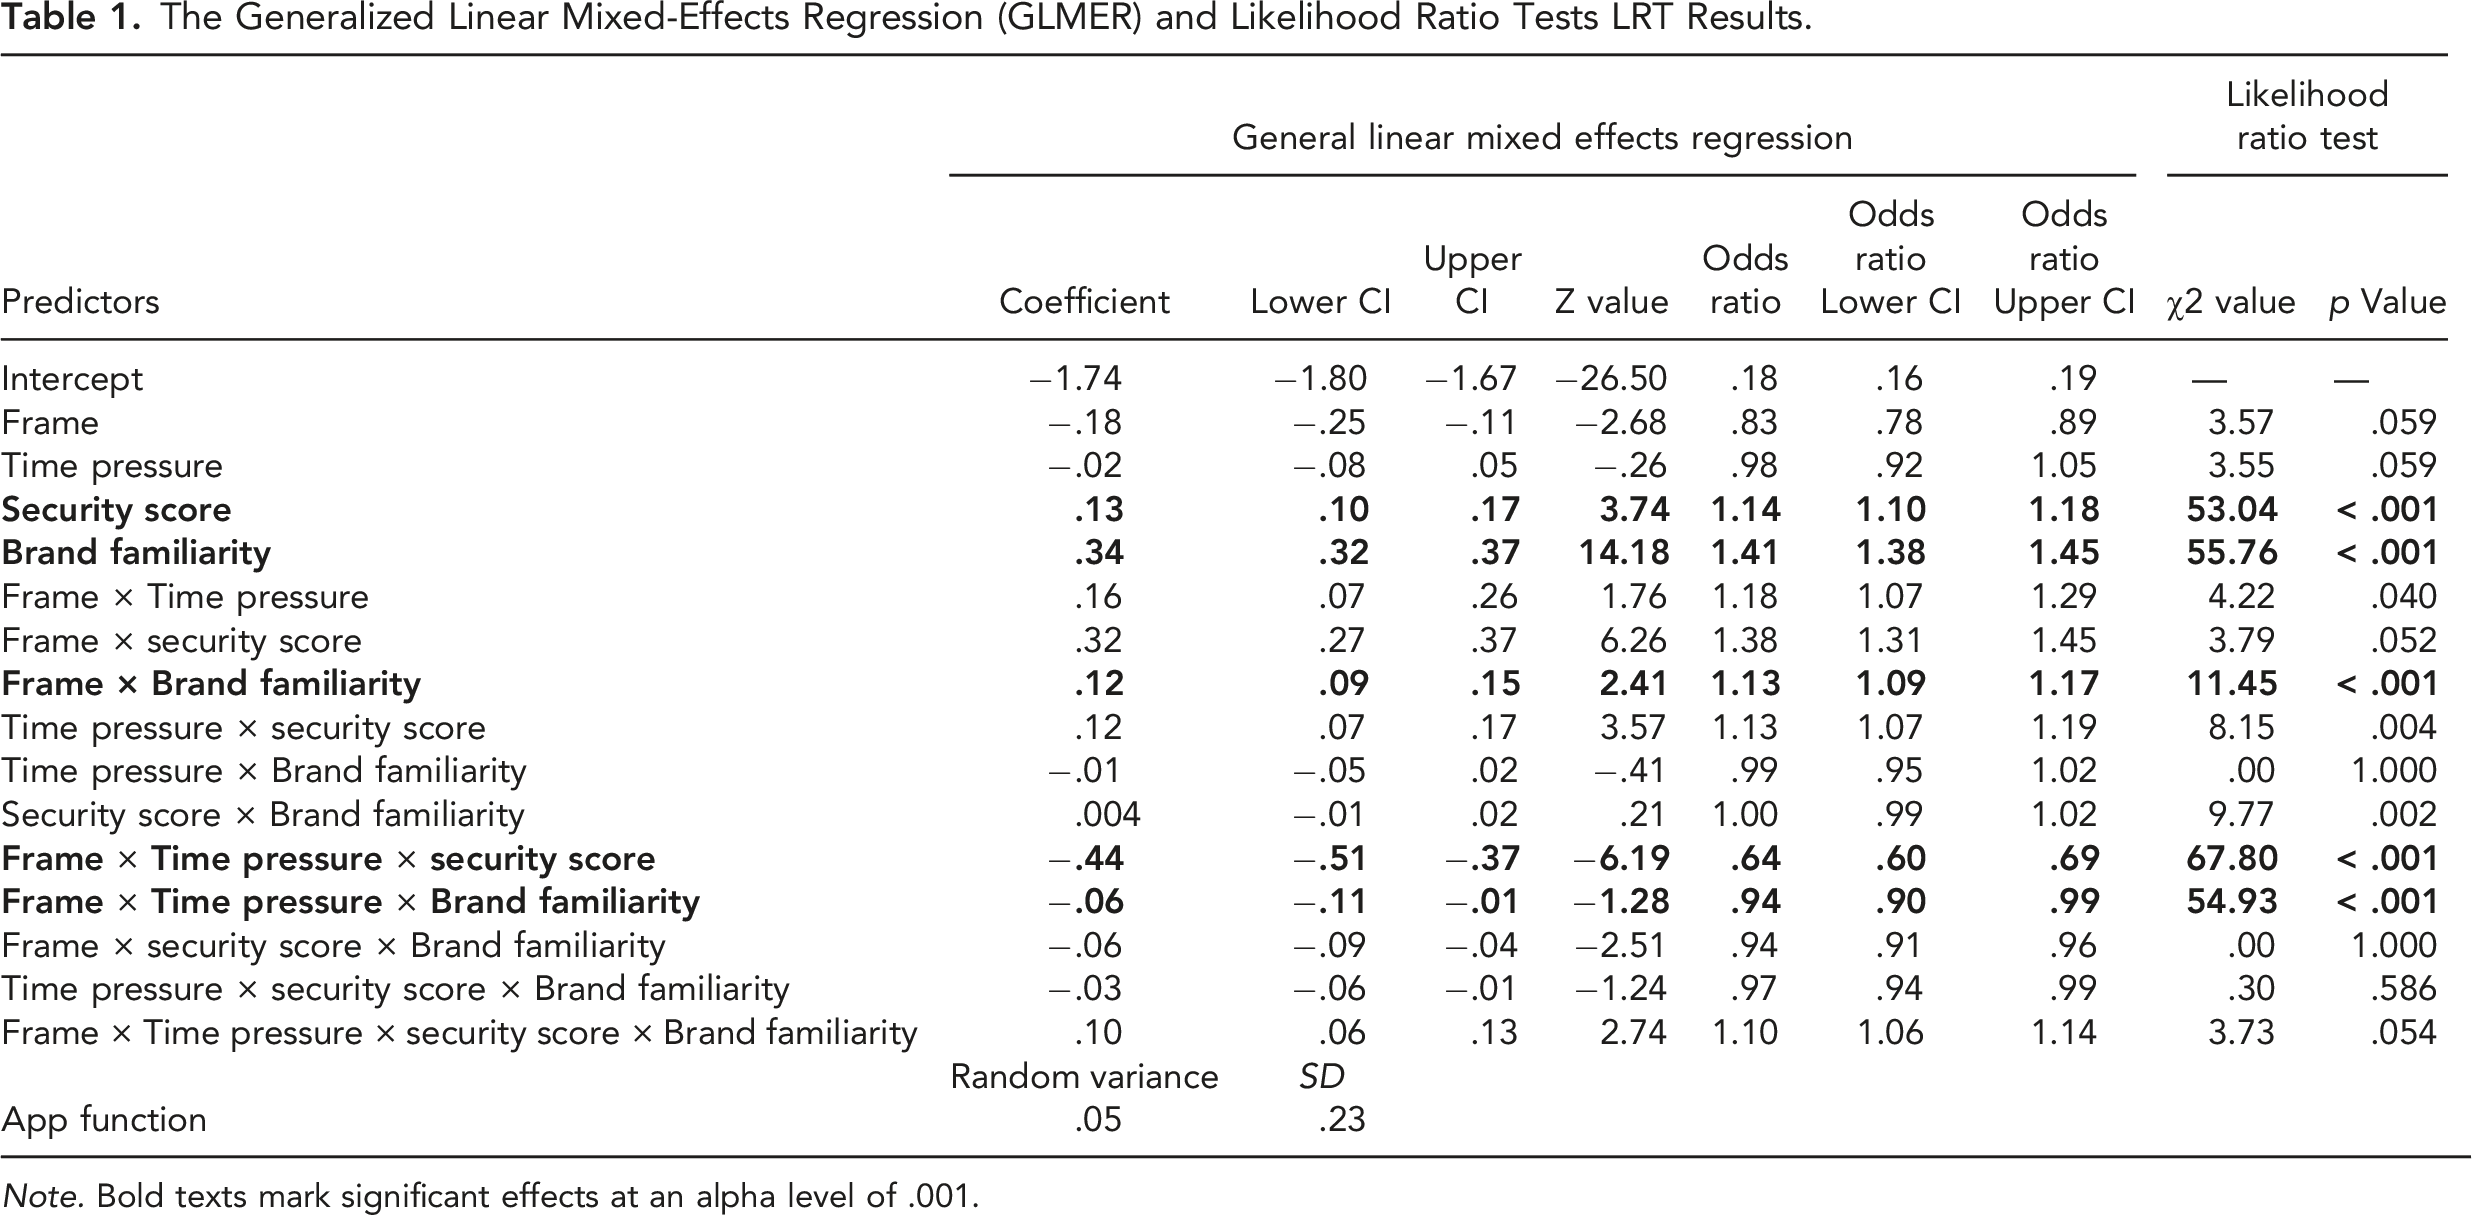
Note. Bold texts mark significant effects at an alpha level of .001.
Of importance to the study at hand, security scores were a significant predictor of choice (see Figure 2), supporting Hypothesis 1, χ2(1) = 53.04, p < .001; the coefficient was .13, with a 95% confidence interval (CI) of [.10, .17]. The mean percentage of an app with a security score of 1, 2, 3, 4, or 5 being chosen was 14.8%, 14.0%, 13.4%, 15.7%, and 28.7%, respectively. When transformed from a log likelihood into an odds ratio of 1.14 with a 95% CI of [1.10, 1.18], the model predicted that, with each additional (reduced) safety (risk) lock, users are on average 1.14 times more likely to choose a given app. The effect of brand familiarity on app choice. Note. The main effect of brand familiarity was significant; the interaction between brand familiarity and time pressure was not significant.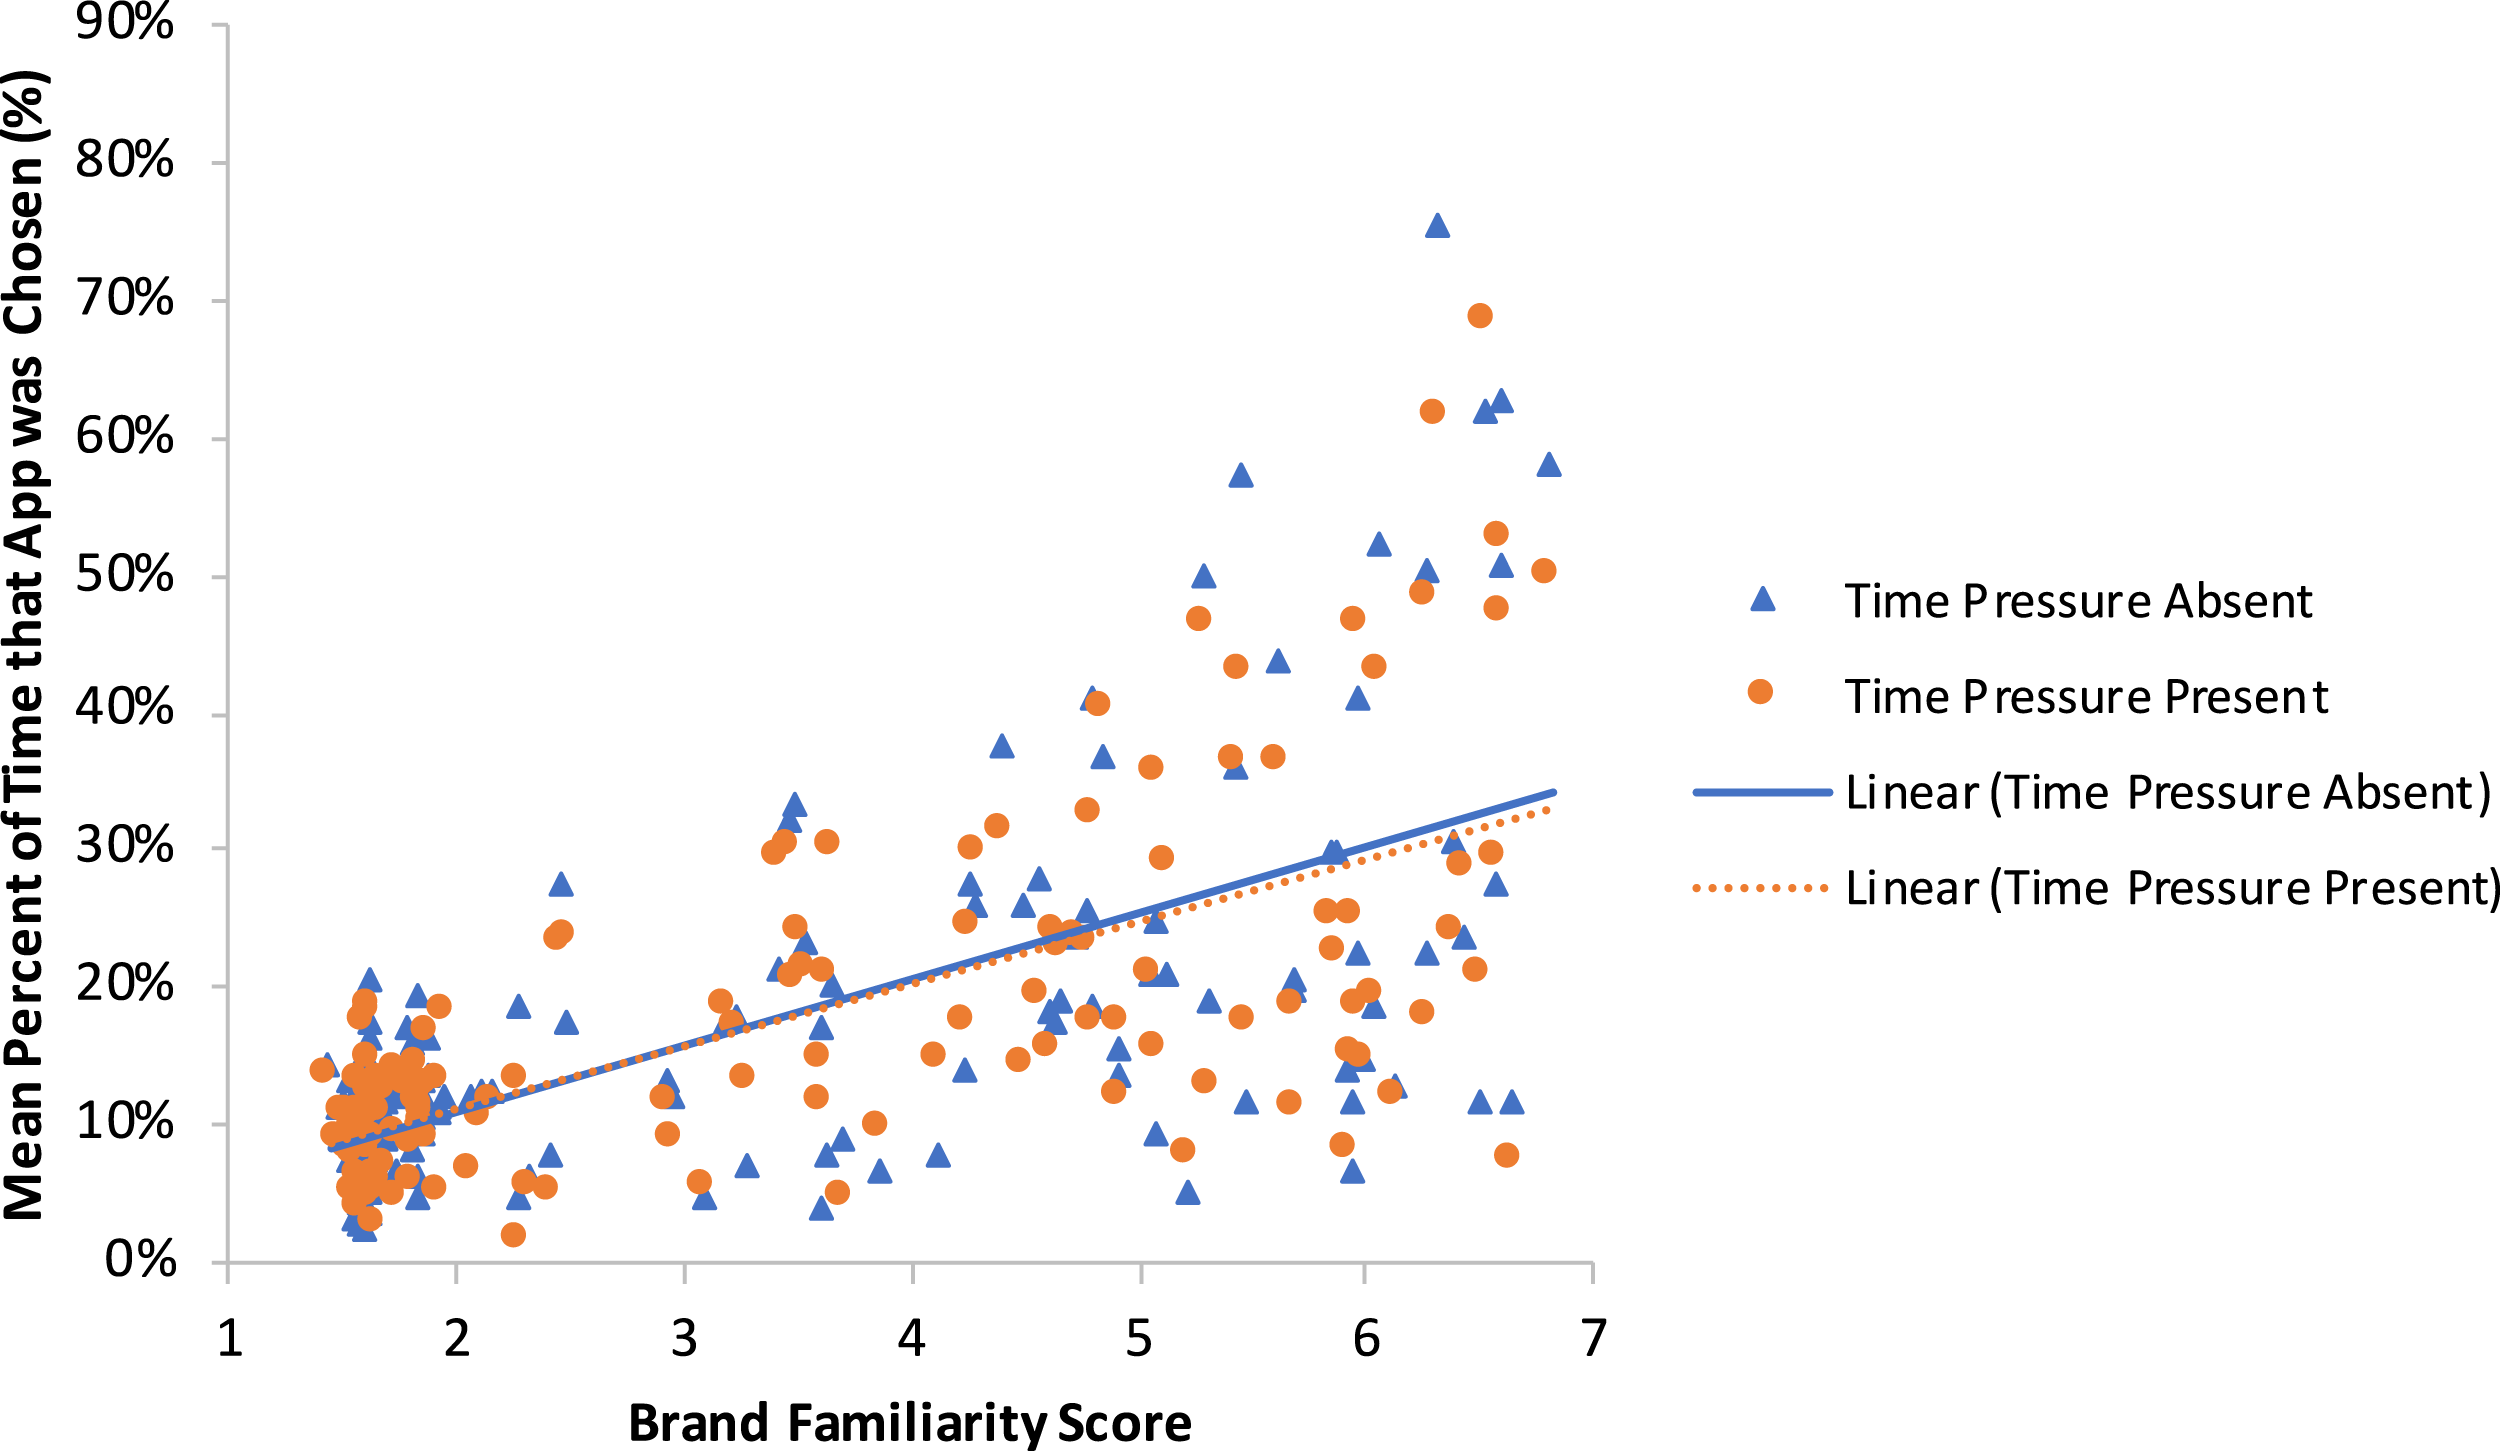
Brand familiarity was a significant predictor of app choice (see Figure 2), χ2(1) = 55.76, p < .001; the coefficient was .34 with a 95% CI of [.32, .37], with more familiar brands being chosen more often, supporting Hypothesis 2. Transformed into an odds ratio, this means that, with each increasing unit of brand familiarity score (out of 7 total), users were 1.41 times more likely to choose a more familiar app, with a 95% CI of [1.38, 1.45].
Conversely, the interaction between security scores and framing did not significantly predict app choice (see Figure 3), not supporting Hypothesis 3, χ2(1) = 3.79, p = .052; the coefficient was .32, with a 95% CI of [.27, .37]. Note that the result pattern was in the same trajectory as prior studies (Chen et al., 2015; Chong et al., 2018), with safety framing tending to have a stronger effect (indicated by a steeper slope of the safety line) than risk framing on choice. One reason for the nonsignificant finding for the interaction between security scores and framing could be because this analysis averaged data across the time-pressure conditions. The effect of the interaction between security scores and frame on app choice. Note. This interaction effect was not significant. Error bars represent 95% between-subjects confidence intervals. Security Score 1 = Safety Score 1 or Risk Score 5, Security Score 2 = Safety Score 2 or Risk Score 4, Security Score 3 = Safety Score 3 or Risk Score 3, Security Score 4 = Safety Score 4 or Risk Score 2, Security Score 5 = Safety Score 5 or Risk Score 1.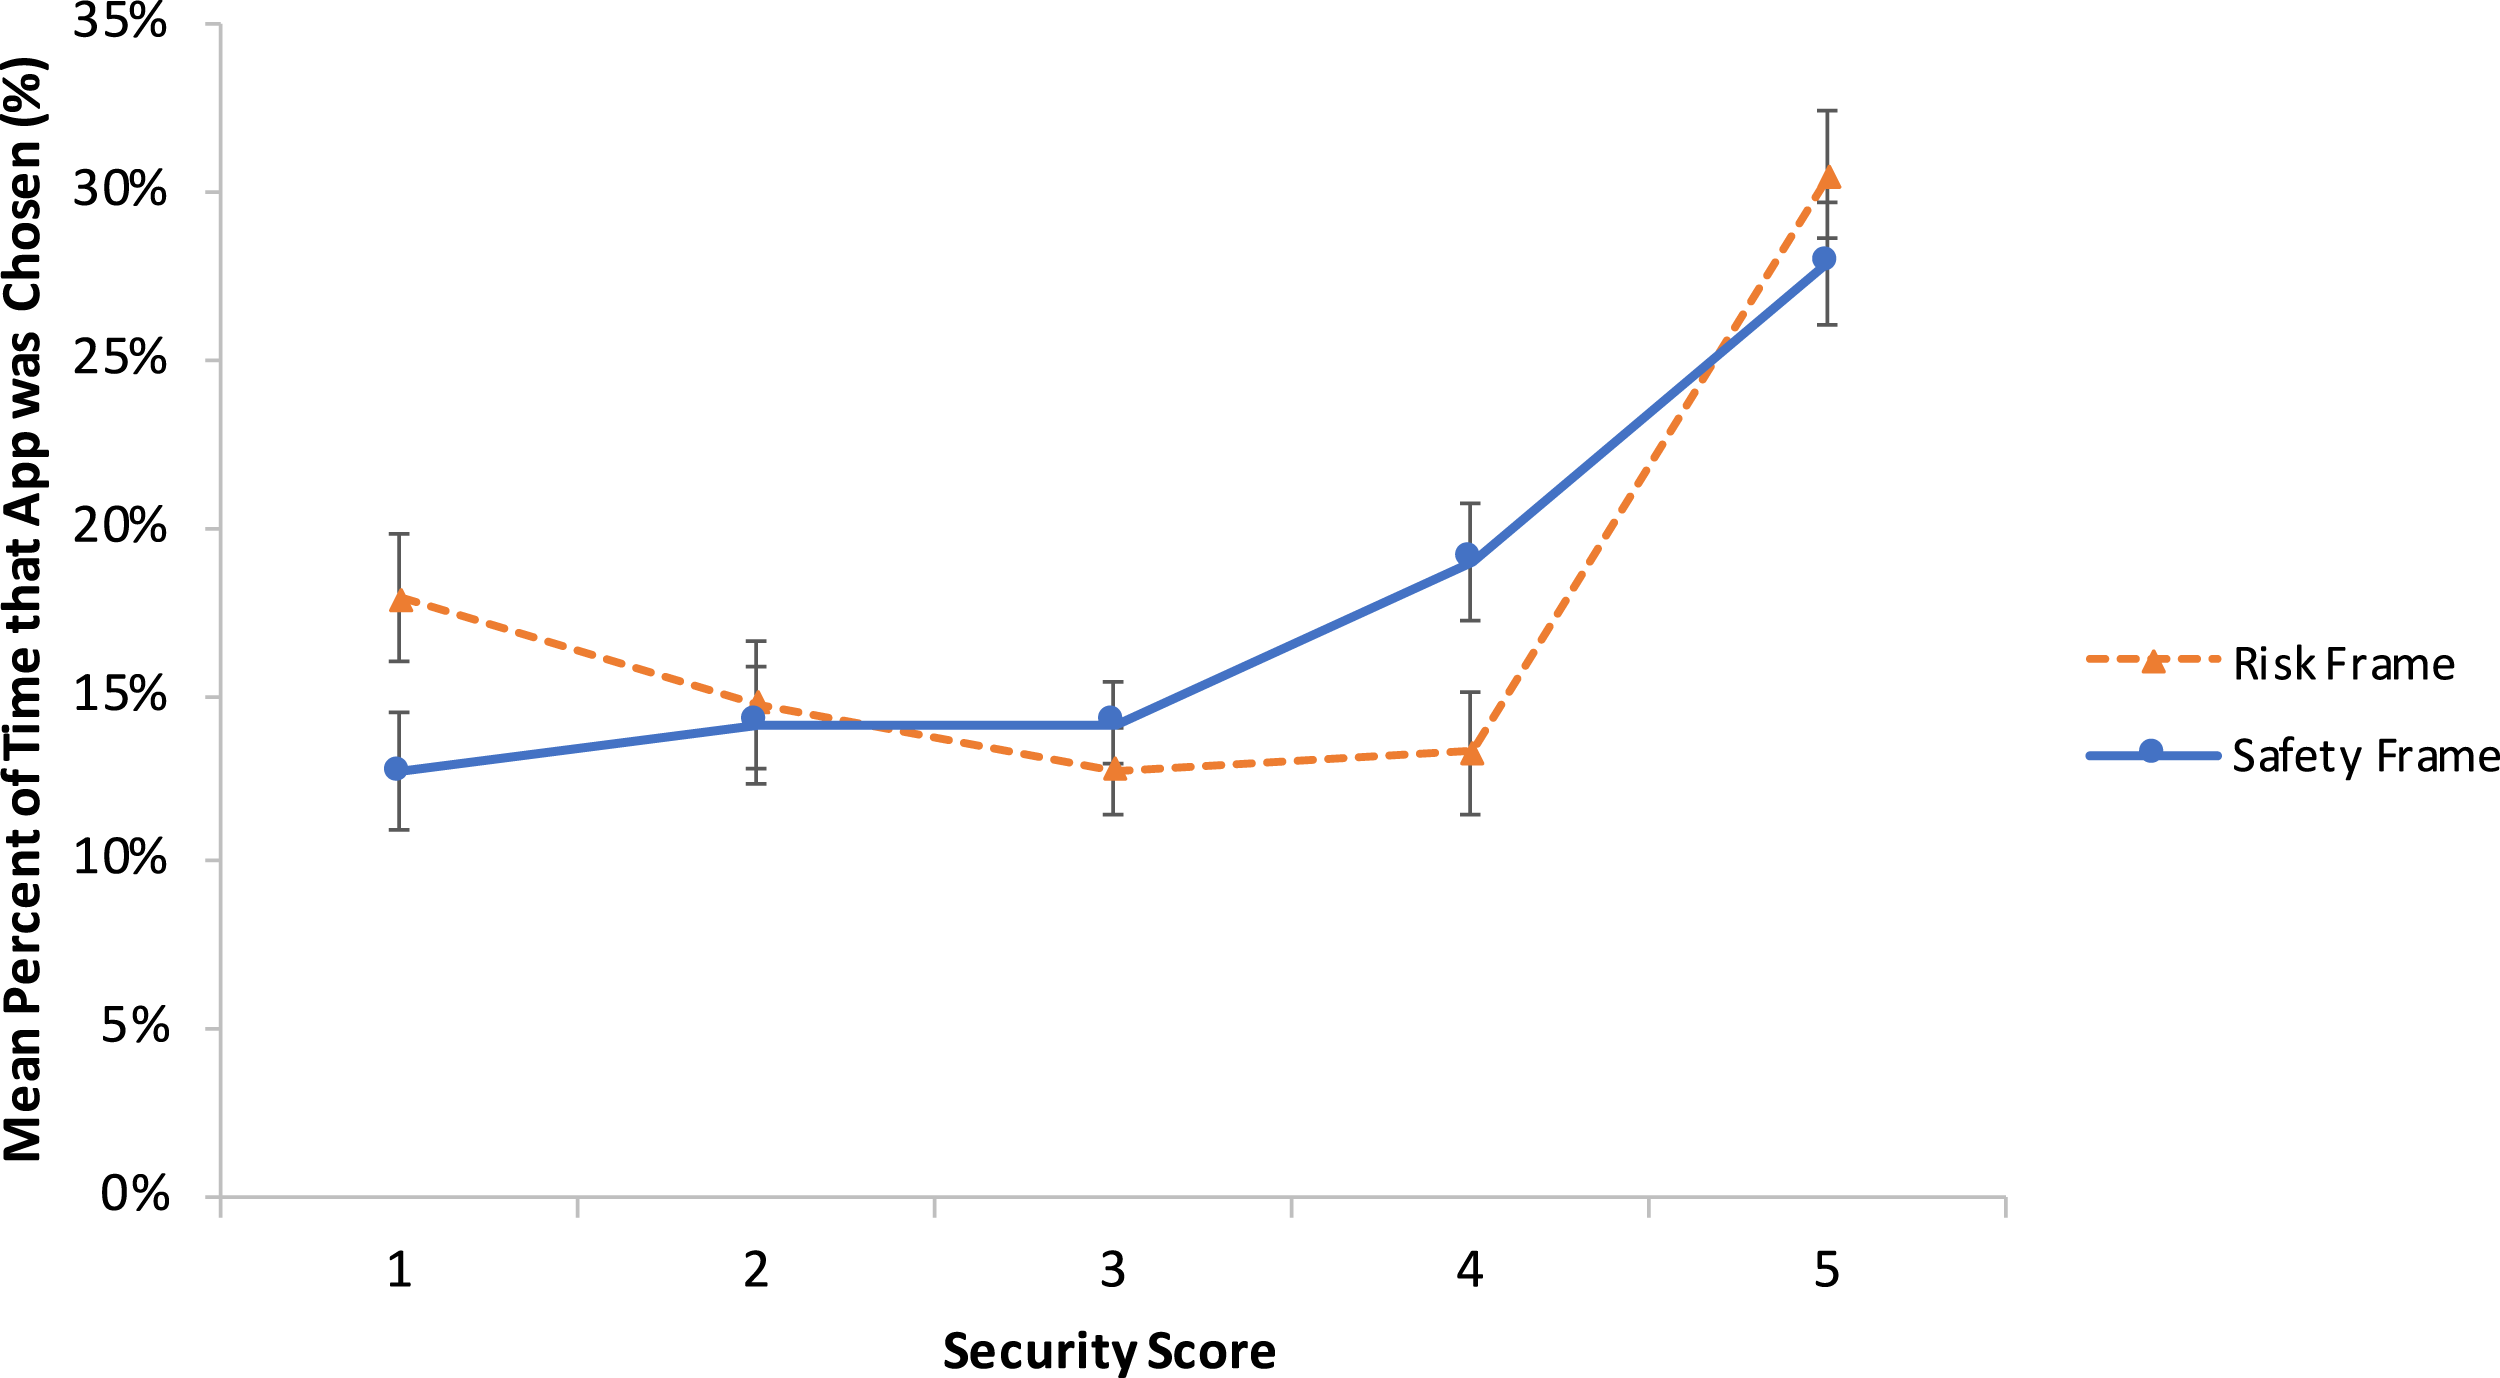
In addition, the interaction between brand familiarity and time pressure did not significantly predict choice (see Figure 2), χ2(1) < .01, p = 1.000; the coefficient was −.01 with a 95% CI of [−.05, .02], not supporting Hypothesis 4. This result may be due to a ceiling effect, wherein familiar brands were already chosen so often under no time pressure that there was little room for participants to choose them even more frequently under time pressure.
The interaction between security scores and brand familiarity did not quite attain the .001 α level (see Figure 4), χ2(1) = 9.77, p = .002; the coefficient was .004 with a 95% CI of [−.01, .02]. In addition, the trend was not in the direction that Hypothesis 5 predicted, but rather indicates that, with increasing brand familiarity, participants tended to be more likely to use the security scores in their decision making. This difference between security score effectiveness as brand familiarity increased could be due to the overall low percentage at which low-familiarity apps were chosen, but suggests that security scores could, in fact, guide consumer purchases with familiar apps. The effect of the interaction between security scores and brand familiarity on app choice. Note. This interaction effect was not significant.
Similarly, the interaction between security scores and time pressure did not quite attain the .001 α level (see Figure 5), χ2(1) = 8.15, p = .004; the coefficient was .12 with a 95% CI of [.07, .17]. That said, the results were not in the direction anticipated by Hypothesis 6; under time pressure, participants tended to be less likely to select apps with higher security scores than participants who did not experience time pressure. The effect of the interaction between security scores and time pressure on app choice. Note. This interaction effect was not significant. The error bars represent 95% between-subjects confidence intervals. Security Score 1 = Safety Score 1 or Risk Score 5, Security Score 2 = Safety Score 2 or Risk Score 4, Security Score 3 = Safety Score 3 or Risk Score 3, Security Score 4 = Safety Score 4 or Risk Score 2, Security Score 5 = Safety Score 5 or Risk Score.
Interestingly, while neither the 2-way interaction between security scores and framing nor that between security scores and time pressure were significant on their own, the 3-way interaction between time pressure, security framing, and security scores was a significant predictor of app choice (see Figure 6, χ2(1) = 67.80, p < .001; the coefficient was −.44, with a 95% CI of [−.51, −.37]. To determine what was driving the significance of the three-way interaction, a post-hoc pairwise comparison with a Bonferroni correction was conducted using estimated marginal means for the interaction between security score and frame for the presence and absence of time pressure, respectively. Without time pressure, the log contrast estimate for the interaction between security score and frame was .18, z = 2.67, SE = .06, p < .001. However, with time pressure, the log contrast estimate was .01, z = .27, SE = .06, p = .785. Therefore, participants that were not under time pressure relied more heavily on safety scores than risk scores (See Figure 6, left panel), whereas those under time pressure did not utilize the safety scores differently from the risk scores (see Figure 6, right panel). The effect of the interaction between security scores, security frame, and time pressure on app choice. Note. The three-way interaction was significant. The error bars represent 95% between-subjects confidence intervals. Security Score 1 = Safety Score 1 or Risk Score 5, Security Score 2 = Safety Score 2 or Risk Score 4, Security Score 3 = Safety Score 3 or Risk Score 3, Security Score 4 = Safety Score 4 or Risk Score 2, Security Score 5 = Safety Score 5 or Risk Score.
Decision Time Data
A two-way ANOVA was conducted on decision time, with time pressure (present, absent) and security framing (risk, safety) as between-subjects factors. Distribution of the decision times was not normal, but skewed right and leptokurtic. This means that participants generally made decisions quickly, though there were a few very slow decision times. To account for this lack of normality and extremely slow times, decision time data were winsorized (Wilcox, 2005) at the fifth and ninety-fifth percentiles; that is, data points outside these percentiles were transformed to be equal to these percentiles, reducing the number of extreme decision times. A total of 6.25% of the decision time data were winsorized to fit within the defined range. Decision times were then log-transformed (natural log) for analysis; note that the reported means and standard deviations are winsorized decision times (in seconds) rather than log-transformed values for the purpose of easier understanding.
The ANOVA revealed a significant main effect of time pressure, F(1, 3196) = 487.32, p < .001, ηp2 = .13, with participants under time pressure making faster decisions (M = 4.87 s, SD = 3.07 s) than those without time pressure (M = 8.35 s, SD = 7.06 s), indicating the validity of the time-pressure manipulation in the experiment. Additionally, the main effect of security framing was significant, F(1, 3196) = 7.80, p = .005, ηp2 = .002, with those in the safety framing condition making faster decisions (M = 6.31 s, SD = 4.48 s) than those in the risk framing condition (M = 6.99 s, SD = 6.88 s). Note that the faster decision time for safety-framed locks, as a proxy for ease of use, mirrors the pattern of the interaction between security scores and security framing for the app choice data. This combination of both faster and more secure choices for the safety framing suggests a strong effect of the safety framing on guiding decision making with reduced cognitive effort. The interaction between time pressure and framing was not significant, F(1, 3196) = 1.38, p = .240, ηp2 < .01.
Rationale and Perception Data
Participants’ post-experiment rationale for app choice was analyzed using Cochran’s (1950) Q test, because participants could choose multiple reasons. There was a significant difference in the frequencies of the various reasons being chosen by participants, χ2(3) = 46.61, p < .001. Brand familiarity and security rating were selected as the most influential factor of app choice with 45% and 44% of participants, respectively; user ratings was chosen by 38% of participants, and 8% of participants indicated that icon look and feel was important, while no participants selected the other option. A pairwise post-hoc Dunn test with Bonferroni corrections was conducted to further investigate the differences between these options; only icon look and feel differed significantly from the other choices (brand familiarity, security ratings, user ratings; ps < .001), whereas all other pairwise comparisons were not significant ps > .100.
Privacy concerns were measured via an open-ended question, Do you have any privacy concerns regarding mobile applications? Over half (66) of the participants expressed specific concerns (e.g., misuse of personal data, unnecessary permissions, tracking location, accessing camera), 6 participants expressed general concerns of privacy (responses such as yes), 28 participants expressed no concerns, and 28 participants either did not respond or did not respond in a meaningful manner. Finally, perceptions of the security locks were also measured via an open-ended question by asking What did the security scores mean? The feedback was generally positive, with several responses complimenting the design of the safety-framed locks overall. Notably, a few of those assigned to the risk frame expressed potential confusion with the design, such that more locks could be misconstrued as greater security. Among those, one participant’s feedback hinted at the stimulus-stimulus compatibility principle (De Houwer, 2003; Kornblum et al., 1990), “I think it’s counter-intuitive and confusing. You should instead [use] closed locks and have more locks [equal] better…You have more stars [equal] better and right underneath, more locks [equal] worse.” Conversely, those in the safety frame described the locks as “intuitive” and a few participants expressed that the design helped them make decisions quickly. Some participants discussed how they would use the security system, “I do like the security lock designs. Even when dealing with brands I knew, it helped remind me of the flaws [inherent] in the brands security. Facebook was a prime example of that.” Other participants seemed less interested in the security scores, “App locks do not [affect] my app choices or concerns. If I like it, I keep it. If I don’t like the app, I delete it.”
Discussion
The current study focused on the effect of security framing, time pressure, and brand familiarity on mobile app choice. These factors have been shown to individually affect purchase behaviors of other products but had not yet been investigated for mobile apps. As such, the current study was the first to investigate the combination of the framing effect of security scores for mobile apps, time pressure, and the effect of brand familiarity.
Past research on mobile app security scores has shown that such a system can assist mobile device users and that certain design considerations are more beneficial than others (Chen et al., 2015; Chong et al., 2018; Rajivan & Camp, 2016). The current study advanced this line of research by examining external factors such as brand familiarity (Baker et al., 1986; Harris et al., 2016) and time pressure (Saqib & Chan, 2015; Young et al., 2012), as well as introducing color-coded locks (Rajivan & Camp, 2016). Indeed, the current study provides further support for the security scores proposed by Chen and colleagues (2015), with safety framing resulting in significantly faster and qualitatively better decisions than the risk framing. It is worth noting that apps with security score of 5 were chosen almost twice as often as those with lower security scores. This result indicates that only the highest security rating had a positive impact on users’ selection of apps. In addition to the behavioral measures, the subjective reports from participants also supported the use of the safety-framed locks over the risk-framed locks. This could be due to the confusing nature of the unlocked locks, as locks typically represent a mental model of safety (Rajivan & Camp, 2016). While the unlocked locks were designed to be as equitable to the locked locks as possible, they may have confounded the understanding of the risk scores themselves.
By introducing the time-pressure condition, which may be experienced by mobile users in the real world, the current study advances the research of mobile app security. In addition to making faster decisions under time pressure (Madan et al., 2015), mobile users appeared to change the approach by which they make decisions under time pressure. Without time pressure, participants under the safety frame made more secure decisions (i.e., choosing higher security score apps more often) than those under the risk frame, consistent with prior research demonstrating the effectiveness of the safety frame (Chen et al., 2015; Chong et al., 2018; Rajivan & Camp, 2016). However, when there was time pressure, the difference between the safety and risk frames disappeared and both elicited less secure decision by choosing apps with lower safety scores, indicated by the significant three-way interaction between security frame, security score, and time pressure. These results indicate that the previously proposed safety frame of the security scores may not work as effectively under time pressure, which calls for more research and new design solutions to promote secure decision making under time pressure.
Brand familiarity strongly predicted app choice, consistent with prior studies on brand familiarity for other products (Baker et al., 1986; Harris et al., 2016), but this effect was not significantly moderated by time pressure or security score. This result indicates that mobile users are likely to choose familiar apps regardless of time pressure, along with any potential risks associated with such apps. This result may be due to correlation between familiarity and perceived trustworthiness (Ha & Perks, 2005). Therefore, in real-world usage, we can expect that users will gravitate toward familiar apps. The design implications of this finding include the necessity for app stores to better screen apps that users are more familiar with, as well as the need to warn users about the potential risks of familiar apps.
We can expect that in real-world app stores, familiar apps are likely to be chosen far more often than unfamiliar apps. While an obvious point, it is important to note because participants in the study tended to be more discriminatory among the more familiar apps along the security score spectrum. Therefore, the use of the security score in a real app store environment could help users choose an app once they have narrowed their search down to a handful of familiar alternatives. Another aspect of this finding is that when security score was 5, the app was chosen much often than others across the range of the brand familiarity score, as shown by the blue solid line in Figure 4. Apps should still strive for preserving the highest user security, which can be appreciated by the user. This design may further serve users if the brand familiarity scores were then used to compile the most familiar apps for direct comparison along security.
Beyond measuring the behavioral responses to the experiment, the current study also gathered data on participants’ subjective report on their rationale of choosing apps, as well as more general attitudes and perceptions regarding cybersecurity and the security score system. A substantial number of participants expressed concerns for their data and the permissions that apps may request, indicating a potential increase in consumer awareness of the potential threats associated with mobile apps compared to past research (Benton et al., 2013; Chin et al., 2012; Felt et al., 2012; Kelley et al., 2012). In addition, participants’ suggestions and feedback regarding the security scores supported the behavioral measures of the effectiveness of the safety frame. These findings should be considered for future research and design for the security display in question.
While the current study is the first to examine the effects of brand familiarity and time pressure on mobile app choices with security scores, there are a few limitations. The pilot study was conducted with college students, whereas the main experiment was with MTurkers. It is likely that the familiarity scores obtained in the pilot may not fully reflect the MTurkers’ familiarity of the apps. The attentional check in the main experiment contained a programming error that led it to be invalid. This led the data to be analyzed without data quality control in this experiment. The results need to be validated in future research with valid catch trials. The risk levels defined in this study have been shown effective in previous studies and followed the general format of widely used user reviewers (i.e., levels 1 through 5). However, it is a simplification of potential app risks and does not specify the types of risks (e.g., privacy violation). A personalized risk display that specifies the risk types that are of most concern to the user (see Chen et al., 2022; Jorgenson et al., 2015) can be incorporated in future research.
Additionally, the use of locks was well accepted by the participants, and the closed locks well represented the mental model of security (Rajivan & Camp, 2016). The current use of unlocked locks in the risk frame may have caused confusion because it used similar iconography. Instead, other iconography that better represents risks can be used, such as crossbones, or X’s. Future research should examine these other symbols for the risk conditions to better bolster the impact of the negative frame so that the comparison against the lock image for the safety frame can be fairer. In addition, given the strong effect of brand familiarity and its interaction with the security score, further research is needed to examine the effectiveness and further design of the security scores when users are interacting exclusively with highly familiar apps. Finally, other measures beyond familiarity may affect users’ decisions, such as the reputation of the product or company, and the category of the app functions. The reputation of a product or company may not always be consistent with their familiarity and security ratings (e.g., users may be very familiar with a company who has bad reputation). People may also weigh security differently if the app has financial functions (e.g., banking, cash payment) than others. It would be interesting to examine how these factors interact and affect users’ decisions.
Conclusion
The current study builds on the prior literature on mobile app security communication (Chen et al., 2015; Chong et al., 2018; Rajivan & Camp, 2016) and supports the adoption of positive framing of security scores for ease of use. However, the current study shows that additional security precautions need to be taken when users are under time pressure or faced with familiar apps. In addition, the use of locks resulted in positive subjective evaluations by the participants and is recommended for future designs.
Footnotes
Acknowledgments
The authors thank Jeremiah Still and Abby Braitman for their helpful comments on an earlier version of this paper.
Declaration of Conflicting Interests
The author(s) declared no potential conflicts of interest with respect to the research, authorship, and/or publication of this article.
Funding
The author(s) received no financial support for the research, authorship, and/or publication of this article.
Appendix
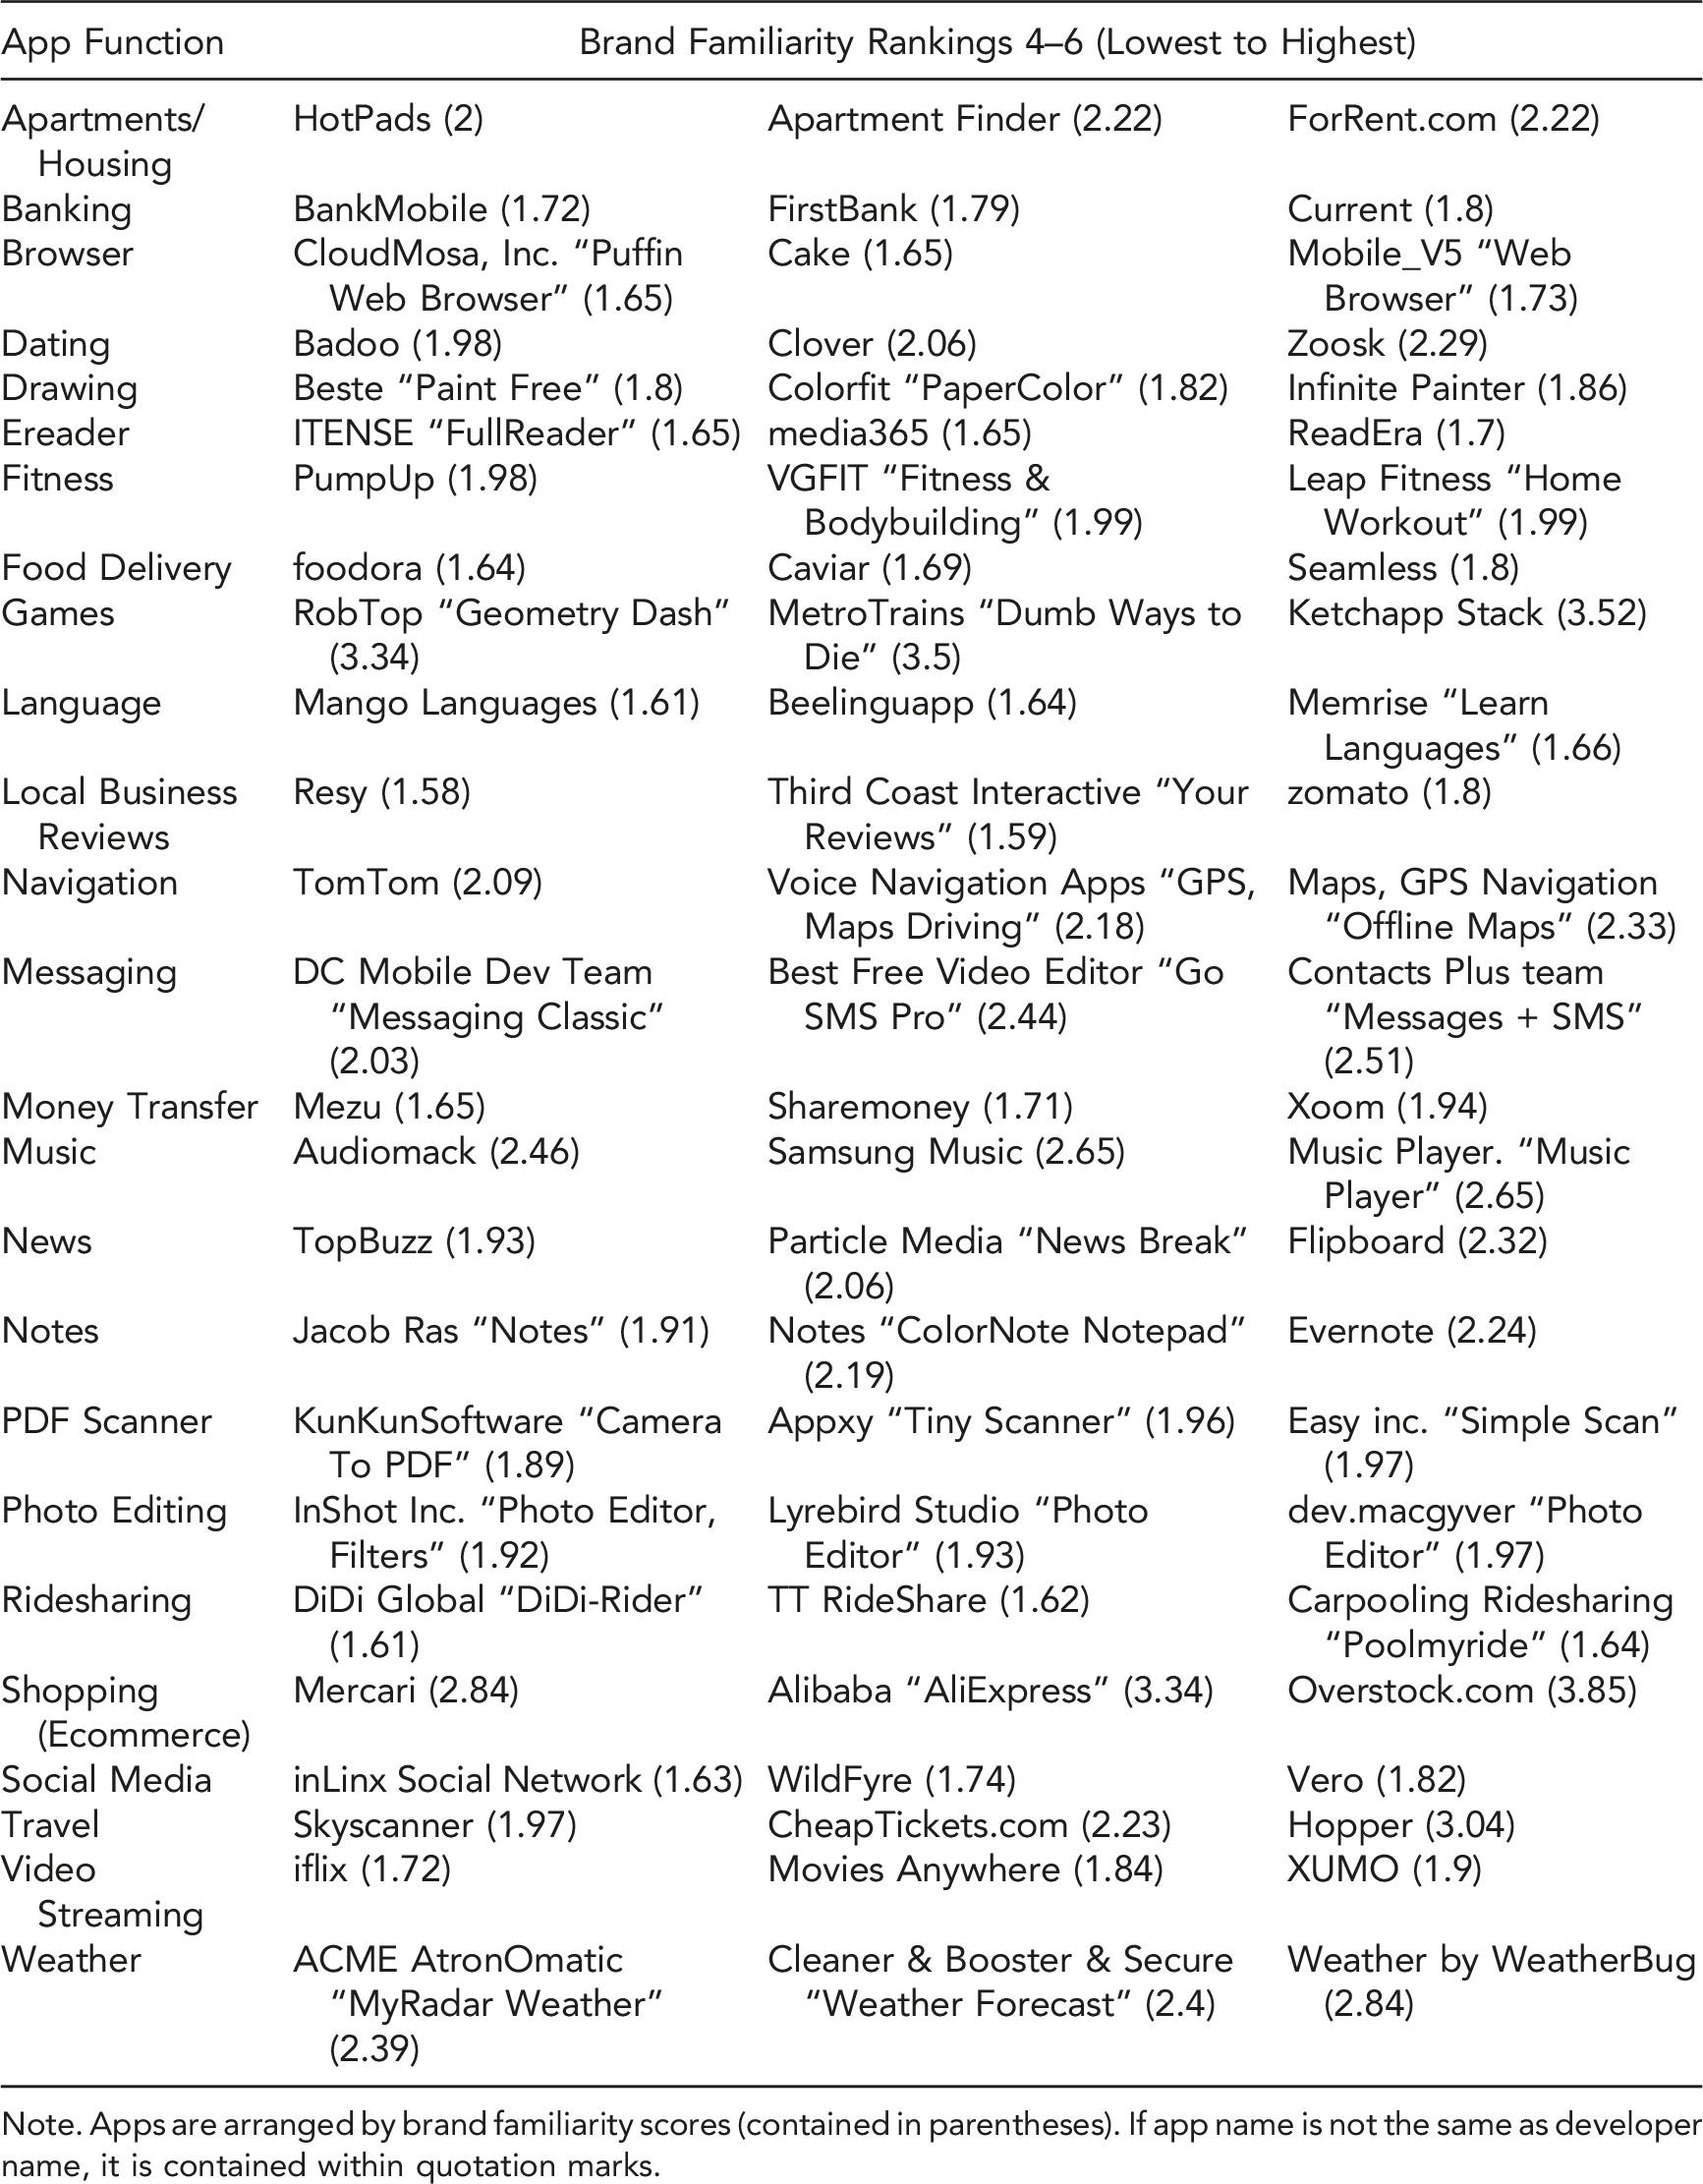
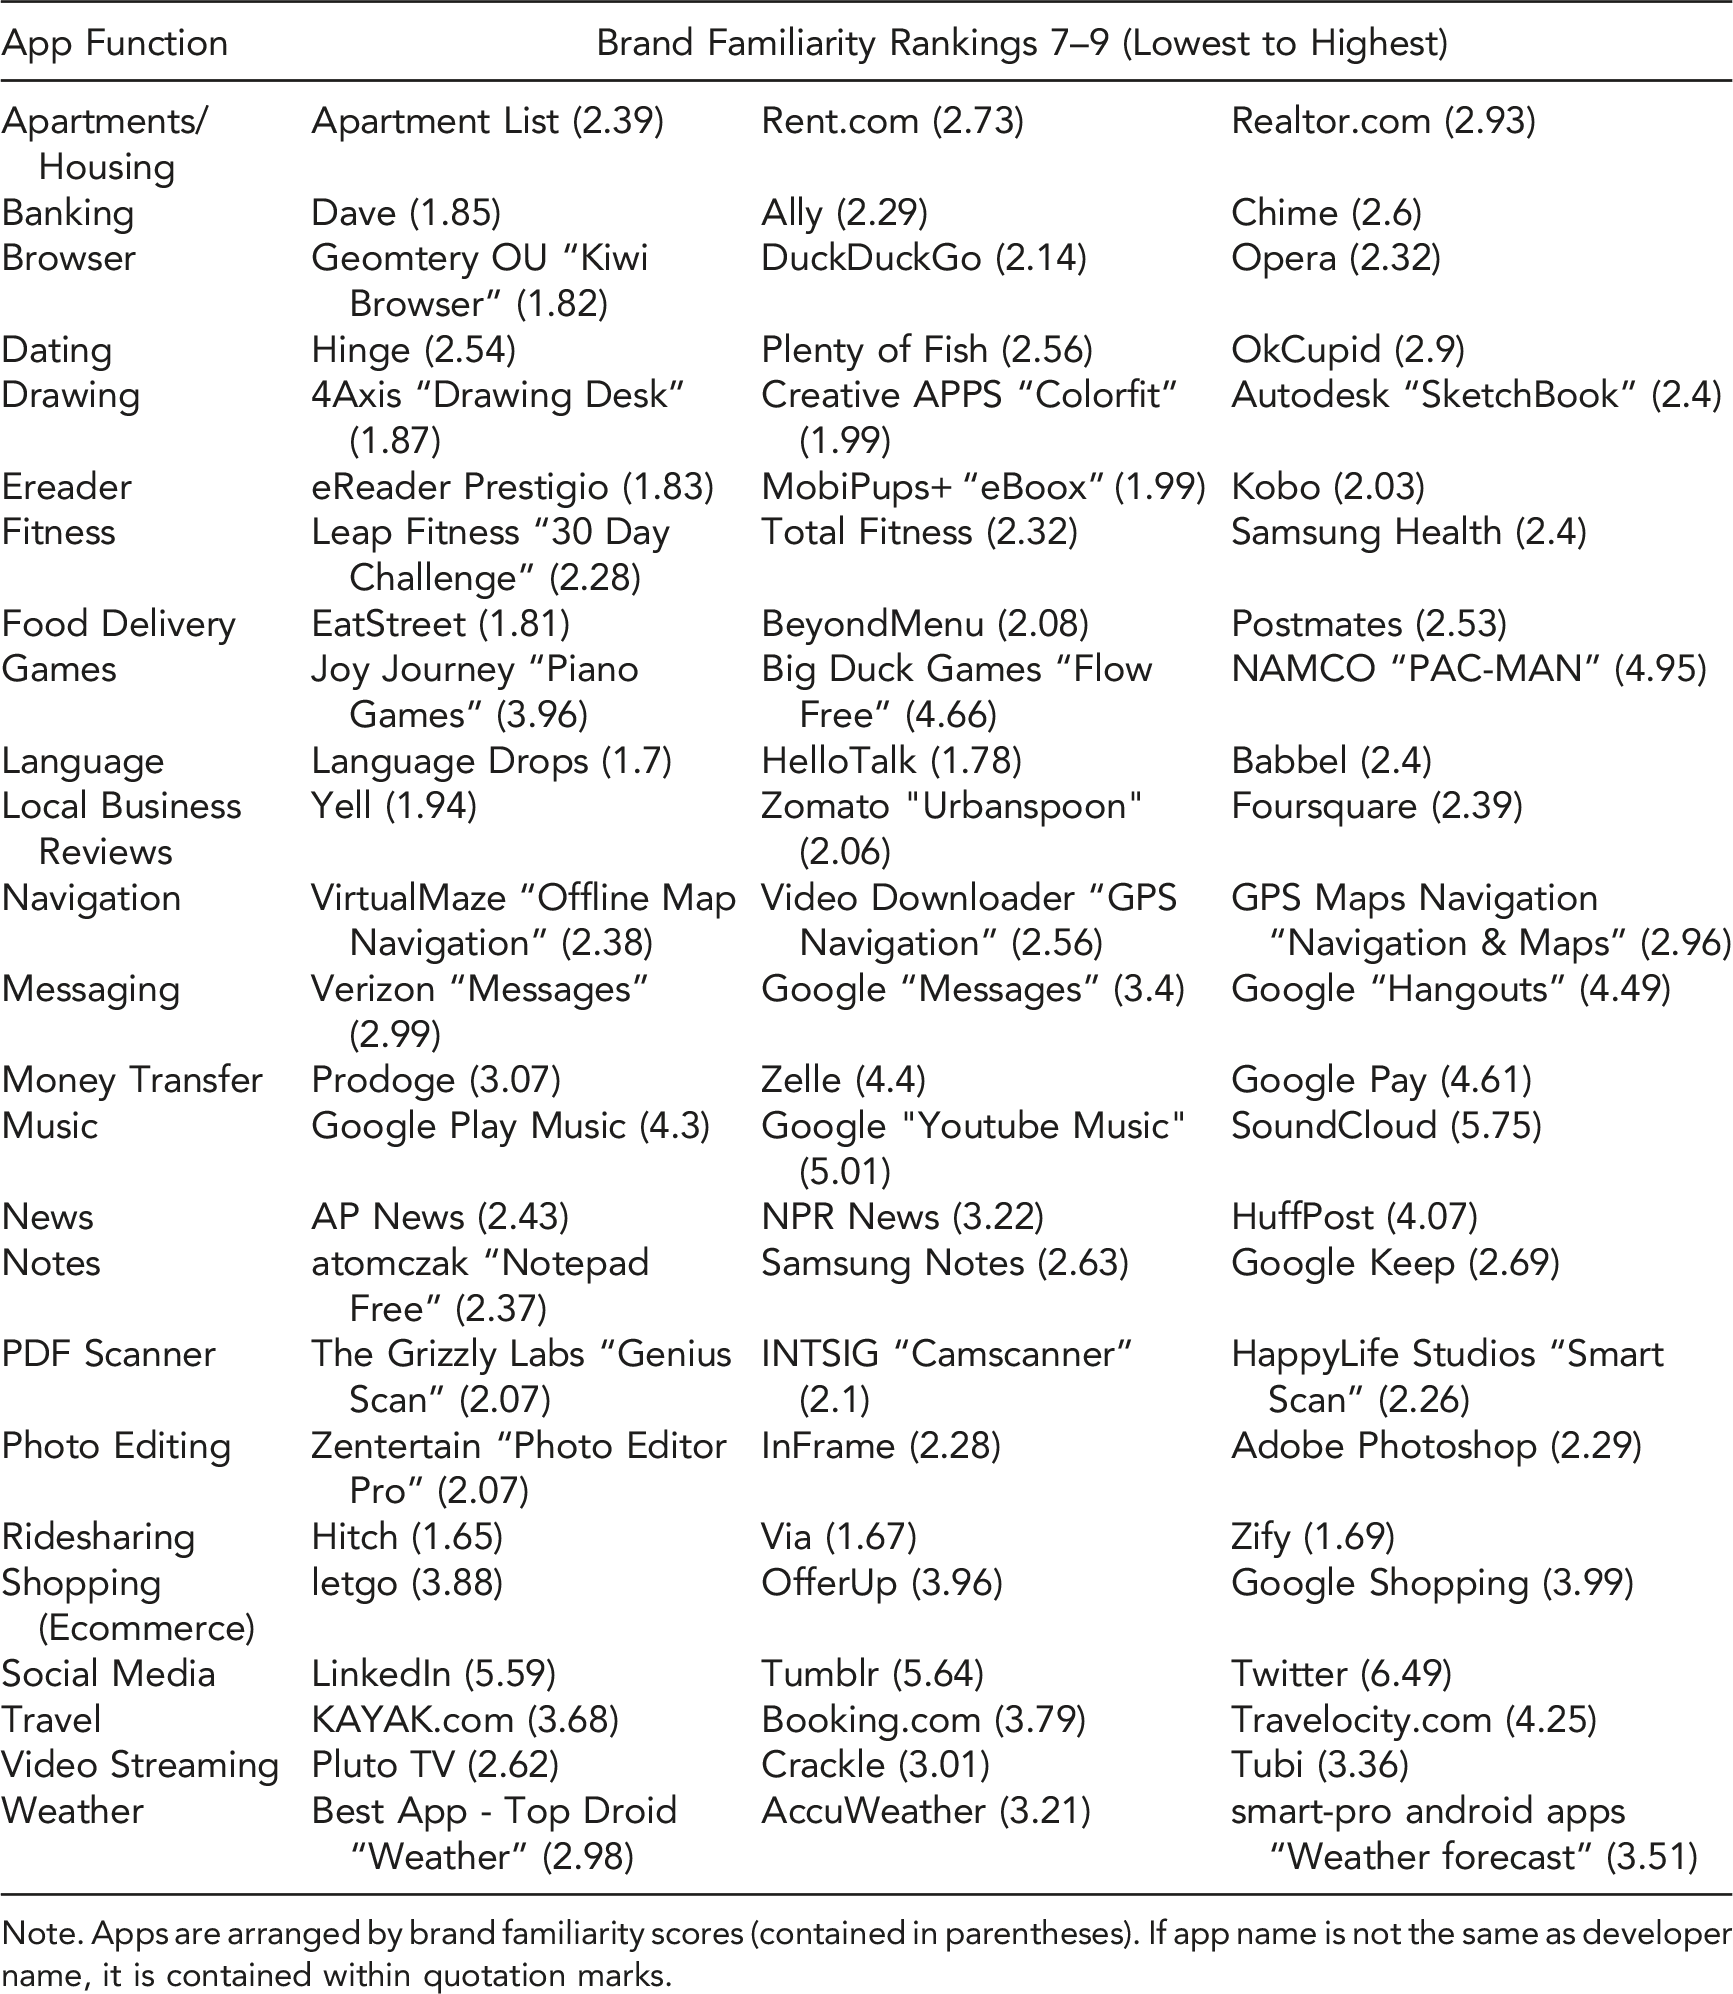
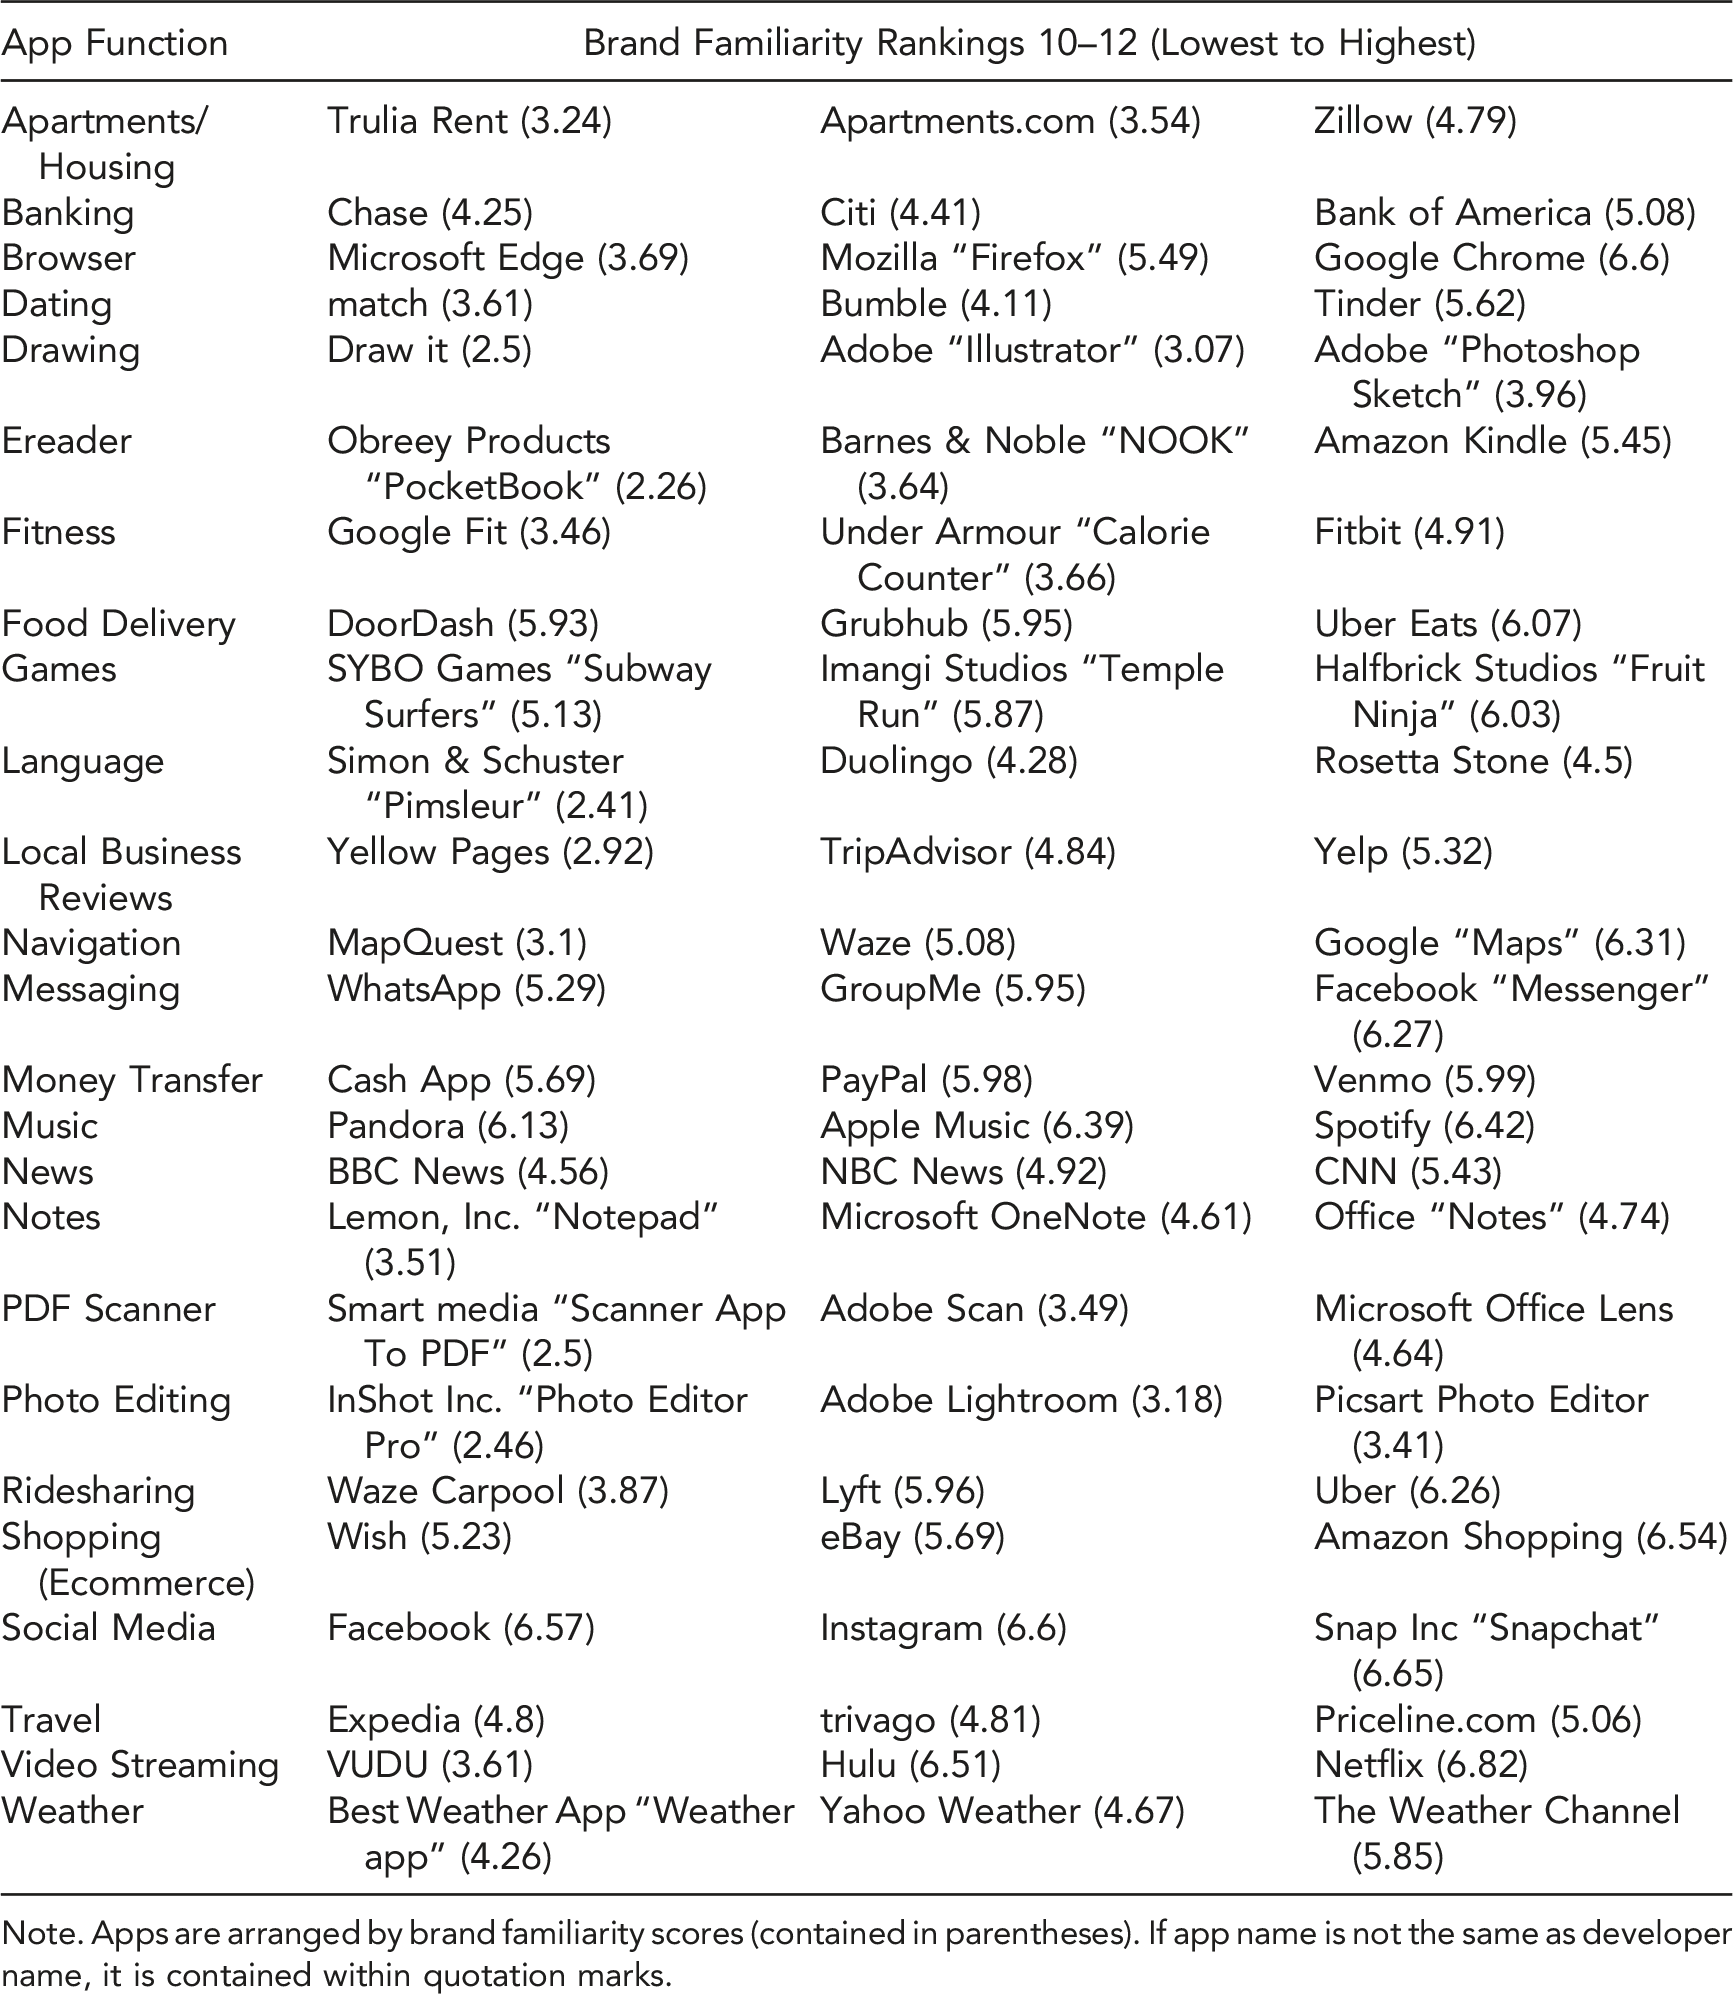
List of Application Functions Note. Apps are arranged by brand familiarity scores (contained in parentheses). If app name is not the same as developer name, it is contained within quotation marks. Note. Apps are arranged by brand familiarity scores (contained in parentheses). If app name is not the same as developer name, it is contained within quotation marks. Note. Apps are arranged by brand familiarity scores (contained in parentheses). If app name is not the same as developer name, it is contained within quotation marks. Note. Apps are arranged by brand familiarity scores (contained in parentheses). If app name is not the same as developer name, it is contained within quotation marks.
App Function
Brand Familiarity Rankings 1–3 (Lowest to Highest)
Apartments/Housing
PadMapper (1.54)
Apartment Guide (1.85)
Zumper (1.96)
Banking
Varo (1.58)
GoBank (1.64)
Frost Bank (1.67)
Browser
Cheetah Mobile “CM Browser” (1.57)
Aloha Browser (1.62)
Brave Private Browser (1.62)
Dating
happn (1.62)
Ifwe Inc. “Tagged” (1.7)
Hily (1.93)
Drawing
ibis Paint X (1.65)
MediBang Paint (1.65)
ArtFlow (1.73)
Ereader
FaultException “Lithium” (1.58)
De Marque “Aldiko Classic” (1.6)
Moon+ (1.63)
Fitness
JEFIT (1.78)
FitOn (1.81)
despDev “Home Workout” (1.87)
Food Delivery
RandomAppsInc “Food Button” (1.61)
Waitr (1.62)
Bite Squad (1.63)
Games
MochiBits “Left vs. Right” (2.06)
Kooapps Games “Pictoword” (2.96)
Top Free Games “Bike Race Free” (3.28)
Language
50LANGUAGES “Learn 50 Languages” (1.44)
Ati “Learn 33 Languages” (1.6)
Busuu (1.6)
Local Business Reviews
Qayiem (1.48)
SoftDeluxe “Restaurant Guru” (1.56)
Flying Code “AroundMe” (1.57)
Navigation
Sygic (1.55)
HERE WeGo (1.6)
MapFactor (1.7)
Messaging
Color Cube Studios “Color Messages” (1.73)
Tomato 5% Studio “AI Message” (1.8)
Gather Media “Messages” (1.86)
Money Transfer
WorldRemit (1.63)
TransferGo (1.63)
WigWag (1.64)
Music
Free music player creator “Free Music” (1.59)
Free Music - Music Play “Free Music” (2.17)
Mobile_V5 “Music Player” (2.28)
News
News360 (1.5)
SmartNews (1.84)
Reuters News (1.93)
Notes
Notas Notepad “BlackNote Notepad” (1.86)
Notas Notepad “ClearNote Notepad” (1.87)
Sappalodapps “Notepad” (1.88)
PDF Scanner
CoolMobileSolution “Fast Scanner” (1.67)
doo GmbH “Scanbot” (1.73)
FireeApps “Tiny Scanner” (1.8)
Photo Editing
AndOr Communications “LightX Photo Editor” (1.85)
Linerock Investments “Photo Lab Picture Editor” (1.86)
123RF Limited “Pixlr” (1.88)
Ridesharing
NavMake Apps “Lujo” (1.53)
Via “ViaVan” (1.57)
RideShark Corporation “gobyRide” (1.6)
Shopping (Ecommerce)
Hollar (1.73)
Dhgate.com (2.28)
Jet.com (2.33)
Social Media
TUBBR (1.55)
KARMA (1.57)
Elyments (1.57)
Travel
Skiplagged (1.65)
HolidayPirates "TravelPirates" (1.67)
Travelzoo (1.84)
Video Streaming
Future Today Inc “FilmRise” (1.55)
Screen Media Ventures "Popcornflix" (1.58)
Free Movies TV Shows “Free Movies” (1.65)
Weather
weawow weather app “Weather & Widget” (1.83)
Weather Underground (2.11)
OneLouder Apps “1Weather” (2.33)
App Function
Brand Familiarity Rankings 4–6 (Lowest to Highest)
Apartments/Housing
HotPads (2)
Apartment Finder (2.22)
ForRent.com (2.22)
Banking
BankMobile (1.72)
FirstBank (1.79)
Current (1.8)
Browser
CloudMosa, Inc. “Puffin Web Browser” (1.65)
Cake (1.65)
Mobile_V5 “Web Browser” (1.73)
Dating
Badoo (1.98)
Clover (2.06)
Zoosk (2.29)
Drawing
Beste “Paint Free” (1.8)
Colorfit “PaperColor” (1.82)
Infinite Painter (1.86)
Ereader
ITENSE “FullReader” (1.65)
media365 (1.65)
ReadEra (1.7)
Fitness
PumpUp (1.98)
VGFIT “Fitness & Bodybuilding” (1.99)
Leap Fitness “Home Workout” (1.99)
Food Delivery
foodora (1.64)
Caviar (1.69)
Seamless (1.8)
Games
RobTop “Geometry Dash” (3.34)
MetroTrains “Dumb Ways to Die” (3.5)
Ketchapp Stack (3.52)
Language
Mango Languages (1.61)
Beelinguapp (1.64)
Memrise “Learn Languages” (1.66)
Local Business Reviews
Resy (1.58)
Third Coast Interactive “Your Reviews” (1.59)
zomato (1.8)
Navigation
TomTom (2.09)
Voice Navigation Apps “GPS, Maps Driving” (2.18)
Maps, GPS Navigation “Offline Maps” (2.33)
Messaging
DC Mobile Dev Team “Messaging Classic” (2.03)
Best Free Video Editor “Go SMS Pro” (2.44)
Contacts Plus team “Messages + SMS” (2.51)
Money Transfer
Mezu (1.65)
Sharemoney (1.71)
Xoom (1.94)
Music
Audiomack (2.46)
Samsung Music (2.65)
Music Player. “Music Player” (2.65)
News
TopBuzz (1.93)
Particle Media “News Break” (2.06)
Flipboard (2.32)
Notes
Jacob Ras “Notes” (1.91)
Notes “ColorNote Notepad” (2.19)
Evernote (2.24)
PDF Scanner
KunKunSoftware “Camera To PDF” (1.89)
Appxy “Tiny Scanner” (1.96)
Easy inc. “Simple Scan” (1.97)
Photo Editing
InShot Inc. “Photo Editor, Filters” (1.92)
Lyrebird Studio “Photo Editor” (1.93)
dev.macgyver “Photo Editor” (1.97)
Ridesharing
DiDi Global “DiDi-Rider” (1.61)
TT RideShare (1.62)
Carpooling Ridesharing “Poolmyride” (1.64)
Shopping (Ecommerce)
Mercari (2.84)
Alibaba “AliExpress” (3.34)
Overstock.com (3.85)
Social Media
inLinx Social Network (1.63)
WildFyre (1.74)
Vero (1.82)
Travel
Skyscanner (1.97)
CheapTickets.com (2.23)
Hopper (3.04)
Video Streaming
iflix (1.72)
Movies Anywhere (1.84)
XUMO (1.9)
Weather
ACME AtronOmatic “MyRadar Weather” (2.39)
Cleaner & Booster & Secure “Weather Forecast” (2.4)
Weather by WeatherBug (2.84)
App Function
Brand Familiarity Rankings 7–9 (Lowest to Highest)
Apartments/Housing
Apartment List (2.39)
Rent.com (2.73)
Realtor.com (2.93)
Banking
Dave (1.85)
Ally (2.29)
Chime (2.6)
Browser
Geomtery OU “Kiwi Browser” (1.82)
DuckDuckGo (2.14)
Opera (2.32)
Dating
Hinge (2.54)
Plenty of Fish (2.56)
OkCupid (2.9)
Drawing
4Axis “Drawing Desk” (1.87)
Creative APPS “Colorfit” (1.99)
Autodesk “SketchBook” (2.4)
Ereader
eReader Prestigio (1.83)
MobiPups+ “eBoox” (1.99)
Kobo (2.03)
Fitness
Leap Fitness “30 Day Challenge” (2.28)
Total Fitness (2.32)
Samsung Health (2.4)
Food Delivery
EatStreet (1.81)
BeyondMenu (2.08)
Postmates (2.53)
Games
Joy Journey “Piano Games” (3.96)
Big Duck Games “Flow Free” (4.66)
NAMCO “PAC-MAN” (4.95)
Language
Language Drops (1.7)
HelloTalk (1.78)
Babbel (2.4)
Local Business Reviews
Yell (1.94)
Zomato "Urbanspoon" (2.06)
Foursquare (2.39)
Navigation
VirtualMaze “Offline Map Navigation” (2.38)
Video Downloader “GPS Navigation” (2.56)
GPS Maps Navigation “Navigation & Maps” (2.96)
Messaging
Verizon “Messages” (2.99)
Google “Messages” (3.4)
Google “Hangouts” (4.49)
Money Transfer
Prodoge (3.07)
Zelle (4.4)
Google Pay (4.61)
Music
Google Play Music (4.3)
Google "Youtube Music" (5.01)
SoundCloud (5.75)
News
AP News (2.43)
NPR News (3.22)
HuffPost (4.07)
Notes
atomczak “Notepad Free” (2.37)
Samsung Notes (2.63)
Google Keep (2.69)
PDF Scanner
The Grizzly Labs “Genius Scan” (2.07)
INTSIG “Camscanner” (2.1)
HappyLife Studios “Smart Scan” (2.26)
Photo Editing
Zentertain “Photo Editor Pro” (2.07)
InFrame (2.28)
Adobe Photoshop (2.29)
Ridesharing
Hitch (1.65)
Via (1.67)
Zify (1.69)
Shopping (Ecommerce)
letgo (3.88)
OfferUp (3.96)
Google Shopping (3.99)
Social Media
LinkedIn (5.59)
Tumblr (5.64)
Twitter (6.49)
Travel
KAYAK.com (3.68)
Booking.com (3.79)
Travelocity.com (4.25)
Video Streaming
Pluto TV (2.62)
Crackle (3.01)
Tubi (3.36)
Weather
Best App - Top Droid “Weather” (2.98)
AccuWeather (3.21)
smart-pro android apps “Weather forecast” (3.51)
App Function
Brand Familiarity Rankings 10–12 (Lowest to Highest)
Apartments/Housing
Trulia Rent (3.24)
Apartments.com (3.54)
Zillow (4.79)
Banking
Chase (4.25)
Citi (4.41)
Bank of America (5.08)
Browser
Microsoft Edge (3.69)
Mozilla “Firefox” (5.49)
Google Chrome (6.6)
Dating
match (3.61)
Bumble (4.11)
Tinder (5.62)
Drawing
Draw it (2.5)
Adobe “Illustrator” (3.07)
Adobe “Photoshop Sketch” (3.96)
Ereader
Obreey Products “PocketBook” (2.26)
Barnes & Noble “NOOK” (3.64)
Amazon Kindle (5.45)
Fitness
Google Fit (3.46)
Under Armour “Calorie Counter” (3.66)
Fitbit (4.91)
Food Delivery
DoorDash (5.93)
Grubhub (5.95)
Uber Eats (6.07)
Games
SYBO Games “Subway Surfers” (5.13)
Imangi Studios “Temple Run” (5.87)
Halfbrick Studios “Fruit Ninja” (6.03)
Language
Simon & Schuster “Pimsleur” (2.41)
Duolingo (4.28)
Rosetta Stone (4.5)
Local Business Reviews
Yellow Pages (2.92)
TripAdvisor (4.84)
Yelp (5.32)
Navigation
MapQuest (3.1)
Waze (5.08)
Google “Maps” (6.31)
Messaging
WhatsApp (5.29)
GroupMe (5.95)
Facebook “Messenger” (6.27)
Money Transfer
Cash App (5.69)
PayPal (5.98)
Venmo (5.99)
Music
Pandora (6.13)
Apple Music (6.39)
Spotify (6.42)
News
BBC News (4.56)
NBC News (4.92)
CNN (5.43)
Notes
Lemon, Inc. “Notepad” (3.51)
Microsoft OneNote (4.61)
Office “Notes” (4.74)
PDF Scanner
Smart media “Scanner App To PDF” (2.5)
Adobe Scan (3.49)
Microsoft Office Lens (4.64)
Photo Editing
InShot Inc. “Photo Editor Pro” (2.46)
Adobe Lightroom (3.18)
Picsart Photo Editor (3.41)
Ridesharing
Waze Carpool (3.87)
Lyft (5.96)
Uber (6.26)
Shopping (Ecommerce)
Wish (5.23)
eBay (5.69)
Amazon Shopping (6.54)
Social Media
Facebook (6.57)
Instagram (6.6)
Snap Inc “Snapchat” (6.65)
Travel
Expedia (4.8)
trivago (4.81)
Priceline.com (5.06)
Video Streaming
VUDU (3.61)
Hulu (6.51)
Netflix (6.82)
Weather
Best Weather App “Weather app” (4.26)
Yahoo Weather (4.67)
The Weather Channel (5.85)