
Abstract
Objective:
Long-term immunity acquired maternally against infectious pathogens has been reported in animal studies, but epidemiological evidence remains lacking. To assess long-term maternal immunity in humans against infectious pathogens, we examined COVID-19 disease burden in communities with varying breastfeeding practices.
Methods:
Using data from 159 counties in Georgia, the United States, from March 1, 2020, through February 28, 2022, we calculated the daily incidence, mortality, and fatality rates of COVID-19 and estimated rate ratios (RRs) in counties with low (<62%, n = 36) and moderate breastfeeding initiation rates (BFIRs) (62–79%, n = 81) compared to counties with high BFIRs (≥79%, n = 42) adjusted for counties’ sociodemographic and quantified indicators of public health interventions.
Results:
More than 80% of 2 million cases involved individuals aged 18 or older. The daily incidence and mortality curves in the counties with high BFIRs lagged 2 weeks behind those in the counties with low BFIRs. Daily mortality reached 10 deaths per million during every major surge in low BFIR counties, but in high BFIR counties, this occurred only during the 2020–2021 winter spike. Compared to high BFIR counties, counties with low BFIRs had a daily incident RR of 2.95 (95% CI = 1.11, 6.00) in rural counties and 1.45 (1.03, 2.04) in urban counties on February 28, 2022, the cutoff date.
Conclusions:
A significantly higher COVID-19 incidence occurred in low BFIR counties compared to that in high BFIR counties. Breastfeeding may confer long-term immunity against emerging infectious pathogens by enhancing an individual’s biological immunity or strengthening the community’s social defense.
Introduction
Maternal immunity transferred in utero or via breastfeeding has been well-recognized as a critical source of immune education and protection. 1 It is mainly driven by a passive transfer of maternal antibodies, meaning antibodies are delivered directly to the infant (via placenta or breast milk) without requiring the infant’s immune system to produce them and has traditionally been considered transient. 2
Increasing evidence indicates that breastfeeding confers benefits beyond the breastfeeding period,3–7 particularly during early childhood, with some effects extending into later childhood.8–10 These benefits include a reduced risk of infection and support for immune system maturation, underscoring the importance of breastfeeding for both immediate and long-term child health. Protection beyond childhood against infectious pathogens from maternal immunity was reported only recently from an animal model.11–13
What’s already known on this topic?
Maternal immunity transferred in utero or via breastfeeding has been recognized as a critical source of immune protection. The benefits of breastfeeding in boosting immunity beyond the breastfeeding period, however, are limited to the early and older stages of childhood.
What this study adds?
We found a significantly higher COVID-19 incidence, primarily among adult patients, in counties with low breastfeeding rates. Breastfeeding may confer long-term immunity beyond the breastfeeding period against emerging infectious pathogens.
How this study might affect research, practice, or policy?
The current report adds new evidence that maternal protection may extend beyond the breastfeeding period, either by boosting an individual’s immunity biologically or bolstering the community defense lines socially.
One puzzling observation across three coronavirus (CoV) outbreaks in the 21st century, including the COVID-19 pandemic, was the peculiar age distribution of the population at elevated risk of infection, compared with those caused by common respiratory viruses. For common respiratory viral infections, a typical U-shaped age distribution exists, with prevalence and severity higher among older adults and children. 14 In contrast, infections with emerging pathogens, including SARS-CoV-1, 15 SARS-CoV-2,15,16 and Middle East Respiratory Syndrome-CoV, 17 were much less prevalent and less severe in children than in adults.16,17 A strong innate immunity has been proposed as part of the hypotheses explaining why emerging CoVs cause much less severe infections in children. 18 However, this cannot explain why a strong innate immunity does not protect children against common respiratory viruses. We propose that yet-undiscovered components of maternal immunity may contribute to long-term protection against emerging infectious pathogens. Consequently, communities with higher breastfeeding rates may exhibit lower disease burdens, potentially benefiting from the enduring foresight of maternal biology—a natural safeguard shaped by evolutionary design.
The COVID-19 pandemic presents an opportunity to evaluate what we term the evolutionary maternal foresight hypothesis, which proposes that maternal immune transfer may serve as a forward-looking biological safeguard by conferring durable, population-level resilience against novel pathogens. This hypothesis does not imply metaphysical prediction; rather, it reflects evolutionary processes that favor immune strategies capable of mitigating future, unforeseen infectious threats, thereby reducing disease burden in communities with higher breastfeeding rates. We tested this hypothesis by assessing COVID-19–related disease burden among communities with distinct levels of breastfeeding initiation practices, while controlling for sociodemographic characteristics and the intensity of public health interventions.
Methods
Data source
Data for this study were obtained from publicly available repositories, including those maintained by the U.S. Centers for Disease Control and Prevention (CDC) 19 and The New York Times. 20 To reduce variability in public health responses during the early phase of the COVID-19 pandemic, analyses were restricted to Georgia, the United States. Georgia was selected because of its high proportion of racial minorities, its disproportionate early burden of COVID-19, 21 and the statewide executive order issued on April 2, 2020, 22 which ensured homogeneity in non-pharmaceutical interventions. The units of observation were all 159 counties in Georgia. The study was classified as exempt by Georgia Southern University’s IRB.
Incidence and mortality rate of COVID-19
Case and death counts were obtained from the New York Times’ ongoing repository of data on COVID-19 cases and deaths in the United States. 20 With the first case in Georgia reported from Fulton County, the data spanned from March 20, 2020, to February 28, 2022, for the current analyses. Cases included both laboratory-confirmed and probable cases using criteria developed by states and the federal government. 20 Confirmed deaths were persons who had died and met the then definition standardized by the U.S. CDC. 20 Daily rates were the number of reported new cases or deaths on any day divided by the county population, after subtracting accumulated cases or deaths before the day, and then multiplied by 10,000 to give the daily incident rate per 10,000 people, or by 1 million to provide the daily death rate per 1 million people. The case fatality rate is the proportion of confirmed COVID-19 cases that result in death, calculated by dividing the number of deaths by the number of confirmed cases.
Breastfeeding initiation rates (BFIRs)
Standardized by the U.S. CDC, 19 the BFIR was defined as receiving any breast milk or colostrum during the period between delivery and discharge from the birth facility or upon completion of the birth certificate for home births. Birth certificate data from the 2018 to 2019 National Vital Statistics System were used to calculate BFIRs by the county of the mother’s residence. 19 An infant was excluded from BFIR calculations if the infant was transferred to another facility within 24 hours of delivery or died before the completion of the birth certificate. 19 We categorized 159 Georgia counties into three groups based on the 1st and 3rd quartiles of BFIR, low (<62%, n = 36), moderate (62–79%, n = 81), and high BFIR counties (≥79%, n = 42).
COVID-19 vaccination coverage levels
We retrieved daily counts of COVID-19 vaccine doses administered by county from the CDC’s vaccine dataset. 23 Variables included the date of administration, number of doses, and county of residence, as reported to the CDC, pharmacies, and federal entities through Immunization Information Systems, the Vaccine Administration Management System, or direct submission of vaccination records. The CDC defined the county vaccination coverage as the total number of people who have received the second dose in a two-dose vaccine primary series or one dose of a single-dose vaccine primary series among the total number of people residing in that county. 24 The population data used for denominators to measure vaccination coverage were from the 2020 U.S. census.
Face mask-wearing behaviors of community members
Mask-wearing has been recommended as one of the key containment and mitigation strategies. Because of reasons discussed elsewhere, 22 mask policies in Georgia were limited to encouragement; actual use remained a personal choice during the pandemic. Instead of counting the face-mask-related mandates, we created an indicator of mask-wearing hesitancy to proxy for residents’ actual mask-wearing behavior in each county. The indicator was constructed from a large online interview conducted by the global data and survey firm Dynata. 25 A total of 250,000 responses were collected nationwide between July 2 and July 14, 2020, providing sufficient data for county-level estimates. The percentage of respondents who never wore a mask was calculated for each county from the responses to the question “How often do you wear a mask in public when you expect to be within six feet of another person?” We categorized Georgia counties into three groups using the 1st and the 3rd quartiles as the cutoffs, counties with a percentage of respondents who never wore a mask <22% (n = 36) as counties with low hesitancy, between 22% and 44% (n = 81) as moderate hesitancy, and ≥45% (n = 42) as high hesitancy.
Sociodemographic and health characteristics of the counties
We grouped Georgia counties as rural and urban using the most recent (2013 version) Urban-Rural Classification Scheme developed by the National Center for Health Statistics. 26 The county population statistics were obtained from the U.S. Census Bureau’s 2020 census data, which includes the percentages of Black residents and residents aged 55 years and older. Data on residents aged 55 and older living below the poverty level were obtained from the 2011 to 2015 American Community Survey, conducted by the U.S. Census Bureau. The prevalence of tobacco smoking, alcohol drinking, obesity, and diabetes among adults by county was collected in 2011–2012 by the Institute for Health Metrics and Evaluation, University of Washington. 27
Milestone time points
We selected seven time points to cross-sectionally assess risk ratios between counties with distinct levels of BFIRs. May 1, 2020, a week after businesses reopened in Georgia (April 24), was selected to represent the early stage of the pandemic. October 15, 2020, fell amid a dramatic increase in cases following the nationwide relaxation of restrictions. January 8, 2021, marked the turning point of the 2020–2021 winter surge, from an increase to a decrease in daily incidence rates. June 17, 2021, marked the start of the USA’s large-scale community transmission of the delta variant. On August 15, 2021, the number of confirmed COVID-19 cases globally surpassed 200 million, and the average daily case numbers reported in the United States exceeded 150,000. Finally, on February 28, 2022, the data endpoint was reached during the ascending phase of the Omicron surge in the United States.
Analytical procedures
The data obtained for this study were analyzed using SAS 9.4 (SAS Institute Inc., Cary, NC, USA). Instead of estimating the reproduction number, we defined the epidemic momentum as the rate of increase in the epidemic. We applied penalized B-spline fit functions to estimate when surges reached five cases per 10,000 population or five deaths per million population in counties with distinct BFIR levels. We assumed that the instantaneous rate of COVID-19 was piecewise constant over a fleeting time interval of days and performed cross-sectional analyses at the selected time points to quantify the factors driving the daily rate ratios (RR) across counties with different BFIR levels after adjusting for other county-specific characteristics. Overdispersion was present for multiple variables, including daily incidence and mortality; therefore, the negative binomial model was preferable to the classical Poisson regression. 28 We used a negative binomial model to estimate the RRs of daily incidence, mortality, and fatality for counties with low or moderate BFIRs compared to those with high BFIRs. Seven-day moving averages were used to account for daily variations in RR estimations. We did not perform age-specified analyses due to the unavailability of age information at the case level and small numbers of cases and deaths at the county level.
Results
We observed substantial variation in BFIR and sociodemographic characteristics across Georgia counties. The BFIR was close to 100% in some counties but below 30% in others (Supplementary Fig S1). The population living below the poverty line ranged from 5.10% to 38.20%, and the African American/Black population ranged from less than 1% to over 70% (Table 1). And the variations were statistically significant between rural and urban counties for all characteristics presented in the current analyses, with the exception of the percentage of the Black population, which did not differ between urban and rural areas (See Table 1). As of February 28, 2022, a total of 2,087,290 cases had been reported, with 81.13% of cases involving individuals 18 years of age or older. By county, the percentage of cases 18 years and older ranged from 69.40% to 85.02% (Table 1). By the end of February 2022, the highest COVID-19 vaccination coverage at the country level was 95%, with the lowest at 21%.
Basic Statistics of 159 Georgia Counties, March 01, 2020–February 28, 2022
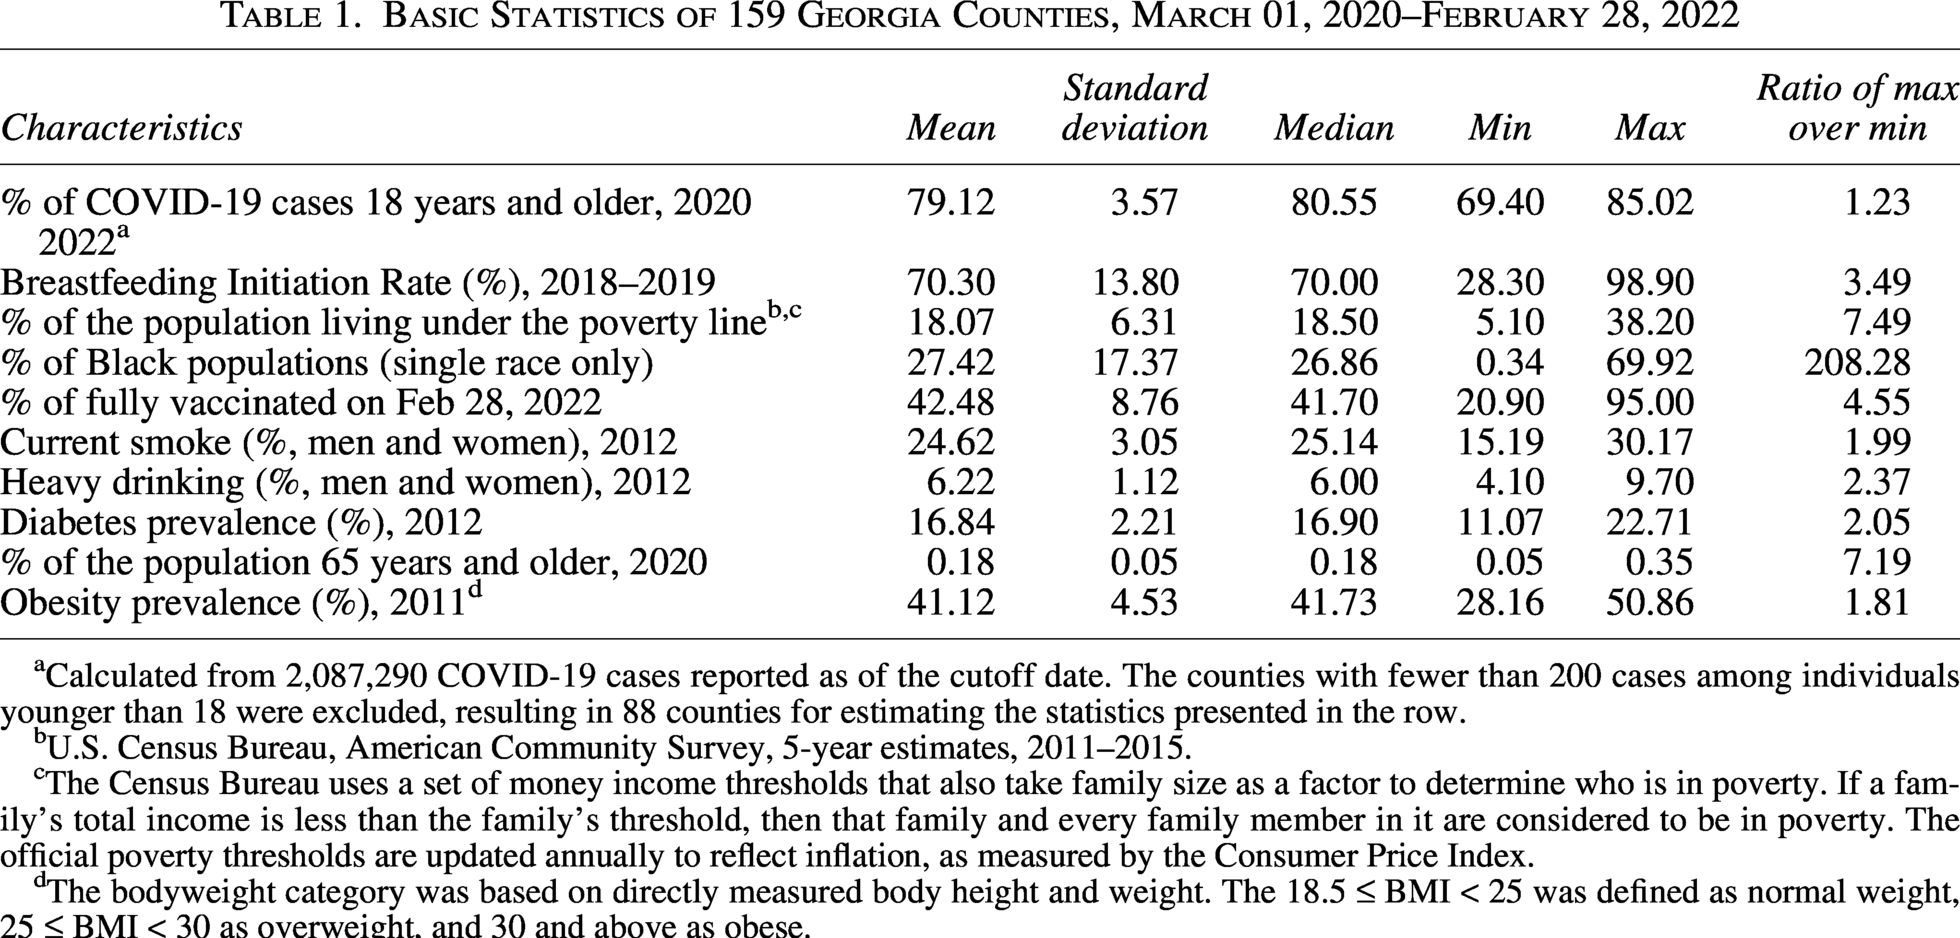
Calculated from 2,087,290 COVID-19 cases reported as of the cutoff date. The counties with fewer than 200 cases among individuals younger than 18 were excluded, resulting in 88 counties for estimating the statistics presented in the row.
U.S. Census Bureau, American Community Survey, 5-year estimates, 2011–2015.
The Census Bureau uses a set of money income thresholds that also take family size as a factor to determine who is in poverty. If a family’s total income is less than the family’s threshold, then that family and every family member in it are considered to be in poverty. The official poverty thresholds are updated annually to reflect inflation, as measured by the Consumer Price Index.
The bodyweight category was based on directly measured body height and weight. The 18.5 ≤ BMI < 25 was defined as normal weight, 25 ≤ BMI < 30 as overweight, and 30 and above as obese.
Overall, BFIRs were higher in urban areas than rural counties (Fig. 1 and Table 1). BFIRs correlated with almost all selected sociodemographic and health risk characteristics (Supplementary Table S2). The correlations between BFIR and COVID-19 disease burden—particularly the incidence rate—shifted over the course of the pandemic and were modified by urban–rural status (Fig. 2). In the early phase of the epidemic, the unadjusted correlations stratified by urbanity were weak and generally not statistically significant. However, these associations strengthened substantially in the later phase, especially for incidence and mortality in rural areas (Supplementary Table S3). For example, the correlation between BFIR and COVID-19 mortality in rural counties increased markedly, with the absolute value of r rising from 0.09 on May 1, 2020, to 0.56 by October 25, 2021.
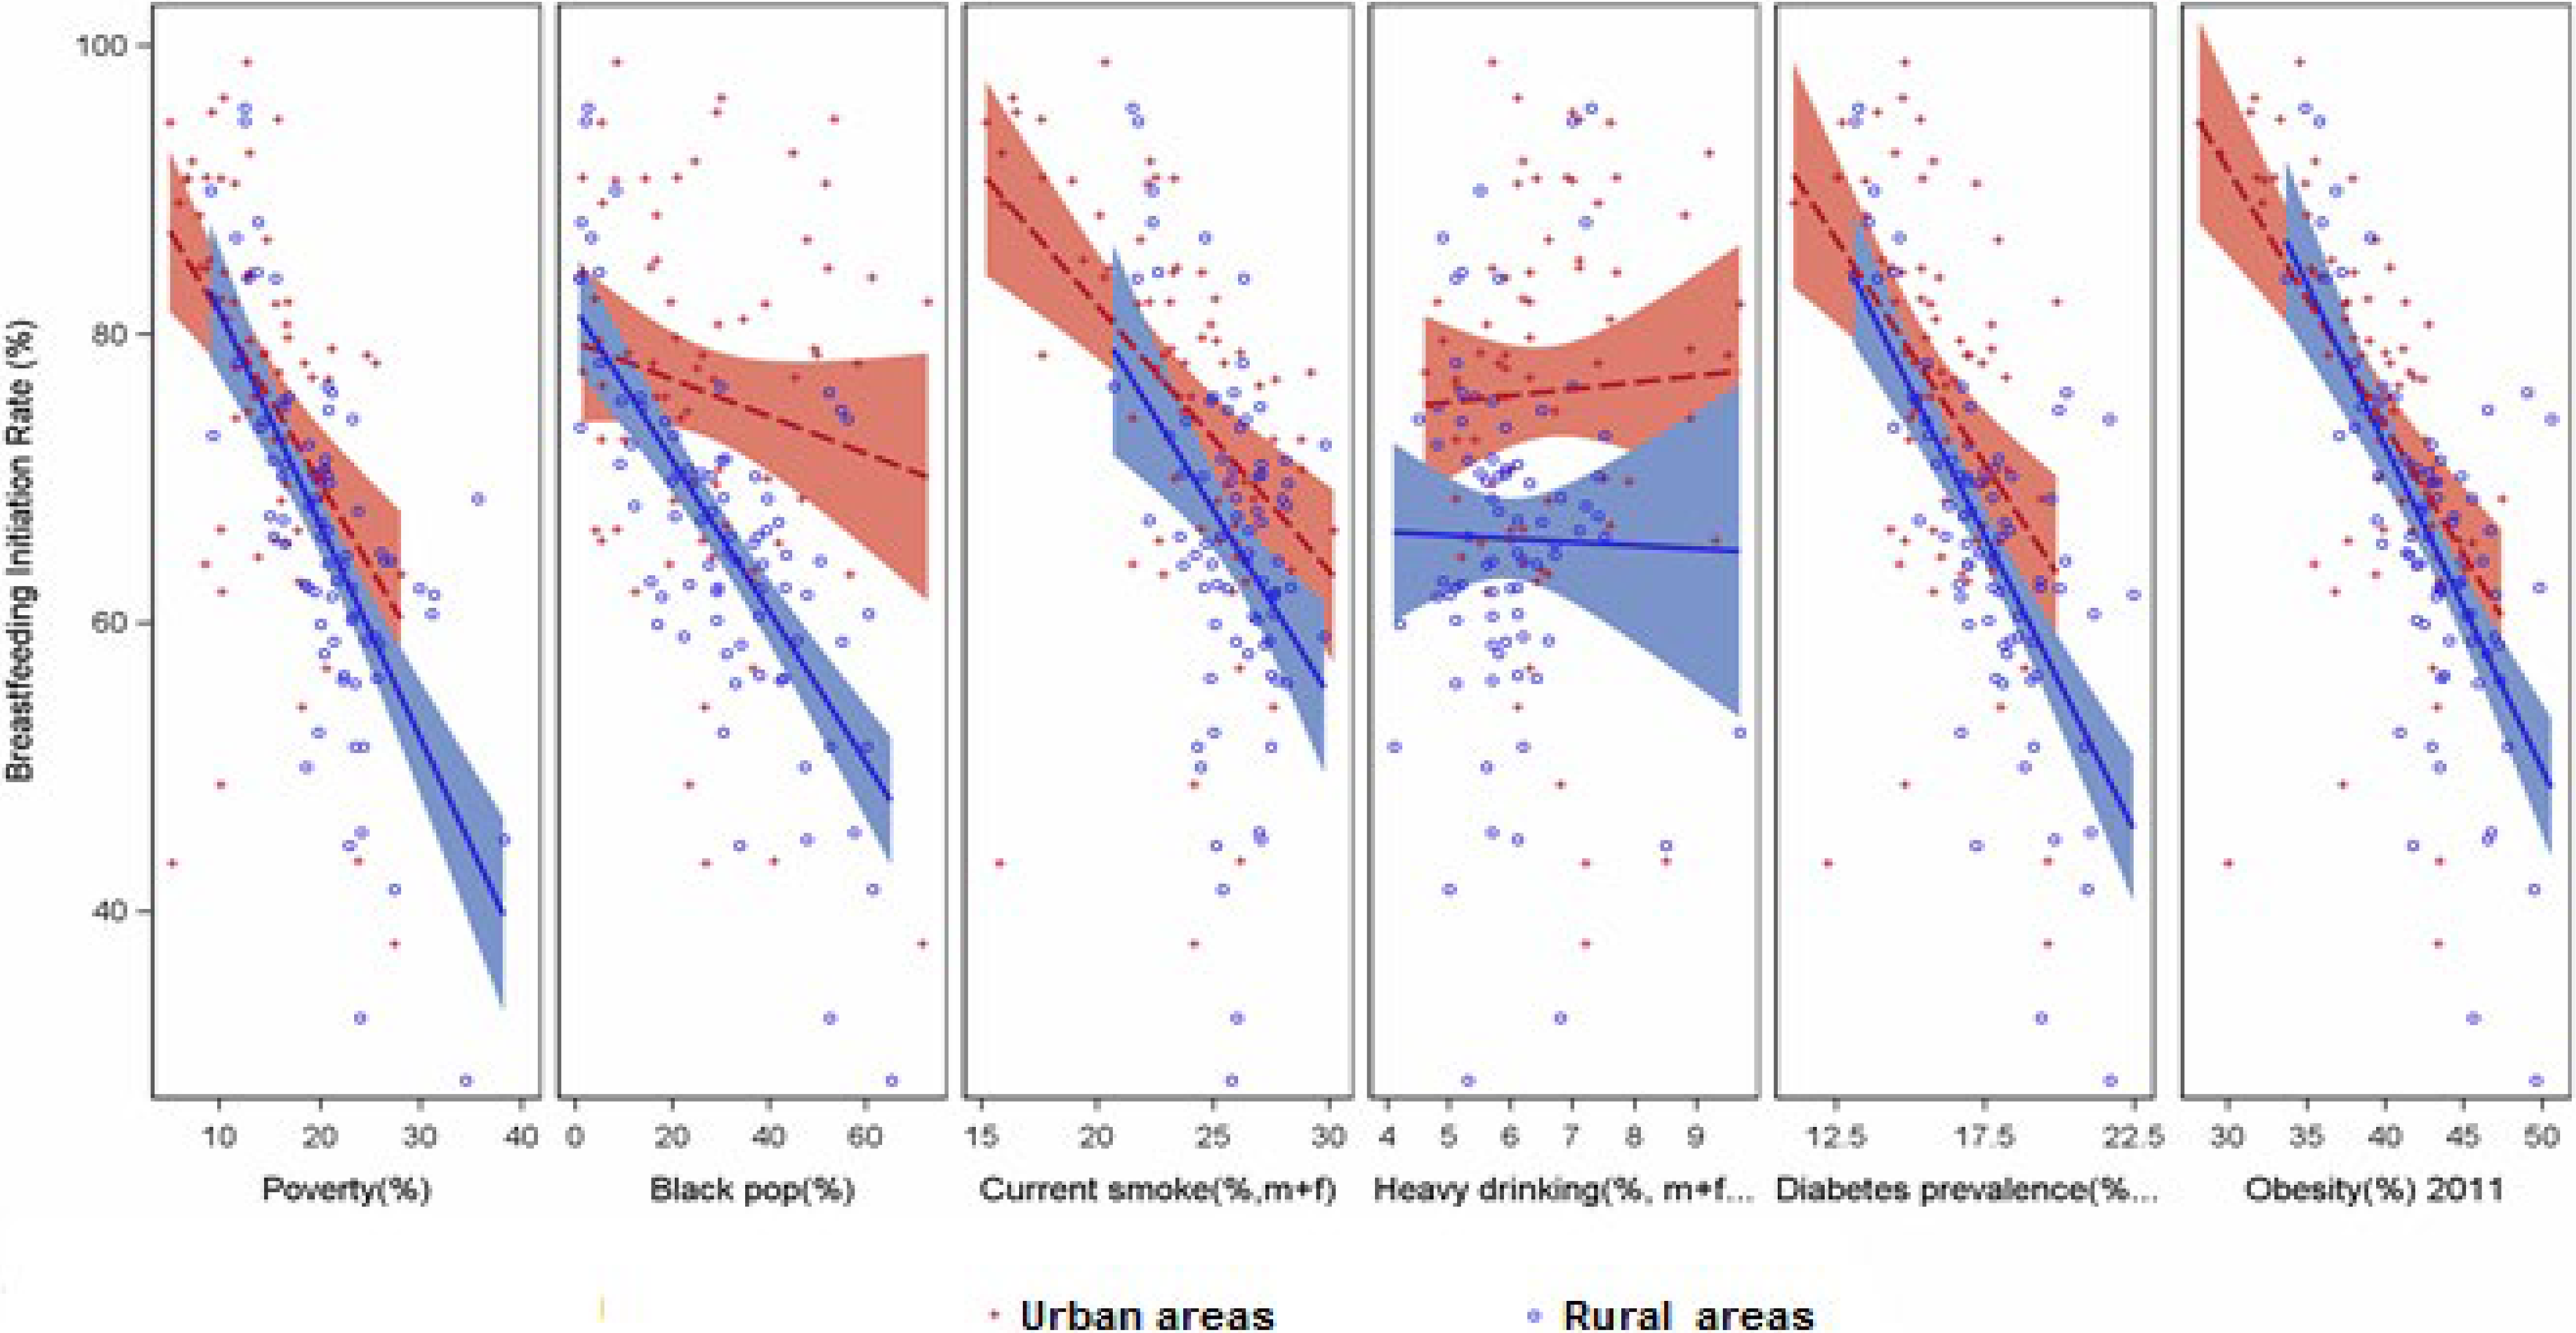
Scatterplot Matrix for Sociodemographic and Health-Related Characteristics with Breastfeeding Initiation Rates, 159 Georgia Counties *,†,‡,§,|| *Breastfeeding initiation rate was estimated for 2018–2019 from the birth certificates database. †Urban-rural classification scheme developed by the National Center of Health Statistics. Urban counties include large central metro counties in metropolitan statistical areas, large fringe metro counties, and small metro counties. Nonmetropolitan counties: Metropolitan counties within metropolitan statistical areas and counties outside metropolitan statistical areas were grouped as rural counties. 27 ‡The county population statistics came from the U.S. Census Bureau’s 2020 census data, including the percentage of the Black population, 55 years and older. 5 §The percentage of people 55 years and older living in a household with income below the poverty level was from the 2011–2015 American Community Survey, also conducted by the U.S. Census Bureau. 5 ||The prevalence of smoking and obesity by county among adults was collected in 2015–2016 by the Institute for Health Metrics and Evaluation, University of Washington. 28
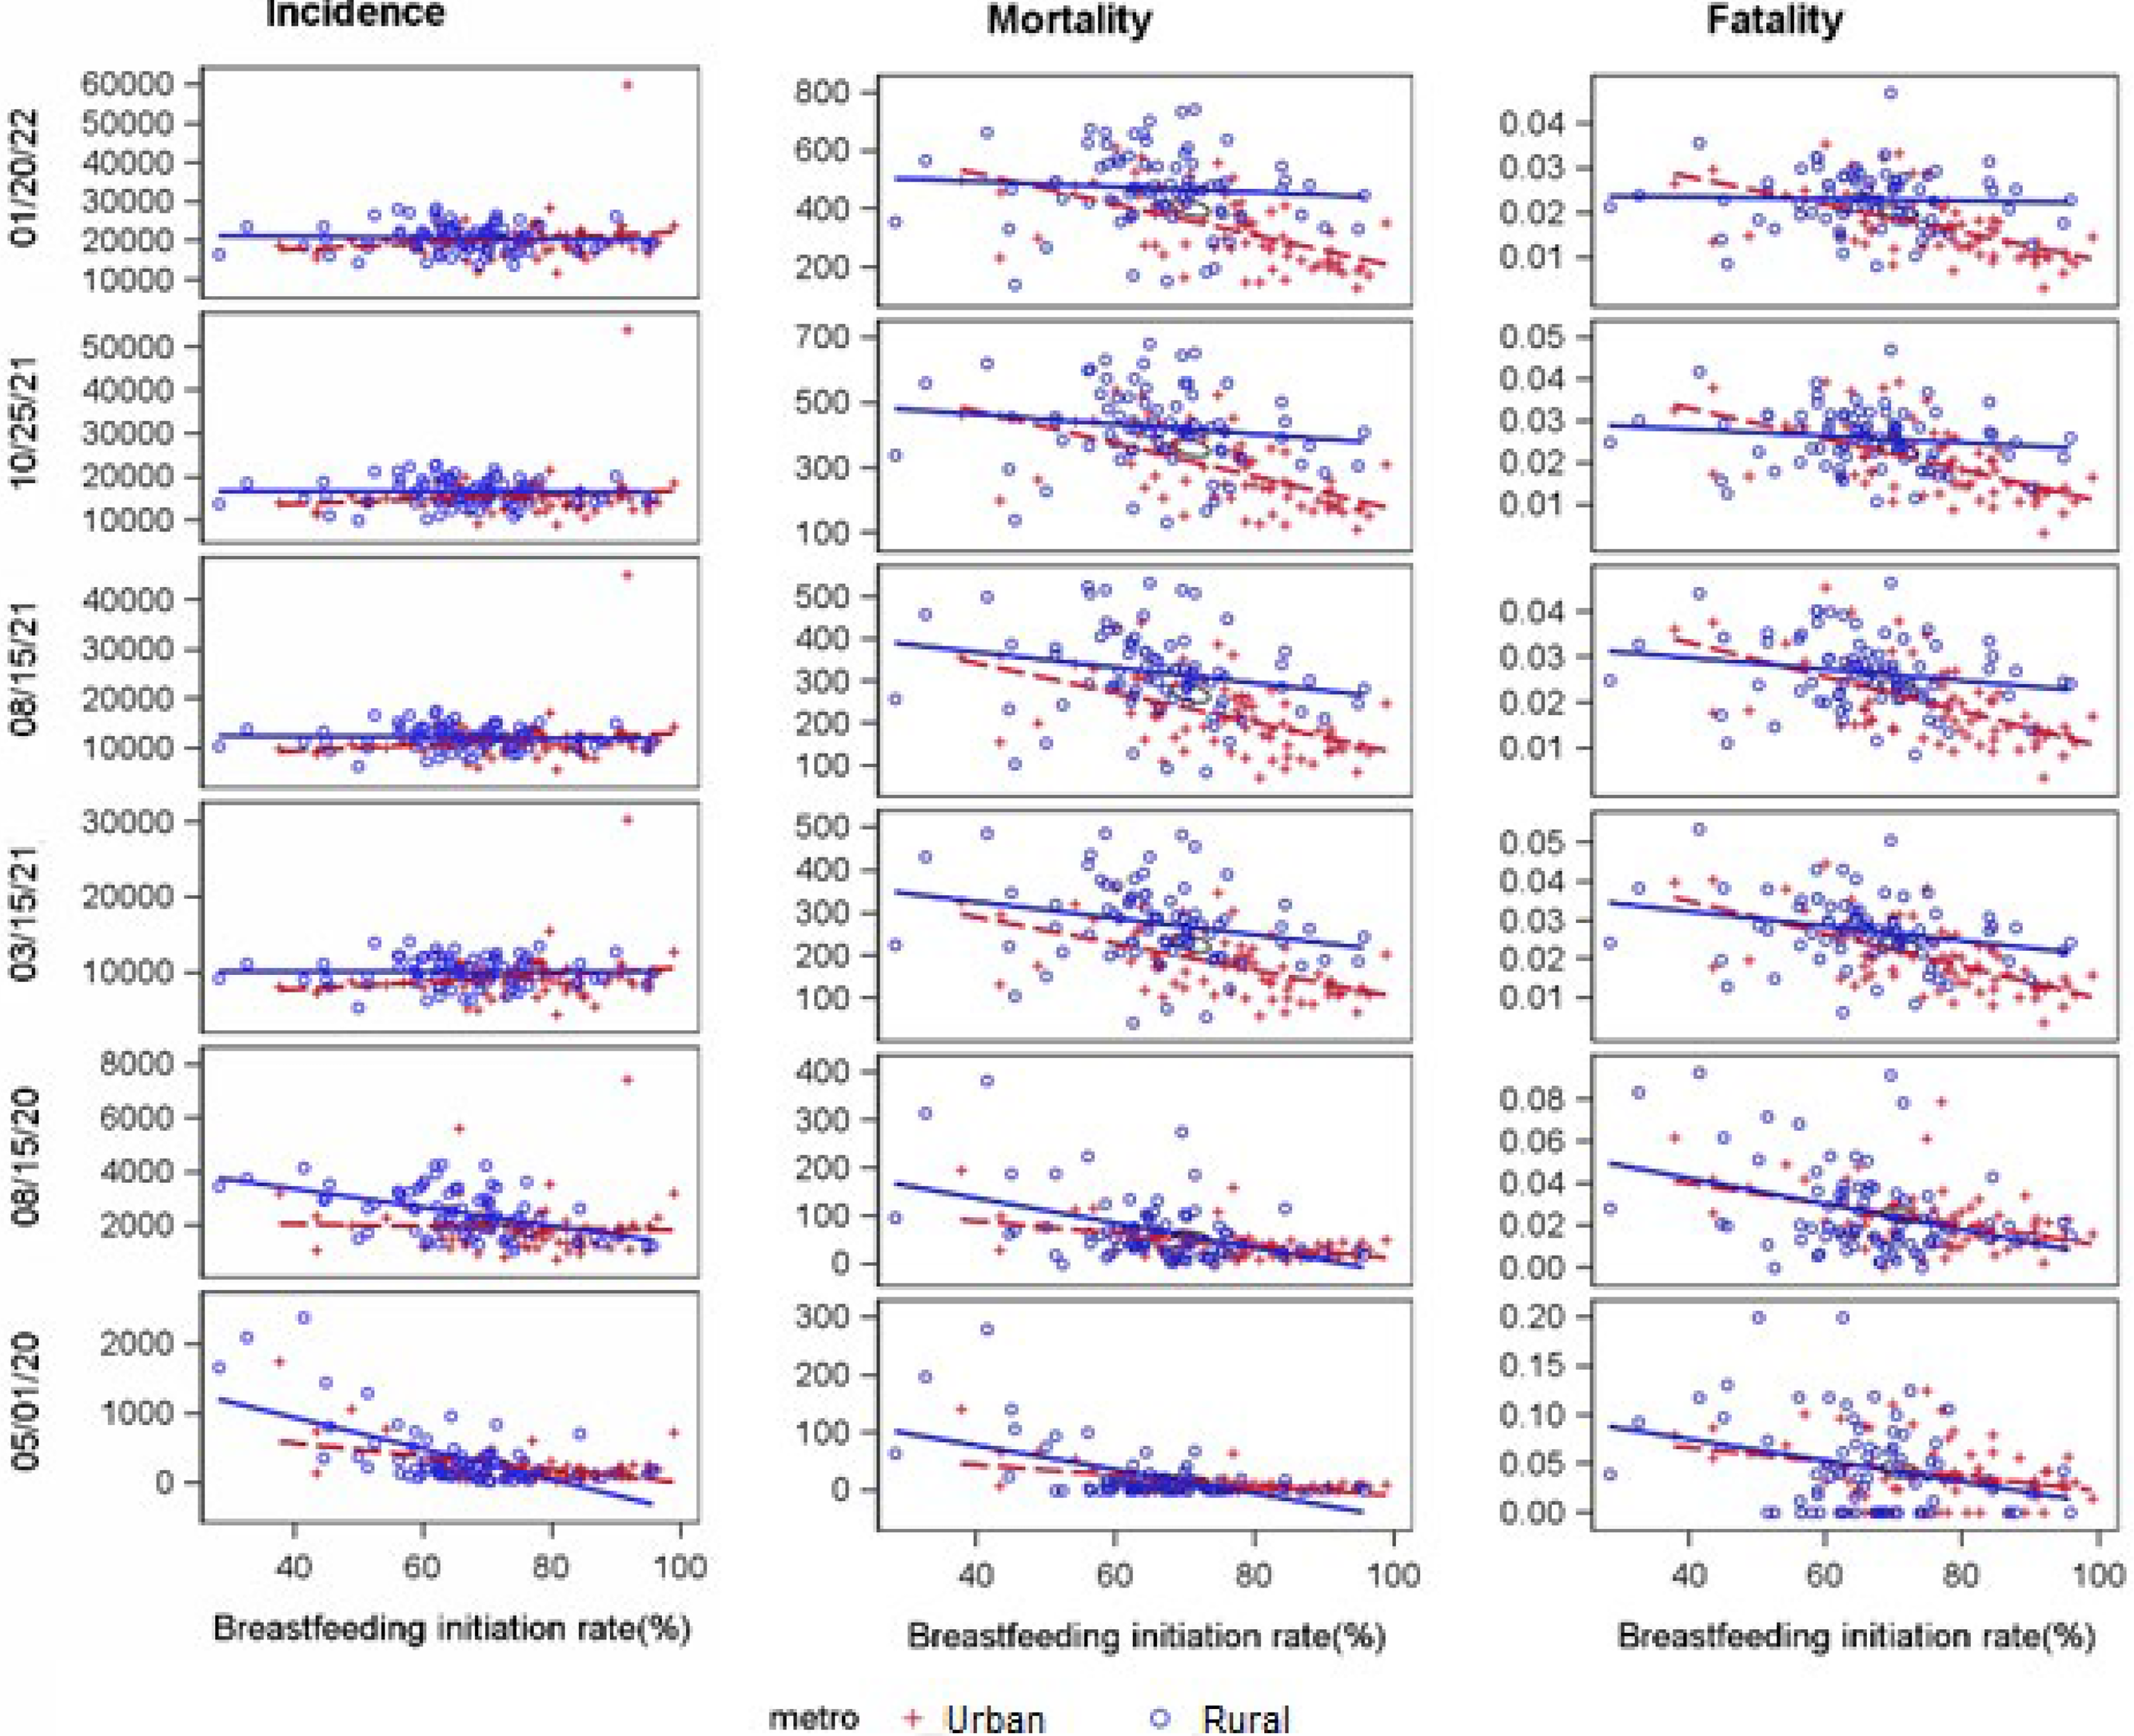
Correlation between COVID-19 Daily Incidence, Mortality, and Fatality with Breastfeeding Initiation Rates, 159 Georgia Counties *,† *Breastfeeding initiation rate was estimated for 2018–2019 from the birth certificates database, and defined as receiving any breast milk or colostrum during the period between delivery and discharge from the birth facility or completion of the birth certificate for home births. †Case and death counts were obtained from the New York Times’ ongoing repository of data on coronavirus cases and deaths in the U.S. With the first case of COVID-19 in GA reported from Fulton County, the data started on March 20, 2020, and ended on February 28, 2022, for current analyses.
The epidemic started in Fulton County, which had a high BFIR (Fulton). The incidence curve progressed in parallel in counties with distinct levels of BFIR until July 2021, when the Delta variant became predominant (top panel, Fig. 3). Low BFIR counties then reached a rate of 10 incidents per 10,000 population around August 23, 2021. However, on the same day, high BFIR counties reached the daily incident rate peak of 5.5 per 10,000. For daily mortality, high-BFIR counties showed a much flatter curve, without significant surges. In contrast, the counties with low and moderate BFIRs experienced multiple surges (mid-panel, Fig. 3). Low BFIR counties consistently led the mortality epidemic curve by 10–14 days. Daily mortality surpassed 10 deaths per million in every surge in low BFIR counties, but only in the 2020–2021 winter spike in high BFIR counties. The daily mortality rate reached 10 per million on January 12, 2021, in low BFIR counties, but on January 29, 2021, in high BFIR counties, with a 2-week lag. During surges driven by the Delta and Omicron variants, daily mortality rates exceeded 10 per million population in counties with low and moderate BFIRs, but not in those with high BFIRs.
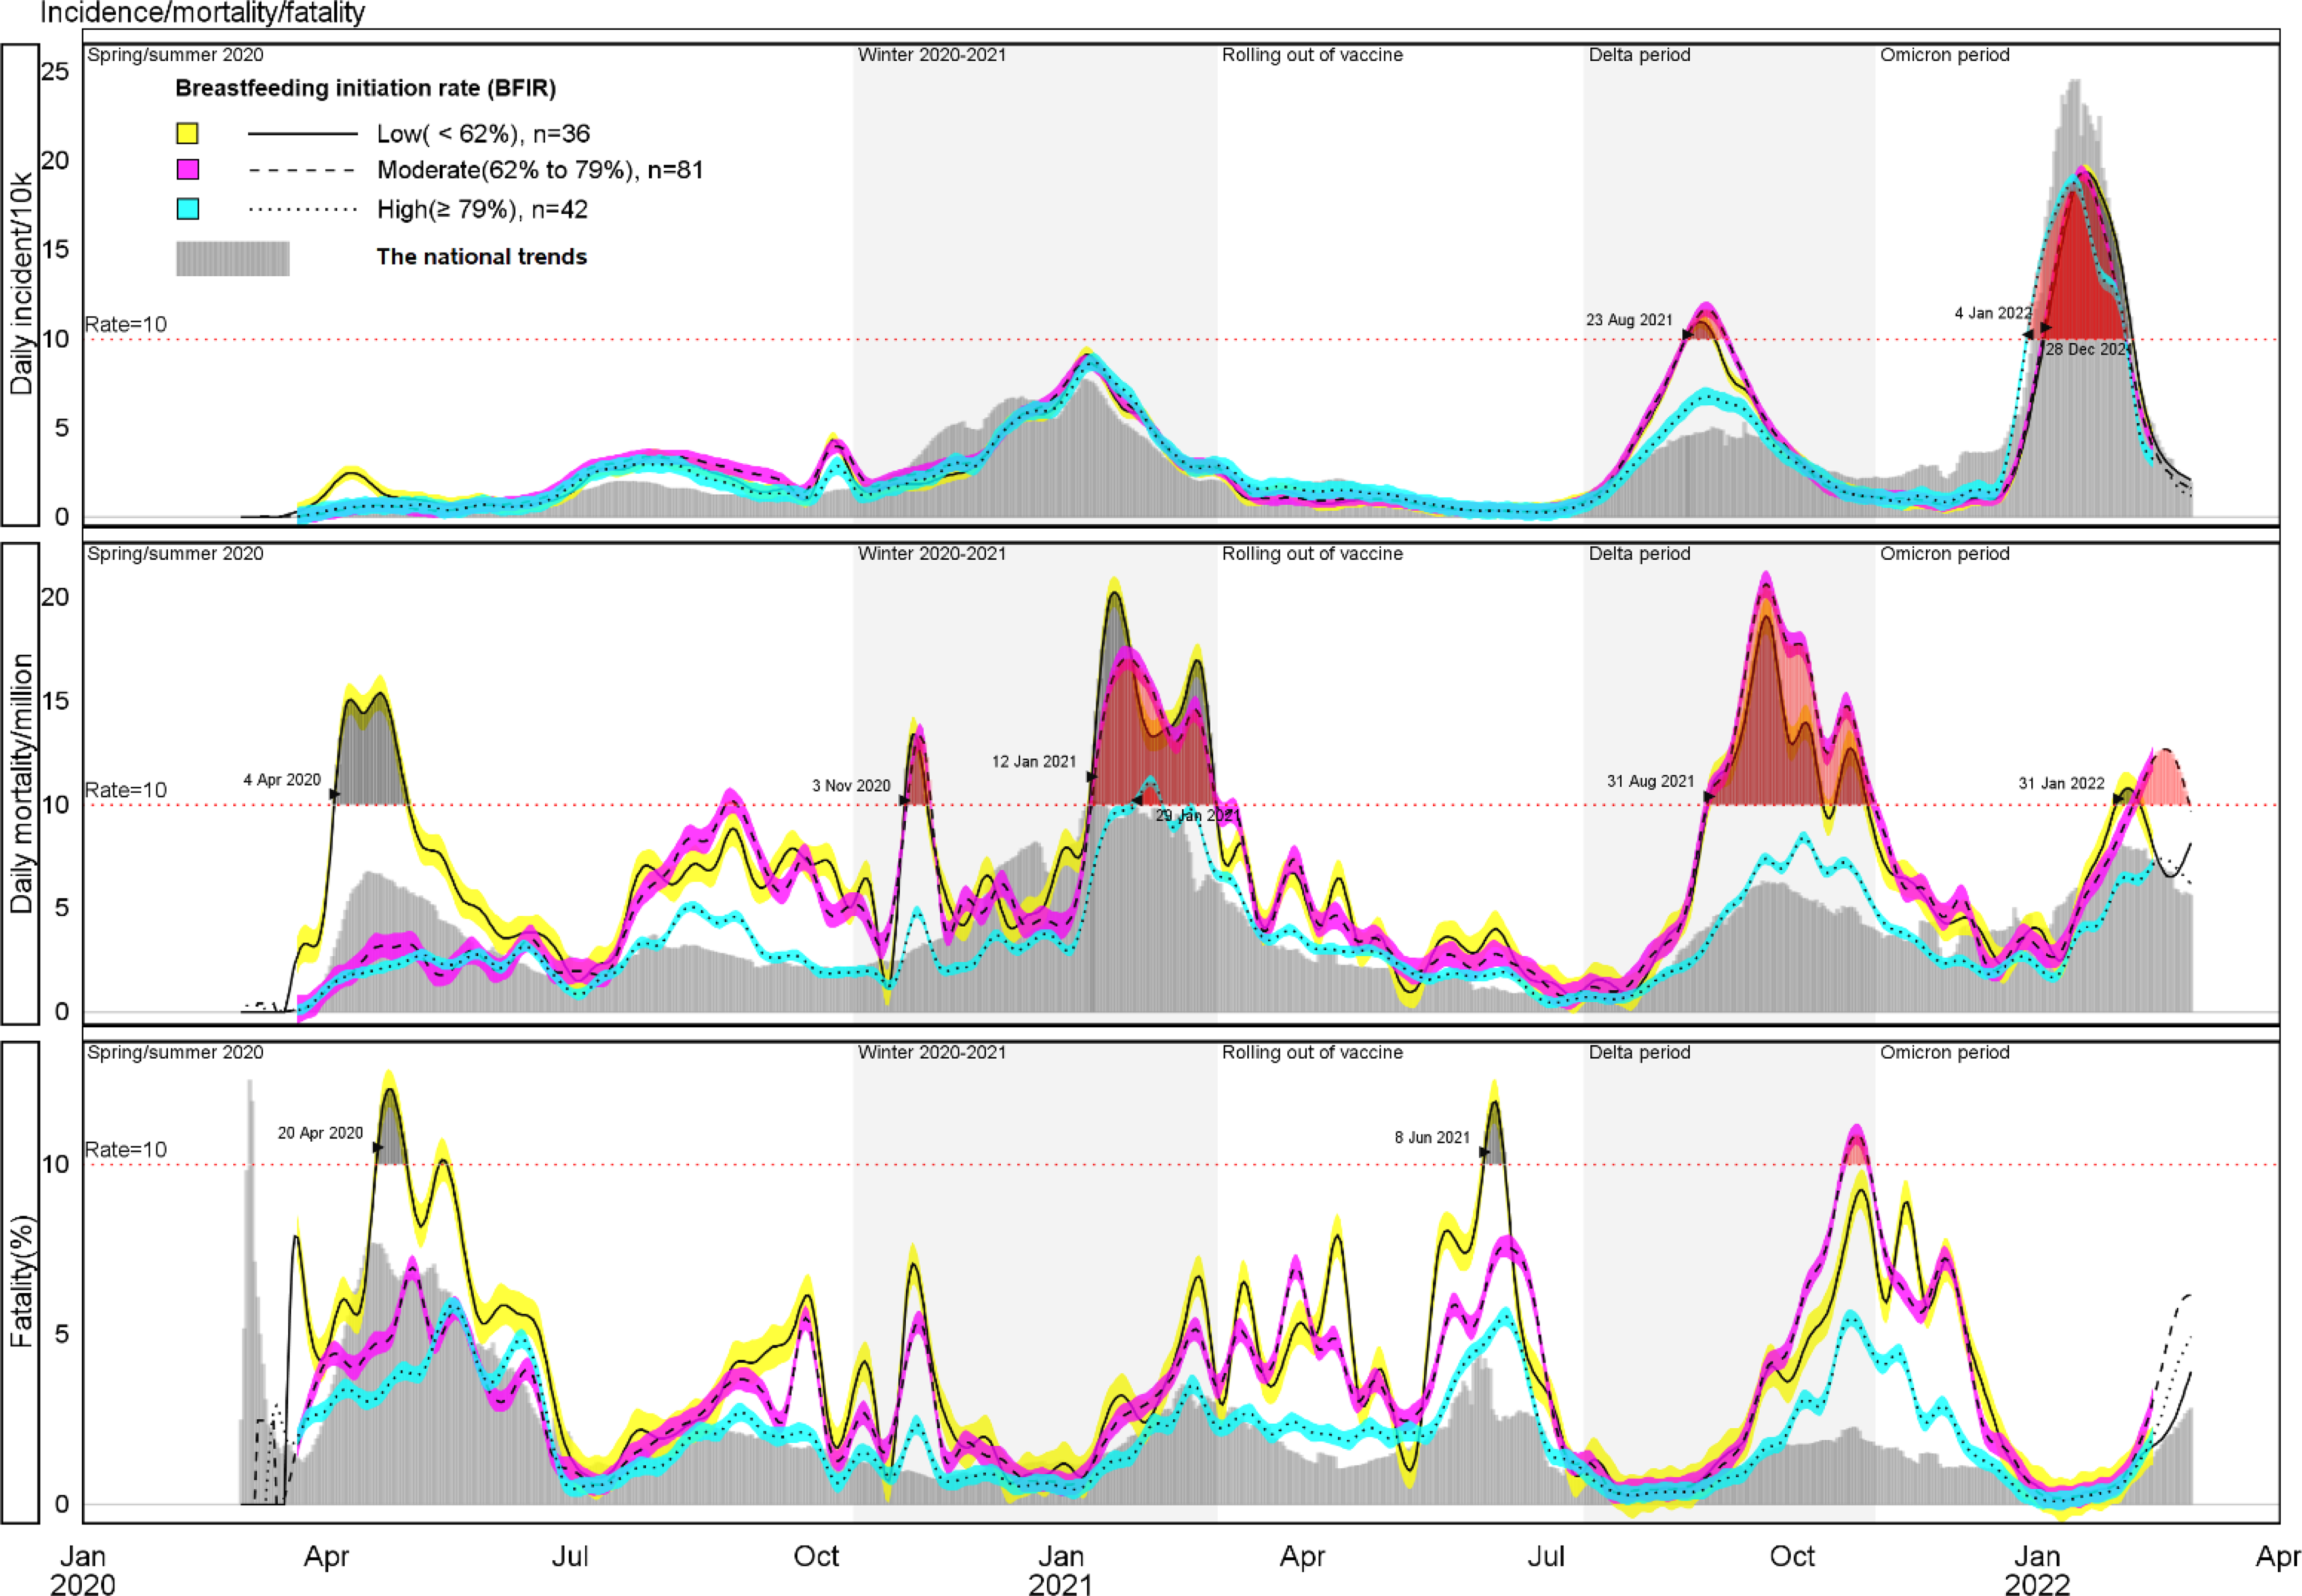
Seven-day COVID-19 Moving Incidence, Mortality, and Fatality by Breastfeeding Initiation Rates 159 Georgia Counties March 01, 2020–February 28, 2022 *,† *Data source: New York Times at http://nytimes.com/interactive/2020/us/coronavirus-us-cases.html †Breastfeeding initiation rates by country in Georgia were available from the U.S. birth certificate breastfeeding initiation data, 2018–2019, at http://cdc.gov/breastfeeding/data/county/2018-2019/georgia.html.
Adjusted for county sociodemographics and stratified by urbanity, the daily incident rates remained higher in counties with low and moderate BFIRs than in those with high BFIRs (Table 2). The association was more consistent in rural areas, where the RR was greater than 1.0 (the null value) at most time points, with statistical significance for some but not all time points due to the small number of observation units and large daily variation in small counties. At the point of data cutoff (i.e., February 28, 2022), a significant dose-response association (p for trend < 0.05) was observed. The adjusted RR of daily incidence for counties with high, moderate, and low BFIR was 1.00 (reference), 1.79 (95% Confidence Intervals [CI] = 0.73, 4.37), and 2.95 (1.11, 6.00) for rural counties (Supplementary Table S4), 1.00, 1.42 (1.07, 1.88), and 1.45 (1.03, 2.04) for urban areas (Supplementary Table S5). No significant RR of mortality and fatality was observed due to the small number of daily deaths reported at the county levels (Supplementary Table S4 and S5).
Adjusted Rate Ratio (RR) of 7-Day Moving COVID-19 Daily Incidence, 159 Georgia Counties by Selected Time Points a
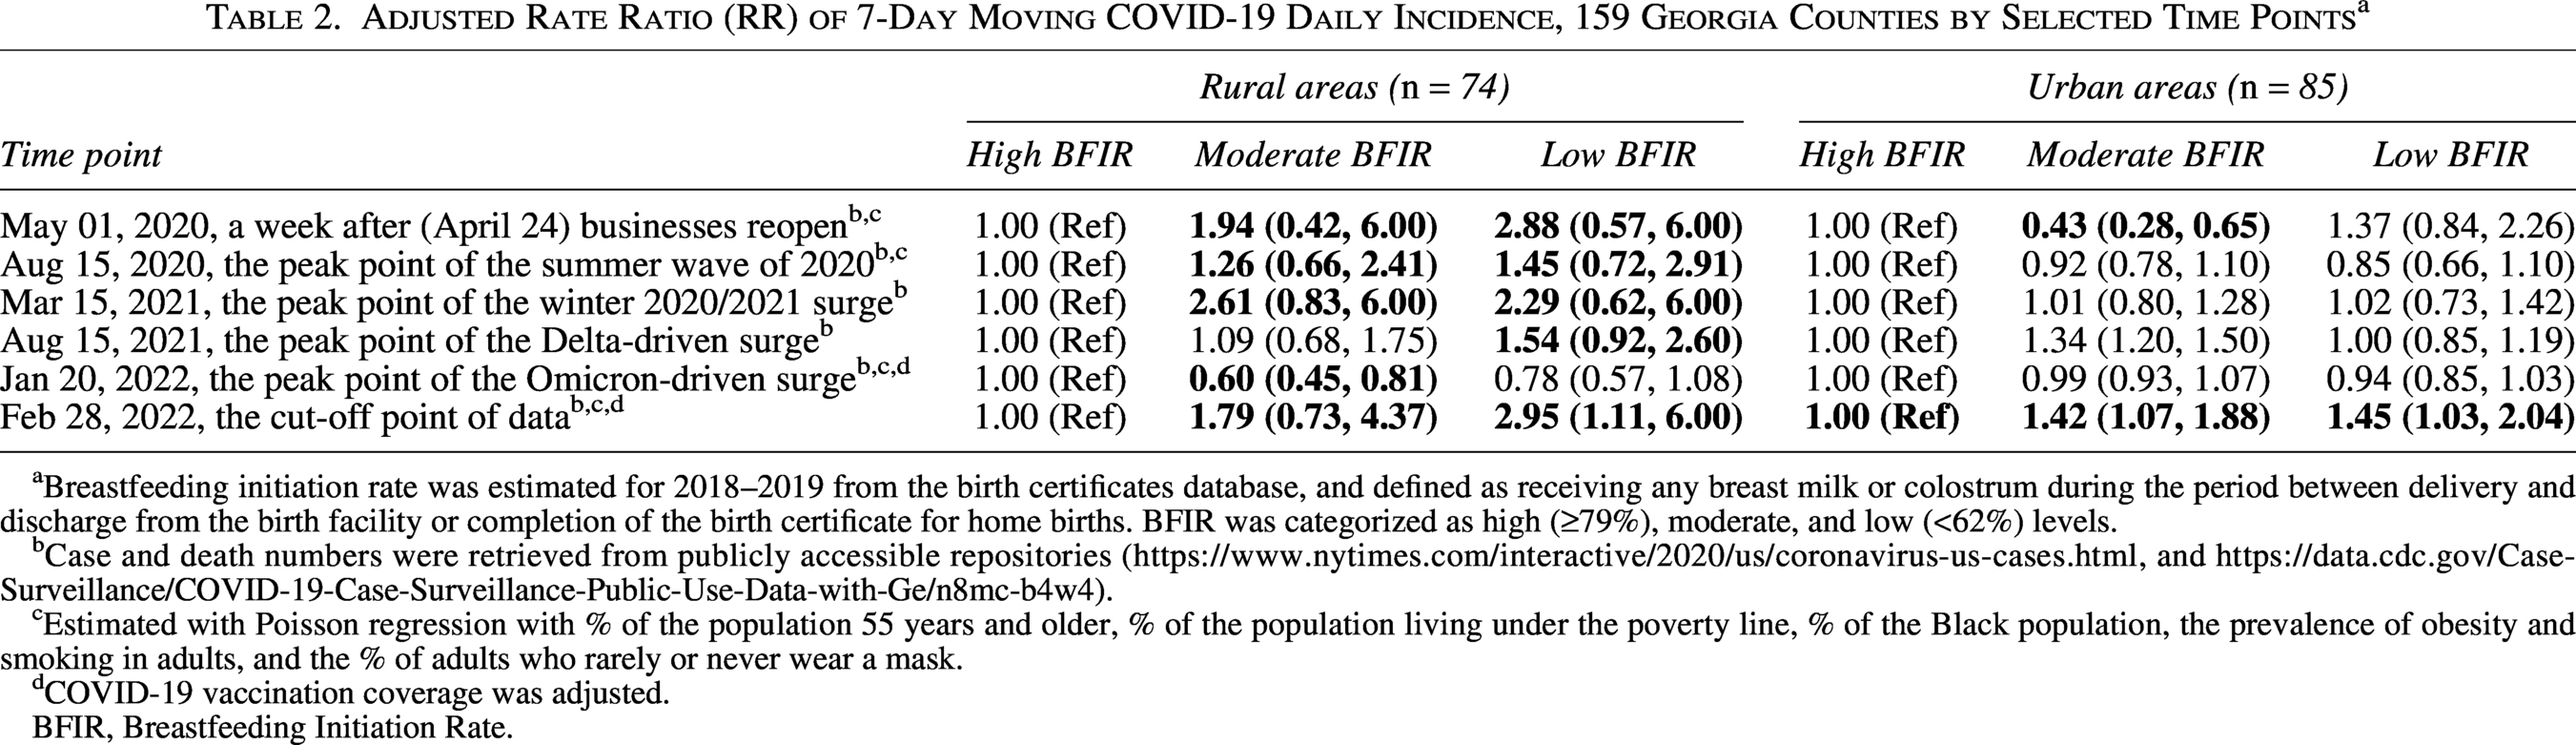
Breastfeeding initiation rate was estimated for 2018–2019 from the birth certificates database, and defined as receiving any breast milk or colostrum during the period between delivery and discharge from the birth facility or completion of the birth certificate for home births. BFIR was categorized as high (≥79%), moderate, and low (<62%) levels.
Case and death numbers were retrieved from publicly accessible repositories (https://www.nytimes.com/interactive/2020/us/coronavirus-us-cases.html, and https://data.cdc.gov/Case-Surveillance/COVID-19-Case-Surveillance-Public-Use-Data-with-Ge/n8mc-b4w4).
Estimated with Poisson regression with % of the population 55 years and older, % of the population living under the poverty line, % of the Black population, the prevalence of obesity and smoking in adults, and the % of adults who rarely or never wear a mask.
COVID-19 vaccination coverage was adjusted.
BFIR, Breastfeeding Initiation Rate.
Discussion
Maternal immunity has been well recognized as transient and most likely pathogen-specific. 2 The association between a high BFIR and a low incidence and mortality of COVID-19 supports the evolutionary maternal foresight hypothesis and suggests that maternal immunity may confer long-term protection, possibly non-antibody-mediated, as humans do not typically develop antibodies against emerging infectious pathogens.
Previous studies reported that breastfeeding boosts immunity and reduces morbidity and mortality from both communicable and non-communicable diseases at both the early and older stages of childhood.8–10 Epidemiological evidence supporting long-term protection of breastfeeding against infectious pathogens beyond childhood is still lacking, 7 and the benefits of breastfeeding exhibited in adulthood are limited to reducing the risk of chronic conditions or diseases, such as allergies, 4 asthma, 3 obesity, 6 hypertension, 5 diabetes, and others. To the best of our knowledge, the current report may be the first epidemiological study to demonstrate potential protection from breastfeeding against infectious pathogens primarily affecting middle-aged and older adults in the general population, where more than 70% of the population are adults. A recent study demonstrated that infant mice breastfed by a mother with a worm infection before getting pregnant acquired lifelong protection against this ailment. 11 The association between a high BFIR and a low incidence and mortality of COVID-19 suggests long-term protection from breastfeeding, extending the conclusion from an animal model to human populations.
The hypothesis that maternal immunity confers long-term protection against emerging infectious pathogens can explain the pediatric population’s relatively low infection rates and less severe conditions from recent novel CoV outbreaks, but not the 1918 influenza pandemic, in which a W-shaped age-specific mortality was quite peculiar. 29 The early exposure to the H3Nx influenza virus circulated during 1889–1890 made the H1N1 virus, the pathogen of the 1918 pandemic, hardly “novel” to humans due to many T cell epitopes shared between H1N1 and H3Nx. 30 The hypothesis that long-term protection from maternal immunity serves as a prophylactic safety net installed by Mother Nature to protect new life from novel or emerging infectious pathogens remains biologically plausible.
It must be noted that the breastfeeding rate is strongly associated with a broad spectrum of policy frameworks and community commitment. 31 Likely, the protection we observed from a high level of BFIRs may echo an effective community defense line built on a strong community commitment to improve the overall well-being of its members. 31 The counties with a high COVID-19-related disease burden and a low BFIR may be trapped with long-existing structural challenges of disease control and prevention. However, current analyses adjusted for a wide range of sociodemographic characteristics, including mask acceptability in communities and COVID-19 vaccination coverage. The likelihood is low that the association between a low BFIR and a high COVID-19 disease burden was attributable to community characteristics. Biological immunity acquired maternally may explain a part of the association.
The association between BFIR and COVID-19-related disease burden changed throughout the pandemic stages and was effect-modified by urbanity. The correlation was weakening in rural areas as a sizable portion of the community (the herd) became immune through infection or vaccination. There is also a possibility that rapid resource relocation, as part of the emergency response, drove COVID-19 dynamics and altered the association between BFIR and COVID-19. This justified our decision to use daily rather than cumulative rates to assess the association of interest. Low social mobility during the pandemic in rural areas may have reduced confounding from socio-behavioral factors, making biological factors more consistent. 32 Since BFIR was measured only once, long-term population stability in rural areas may reduce the misclassification of BFIR categories compared to urban areas, where the population is less stable, making the association more detectable in rural counties after removing sociodemographic confounding. 33
Study strengths and limitations
Given its ecological design, the evidence presented is not as compelling as that from individual-based epidemiologic studies. 34 A focus on women of childbearing age or on recently born infants might yield more biologically targeted insights, but the available data do not support such granularity. It is impractical to randomly assign newborns by feeding method and expose them to emerging infectious pathogens on a large scale for a sufficiently lengthy period to draw confident conclusions about long-term protection from maternal immunity against emerging pathogens. The lack of verification, validation, and consistency in COVID-19 data was concerning, given the epidemic’s ever-evolving nature. 35 Testing capacity may be especially poor in communities where BFIR is low due to insufficient public health infrastructure, leading to an underestimation of protection from breastfeeding. BFIR is an indicator of overall breastfeeding practice. With a substantial percentage of women initiating breastfeeding but failing to practice exclusive breastfeeding for 6 months, 36 more indicators are needed to classify observation units reliably. CoVs are not bound by administrative boundaries that divide one county from another; high levels of SARS-CoV-2 community transmission in neighboring counties with a low BFIR would increase the COVID-19 burden in counties with a high BFIR, leading to an underestimation of the association. Breastfeeding is associated with a reduced risk of various chronic conditions and diseases; these conditions have also been identified as underlying causes of severe COVID-19. 37 We controlled for potential confounding effects from these chronic conditions by including the prevalence of tobacco smoking, alcohol drinking, obesity, and diabetes in regression models. However, the estimates of county-specific prevalence may not be robust due to insufficient or outdated data, 26 and residual confounding remains a possibility. Small daily death numbers at the county level prevented us from investigating the association between BFIR and COVID-19 mortality and fatality with more precision. Future studies with large populations included are warranted. Georgia’s specific health care environment and pandemic response may constrain applicability to other settings. Future studies in different geographic regions are warranted to assess the generalizability of these findings.
Conclusion
Regardless of which factors primarily drive the protective association observed, whether through enhanced individual immunity or strengthened community resilience supported by cohesive policy frameworks and collective commitment, this study offers new insights into how maternal protection may extend beyond the immediate breastfeeding period and helps to defend against infectious diseases, especially the emerging infectious pathogens. The findings contribute to a broader understanding of defense mechanisms against infectious diseases, including emerging pathogens. The COVID-19 pandemic underscores the urgency of implementing holistic and forward-thinking public health strategies—those capable of responding to current crises while fortifying preparedness for future global health emergencies.
Authors’ Contributions
J.Z. and J.C-F. had full access to all the data in the study and took responsibility for the integrity of the data and the accuracy of the data analysis.
Data Availability Statements
The COVID-19 case and death data supporting this study’s findings are available on GitHub (https://github.com/nytimes/COVID-19-data), and COVID-19 Case Surveillance Public Use Data with Geography (https://data.cdc.gov/Case-Surveillance/COVID-19-Case-Surveillance-Public-Use-Data-with-Ge/n8mc-b4w4). The vaccination data were provided by the United States Centers for Disease Control and Prevention (https://data.cdc.gov/Vaccinations/COVID-19-Vaccinations-in-the-United-States-Jurisdi/unsk-b7fc). Breastfeeding data were available from: https://www.cdc.gov/breastfeeding/data/county/2018-2019/georgia.html
The prevalence of smoking and obesity by county among adults was collected in 2015–2016 by the Institute for Health Metrics and Evaluation, University of Washington, and available from https://ghdx.healthdata.org/us-data
Footnotes
Acknowledgment
This article was initially prepared as a group project for graduate students (V.R., C.T., H.M., C.B., and T.D.) enrolled in a seminar on public health surveillance led by Zhang at Jiann-Ping Hsu College of Public Health at Georgia Southern University. No external funds were obtained for the current report.
Disclosure Statement
No competing financial interests exist.
Funding Information
No funding was received for this article.
Supplemental Material
References
Supplementary Material
Please find the following supplemental material available below.
For Open Access articles published under a Creative Commons License, all supplemental material carries the same license as the article it is associated with.
For non-Open Access articles published, all supplemental material carries a non-exclusive license, and permission requests for re-use of supplemental material or any part of supplemental material shall be sent directly to the copyright owner as specified in the copyright notice associated with the article.