
Abstract
Inflammatory bowel disease (IBD) is a chronic and recurrent gastrointestinal disease, the pathogenesis of which has not been fully elucidated. Increasing evidence suggests that the disorder of mitochondrial metabolism is closely related to the pathogenesis of IBD, but its specific regulatory network and key genes remain to be further investigated. IBD-related transcriptome datasets (GSE3365 and GSE75214) and single-cell sequencing dataset (GSE134809) were obtained from the Gene Expression Omnibus database. Differentially expressed genes and hub genes were identified through differential expression analysis and weighted gene co-expression network analysis, and candidate genes were obtained by intersecting these with mitochondrial metabolism-related genes, followed by functional enrichment analysis. Machine learning algorithms were used to screen key genes and construct risk prediction models. Additionally, analysis of GSE134809 single-cell data identified characteristic cell types and expression distribution of key genes in IBD and explored communication between different cell types. Furthermore, immune cell infiltration, competitive endogenous RNA (ceRNA) network, and transcription factor prediction were performed. Finally, the diagnostic performance of key genes was validated in GSE75214 and reverse transcription–quantitative polymerase chain reaction. Two key genes, mitochondrial ribosomal protein L35 (MRPL35) and MRPL39, were identified, which were downregulated in IBD, and had good diagnostic potential. Single-cell analysis revealed that key genes were predominantly highly expressed in mononuclear phagocyte (MNP) cells. MNP cells communicated with other cells through receptor ligands including MIF-(CD74 + CXCR4), MDK-SDC1, and ITGB2-ICAM2, which are complexly related to mitochondrial metabolism. With the progression of IBD, infiltration levels of resting natural killer cells, naive B cells, M2 macrophages, and naive CD4 T cells decreased, and correlations between different cells continuously changed. A ceRNA network centered on XIST, hsa-miR-103a-3p, and MRPL35 was constructed. Additionally, therapeutic drugs targeting key genes were predicted, including cimetidine, eugenol, chlortetracycline, vincristine, irinotecan, bisacodyl, and sulpiride, with molecular docking validating high affinity between these drugs and key targets. This study constructed a multiomics integrated analysis strategy and identified MRPL35 and MRPL39 as potential markers and therapeutic targets, providing new insights for the diagnosis and treatment of IBD.
Keywords
Introduction
Inflammatory bowel disease (IBD) is a group of chronic relapsing gastrointestinal disorders with increasing global incidence and prevalence (Ng et al., 2017). IBD is mainly classified into two categories: ulcerative colitis (UC) and Crohn’s disease (CD), with UC primarily affecting the colon and rectum, while CD can affect any part of the entire digestive tract (Torres et al., 2017). The global IBD patient population has exceeded 6.8 million, with the highest prevalence in Western countries, although emerging industrialized nations are showing rapid growth in prevalence rates (Alatab et al., 2020). The pathogenesis of IBD is complex, involving genetic susceptibility, environmental factors, gut microbiota dysbiosis, and immune regulation disorders (Bruner et al., 2023; Lloyd-Price et al., 2019). Although current IBD treatments including anti-inflammatory drugs, immunosuppressants, biologics, and surgery have made progress, a considerable proportion of patients still experience disease progression, recurrent episodes, or complications. Notably, approximately 30–40% of patients develop primary or acquired drug resistance during treatment, severely affecting patient prognosis and quality of life (Baumgart and Sandborn, 2007; Higashiyama and Hokari, 2023). Therefore, in-depth exploration of the molecular mechanisms of IBD development and discovery of new therapeutic targets are of great significance.
Mitochondria are the energy factories of eukaryotic cells, playing key roles in multiple physiological processes including adenosine triphosphate (ATP) synthesis, reactive oxygen species (ROS) production, calcium ion homeostasis, and cellular apoptosis regulation (Spinelli and Haigis, 2018). Mitochondrial function is closely related to inflammatory responses and immune cell activation (Mills et al., 2017). Studies have shown that mitochondrial dysfunction is closely associated with various diseases, particularly playing an important role in the development of IBD (Novak and Mollen, 2015). Compared with normal intestinal epithelial cells, cells in inflamed intestinal tissues undergo a series of adaptive changes in mitochondrial metabolism, such as weakened oxidative phosphorylation, enhanced aerobic glycolysis, and altered fatty acid metabolism, which may lead to persistent inflammation and tissue damage (Haberman et al., 2014). Research has found that regulating mitochondrial metabolism can alleviate intestinal inflammatory responses and promote mucosal healing (Cunningham et al., 2016; Rath and Haller, 2012). However, current understanding of the molecular mechanisms by which mitochondrial metabolism-related genes participate in IBD progression is not comprehensive or in-depth enough, requiring further elucidation of their action modes and regulatory networks.
The intestinal immune microenvironment, especially immune cell infiltration, plays a crucial role in regulating IBD disease progression and treatment response (Friedrich et al., 2019; Neurath, 2014). Studies have shown that the immune microenvironment in IBD tissues exhibits unique cellular composition characteristics, with infiltrating T cells, B cells, natural killer (NK) cells, dendritic cells, monocytes, macrophages, neutrophils, and other immune cell subgroups participating in complex inflammatory response mechanisms, collectively influencing IBD disease progression, treatment efficacy, and prognosis (Geremia et al., 2014). Notably, as an important component of the innate immune system, mononuclear phagocytes (MNPs) have received increasing attention for their role in the IBD immune microenvironment (Na et al., 2019). On the one hand, MNPs maintain intestinal homeostasis through phagocytosis, antigen presentation, and cytokine production; on the other hand, dysfunctional MNPs may promote chronic inflammation and tissue damage. Research has found that MNP infiltration levels in IBD tissues are closely related to disease activity and patient prognosis. Interestingly, MNPs support their immune functions through metabolic reprogramming during activation, including enhanced mitochondrial respiratory capacity and mitochondrial remodeling. However, the molecular mechanisms by which MNP cells and mitochondrial metabolism participate in IBD progression remain unclear and require further exploration. Therefore, systematically elucidating the metabolic characteristics and molecular mechanisms of MNPs in the IBD microenvironment may provide a scientific basis for targeted regulation of MNP-related mitochondrial metabolism, laying the foundation for developing new immunotherapeutic strategies for IBD.
With the rapid development of sequencing technologies, single-cell RNA sequencing (scRNA-seq) has become a powerful tool for exploring disease heterogeneity and analyzing tissue microenvironments (Potter, 2018). Unlike traditional macroanalysis, scRNA-seq can achieve quantitative analysis of gene expression at the single-cell level, thereby identifying specific cell subgroups and exploring relationships between different cell types (Stuart and Satija, 2019). Additionally, bioinformatics methods have been developed for integrated analysis of massive data, with algorithms such as weighted gene coexpression network analysis (WGCNA) and machine learning capable of screening key diagnostic and prognostic markers. To validate associations between genes and diseases, robust risk prediction models combining multiple biomarkers have been widely applied to screen potential therapeutic targets. These models utilize large-scale transcriptomic data, effectively avoiding confounding biases in traditional research. Therefore, combining scRNA-seq, bioinformatics, and prediction models to conduct multilevel research on IBD molecular mechanisms may provide new strategies for precision diagnosis and treatment of IBD.
This study aims to integrate IBD-related scRNA-seq and bulk RNA-seq data from the Gene Expression Omnibus (GEO) database. Using bioinformatics analysis, we sought to identify key cells involved in IBD progression at the single-cell level and screen key genes related to IBD risk at the overall transcriptomic level. We further focused on exploring the regulatory mechanisms governing interactions between key cells and mitochondrial metabolism in IBD. Subsequently, diagnostic models will be constructed to validate the ability of key genes to predict IBD occurrence. By exploring the relationships between key genes, regulatory mechanisms, immune microenvironment, and drug intervention strategies, this research aims to provide a theoretical basis for future development of immunotherapeutic methods and new drugs for IBD.
Materials and Methods
Data sources
IBD-related transcriptome datasets GSE3365 and GSE75214 were obtained from the GEO database (https://www.ncbi.nlm.nih.gov/geoprofiles/). GSE3365 (GPL96 platform) contains 85 IBD and 42 normal samples. GSE75214 (GPL6244 platform) includes mucosal biopsies from 97 UC patients, 8 CD patients, 67 CD ileal samples, and 11 controls. A total of 1136 mitochondrial metabolism genes were obtained from the MitoCarta database (https://www.broadinstitute.org/mitocarta/). Single-cell sequencing dataset GSE134809 (GPL18573 platform) containing 11 healthy and 11 involved ileal tissue samples was also obtained from GEO.
Single-cell analysis
To investigate cellular interactions and pivotal characteristic cells during IBD development, analysis was conducted utilizing the IBD-associated single-cell dataset GSE134809. Initially, high-quality cells were rigorously screened using “Seurat” (nFeature RNA > 200 and nFeature RNA < 7500 and percent.mt < 20%), followed by data normalization to facilitate subsequent analyses. Cell clustering analysis was then executed employing the “FindNeighbors” and “FindClusters” functions. Cells were categorized into distinct subpopulations utilizing shared nearest neighbor graphs combined with the Louvain algorithm. For annotation of each subpopulation, comparison with established cell type marker genes was performed to determine the identity of individual cell subgroups. Concurrently, nonlinear dimensionality reduction and visualization were accomplished using the “RunUMAP” function, generating Uniform Manifold Approximation and Projection (UMAP) plots that visually demonstrated the distribution patterns of cell subpopulations and spatial distribution variations between IBD and control groups. To further examine alterations in cell subpopulation proportions between IBD and control groups, relative proportions of individual cell types in both sample cohorts were calculated and comparatively analyzed, while simultaneously localizing characteristic cells significantly correlated with mitochondrial metabolism. Furthermore, cell communication analysis was executed employing “CellChat” to establish cell–cell interaction networks for visualizing cellular interaction relationships.
Differential gene expression and risk gene identification
Utilizing the merged dataset, differential analysis was conducted with the limma package to detect differentially expressed genes (DEGs), applying threshold criteria of |fold change| >1.2 and p value <0.05, with subsequent generation of volcano plots and heatmaps for result visualization.
A fold change threshold of |fold change| >1.2, combined with a stringent p value <0.05, was selected to capture subtle but biologically meaningful expression changes in the context of chronic inflammatory disease. Unlike malignant tumors, IBD-associated transcriptomic datasets typically exhibit relatively modest expression alterations in intestinal mucosal tissue, and applying a conventional threshold of ≥1.5 or ≥2.0 would risk excluding a substantial proportion of biologically relevant genes. This threshold is consistent with its application in prior multiomics studies employing proteomic and transcriptomic analyses in disease-relevant contexts (Zhang et al., 2019) and provides an appropriate balance between analytical sensitivity and specificity.
Weighted gene coexpression network analysis
WGCNA was executed to detect co-expression modules and hub genes. Determination of the optimal soft threshold β was achieved utilizing the pickSoftThreshold function. Module identification was accomplished via hierarchical clustering, with a minimum module size established at 30 and a cutting height set to 0.25. Correlation analysis between module eigengenes (MEs) and clinical features was performed (p < 0.05). Candidate genes were determined through the intersection of characteristic cell DEGs, identified DEGs, mitochondrial metabolism genes, and WGCNA hub genes.
Enrichment analysis and protein–protein interaction
To comprehensively investigate the biological functions involving mitochondrial metabolism during IBD development, functional enrichment analysis was further performed on candidate genes. The DAVID database (https://david.ncifcrf.gov) was employed to execute functional enrichment analysis of these genes utilizing Kyoto Encyclopedia of Genes and Genomes (KEGG) pathways and Gene Ontology (GO). Enrichment levels of candidate genes within each KEGG pathway or GO term were calculated using Fisher’s exact test. Significantly enriched terms (p < 0.05) were identified to reveal the principal biological functions and signaling pathways associated with mitochondrial metabolism in IBD.
Subsequently, construction of a protein–protein interaction (PPI) network for candidate genes was accomplished utilizing the STRING database (https://cn.string-db.org/). Within the STRING database, species specification was set to “Homo sapiens,” the candidate gene list was inputted, and default parameters (minimum interaction threshold of 0.4) were applied to acquire the PPI network. Cytoscape software was employed for visualization and topological structure analysis of the PPI network, with calculation of network node centrality indices (such as degree and betweenness) to elucidate protein interaction relationships.
Selection of key genes through machine learning algorithms
To further ascertain the most diagnostically valuable gene targets in IBD, four machine learning algorithms along with PPI–maximum clique centrality (MCC) were applied to previously identified candidate genes: extreme gradient boosting (XGBoost), random forest (RF), least absolute shrinkage and selection operator (LASSO), support vector machine–recursive feature elimination (SVM-RFE), and identification of nodes with centrality in the maximum clique (PPI-MCC). Genes identified at the intersection of XGBoost, LASSO, SVM-RFE, RF, and PPI-MCC were designated as key genes for IBD diagnosis and progression.
Immune infiltration analysis
Estimation of abundance for 22 immune cell types was performed using cell-type identification by estimating relative subsets of RNA transcripts (CIBERSORTx; https://cibersortx.stanford.edu/). Comparison of immune infiltration between IBD and control samples was conducted via the Wilcoxon rank-sum test. Assessment of relationships between immune cells and key genes was accomplished through Pearson correlation analysis.
Competitive endogenous RNA network construction and transcription factor prediction
Construction of the competitive endogenous RNA (ceRNA) network was achieved using miRNet (https://www.mirnet.ca/) through the prediction of regulatory relationships among key genes, miRNAs, and lncRNAs, followed by visualization with Cytoscape. Transcription factor (TF) enrichment analysis was executed utilizing the TRRUST database (https://www.grnpedia.org/trrust/) with a hypergeometric distribution test (p < 0.05), and TF-gene regulatory networks were established using Cytoscape.
Validation of key gene expression
Analysis of key gene expression in disease samples versus control samples across both training and validation sets was performed using the Wilcoxon rank-sum test (p < 0.05). Receiver operating characteristic (ROC) curve analysis was executed employing the “pROC” package, with genes exhibiting an area under the curve (AUC) >0.7 in both training and validation sets regarded as possessing favorable discriminatory capability.
Drug prediction and molecular docking analysis
Key genes were uploaded to the Enrichr database (https://maayanlab.cloud/Enrichr/) for drug prediction utilizing DSigDB. Additionally, molecular docking analysis was executed using AutoDock Vina software to examine interaction strength and binding modes between small molecule drugs and key targets. Three-dimensional structures of candidate drugs were retrieved from the PubChem database, with docking regions defined based on target protein structures. Ligand–receptor complexes exhibiting the strongest binding energies were visualized to demonstrate interaction modes.
Reverse transcription–quantitative polymerase chain reaction
Extraction of total RNA was accomplished using the TRIzol reagent (Invitrogen, USA), with reverse transcription performed using the PrimeScript RT reagent kit (Takara, Japan) according to the manufacturer’s protocol. Reverse transcription–quantitative polymerase chain reaction (RT-qPCR) was executed using the TB Green Premix Ex Taq with cycling conditions consisting of: 95°C for 30 sec, followed by 40 cycles of 95°C for 5 sec and 60°C for 30 sec. Primer sequences are presented in Supplementary Table S1. Calculation of relative gene expression was performed using the 2−ΔΔCt method with GAPDH as the internal control. A total of 12 subjects were enrolled in the RT-qPCR validation cohort, comprising 6 IBD patients (mean age 39.8 ± 8.6 years; 3 male/3 female) and 6 healthy controls (mean age 38.3 ± 7.4 years; 3 male/3 female). Detailed clinical characteristics, including disease subtype, disease duration, and medication history, are summarized in Supplementary Table S2.
Results
Results of single-cell analysis
To deeply explore cellular interactions and mitochondrial metabolism expression distribution within cells in the development of IBD, based on the GSE134809 single-cell dataset, after strict quality control to obtain core cells and normalize the data, qualified cells were extracted for subsequent analysis (Fig. 1A). Meanwhile, standardized data showed good sample distribution characteristics through dimensionality reduction analysis, with differences in cell distribution between the IBD group and the control group (Fig. 1B). Through variance analysis of core cells in the GSE134809 single-cell dataset, genes with strong variability were obtained, the two sample groups were combined and subjected to principal component (PC) analysis, and the first 14 PCs (p < 0.05) were finally determined. Then, using the UMAP algorithm, core units were classified into 15 independent cell clusters (Fig. 1C). Subsequently, marker genes were sought through literature review to manually annotate different clusters. Finally, cells were divided into six types: T cells, B cells, plasma cells, MNPs, stromal cells, and mast cells (Fig. 1D,E). We later observed differences in cell proportions between the IBD and normal control (NC) groups, with notable differences in T cells, B cells, plasma cells, MNP, and stromal cells, where macrophages, in which mitochondrial metabolism plays an important role in IBD, showed a reduced proportion in the IBD group (Fig. 1F).
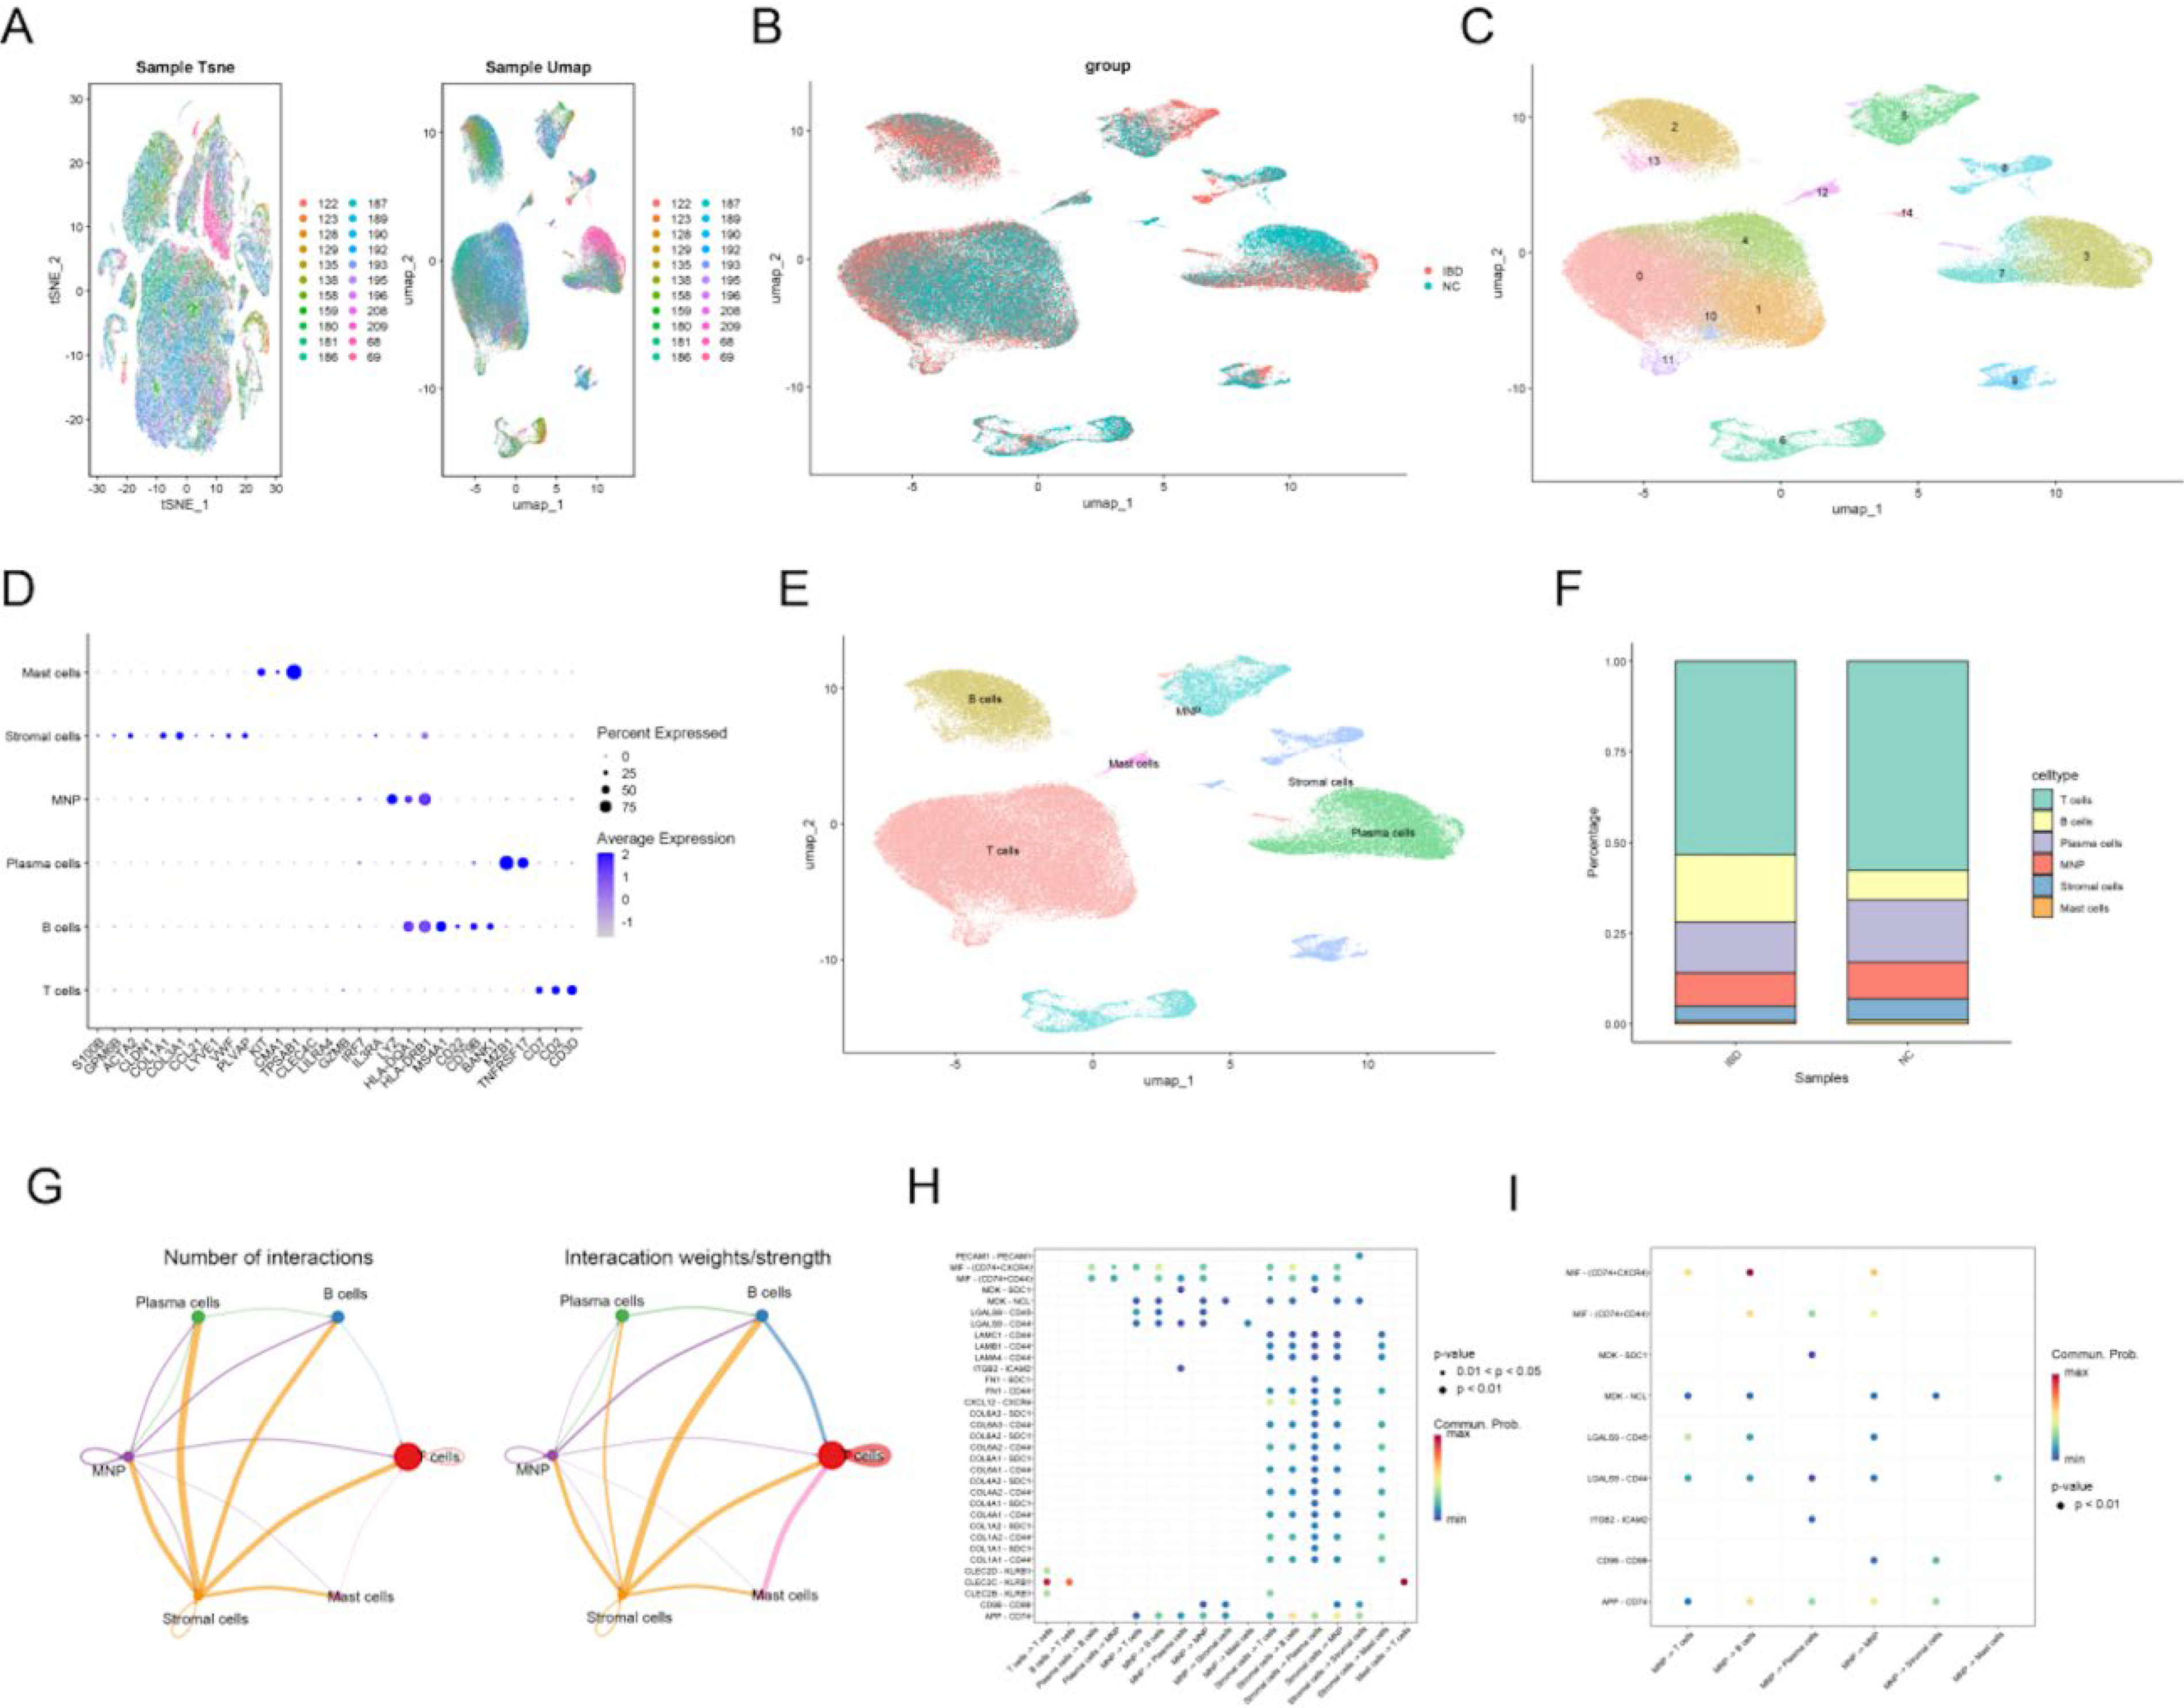
Single-cell data analysis and cell communication: t-SNE visualization of single-cell RNA-seq data showing cell clusters colored by t-SNE (left) and UMAP (right) with corresponding color legends.
Subsequent cell communication analysis revealed significant interactions between various cells in IBD tissue samples, with particularly dense mutual communication between MNP, stromal cells, and other cells (Fig. 1G). Further focusing on cell-to-cell communication relationships, significant ligand–receptor pairs and their communication probabilities between different cell types were displayed, showing that PECAM1-PECAM1 and MIF-(CD74 + CXCR4) ligand–receptor pairs had higher communication probabilities between specific cell groups (Fig. 1H). Subsequently focusing on MNP cells, MIF-(CD74 + CXCR4) had the highest probability in MNP -> T cell and MNP -> B cell communications (redder color), while ligand–receptor pairs such as MDK-SDC1 and ITGB2-ICAM2 showed significant communication in multiple cell combinations. These findings reveal the important signaling role of MNP in immune regulation (Fig. 1I).
Transcriptome data differential expression analysis and WGCNA
Differential expression analysis of transcriptional data identified DEGs (Fig. 2A and B). WGCNA was performed on the training dataset to determine key modules and hub genes associated with IBD. The pickSoftThreshold function established an optimal soft threshold β of 4 (Fig. 2C). Using this threshold, a co-expression network was constructed, followed by gene clustering and module identification, yielding 18 distinct modules (Fig. 2D). Module–phenotype correlation analysis examined relationships between each module and IBD clinical characteristics (Fig. 2E). Multiple modules showed significant associations with IBD pathogenesis (p < 0.05), notably light green, dark turquoise, blue, cyan, and royal blue. ME correlation analysis revealed correlation distances exceeding 0.25 between all modules, confirming their independence (Fig. 2F). From these significantly associated modules, 4444 hub genes were identified. These were cross-referenced with three gene sets: DEGs from MNP cells, DEGs from bulk RNA-seq analysis, and mitochondrial metabolism-related genes. This intersection yielded 23 candidate genes showing consistent upregulation or downregulation patterns (Fig. 2G, H), suggesting their potential regulatory significance in IBD pathogenesis.
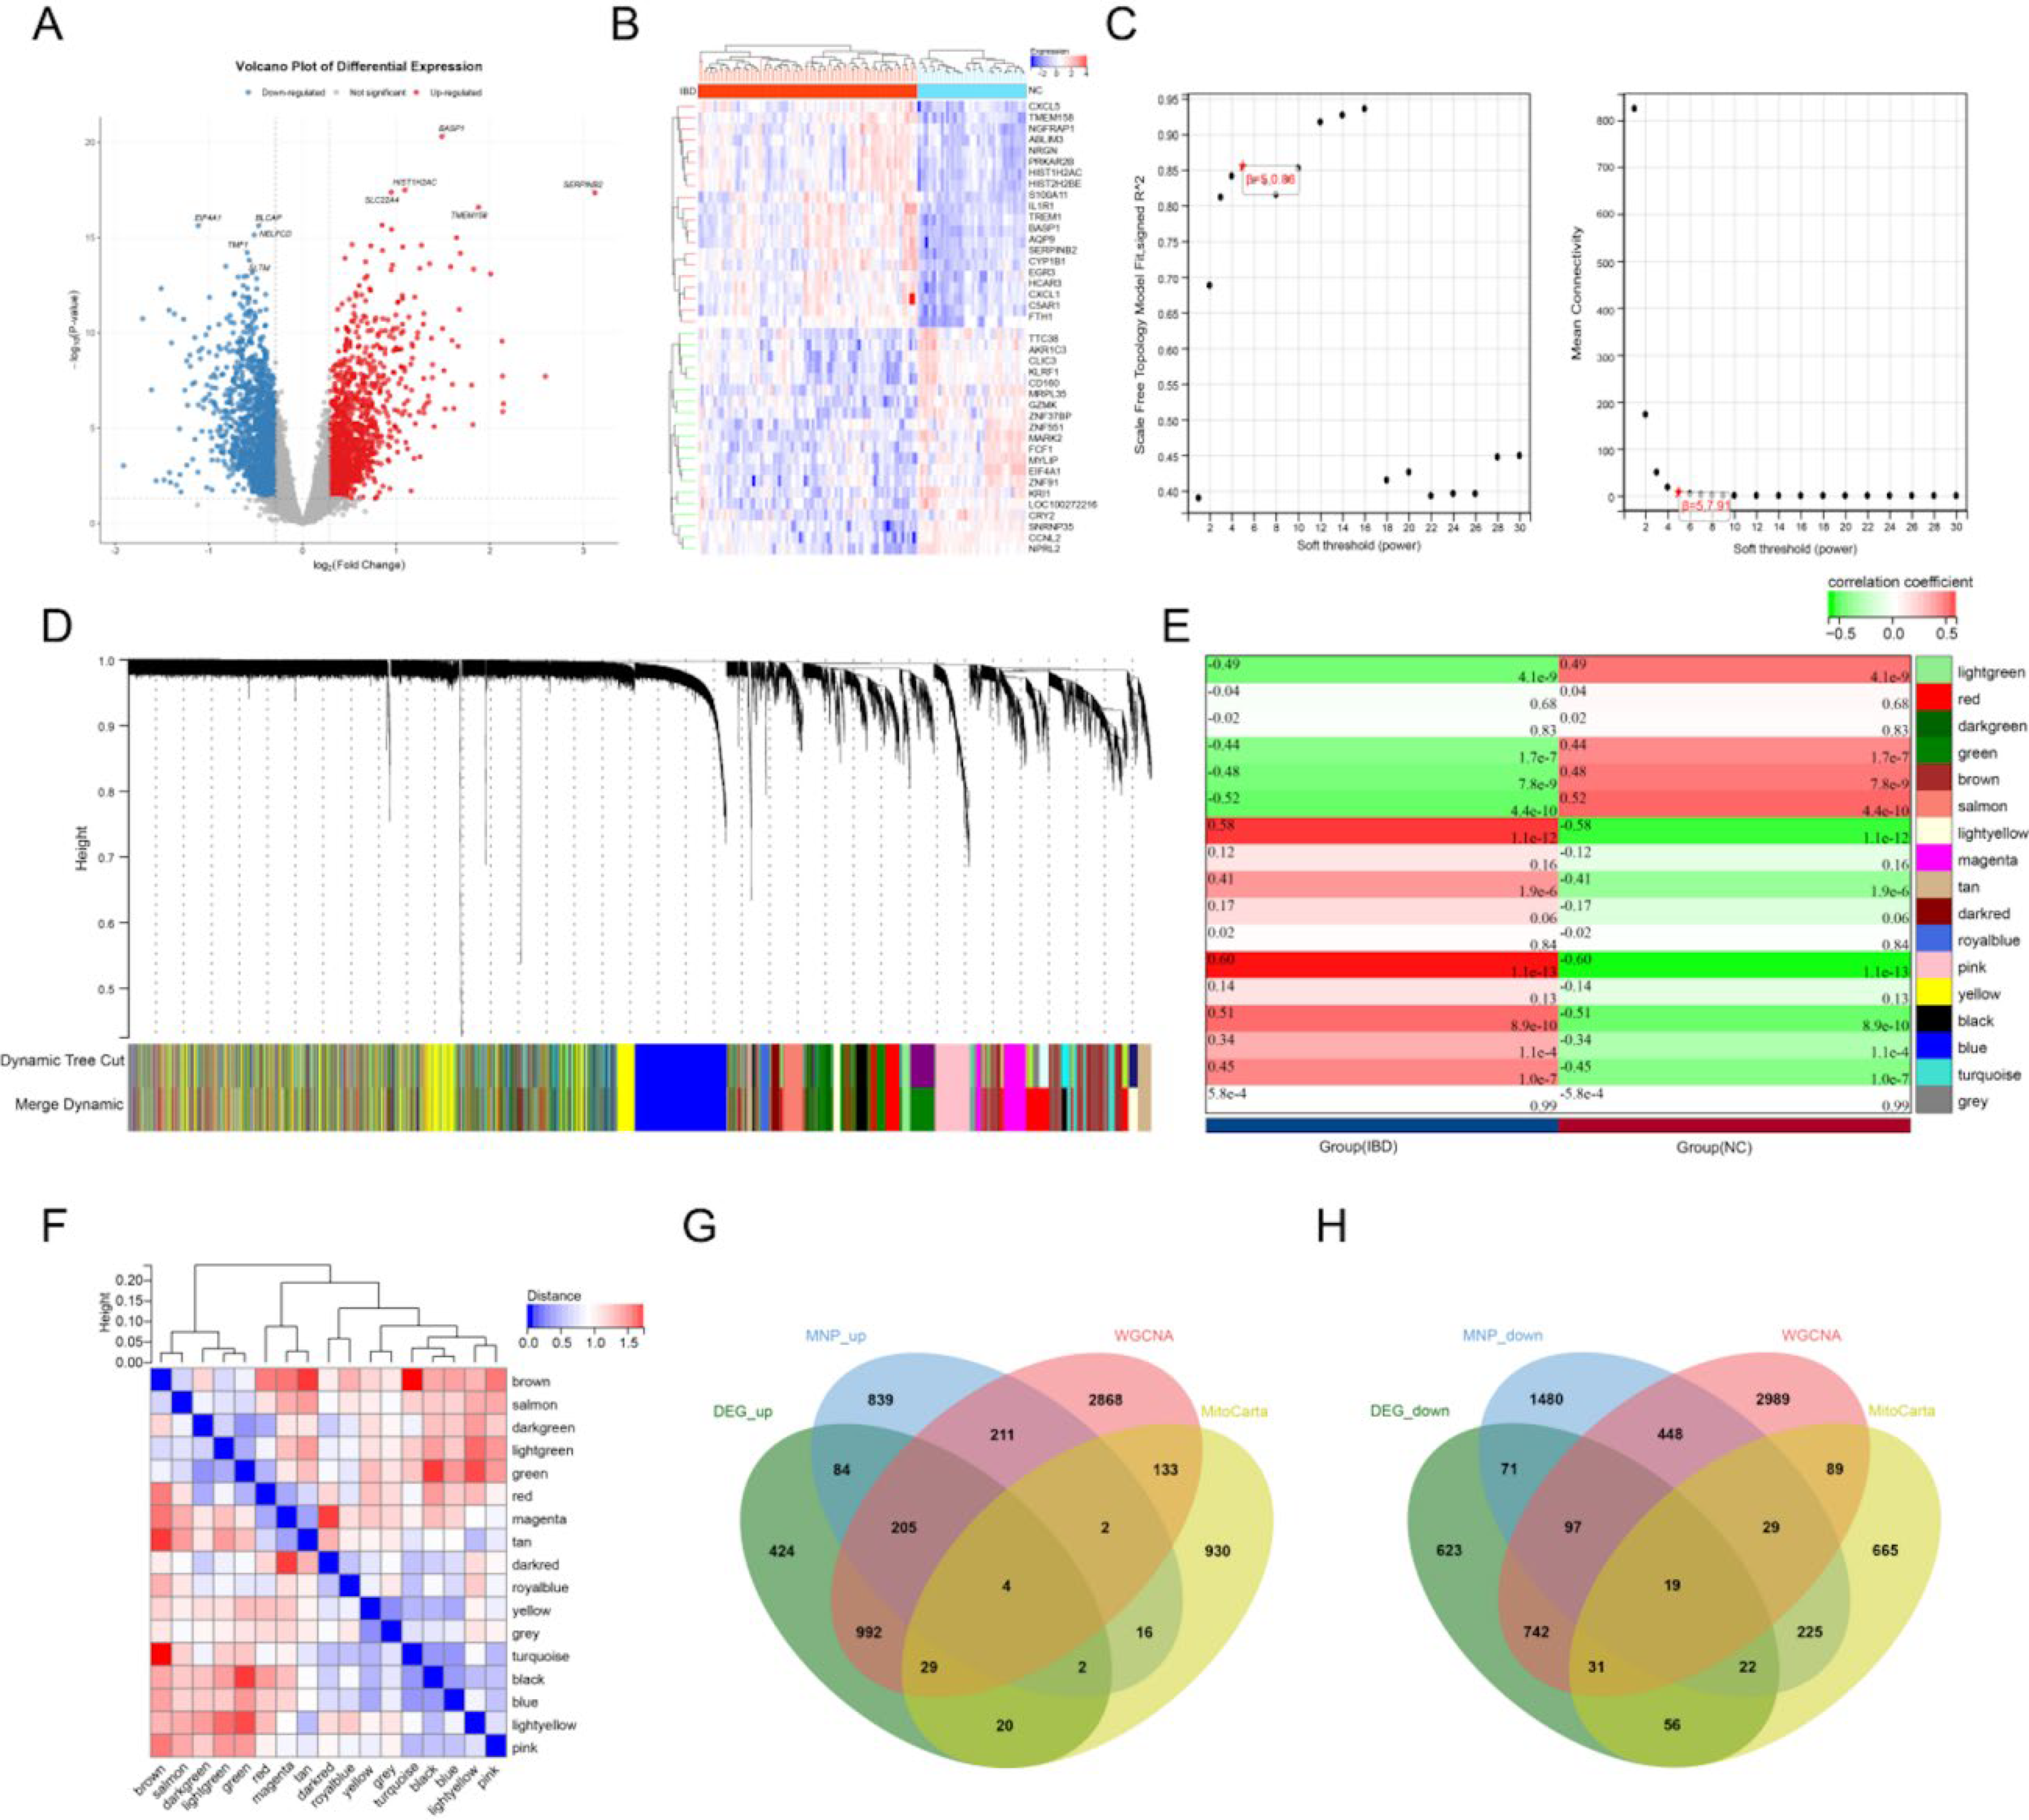
WGCNA results: Volcano plot of differential gene expression showing upregulated (red), downregulated (blue), and nondifferential (gray) genes.
Candidate GO analysis and PPI
In GO enrichment analysis, these genes were mainly enriched in biological processes such as fatty acid transmembrane transport, mitochondrial transport, protein targeting to mitochondrion, mitochondrial gene expression, establishment of protein localization to mitochondrion, protein localization to mitochondrion, positive regulation of release of cytochrome c from mitochondria, oxidative phosphorylation, and very long-chain fatty acid metabolic process (Supplementary Fig. S1A); cellular components such as mitochondrial outer membrane, organelle outer membrane, outer membrane, mitochondrial matrix, peroxisome, microbody, peroxisomal membrane, microbody membrane, and mitochondrial protein-containing complex (Supplementary Fig. S1B); and molecular functions such as toxic substance binding, ether hydrolase activity, hydrolase activity, acting on ether bonds, arachidonate-CoA ligase activity, BH domain binding, ligase activity, long-chain fatty acid-CoA ligase activity, lipid phosphatase activity, CARD domain binding, and NADPH binding (Fig. 1C). KEGG enrichment analysis showed that these genes participate in signaling pathways such as peroxisome, fatty acid biosynthesis, propanoate metabolism, chemical carcinogenesis—ROS, thermogenesis, adipocytokine signaling pathway, apoptosis, and measles (Supplementary Fig. S1D,E).
The PPI network included 23 genes and 66 interaction relationships. Analysis of the topological structure parameters of each node in the network showed that genes such as MTRF1, ACSL1, mitochondrial ribosomal protein L35 (MRPL39), and NDUFAF4 had high central connectivity (degree value) in the PPI network, indicating that these genes might play important roles in disease progression through mutual regulation with multiple other common genes (Supplementary Fig. S1F).
Machine learning selection of key genes
Four machine learning methods and PPI-MCC were used to screen 23 genes in the training set. First, the RF algorithm was used to screen genes, obtaining 10 feature genes (Fig. 3A). Through LASSO logistic regression analysis, 13 feature genes were obtained (Fig. 3B). Next, the eXtreme Gradient Boosting (XGBoost) algorithm was used to screen genes, obtaining 6 feature genes (Fig. 3C), followed by SVM-RFE algorithm analysis to screen 20 feature genes (Fig. 3D,E). Last, the TOP10 genes were screened through the PPI-MCC algorithm (Fig. 3F). By taking the intersection of genes screened by the above five algorithms, two key genes were finally obtained: MRPL39 and MRPL35 (Fig. 3G).
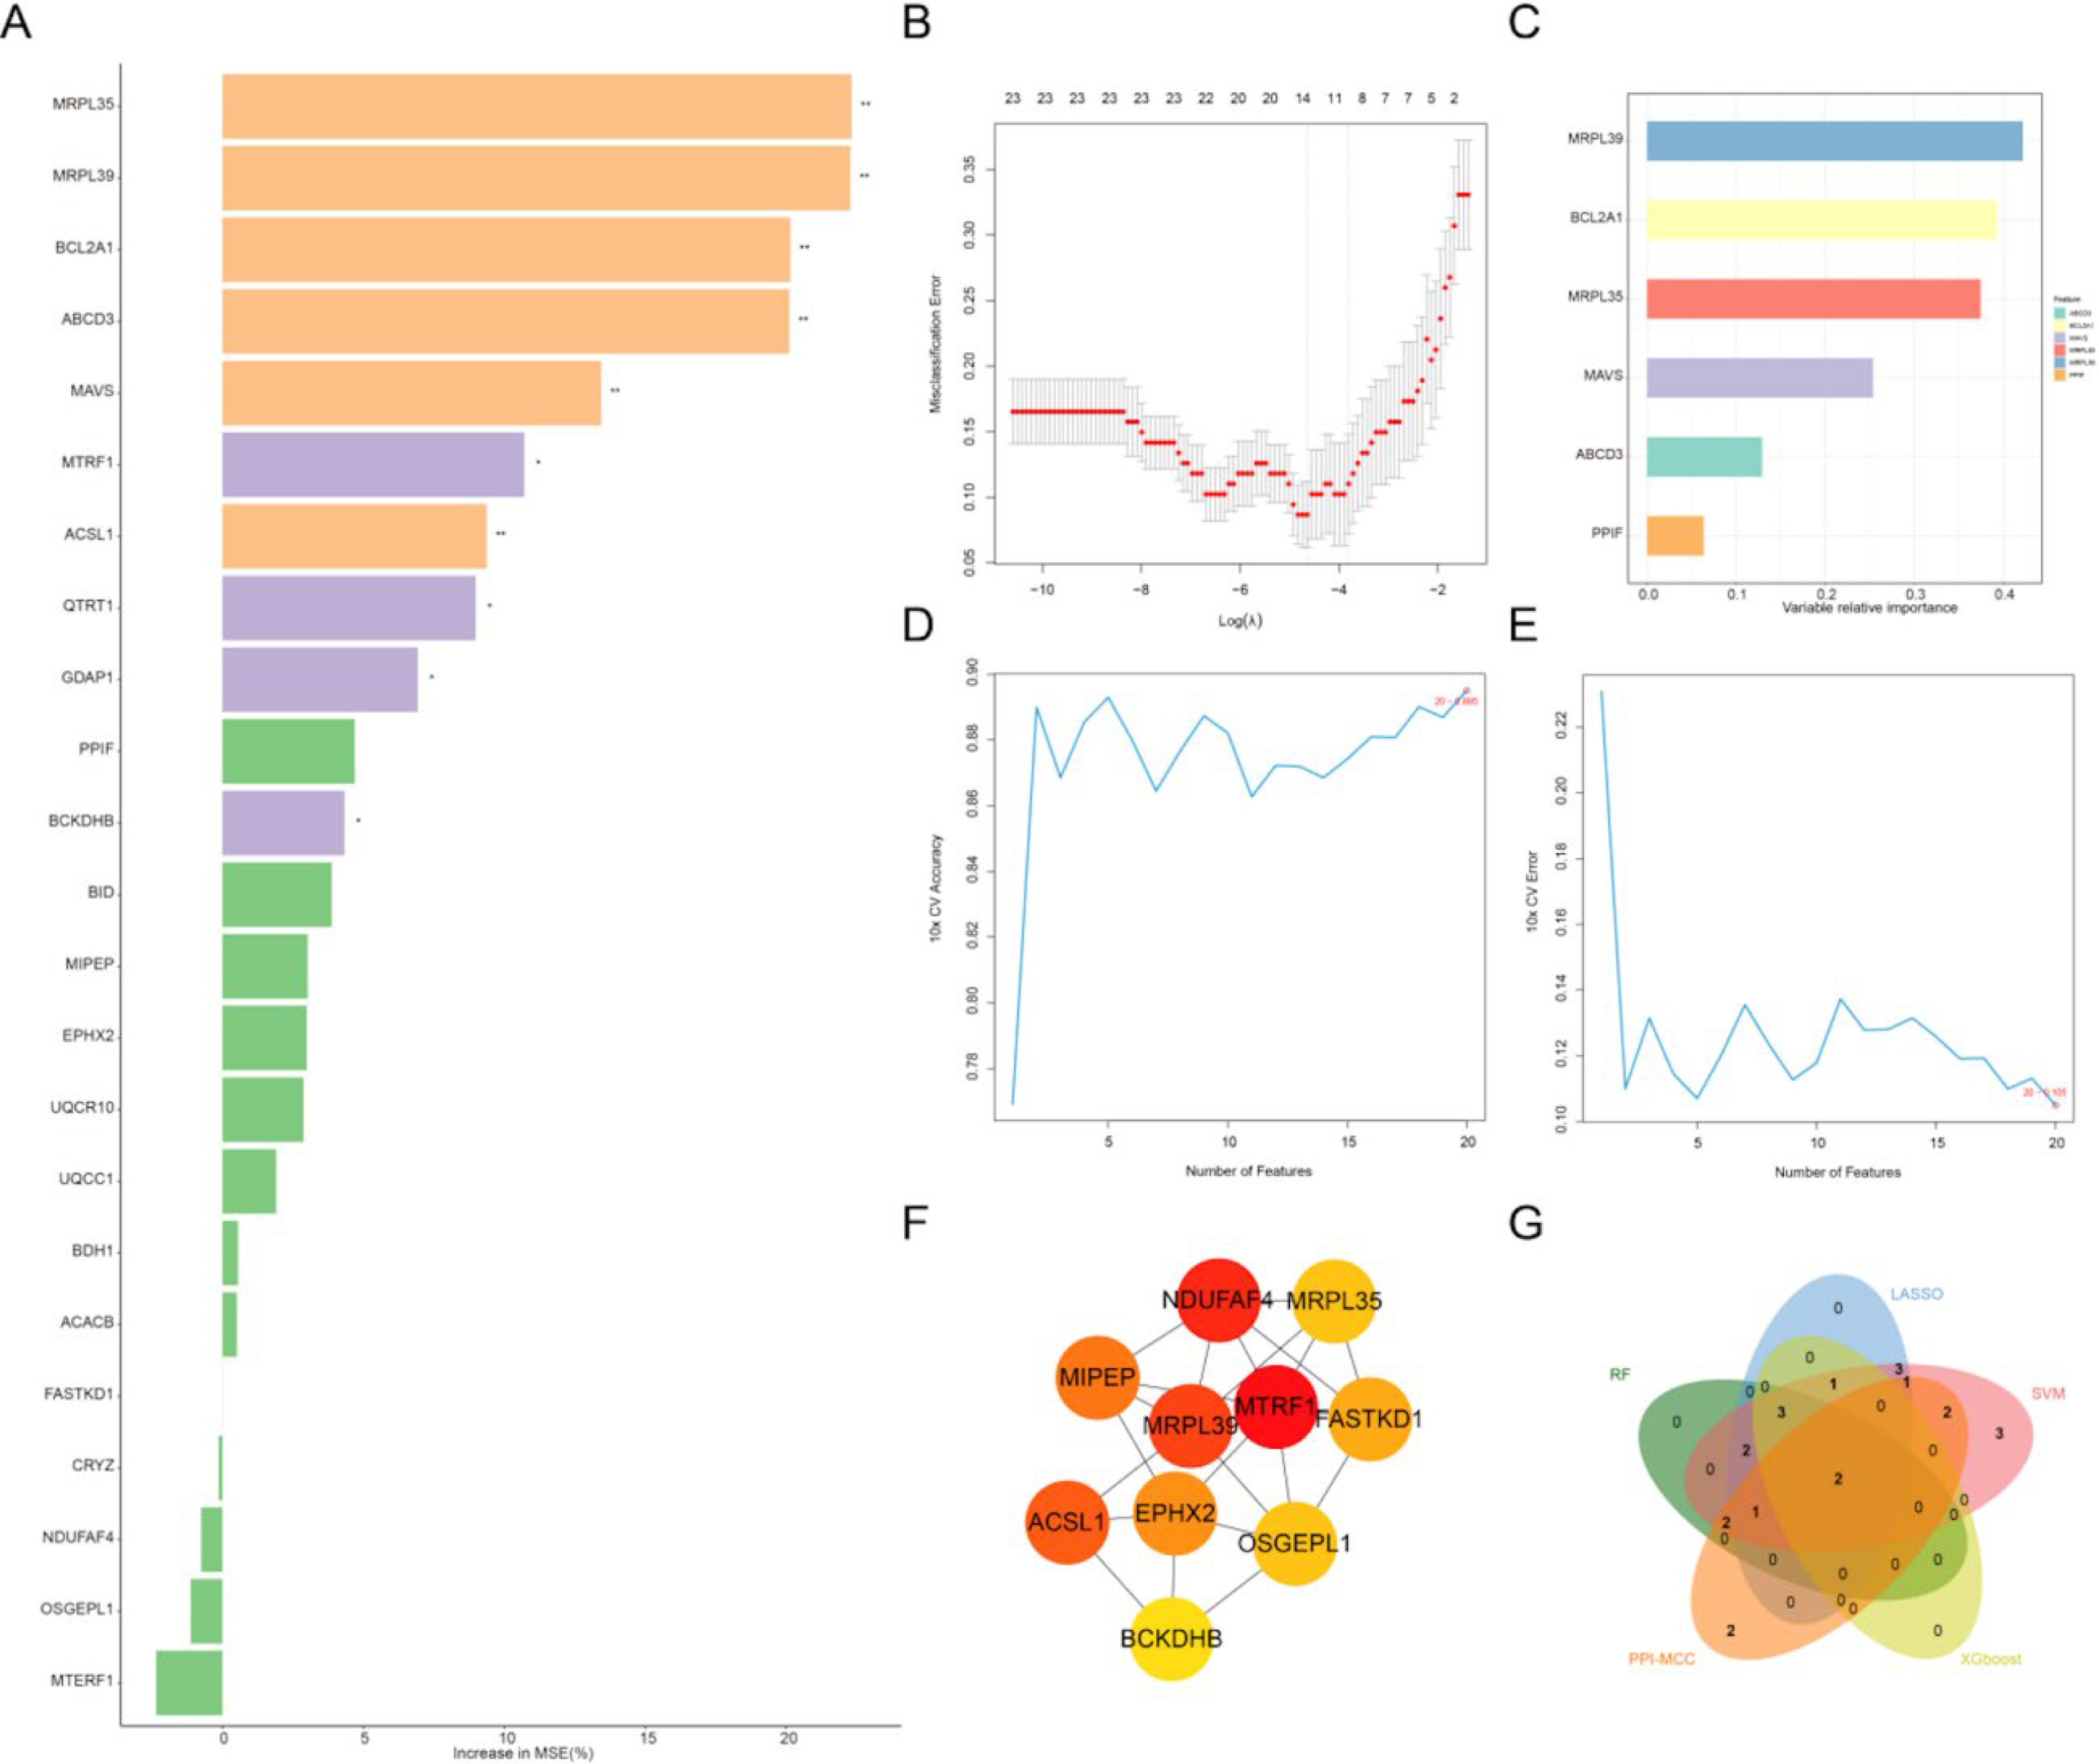
Machine learning screening of key genes: Screening of 23 candidate genes using the random forest algorithm, with gene importance ranking (represented by percentage increase in MSE).
A nomogram risk prediction model was developed using the two key mitochondrial metabolism genes to assess IBD risk. Both MRPL39 and MRPL35 showed that their low expression levels represented risk factors for IBD (Fig. 4A). The calibration curve demonstrated strong agreement between predicted and actual probabilities, confirming the model’s high predictive performance (Fig. 4B). Decision curve analysis further assessed the clinical utility of this nomogram (Fig. 4C). Across a broad range of threshold probabilities, the nomogram yielded greater net benefit compared with the two extreme strategies of treating all or no patients, demonstrating its potential clinical value for decision-making applications.
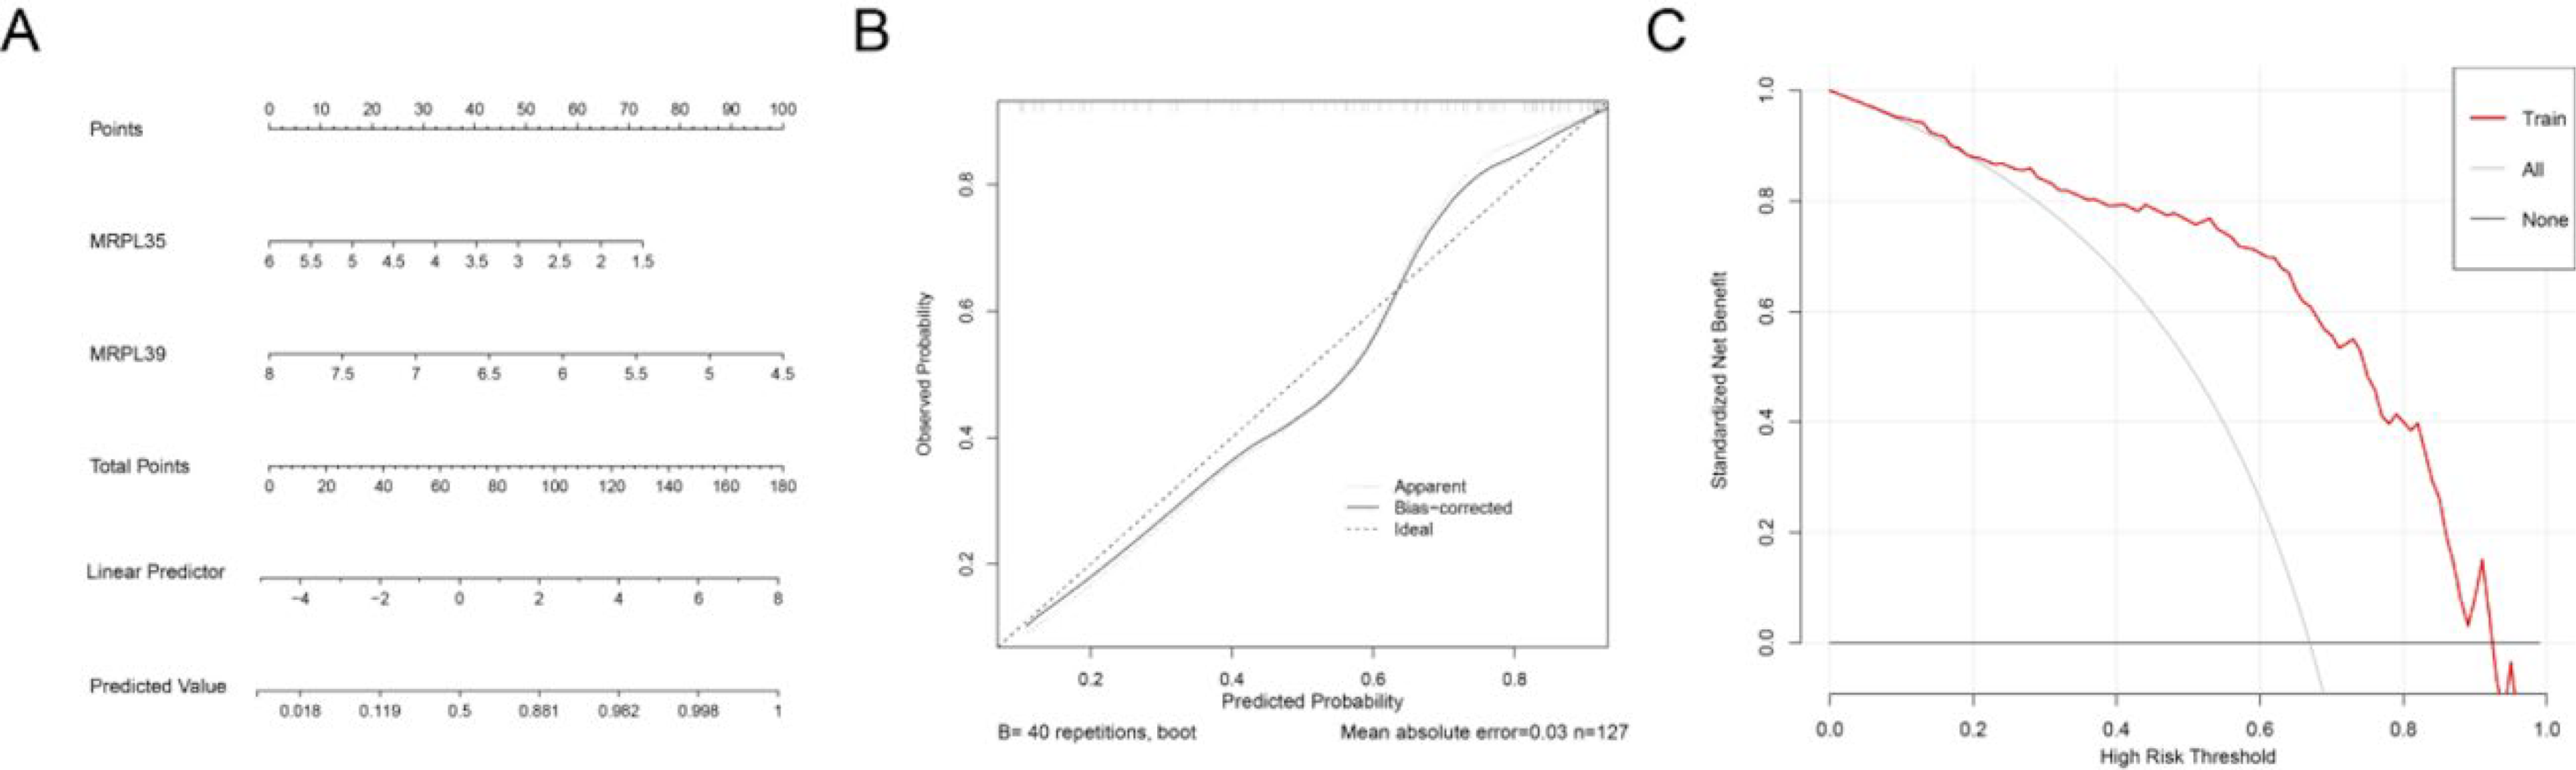
Nomogram and evaluation results: Construction of nomogram model based on key inflammatory genes;
Immune cell infiltration characteristics in IBD
To understand the immune microenvironment in the ileal tissue of IBD patients, we used algorithms such as CIBERSORT to calculate the abundance or infiltration proportions of different immune cell subgroups (such as T cells, B cells, NK cells, and macrophages) in IBD tissues based on gene expression profile data from the training set.
Stack plots revealed 22 immune cell types in IBD and NC samples, with monocytes exhibiting the highest infiltration levels (Fig. 5A). Correlation analysis among these populations identified the strongest positive association between activated CD4+ memory T cells and activated mast cells, while resting NK cells and M0 macrophages displayed the strongest negative correlation (Fig. 5B). Comparative analysis of immune cell infiltration between IBD and NC groups revealed significant differences. The IBD group showed elevated levels (p < 0.05) of follicular helper T cells, eosinophils, neutrophils, M0 macrophages, M1 macrophages, and plasma cells. Conversely, resting NK cells, naive B cells, M2 macrophages, and naive CD4+ T cells were significantly reduced in IBD patients (p < 0.05; Fig. 5C). Correlation analysis between the two key genes and immune cell infiltration demonstrated that both MRPL39 and MRPL35 negatively correlated with neutrophils, M0 macrophages, and plasma cells, while showing positive correlations with resting NK cells (Fig. 5D). These findings suggest regulatory interactions between the key genes and specific immune cell populations, potentially influencing immune homeostasis and the microenvironment in IBD.
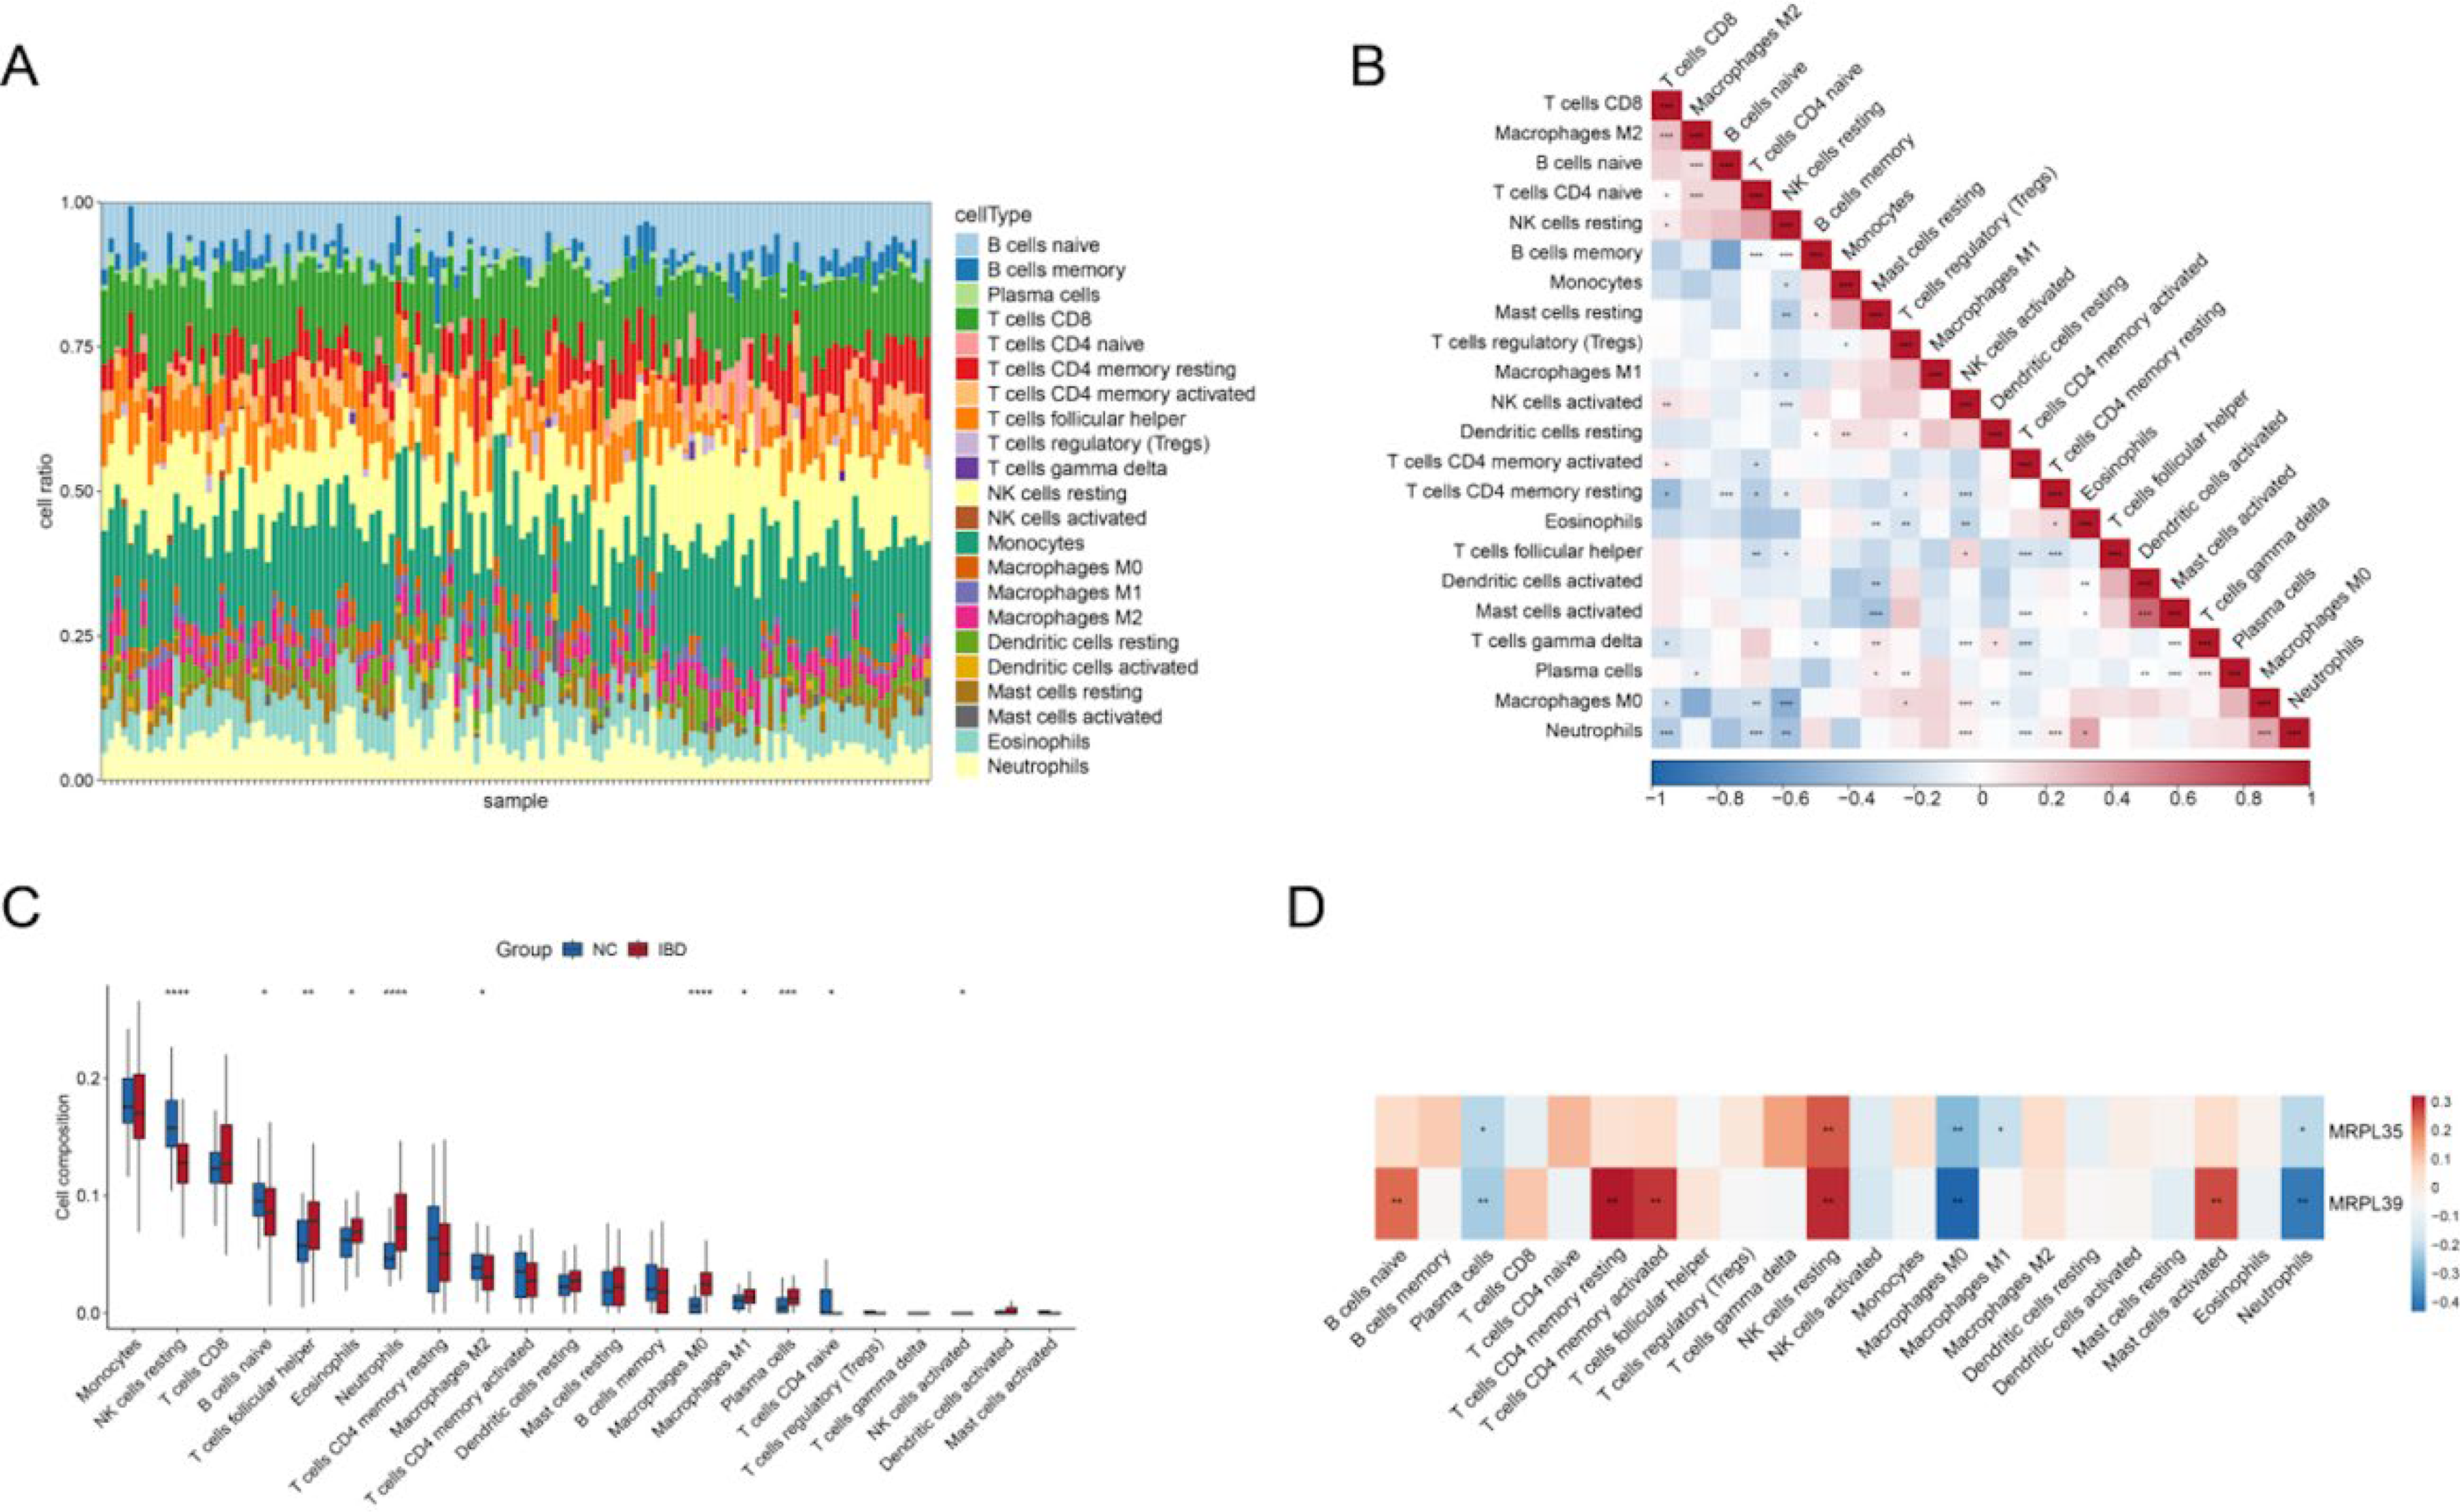
Immune microenvironment analysis: Abundance distribution of different immune cell subgroups in IBD (IBD) and normal (NC) samples.
Regulatory networks of key genes
To investigate regulatory mechanisms of key genes in IBD pathogenesis, we analyzed ceRNA networks and TF regulation.
The ceRNA network comprised 2 key messenger RNAs (mRNAs), 17 miRNAs, and 35 lncRNAs, forming 238 interactions. Topological analysis identified XIST as the lncRNA with the highest degree value, while hsa-miR-103a-3p, hsa-miR-29b-3p, and hsa-miR-29a-3p represented the top-ranked miRNAs. MRPL35 exhibited the highest degree value among mRNAs, with mutual regulatory interactions observed among these molecules (Supplementary Fig. S2A), suggesting their involvement in IBD-related ceRNA mechanisms. TF enrichment analysis identified 18 potential binding sites in the promoter regions of the 2 key genes, including ELK4, NFIC, IRF2, YY1, RUNX2, SP1, and HINFP. Notably, TP53 was identified as a shared TF for both MRPL35 and MRPL39 (Supplementary Fig. S2B).
Expression validation of MRPL35 and MRPL39
The Wilcoxon rank-sum test was used to analyze differential expression of key genes in training and validation sets, with results showing consistent expression trends for both key genes across sets. Specifically, compared with normal control groups, the expression level of key gene MRPL35 and MRPL39 was significantly downregulated in IBD samples (p < 0.05). ROC curve analysis results showed that in both training and validation sets, MRPL35 and MRPL39 had AUC values around 0.7 for distinguishing disease samples from normal control samples, demonstrating good diagnostic potential of key genes for IBD (Fig. 6A,B).
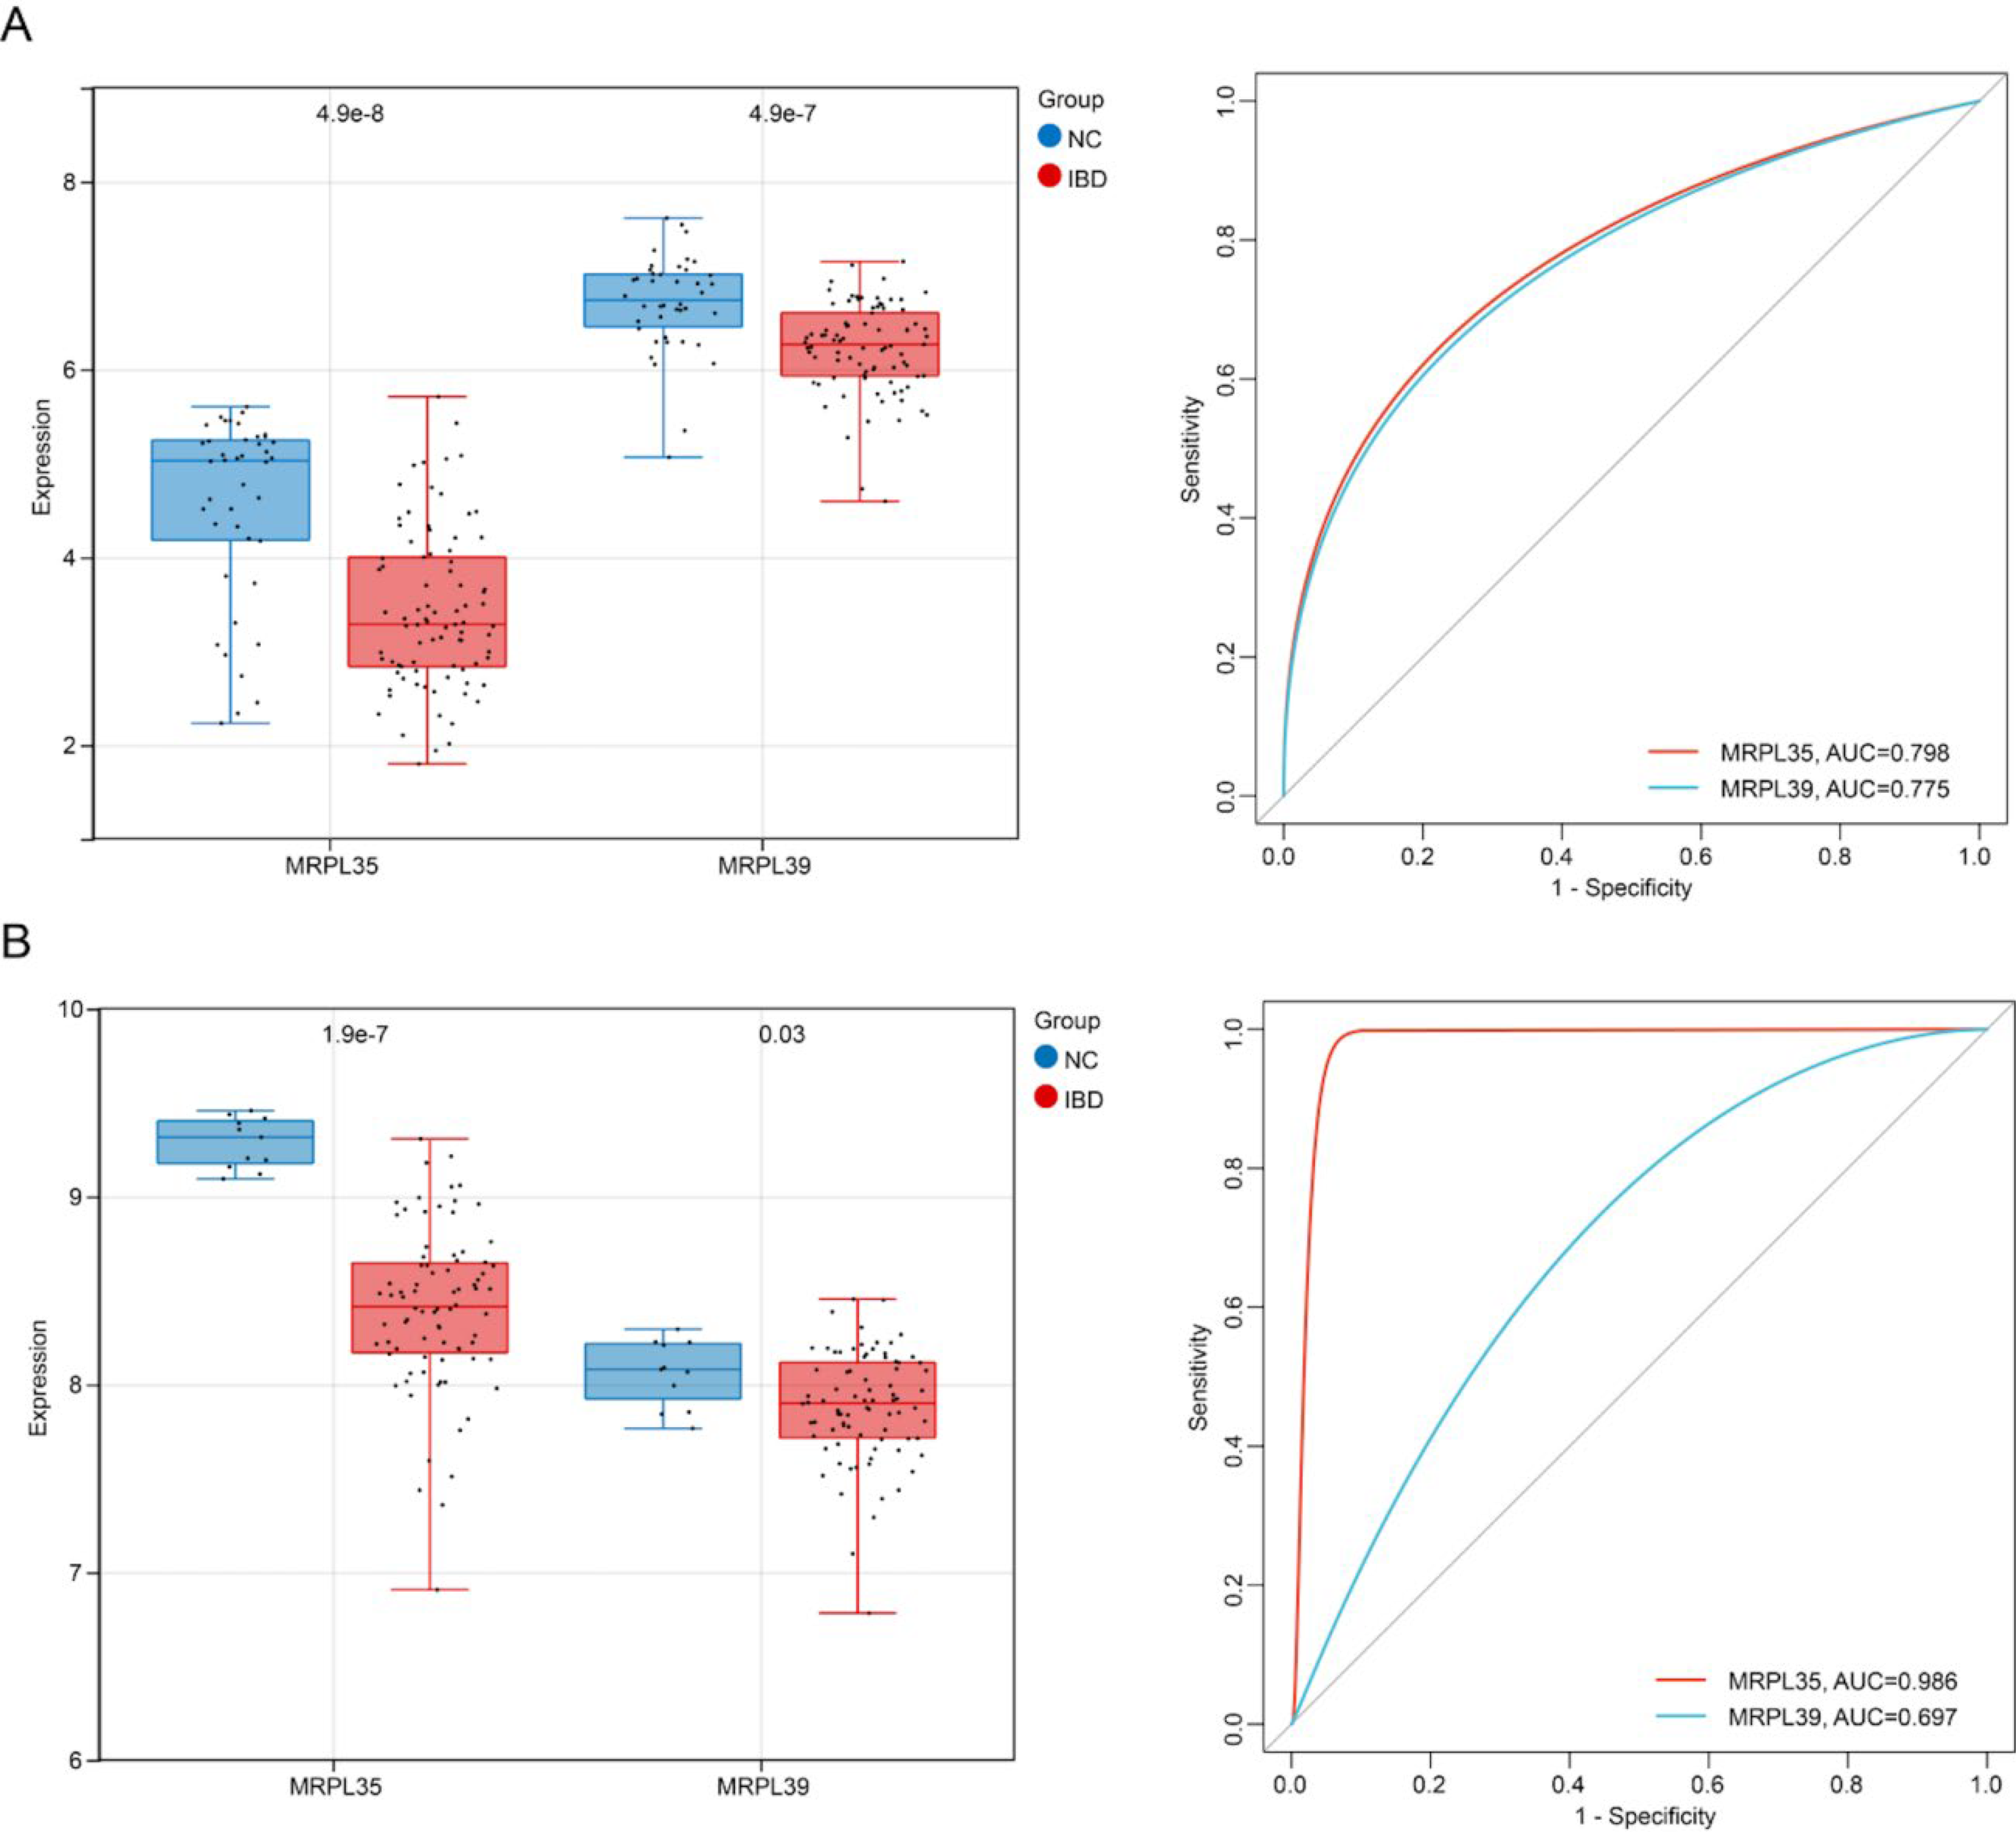
Validation of key gene expression, ROC curves, and survival analysis: Expression distribution and ROC curves of MRPL35 and MRPL39 genes in IBD samples versus normal samples in the training set.
Drug prediction and molecular docking
By combining the prediction results from the CMap and DSigDB databases, nine candidate small molecules targeting key genes were identified, including cimetidine, eugenol, chlortetracycline, vincristine, irinotecan, bisacodyl, and sulpiride. As shown in Supplementary Table S2, the binding energies between key compounds and target proteins are relatively low, indicating good binding affinities between them (Supplementary Table S3).
Docking conformation analysis visualized binding patterns of key ligand–receptor pairs. Chlortetracycline stably docked within the MRPL35 protein pocket formed by Phe147, Tyr177, Leu115, Arg125, Lys130, and Arg285 (Supplementary Fig. S3). The binding was stabilized through hydrophobic interactions and hydrogen bonds with surrounding residues, explaining the high-affinity binding mechanism. Similarly, irinotecan bound to the MRPL39 protein cavity comprising Met93, Cys100, Glu97, Arg101, Ser273, Arg307, Tyr211, and Ile210 (Supplementary Fig. S4). Hydrophobic interactions and hydrogen bonding with pocket residues stabilized this complex. These findings support chlortetracycline and irinotecan as potential NFE2L2 ligands, offering insights into molecular mechanisms for IBD treatment.
Experimental verification by RT-qPCR
RT-qPCR analysis revealed significant differential mRNA expression between the NC and IBD groups. MRPL35 and MRPL39 mRNA levels were significantly downregulated in IBD samples compared with NC (p < 0.0001; Fig. 7A,B). It is confirmed that key genes exhibit concordant changes at both transcriptional levels in IBD pathogenesis.
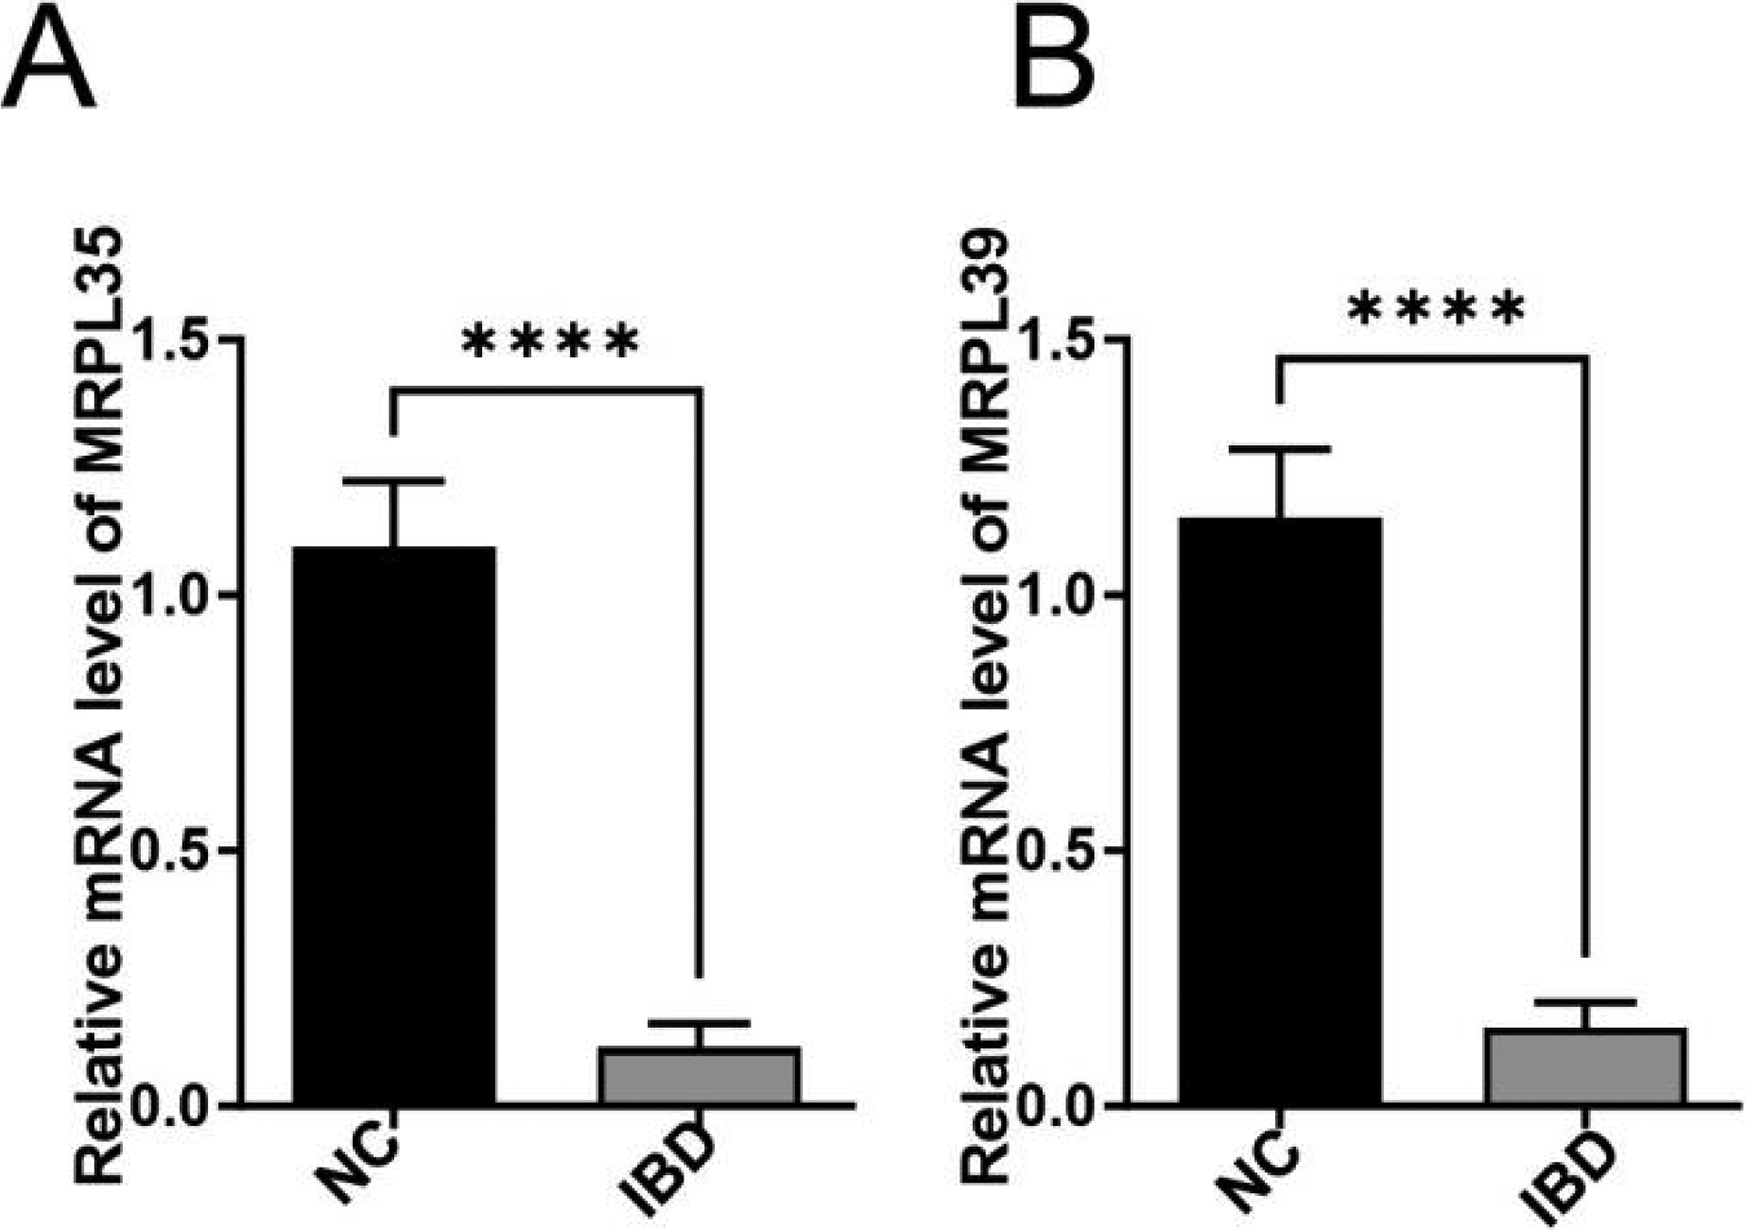
Expression levels of key genes in normal and IBD groups:
Discussion
IBD is a chronic recurrent inflammatory disease that mainly includes CD and UC, with persistently high morbidity and mortality rates (Straatmijer and Duijvestein, 2023). In recent years, research has found that mitochondrial metabolism is closely related to IBD (Özsoy et al., 2022). Additionally, MNPs play an important role in immune regulation of IBD, and their dysfunction may lead to impaired intestinal immune tolerance, thereby triggering disease (Lu et al., 2024). Therefore, exploring the key genes related to MNP cells and mitochondrial metabolism and their roles in IBD is of great significance for finding new diagnostic and therapeutic targets. This study found that MNP cells may play a key role in IBD progression. Through machine learning methods, two key genes, MRPL35 and MRPL39, were identified, both of which are protective factors for IBD and are significantly downregulated in IBD tissues. Furthermore, the expression of key genes is significantly correlated with multiple immune cell infiltrations. This study also constructed ceRNA and TF regulatory networks centered on key genes and predicted multiple candidate drugs targeting key genes. In summary, these findings provide new insights for early diagnosis and targeted therapy of IBD.
Single-cell analysis results showed that the IBD cellular microenvironment mainly includes immune cell types such as T cells, B cells, plasma cells, MNPs, stromal cells, and mast cells. Research has shown that these cells play key roles in immune regulation of IBD (Drygiannakis et al., 2024; Laukova and Glatman Zaretsky, 2023; Zuo et al., 2024). For example, MNP cells drive inflammatory processes by secreting pro-inflammatory cytokines (such as interleukin [IL]-1β, and tumor necrosis factor-α) and activate adaptive immune responses as antigen-presenting cells (Mildner et al., 2024). Under healthy conditions, MNP cells maintain intestinal immune tolerance by inducing regulatory T cells, while, in IBD conditions, this mechanism is impaired, leading to abnormal immune activation against intestinal microbiota (Laukova and Glatman Zaretsky, 2023). Additionally, MNP cells also participate in maintaining intestinal epithelial barrier function, and their dysfunction may increase intestinal permeability and worsen disease (Meng et al., 2024; Quin et al., 2024). T cell dysregulation drives intestinal inflammation, and research has shown that effector T cells are increased in IBD patients (Chandwaskar et al., 2024). Stromal cells in the intestine regulate intestinal epithelial and immune cell homeostasis, and stromal cells also play an important role in IBD pathogenesis (Barnhoorn et al., 2020). Mast cells can be activated by antigen-mediated immunoglobulin receptor cross-linking, free light chains of immunoglobulins, stress, and ATP and subsequently play a promoting role in the occurrence and development of IBD through the release of specific mediators (such as serine proteases; Boeckxstaens, 2015).
GO and KEGG analysis results showed that IBD-related candidate genes are enriched in pathways such as lipid metabolism dysregulation, peroxisome dysfunction, mitochondrial dysfunction, and oxidative stress. Research has shown that peroxisomes affect inflammatory responses and apoptosis processes by regulating ROS signaling and lipid metabolism (Jiang and Okazaki, 2022). Abnormal fatty acid metabolism not only directly affects intestinal mucosal barrier function but also participates in disease progression by regulating the production of inflammatory mediators (Fu et al., 2023). These findings provide new potential targets for IBD treatment, especially therapeutic strategies targeting peroxisome function, fatty acid metabolism, and peroxisome proliferator-activated receptor regulation, which may have good application prospects.
MRPL35 and MRPL39, as mitochondrial ribosomal proteins, play key roles in IBD. MRPL35 affects ROS production, DNA damage, and apoptosis by regulating mitochondrial function, while MRPL39 participates in mitochondrial oxidative phosphorylation system protein synthesis and regulates miRNA expression. The specific expression patterns of these two proteins at transcriptomic and single-cell levels can serve as potential biomarkers for IBD diagnosis. ROC analysis showed that these two genes have good diagnostic ability for IBD. The roles of MRPL35 and MRPL39 in IBD may be achieved through the following pathways: First, dysfunction of these two proteins leads to synthesis defects in mitochondrial respiratory chain complexes I, III, IV, and V, thereby causing insufficient ATP production and excessive ROS generation (Jackson et al., 2020). Excessive ROS not only directly damages intestinal epithelial cells but also activates pro-inflammatory signaling pathways such as nuclear factor kappa B and mitogen-activated protein kinase, amplifying inflammatory responses (Biasi et al., 2013). Second, mitochondrial dysfunction triggers intracellular endoplasmic reticulum stress responses, activating the unfolded protein response, further exacerbating apoptosis and intestinal barrier destruction (Cao, 2015). In addition, two key genes were found to be significantly downregulated in IBD by RT-qPCR, and the results of bioinformatics analysis were further confirmed in clinical blood samples. In summary, this study is the first to identify these two key genes in IBD, and their specific functional roles still need further investigation.
Immune cell infiltration analysis showed that T follicular helper cells (Tfh), eosinophils, neutrophils, M0 macrophages, M1 macrophages, and plasma cells were significantly upregulated in IBD tissues, while resting NK cells, naive B cells, M2 macrophages, and naive CD4 T cells were significantly downregulated. Research has found that the significant downregulation of Tfh and neutrophils is closely related to the immunopathological mechanisms of IBD. Tfh cells play a complex role in IBD, on the one hand, driving antibody production by promoting B cell differentiation into plasma cells and, on the other hand, regulating inflammatory responses by secreting IL-21 (Imam et al., 2018). The reduction of Tfh in this study may directly lead to adaptive immune dysregulation, manifested as weakened antibody-mediated mucosal defense, while IL-21-dependent inflammatory regulatory pathways are blocked. This finding is consistent with previous studies, suggesting that Tfh-targeted intervention may be a potential strategy for IBD treatment. Neutrophils, as core effector cells of innate immunity, exhibit reduced activity that is significantly associated with intestinal barrier integrity destruction and decreased bacterial clearance capacity in IBD patients (Sun et al., 2021). The observed reduction in neutrophil numbers in this study may exacerbate intestinal microbial translocation, thereby maintaining chronic inflammatory states. Neutrophil dysfunction is a key factor in IBD transition from acute inflammation to chronicity. These alterations in immune cell composition reflect complex immune dysregulation in IBD. Multiple immune cell populations contribute to disease progression through diverse mechanisms, including cytokine secretion, antigen presentation, immune tolerance induction, tissue repair, and intestinal microbiota regulation. Furthermore, the expression of key genes MRPL35 and MRPL39 is significantly correlated with multiple immune cell infiltrations, suggesting they may affect IBD occurrence and development by regulating immune cell infiltration.
In conclusion, this study revealed the important roles of MNP cells and mitochondrial metabolic pathways in the occurrence and development of IBD at the single-cell level, identified two key genes MRPL35 and MRPL39, preliminarily elucidated their molecular mechanisms in regulating IBD, and predicted potential targeted drugs. These findings enrich our understanding of IBD pathogenesis and provide important clues for subsequent precision medicine research including molecular classification, immunotherapy, and drug development. However, this study still has some limitations. Although the expression of key genes was verified at the transcription level, the study results are constrained by sample size limitations with limited validation experimental groups, and subsequent in vivo and in vitro experiments are needed to deeply explore the mechanisms of action of key genes, pathways, and drugs. Additionally, single-cell sequencing analysis only reflects cellular heterogeneity at a specific time point and cannot comprehensively reflect the dynamic changes of disease progression. Future research could combine new technologies such as spatial transcriptomics and single-cell multiomics sequencing to conduct more in-depth studies.
Ethical Considerations
This study was conducted in accordance with the Declaration of Helsinki and approved by the Institutional Review Board of Chengdu Seventh People’s Hospital (Affiliated Cancer Hospital of Chengdu Medical College). The approval number is 2025KY0372. All participants provided written informed consent and were fully informed of the purposes, procedures, potential risks, and benefits of the study. The study strictly followed the ethical principles of the Declaration of Helsinki and local regulatory requirements.
Consent to Participate
Written informed consent was obtained from all participants prior to their inclusion in this study.
Consent for Publication
All participants provided written informed consent for the publication of anonymized data in this study.
Data Availability
All data used in this study are publicly available. The IBD-related transcriptomic datasets GSE3365 and GSE75214 were downloaded from the GEO database (https://www.ncbi.nlm.nih.gov/geoprofiles/). The IBD-related single-cell sequencing dataset GSE134809 was downloaded from the GEO database (https://www.ncbi.nlm.nih.gov/geo/query/acc.cgi?acc=GSE134809). The 1136 genes related to mitochondrial metabolism were obtained from the MitoCarta database (https://www.broadinstitute.org/mitocarta/).
Authors’ Contributions
H.L. conceived, designed, and supervised the study; performed the key bioinformatics analyses; interpreted the main findings; and drafted the article. Q.W. collected and processed the data and contributed to drafting the article. H.L. and Q.W. assisted with bioinformatics analyses and results interpretation. J.W. validated the findings. H.L. and J.W. performed the molecular docking experiments. H.L., Q.W., and J.W. provided critical feedback and helped shape the research. H.L. and Q.W. revised the article. All authors discussed the results and approved the final article.
Footnotes
Acknowledgments
The authors would like to thank the GEO database for providing the publicly available datasets used in this study. They also acknowledge the developers of the bioinformatics tools and databases applied in this research, including MitoCarta, DAVID, STRING, Enrichr, miRNet, TRRUST, and CIBERSORTx. Their valuable resources greatly facilitated the data analysis and interpretation in this work. The authors are also grateful to all participants who contributed samples for the RT-qPCR validation.
Author Disclosure Statement
The authors have no conflicts of interest to declare.
Funding Statement
No funding was received for this article.
Supplemental Material
Abbreviations
References
Supplementary Material
Please find the following supplemental material available below.
For Open Access articles published under a Creative Commons License, all supplemental material carries the same license as the article it is associated with.
For non-Open Access articles published, all supplemental material carries a non-exclusive license, and permission requests for re-use of supplemental material or any part of supplemental material shall be sent directly to the copyright owner as specified in the copyright notice associated with the article.