
Abstract
Background:
The clinical significance of metabolic syndrome (MetS) stems from its strong association with the incidence and mortality of cardiovascular disease (CVD) and type 2 diabetes (T2D), which are the top causes of death worldwide. The triglyceride-glucose (TyG) index, a surrogate marker of insulin resistance, has been proposed as a simple diagnostic tool; however, its predictive value for MetS has not been evaluated in southeastern Mexico. This study aimed to assess the diagnostic performance of the TyG index for MetS in adults from Yucatán.
Methods:
A cross-sectional study was conducted on 250 adults (77 men, 173 women) attending the Regional High Specialty Hospital of the Yucatan Peninsula, IMSS-Bienestar. Anthropometric and biochemical data were collected under standardized procedures. The TyG index was calculated as ln ([fasting triglycerides × fasting glucose]/2). Logistic regression and ROC curve analyses were performed to evaluate the discriminatory capacity of the TyG index, adjusted for sex and age.
Results:
Higher TyG index quartiles were associated with increased age, waist circumference, blood pressure, and prevalence of MetS (P < 0.05). The TyG index showed a positive trend with the number of MetS components (P < 0.001). The area under the curve for TyG was 0.79 (95% confidence interval: 0.73–0.85, p < 0.001), improving to 0.83 after adjustment for sex and age, with 72% sensitivity and 80% specificity.
Conclusion:
The TyG index demonstrated strong predictive and discriminative ability for MetS and, as a simple, cost-effective measure derived from routine laboratory tests, represents a practical screening tool for clinicians in southeastern Mexico.
Introduction
Metabolic syndrome (MetS) is defined as a cluster of metabolic abnormalities that include dysregulation of lipids, characterized by high concentrations of triglycerides and low high-density lipoprotein (HDL) concentrations, high levels of glucose, elevated blood pressure (BP), abdominal obesity, and insulin resistance (IR). 1 These alterations contribute to the activation of proinflammatory and oxidative stress pathways. 2 The clinical significance of MetS stems from its strong association with the incidence and mortality of cardiovascular disease (CVD) and type 2 diabetes (T2D), which are the top causes of death worldwide.3–5
In Mexico, the prevalence of MetS has been reported to be higher than in other Latin American countries, with estimates ranging from 31% to 54% depending on the diagnostic criteria applied. Furthermore, the individual components of MetS are also highly prevalent among the Mexican population. 6 Altogether, these conditions represent a significant challenge to our healthcare system, not only because of their economic burden but also due to their impact on quality of life and associated mortality, leading to a major public health concern.4,7,8 Therefore, implementing preventive strategies that use accessible tools to guarantee an early detection of MetS is crucial in Mexico.
Over the last decade, several new indices have been proposed for the diagnosis of MetS, although their utility has varied considerably according to factors such as sex, age, and ethnicity.9,10 Traditional measures such as body mass index (BMI) may also be limited in their ability to accurately stratify MetS risk. 11 In 2008, Simental-Mendía et al. introduced the triglyceride-glucose (TyG) index, developed in the Mexican population as a surrogate marker for IR. 12 Since then, growing evidence has supported its association and clinical utility across multiple conditions, including CVD, kidney injury, fatty liver disease, and MetS.13–15
Our research group previously identified that the cardiometabolic index (CMI) and lipid accumulation product (LAP) are effective indicators for diagnosing MetS among adults in Yucatán (Mexico). 16 However, the TyG index has not been evaluated in the Mexican population, particularly in the southeastern region of Mexico. To date, the few studies that have specifically evaluated the predictive value of the TyG index for MetS have been conducted mainly in the northern and central regions of the country, leaving a gap in knowledge about populations in southeastern Mexico.17–19 Importantly, Mexico is characterized by substantial ethnic diversity, with populations that vary in genetic background, lifestyle, and dietary habits.20–23 Within this context, the population of Yucatan is largely of Mayan ancestry, and a significant proportion identifies as indigenous.24,25 Furthermore, the prevalence of MetS, T2D, and obesity in Yucatán has been reported to be higher than that documented in other national studies.26–28 This gap highlights the need for regional research on the predictive value of the TyG index in the Yucatecan population with MetS. Accordingly, the aim of this study was to evaluate the predictive value of the TyG index in adults with MetS in Yucatán, México.
Methods
This cross-sectional study was conducted at the Regional High Specialty Hospital of the Yucatan Peninsula, IMSS-Bienestar (HRAEPY, by its Spanish acronym) in Merida, Yucatan.
From a total of 13959 people who attended the hospital’s outpatient units, 6888 potential participants were identified after applying the selection criteria. The exclusion criteria discriminated against patients who were pregnant women and individuals receiving medical treatment in the cardiology, neurology, endocrinology, or oncology units, as these patients were undergoing active treatment for chronic or acute conditions that could alter glucose or lipid metabolism. OpenEpi software was used to calculate the sample size of the study groups, considering a 95% confidence interval (CI), 80% power, the proportion of the group without MetS with an exposure of 22%, the proportion of the group with MetS with an exposure of 39.7%, and considering an odds ratio (OR) of 2.14. 29 The estimated sample size was 234 participants, 117 with MetS and 117 without MetS. Ultimately, a total of 250 individuals (77 men and 173 women) over the age of 20 were included. The Ethics Committee of HRAEPY approved the study (registration no. CONBIOETICA-31-CEI-002-20170731) as part of a research project (ID code: 2017-025), in accordance with the ethical principles of the Declaration of Helsinki. All participants provided written informed consent prior to enrollment.
Anthropometric measurements and BP
Body weight (kg) was measured with participants wearing light clothing, barefoot, and without socks, using a digital scale (Seca, Germany), with an accuracy of 0.05 kg. Height (cm) was determined with a stadiometer (Seca, Germany) to the nearest 0.1 cm; participants were asked to remove their shoes and stand upright in the Frankfurt plane until the measuring arm rested on their head to record the measurement. Waist circumference (WC [cm]) was measured at the midpoint between the lower costal margin and the upper edge of the iliac crest, using a standard measuring tape (Lufkin), with a precision of 0.1 cm. BMI was calculated as weight divided by the square of height (kg/m2). 30 Systolic (SBP) and diastolic blood pressure (DBP) were measured with an automated electronic sphygmomanometer (Omron, Japan). Blood pressure was recorded after a 15-min seated rest, with the right arm uncovered and feet uncrossed. 31
Biochemical parameters, diagnostic criteria, and TyG index calculations
After a 12-hour overnight fast, blood samples were obtained by trained personnel following standardized procedures. Fasting plasma glucose (FPG) (mg/dL), insulin (µU/mL), triglycerides (TG) (mg/dL), and HDL cholesterol (HDL-C) (mg/dL) were measured according to standard laboratory protocols using COBAS® Integra 400 Plus autoanalyzer (Roche Diagnostics).
Obesity was defined according to the World Health Organization (WHO) BMI criteria: normal weight (18.5–24.9 kg/m2), overweight (25.0–29.9 kg/m2), and obesity (≥30.0 kg/m2). 32 MetS was diagnosed using the National Cholesterol Education Program Adult Treatment Panel III (NCEP ATP III) criteria, which require the presence of at least three of the following five components: abdominal obesity (WC > 102 cm in men, > 88 cm in women), elevated FPG (≥100 mg/dL), high TG (≥150 mg/dL), reduced HDL-C (<40 mg/dL in men, < 50 mg/dL in women), and elevated blood pressure (SBP ≥ 130 mmHg, DBP ≥ 85 mmHg, or current use of antihypertensive medication).33,34
The TyG index was calculated using the standard formula described by Simental-Mendía L et al. (2008)
12
:

Statistical analyses
Descriptive statistics were applied, with continuous variables expressed as median (25th–75th percentile) and categorical variables as frequency (%). Comparisons of demographic and biochemical parameters among quartile groups were performed using the Kruskal–Wallis test, followed by Dunn’s post hoc test for multiple comparisons. A quartile-based distribution of the TyG index was applied, dividing participants into four equal groups to facilitate comparisons of clinical characteristics and MetS components across increasing TyG levels. The area under the ROC curve (AUC) was estimated using a binary logistic regression analysis to determine the discriminatory capacity of the TyG index for identifying MetS in adults (yes = 1, no = 0). Sensitivity and specificity were calculated for both the TyG index and the TyG index adjusted for sex and age to evaluate MetS. All analyses were conducted using the Jamovi statistical software (version 1.8.1). A p-value of less than 0.05 was considered statistically significant.
Results
Participants were stratified according to the TyG index. A total of 63 participants with a TyG index ≤ 8.5 were allocated into quartile 1 (Q1), 61 participants with an index between 8.5 < TyG ≤ 8.9 were found in quartile 2 (Q2), 63 participants with 8.9 < TyG ≤ 9.43 in quartile 3 (Q3), and 63 participants with TyG ≥ 9.44 were in quartile 4 (Q4). Increasing levels of the TyG index were associated with age (43.3 ± 13.1 vs. 48.9 ± 9.94, P = 0.023) and having a higher prevalence of MetS (4.8% vs. 15.2%, P = 0.0001 vs. 20.4%, p < 0.001). Components of MetS were also evaluated and compared among TyG index quartiles. Significant differences were observed in BMI between Q1 and Q3 (28.3 kg/m2 vs. 30.3 kg/m2, P = 0.036). WC was significantly higher in Q3 and Q4 compared to Q1 (94 cm vs. 89 cm, P = 0.009 and 94 cm vs. 89 cm, P = 0.014). SBP levels were significantly higher in Q4 and Q3 compared with Q1 (125 mmHg vs. 112 mmHg, P = 0.008 and 123 mmHg vs. 112 mmHg, p = 0.019). Additionally, significantly lower HDL concentrations (p < 0.05) were observed in Q4 compared with the other quartiles. Due to the strong correlation with the TyG index, the P-values of FPG (r = 0.59) and TG (r = 0.75) concentrations were excluded from the analysis (Table 1).
Comparison of Clinical Characteristics of the Study Participants by Quartile Groups of TyG Index (n = 250)
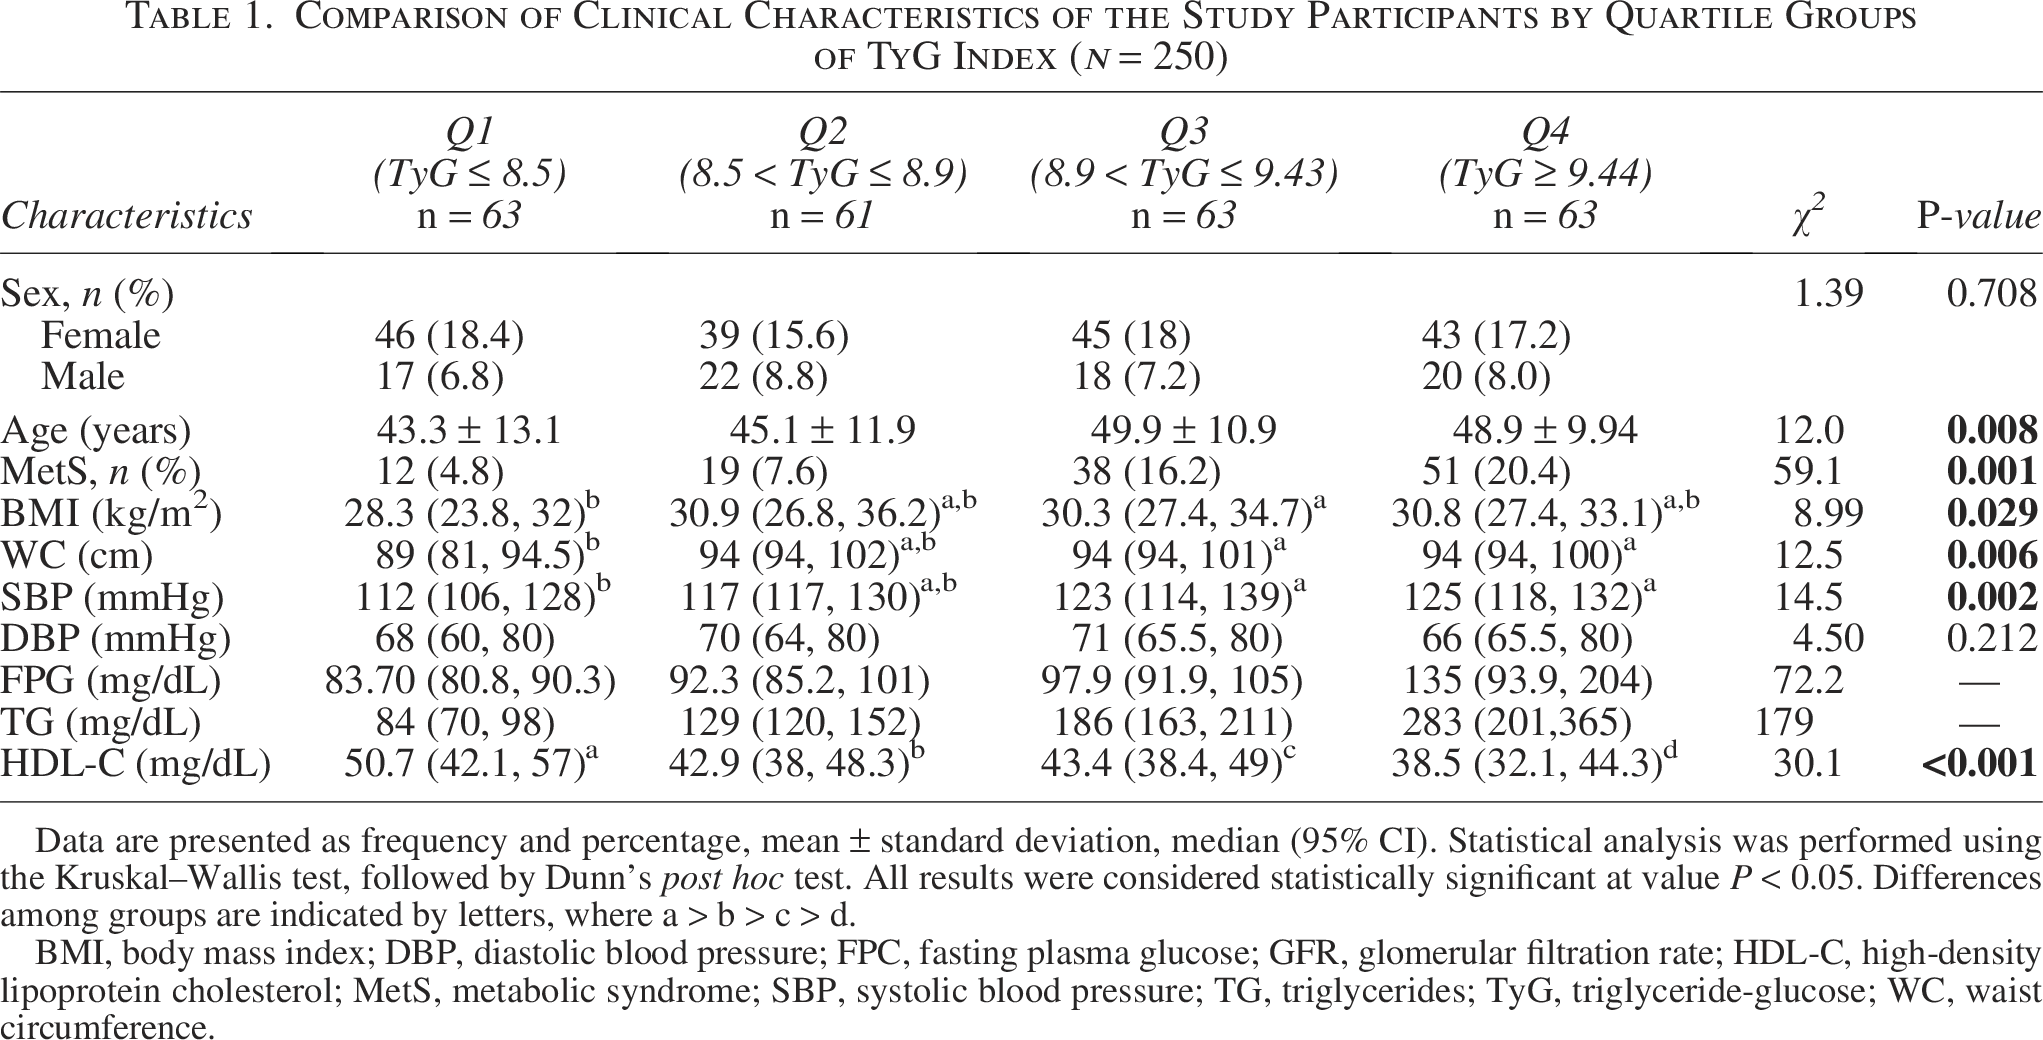
Data are presented as frequency and percentage, mean ± standard deviation, median (95% CI). Statistical analysis was performed using the Kruskal–Wallis test, followed by Dunn’s post hoc test. All results were considered statistically significant at value P < 0.05. Differences among groups are indicated by letters, where a > b > c > d.
BMI, body mass index; DBP, diastolic blood pressure; FPC, fasting plasma glucose; GFR, glomerular filtration rate; HDL-C, high-density lipoprotein cholesterol; MetS, metabolic syndrome; SBP, systolic blood pressure; TG, triglycerides; TyG, triglyceride-glucose; WC, waist circumference.
The mean TyG index showed a significant positive trend with the increasing number of MetS components in the overall study population (P < 0.001) (Fig. 1).
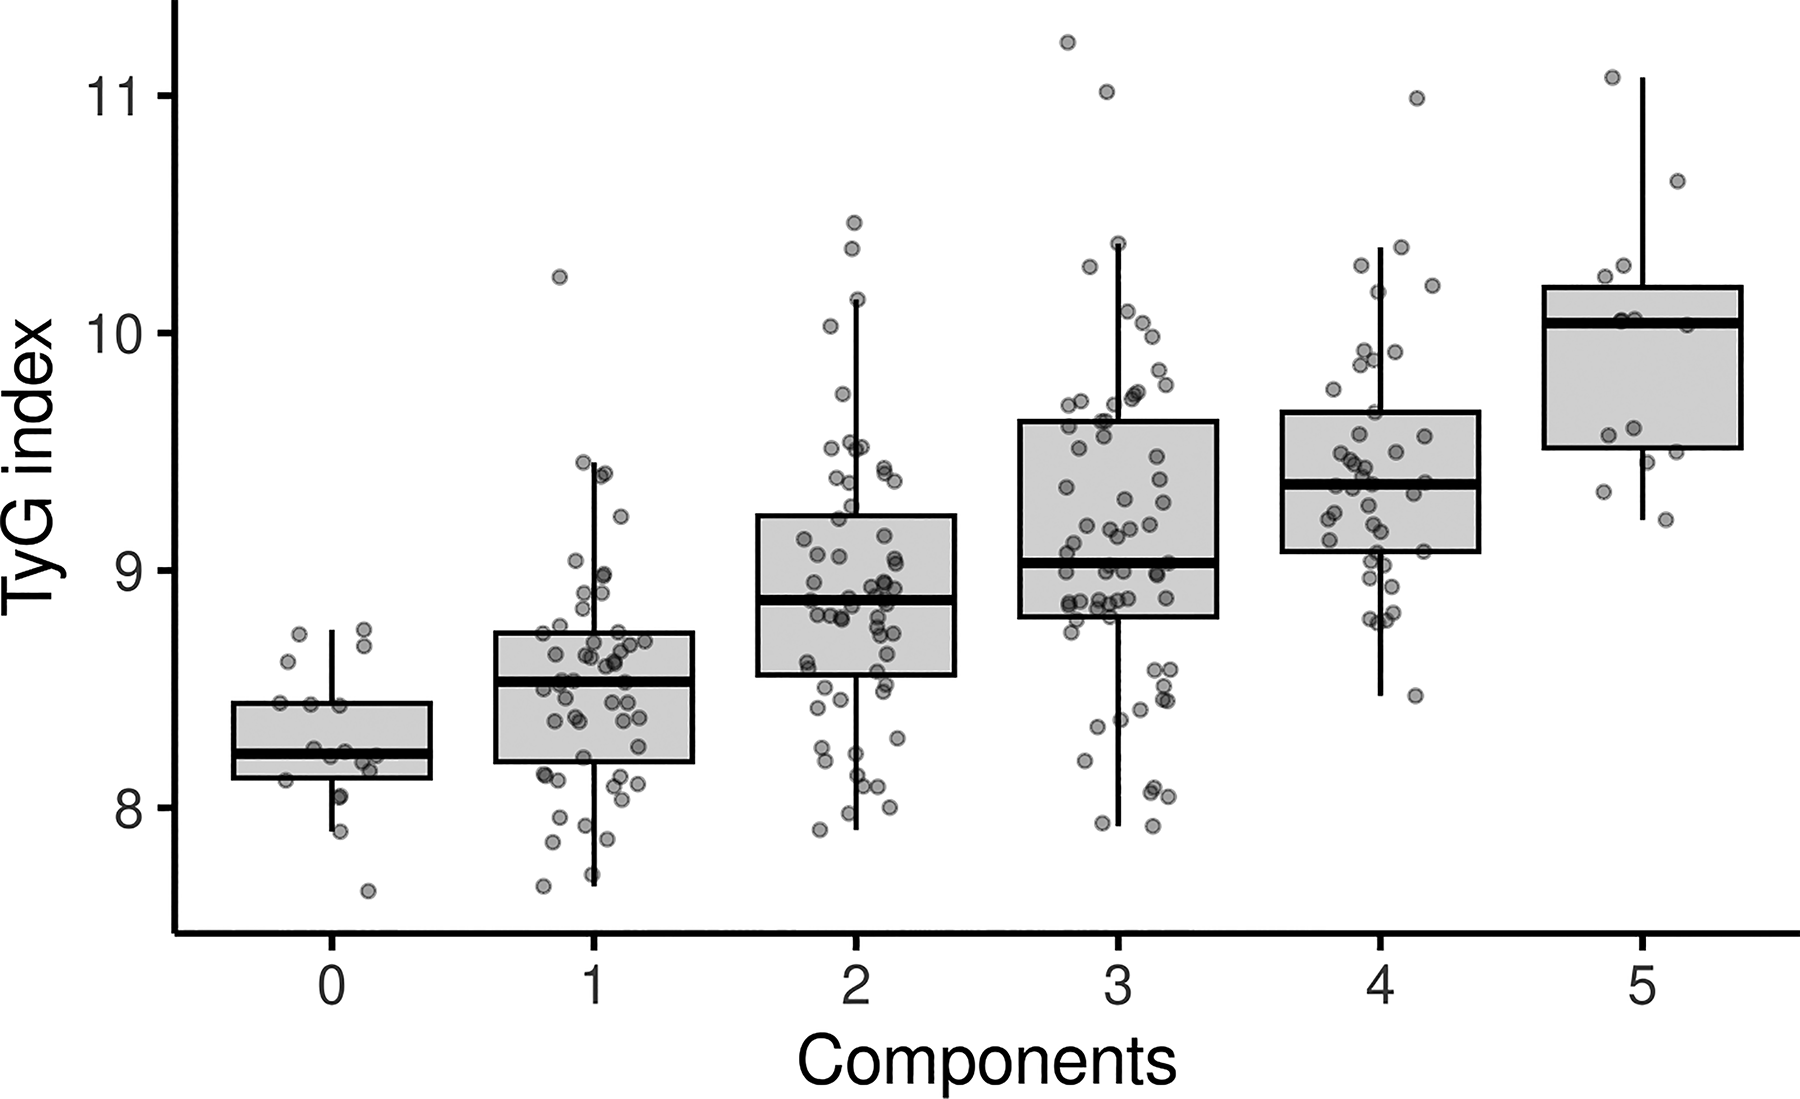
The mean value of the TyG index increased with the number of MetS components (p < 0.001) in the total study population (n = 250). MetS, metabolic syndrome; TyG, triglyceride-glucose.
The AUCs were calculated using binomial logistic regression, with MetS (yes = 1, no = 0) as the response variable and the TyG index as the predictor, adjusted for sex and age. The AUC for the TyG index among the study population showed an AUC of 0.79, with 78% specificity, 66% sensitivity, and an OR of 6.19 (95% CI: 3.53–10.88, P < 0.001). After adjusting for sex, the AUC increased to 0.81, with 77% specificity, 72% sensitivity, and an OR of 3.33 (95% CI: 1.68–6.60, P < 0.001). Adjustment for age produced an AUC of 0.81, with 79% specificity, 74% sensitivity, and an OR of 1.06 (95% CI: 1.03–1.09, P < 0.001) (Table 2). The highest AUC (0.83) was obtained when the TyG index was adjusted for both sex and age, with 80% specificity and 72% sensitivity (P < 0.001) (Fig. 2).
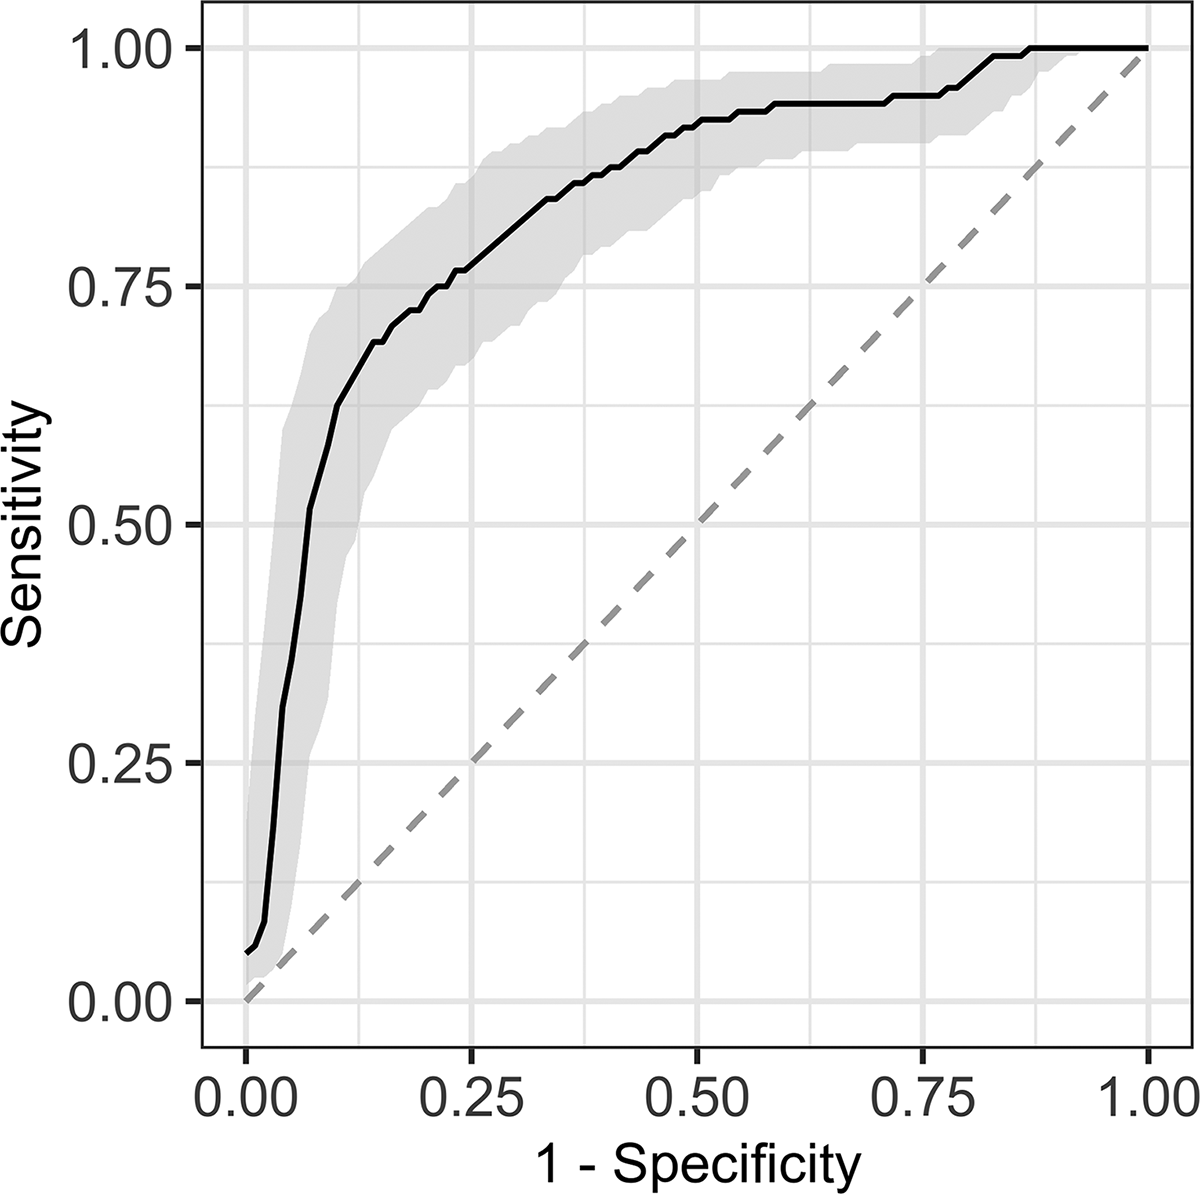
Area under the receiver operating characteristic curve of the TyG index to predict MetS in the total study population (n = 250).
Logistic Regression Model for Metabolic Syndrome Predictors in the Study Population (n = 250)
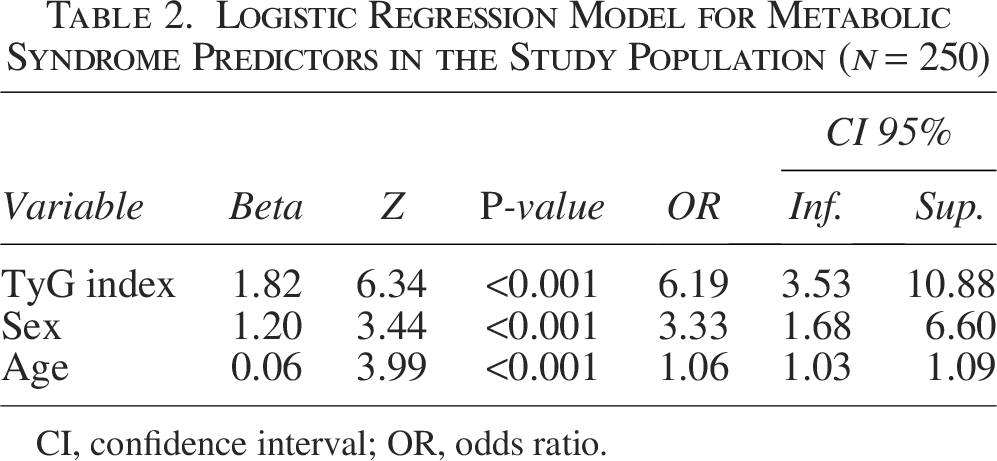
CI, confidence interval; OR, odds ratio.
Discussion
We observed that the TyG index was a good predictor of MetS in our study population, with its predictive accuracy further improved after adjustment for sex and age. Moreover, higher TyG index levels were associated with an increased prevalence of MetS components.
TyG index levels in participants with MetS were significantly higher than in those without MetS (9.34 ± 0.65 vs. 8.65 ± 0.55, P < 0.001). These values are notably higher than the reported cut-off of TyG ≥ 4.8 used in previous studies assessing its diagnostic significance for MetS.17,18 Similarly, we observed that our interquartile ranges are higher than those reported by studies such as that by Raimi et al., where they reported a TyG index of 8.4 in 473 adults in Nigeria, with no significant differences between women and men with MetS (P = 0.342). 29 Another study in the Chinese population stratified the TyG index into tertiles, which ranged from 8.30 to 8.83, lower than our quartiles (Q3: 8.9–9.43 and Q4 ≥ 9.44). 35 Similarly, a study in Argentina reported an average TyG index of 9.1 ± 0.6 among subjects with MetS. 36 These findings are consistently higher compared to other populations, which could be explained by the fact that hypertriglyceridemia (75%) and hyperglycemia (53.3%) were found in high prevalence in the population with MetS and the general population evaluated. Therefore, it is important to regionalize the TyG index among the Mexican population in order to establish specific reference values for each context that better reflect the metabolic characteristics of the population and improve its predictive accuracy for the MetS.
The prevalence of MetS increased among TyG quartiles, ranging from 4.8% in Q1 to 20.4% in Q4, suggesting that the TyG index might be useful as a marker of MetS or MetS risk. Several components of MetS, including SBP, FPG, TG, and HDL, demonstrated a similar pattern, with progressively higher levels across quartiles. In contrast, BMI and WC increased from Q2 but remained stable in the subsequent quartiles. These findings support a potential association between TyG, general adiposity, and IR. This is congruent with the pathophysiology of MetS, where visceral adiposity and lipid accumulation promote IR, chronic low-grade inflammation, and endothelial dysfunction.37,38 Furthermore, elevated TyG levels, indicating the combined effect of hypertriglyceridemia and high glucose concentrations, have been proposed as an accessible surrogate marker of IR and cardiometabolic risk.39,40 Although TG and FPG were not statistically analyzed due to high correlation with the TyG index. The available literature on the performance of MetS components across TyG quartiles remains limited. Most studies to date have examined the association of the TyG index with the overall presence of MetS rather than its individual components. To the best of our knowledge, this is the first study to comprehensively evaluate the TyG index stratified by quartiles in relation to each component of MetS, providing novel insights into its pathophysiological and clinical relevance.
Our findings demonstrated that TyG index levels increased not only among individuals diagnosed with MetS but also in parallel with the number of MetS components present. Altogether, this supports the utility of the TyG index not only as a discriminative marker for identifying MetS but also as a potential indicator of its severity. Such evidence highlights the clinical relevance of TyG in risk stratification, since a higher burden of MetS components is strongly associated with greater cardiometabolic risk. These results are consistent with previous reports describing TyG as a surrogate marker of IR and metabolic dysfunction, further reinforcing its value in both research and clinical practice.39,40
The AUC of 0.79 indicates good discriminative power for MetS. The increase in AUC after adjusting for sex and age (up to 0.83) suggests that these factors are relevant and that the adjusted TyG could provide a more accurate prediction. Sensitivities (66%–74%) and specificities (77%–80%) indicate that TyG is a balanced tool for population screening. The high OR (6.19 crude, remaining significant after adjustments) reinforces its value as an independent predictor. Importantly, although LAP showed superior predictive performance, with AUC values ranging from 0.76 to 0.96, the TyG index has a key advantage, which is that it can be calculated using routine biochemical tests, without requiring additional analyses, such as HDL-C and low-density lipoprotein cholesterol (LDL-C) parameters. 16 Therefore, the TyG index represents an accessible and practical tool for clinicians in routine practice. Unlike the diagnosis of MetS, which requires accurate WC measurement, this procedure is not consistently performed or standardized in many clinical settings41,42 and is often no different in Yucatan and other regions of Mexico. The TyG index relies solely on fasting glucose and triglyceride levels, which are routinely obtained in basic laboratory procedures. Thus, this index does not require specialized equipment or training in anthropometric assessment, making it a feasible and low-cost alternative for primary care settings.
Meanwhile, the present work has certain limitations. First, the study was conducted within a single tertiary-care center, which may limit the generalizability of the findings. However, the population attending our hospital is diverse and includes individuals from both urban and rural areas, partially enhancing the representativeness of the sample. Although promising results were observed when evaluating the predictive performance of the TyG index, further studies with larger samples are needed to confirm and validate these findings. Moreover, the cross-sectional design limits the analysis to identifying associations rather than establishing causal relationships.
Conclusion
In conclusion, the TyG index emerges as a promising marker with strong predictive and discriminative capacity for MetS, demonstrating good analytical and clinical validity. Moreover, as a simple and cost-effective metric derived from routine biochemical tests, it represents a valuable and accessible tool for identifying MetS in our study population.
Authors’ Contributions
Conceptualization: A.L.G.-S.; investigation: A.A.-N., R.L., B.P.-H., and E.P.-P.; analysis of data: A.L.G.-S., A.A.-N., and R.L.; writing—original draft preparation: A.L.G.-S. and B.P.-H., writing—review and editing: A.A.-N. and R.L. All authors have read and agreed to the published version of the article. The authors used language editing tools to improve English grammar and clarity; all content and interpretations were developed by the authors.
Footnotes
Acknowledgment
The authors thank Servicios de Salud del Instituto Mexicano del Seguro Social para el Bienestar (IMSS-Bienestar) for the support and resources provided.
Author Disclosure Statement
No conflicting financial interests exist.
Funding Information
The present study did not receive any specific research grant from public, commercial, or nonprofit agencies.