
Abstract
Background:
To compare bioelectrical impedance analysis (BIA)-derived body composition between women with polycystic ovary syndrome (PCOS) and body mass index (BMI)-matched controls, and to investigate associations with metabolic, hormonal, and inflammatory markers.
Methods:
This cross-sectional study included 35 women with PCOS and 37 BMI-matched healthy controls, aged 18–40 years, with BMI <35 kg/m2. Clinical, anthropometric, metabolic, hormonal, and inflammatory parameters were assessed. Body composition was determined by direct segmental multifrequency BIA, including fat mass (FM), trunk fat mass (trunk FM), lean mass (LM), FM index, fat-to-lean mass ratio (F/L ratio), and trunk-to-peripheral fat ratio.
Results:
Women with PCOS (28 ± 5.3 years, 26.6 ± 3.6 kg/m2) had higher FM index, trunk FM, and F/L ratio, while LM did not differ. They also showed higher fasting insulin, homeostatic model assessment for insulin resistance (HOMA-IR), glycated hemoglobin type A1c (HbA1c), low-density lipoprotein cholesterol, free androgen index, testosterone, androstenedione, and dehydroepiandrosterone sulfate, and lower sex hormone–binding globulin (SHBG). Among BIA parameters, FM, FM index, and F/L ratio showed more consistent associations with insulin resistance and selected inflammatory markers than trunk FM. In women with PCOS, these measures were positively correlated with fasting insulin and HOMA-IR and inversely correlated with SHBG. Associations with HbA1c and IL-6 were modest and not uniformly observed across all adiposity measures. No significant correlations were found with fasting glucose, HDL-c, triglycerides, or androgen levels.
Conclusions:
Women with PCOS exhibit higher adiposity, particularly reflected by FM index and F/L ratio, which show closer associations with metabolic and inflammatory dysfunction than trunk FM. These findings support the potential use of BIA as an accessible, low-cost, and noninvasive tool for the cross-sectional assessment of metabolic dysfunction in PCOS. Longitudinal studies are needed to clarify the clinical relevance of these associations.
Keywords
Introduction
Polycystic ovary syndrome (PCOS) is a heterogeneous endocrine disorder, affecting up to 20% of reproductive-age women. 1 According to current concepts, it results from genetic, epigenetic, and environmental interactions between endocrine and metabolic factors. 2 In this context, although characterized by hyperandrogenism, chronic oligo-ovulation, and polycystic ovaries, PCOS is also often associated with insulin resistance (IR) and an increased lifelong risk of cardiometabolic risk (CMR) factors, including obesity, type 2 diabetes mellitus, hypertension, and metabolic syndrome (MetS). 3
Although body mass index (BMI) has been directly associated with IR, some women living with PCOS and obesity are metabolically healthy, whereas others with normal BMI still present IR. 4 A major review of the literature shows that, regardless of obesity, many patients with PCOS excessively phosphorylate the receptor substrate (IRS-1/IRS-2) on serine, which can inhibit metabolic pathways in adipose, muscle, and liver tissue, promoting IR and compensatory hyperinsulinemia. 5
Moreover, there is evidence that hyperandrogenism can increase the expression of genes involved in lipogenesis, particularly favoring the accumulation of abdominal visceral adipose tissue (VAT), which plays an important role in worsening IR by increasing the production of free fatty acids (FFA), 6 and by promoting an imbalance in proinflammatory and proatherogenic cytokine synthesis which can manifest itself through increased serum concentrations of tumor necrosis factor-alpha (TNF-α) and interleukin-6 (IL-6). 7 This hypothesis is supported by studies demonstrating that metabolic dysfunction is particularly pronounced in women with PCOS with excessive VAT deposits. 8 It is important to emphasize that, since VAT contributes only about 15% of total systemic FFA, several studies over the past decades have shown that excess truncal or abdominal subcutaneous fat is also associated with IR, metabolic alterations, and hormonal profiles in both sexes. 9
Central fat accumulation is currently identified by anthropometric measurements. However, these are indirect methods and have limitations in accurately classifying individuals according to body composition.
Bioelectrical impedance analysis (BIA), which shows good agreement with magnetic resonance imaging (MRI) and dual X-ray absorptiometry (DXA) for estimating fat mass (FM), 10 is a quick, inexpensive, and noninvasive method that reliably quantifies trunk fat mass (trunk FM), thereby representing a potentially useful tool for characterizing CMR in clinical practice. Nevertheless, only a limited number of controlled studies have employed BIA to investigate body composition and its association with CMR in PCOS, and their findings remain inconsistent.11,12
Therefore, in the present study, we aimed to compare BIA-derived body composition in women with PCOS and healthy controls, matched for BMI, with a special focus on examining whether IR, circulating androgens, inflammatory markers, and anthropometric indices are associated with FM and lean mass (LM) distribution/accumulation.
Methods
This cross-sectional study was conducted at Pedro Ernesto University Hospital (Rio de Janeiro, Brazil). A total of 112 volunteers aged 18–40 years with BMI <35 kg/m2 (suspected/diagnosed PCOS or healthy women willing to participate in the control group) were recruited from the public outpatient clinic or through social media platforms.
General exclusion criteria included history of pregnancy, chronic diseases, smoking, alcohol intake, regular physical activity, use of hormonal contraceptives, anti-androgens, anabolic-androgenic steroids, supplements, weight-loss drugs, or metformin therapy during the previous 3 months. An additional screening was carried out on the remaining women. Women who did not fulfill the PCOS diagnostic standards set out in the 2018 International Evidence-Based Guidelines were excluded from the PCOS group, while those with menstrual irregularities or clinical/laboratory hyperandrogenism were excluded from the control group. Thirty-five women diagnosed with PCOS and 37 BMI-matched healthy subjects were selected.
Clinical history and physical examination were performed in a standardized manner by a single investigator. Body weight and height were recorded using a digital scale and a stadiometer, respectively. Waist circumference was measured at the midpoint between the lower rib margin and the anterior superior iliac crest, and hip circumference was measured at the level of the greater trochanters. BMI and waist-to-hip ratio were then calculated.
Venous blood samples were collected after an 8-hr overnight fast during the early follicular phase of a spontaneous or induced menstrual cycle. Biochemical parameters, including plasma glucose, glycated hemoglobin type A1c (HbA1c), and lipid profile, were determined by automated commercial methods. Low-density lipoprotein cholesterol (LDL-c) was calculated using the Friedewald formula. Sex hormone–binding globulin (SHBG), total testosterone (T), androstenedione (A4), dehydroepiandrosterone sulfate (DHEAS), and plasma insulin levels were measured by chemiluminescence (Immulite 2000, Siemens Healthcare Diagnostics, Tarrytown, NY; intra- and interassay coefficient of variations (CVs) <8%; lower limits of detection ranged from 0.2 to 0.8 ng/mL, depending on the analyte). Homeostatic model assessment for insulin resistance (HOMA-IR) was calculated as [insulin (μU/mL) × glucose (mg/dL)]/405. TNF-α and IL-6 serum levels were measured by high-sensitivity ELISA (Quantikine HS, R&D Systems, Minneapolis, MN; limits of detection 0.04 pg/mL and 0.10 pg/mL, respectively; CVs <8%).
The free androgen index (FAI) was measured through the formula: [T (nmol/L)/SHBG (nmol/L) × 100]. Total testosterone values reported in ng/mL were converted to nmol/L (1 ng/mL = 3.467 nmol/L). The lipid accumulation product (LAP) was calculated using the formula: [waist circumference (cm) − 58] × triglycerides (mmol/L).
Following previously established procedures, all subjects underwent assessment by direct segmental multifrequency BIA using the InBody 370 system (InBody Co., Ltd., Cerritos, CA), a tetrapolar BIA system equipped with eight tactile electrodes, integrating advanced technology for segmented impedance analysis. This method involves 15 impedance readings at three distinct frequencies (5, 50, 250 kHz) across five body segments (right and left arms/legs and trunk) while the patient remains standing, barefoot, and with light clothing. The procedure took place with subjects outside their menstrual period, after an overnight fast, with an empty bladder, and following preparatory steps that included discontinuation of caffeine intake and abstinence from alcohol and physical exercise for at least 48 h. The following body composition variables were measured: LM, FM, and trunk FM. From these data, the subsequent indices were calculated based on the distribution of fat: FM/height 2 (FM index), trunk-to-peripheral fat ratio, and fat-to-lean mass ratio (F/L ratio).
The study was approved by the Research Ethics Committee of Pedro Ernesto University Hospital (approval no. 96886918.3.0000.5259), and written informed consent was obtained from all participants.
Statistical analysis
Data normality was assessed using the Shapiro–Wilk test. Results are expressed as mean ± standard deviation (SD), median [interquartile range (IQR)], or frequency (n, %), as appropriate. Between-group comparisons were evaluated using an unpaired Student’s t-test for normally distributed data and the Mann–Whitney U test for non-normally distributed data. The chi-square test was used for comparisons of categorical variables. Based on the biological relevance of PCOS, trunk FM, FM index, and F/L ratio were designated as the primary outcomes. All other BIA parameters were considered secondary.
Statistical power calculations were performed using the expected differences in the primary endpoints, with α = 0.05. To account for multiple comparisons across groups, the Benjamini–Hochberg false discovery rate (FDR) correction was applied. Both unadjusted P values and adjusted q values are reported. Pearson’s or Spearman’s correlation coefficients were calculated to examine the associations between BIA parameters (trunk FM, FM index, and F/L ratio) and cardiometabolic, hormonal, or inflammatory profiles.
All calculations were performed using NCSS™ statistical software (Kaysville, UT). For between-group comparisons, significance was defined as q < 0.05 after FDR correction. Correlation analyses were considered exploratory and interpreted at P ≤ 0.05.
Results
Thirty-five women with PCOS and 37 controls were evaluated. Age did not differ between groups (q = 0.06). Women with PCOS exhibited a higher prevalence of acanthosis nigricans (34.3% vs. 8.1%, respectively; q < 0.001). The mean modified Ferriman–Gallwey score (mFG) in the PCOS group was 10.43 ± 6.60. Waist circumference and waist-to-hip ratio were significantly higher in women with PCOS (q ≤ 0.04). LAP did not differ between groups (q = 0.98; Table 1).
Demographic and Clinical Characteristics of Women with PCOS and Controls
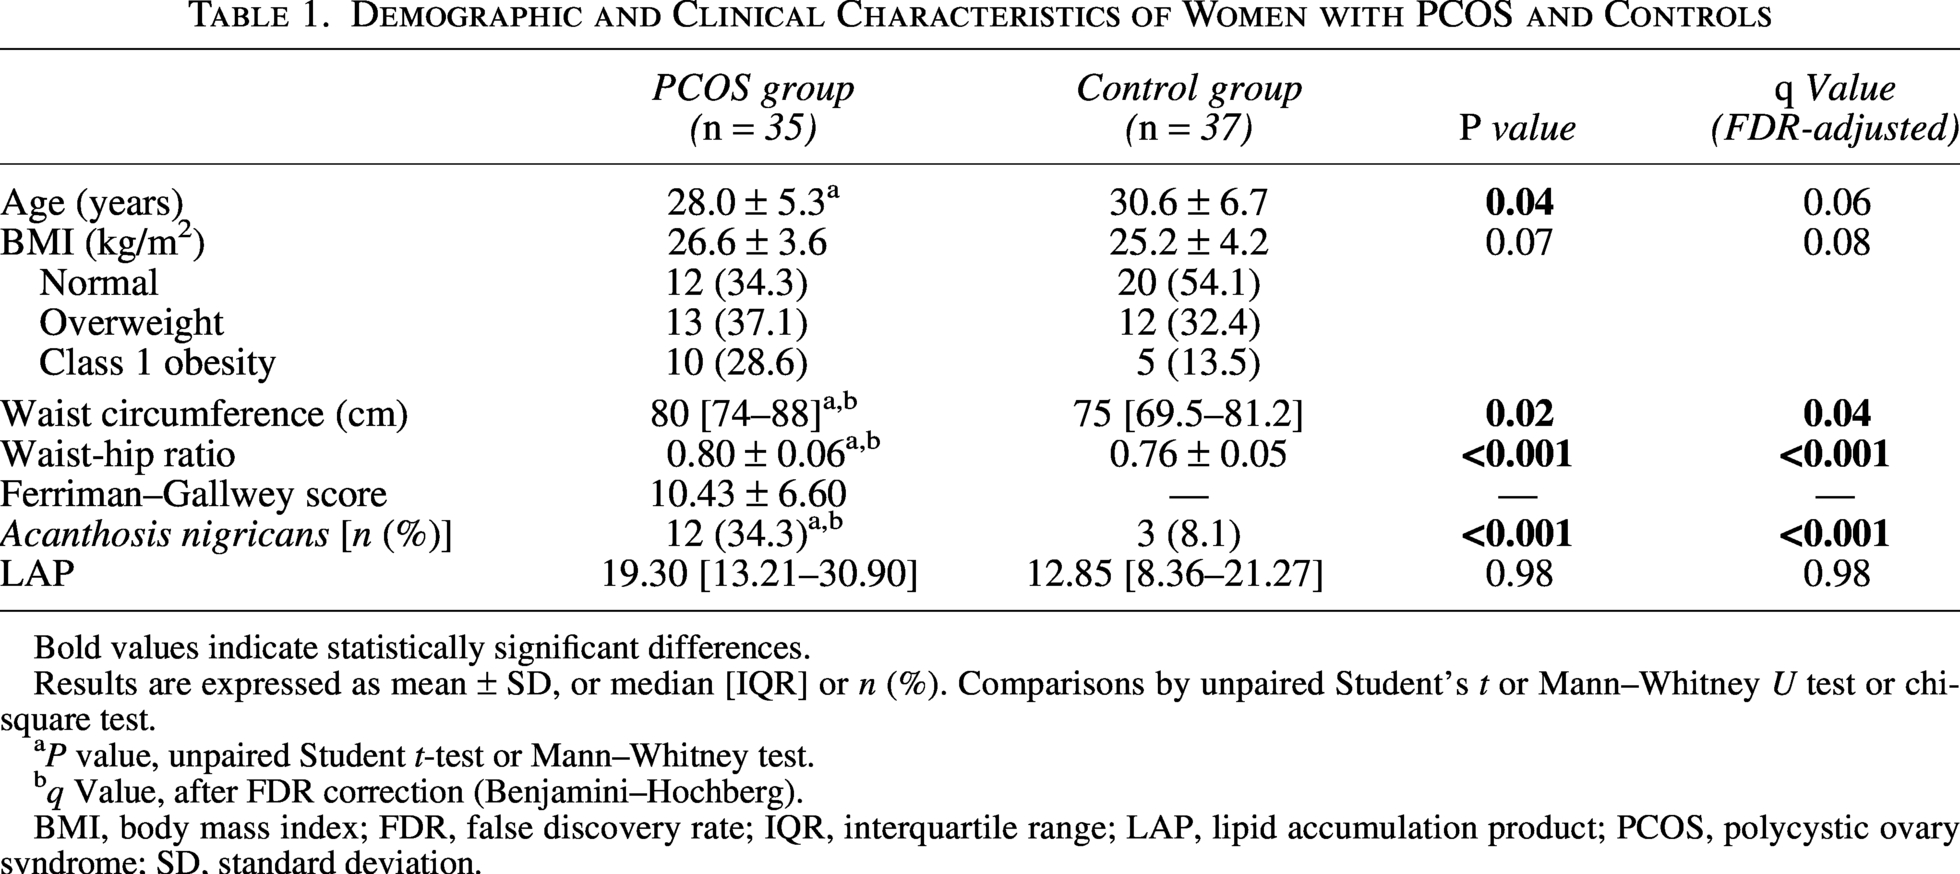
Bold values indicate statistically significant differences.
Results are expressed as mean ± SD, or median [IQR] or n (%). Comparisons by unpaired Student’s t or Mann–Whitney U test or chi-square test.
aP value, unpaired Student t-test or Mann–Whitney test.
bq Value, after FDR correction (Benjamini–Hochberg).
BMI, body mass index; FDR, false discovery rate; IQR, interquartile range; LAP, lipid accumulation product; PCOS, polycystic ovary syndrome; SD, standard deviation.
Compared with controls, women with PCOS exhibited significantly higher fasting insulin, HOMA-IR, HbA1c, and LDL-c levels, despite comparable fasting glucose, total cholesterol, and HDL-c (Table 2). Regarding the hormonal profile, the PCOS group showed markedly elevated FAI, T, A4, and DHEAS, along with significantly reduced SHBG concentrations (Table 2).
Laboratory Parameters and Body Composition of Women with PCOS and Controls

Bold values indicate statistically significant differences.
Results are expressed as mean ± SD or median [IQR]. Comparisons by unpaired Student’s t or Mann–Whitney U test.
aP value, unpaired Student t-test or Mann–Whitney test.
bq Value, after FDR correction (Benjamini–Hochberg).
PCOS, polycystic ovary syndrome; TNF-α, tumoral necrosis factor-alpha; IL-6, interleukin-6; SHBG, sex hormone–binding globulin; F/L ratio, fat-to-lean ratio; Trunk FM, trunk fat mass; DHEAS, dehydroepiandrosterone sulfate; SD, standard deviation; IQR, interquartile range.
In terms of body composition, women with PCOS had significantly higher trunk FM, FM index, and F/L ratio (q ≤ 0.05). No differences were observed in LM, FM, and trunk-to-peripheral fat ratio (Table 2).
In women with PCOS, all BIA-derived parameters were positively correlated with BMI and waist circumference, except trunk-to-peripheral fat ratio with BMI (P = 0.07) (Table 3). FM, FM index, and F/L ratio had a moderate positive correlation with LAP (rho = 0.55–0.66, P < 0.001). FM and F/L ratio were positively associated with IL-6, with a stronger association for F/L ratio (rho = 0.34 and 0.40; P ≤ 0.05). SHBG levels correlated inversely with FM, FM index, trunk FM, and F/L ratio (rho = −0.34 to −0.46, P ≤ 0.05), underscoring the association between adiposity and reduced SHBG. There was no significant correlation between any BIA parameter and TNF-α, FAI, T, A4, and DHEAS.
Correlations Between BIA Parameters and Anthropometric, Metabolic, Inflammatory, and Hormonal Variables in Women with PCOS
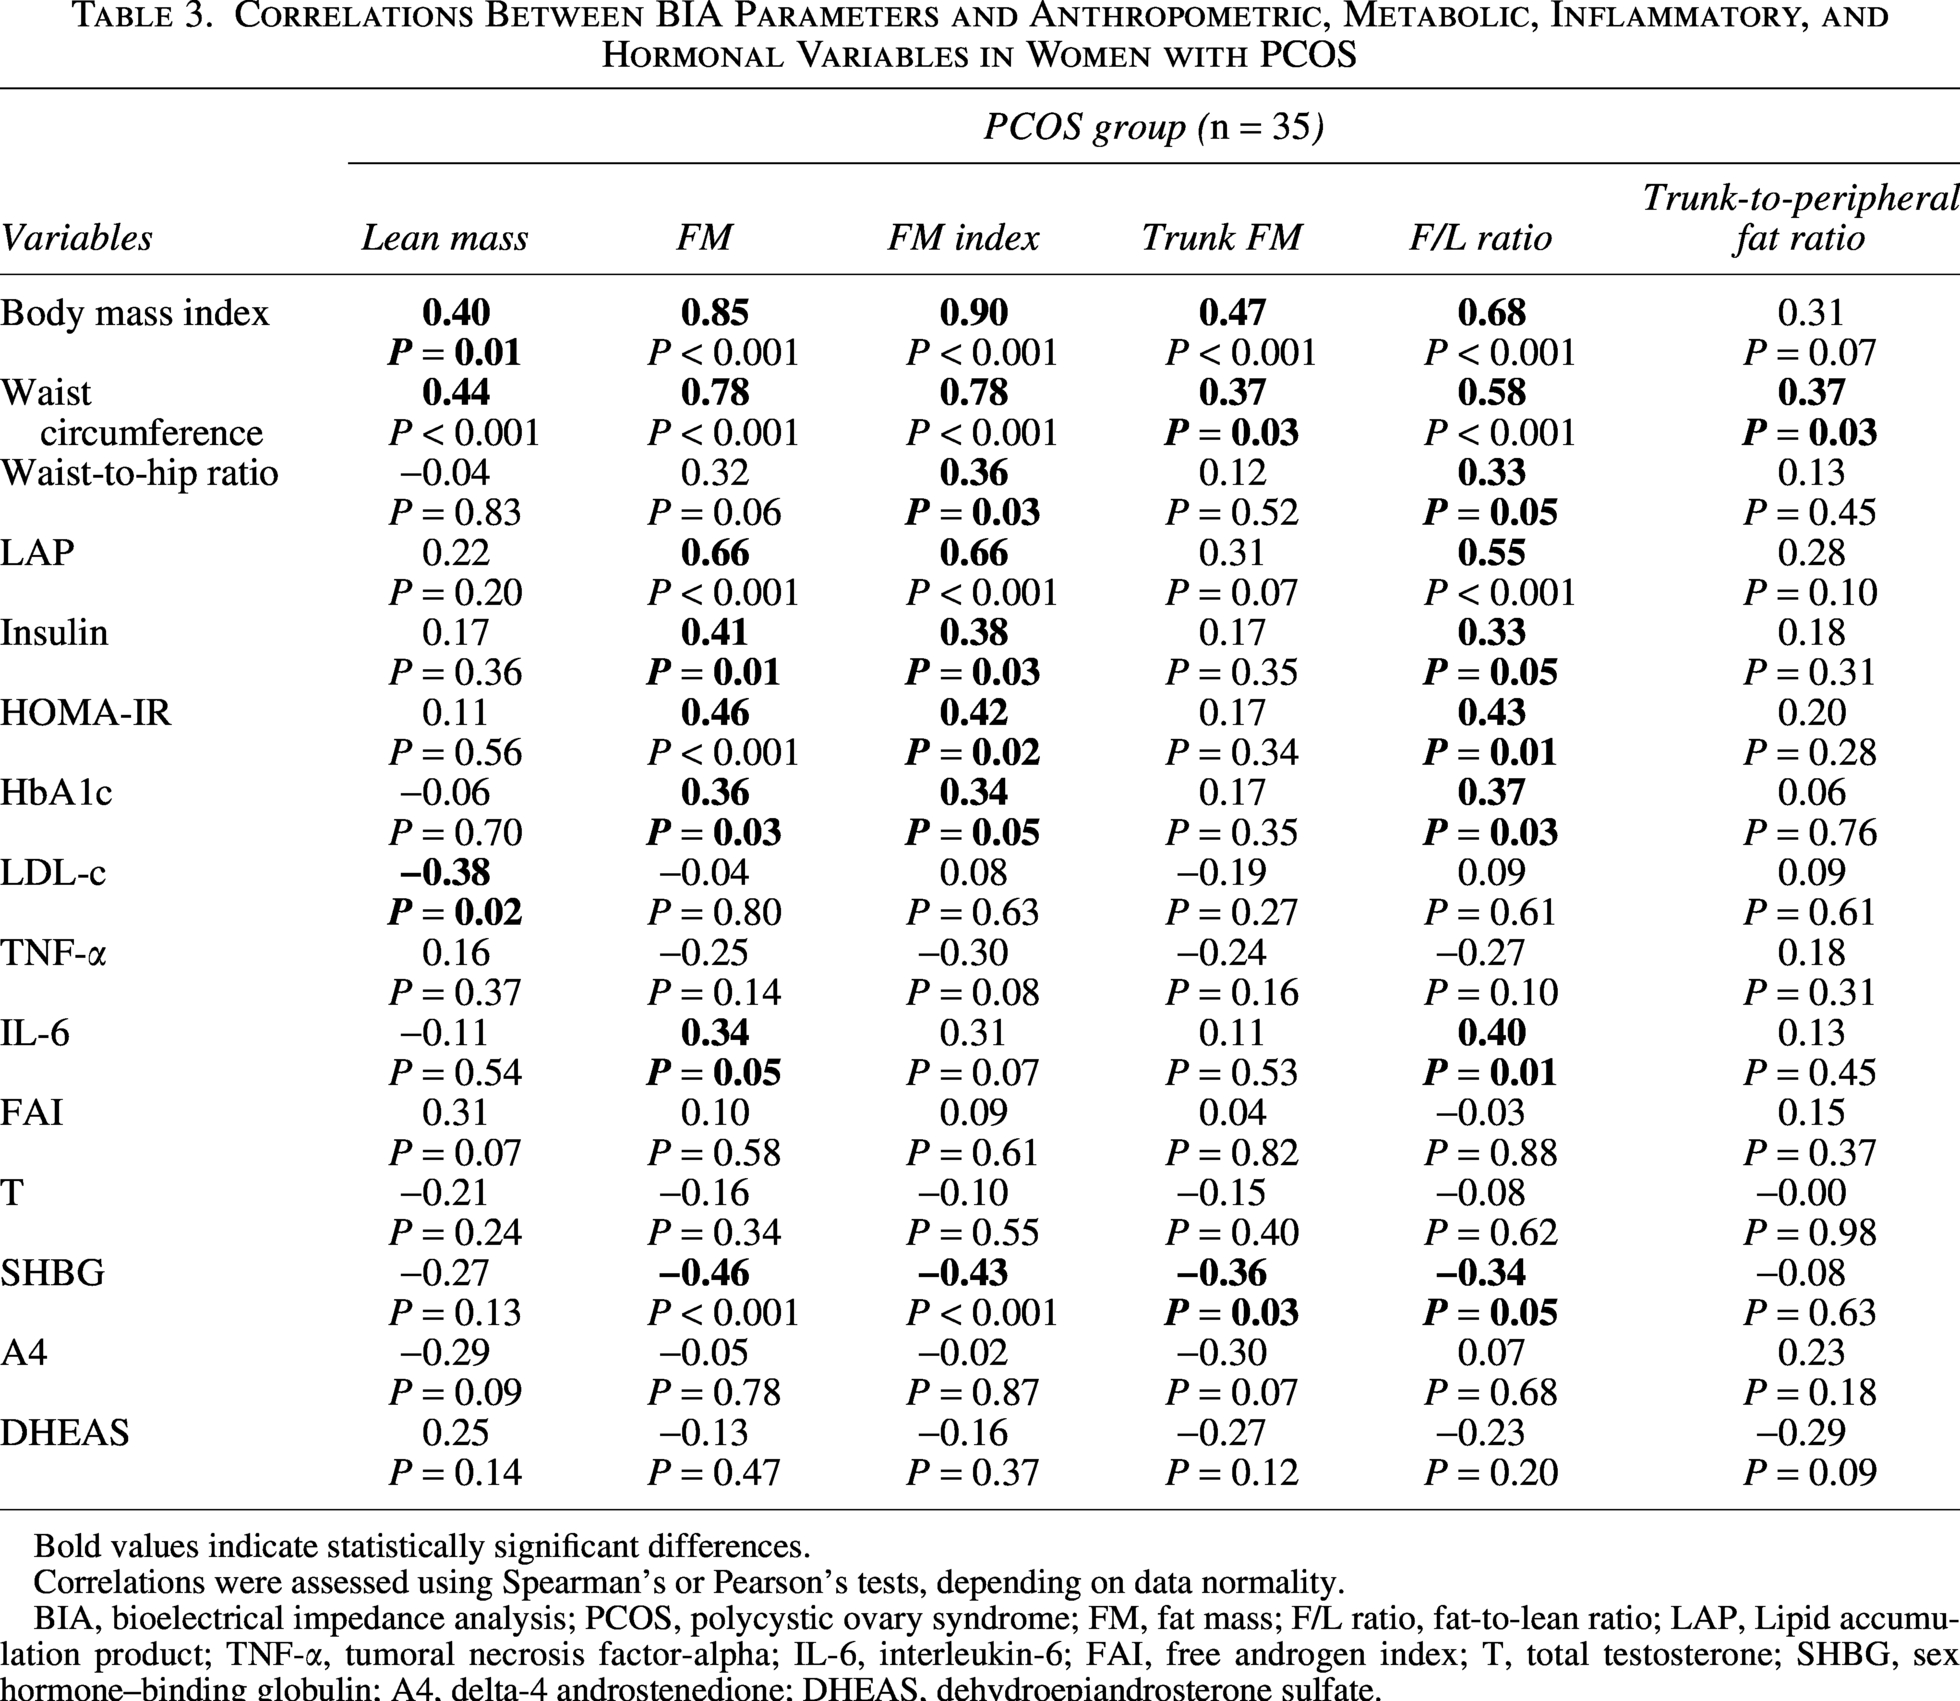
Bold values indicate statistically significant differences.
Correlations were assessed using Spearman’s or Pearson’s tests, depending on data normality.
BIA, bioelectrical impedance analysis; PCOS, polycystic ovary syndrome; FM, fat mass; F/L ratio, fat-to-lean ratio; LAP, Lipid accumulation product; TNF-α, tumoral necrosis factor-alpha; IL-6, interleukin-6; FAI, free androgen index; T, total testosterone; SHBG, sex hormone–binding globulin; A4, delta-4 androstenedione; DHEAS, dehydroepiandrosterone sulfate.
In the control group, adiposity-related BIA measures were strongly associated with BMI and waist circumference (rho = 0.75–0.94; P < 0.001) and moderately correlated with IR markers (insulin and HOMA-IR; P ≤ 0.05), but not with glycemic control (HbA1c), lipid profile (LDL-c), or inflammation (TNF-α and IL-6). In addition, the FAI showed positive correlations with FM, FM index, trunk FM, and F/L ratio (P ≤ 0.01), whereas SHBG was inversely correlated with these adiposity-related BIA parameters (all P < 0.001). No significant associations were observed with T, A4, or DHEAS (Table 4).
Correlations Between BIA Parameters and Anthropometric, Metabolic, Inflammatory, and Hormonal Variables in the Control Group
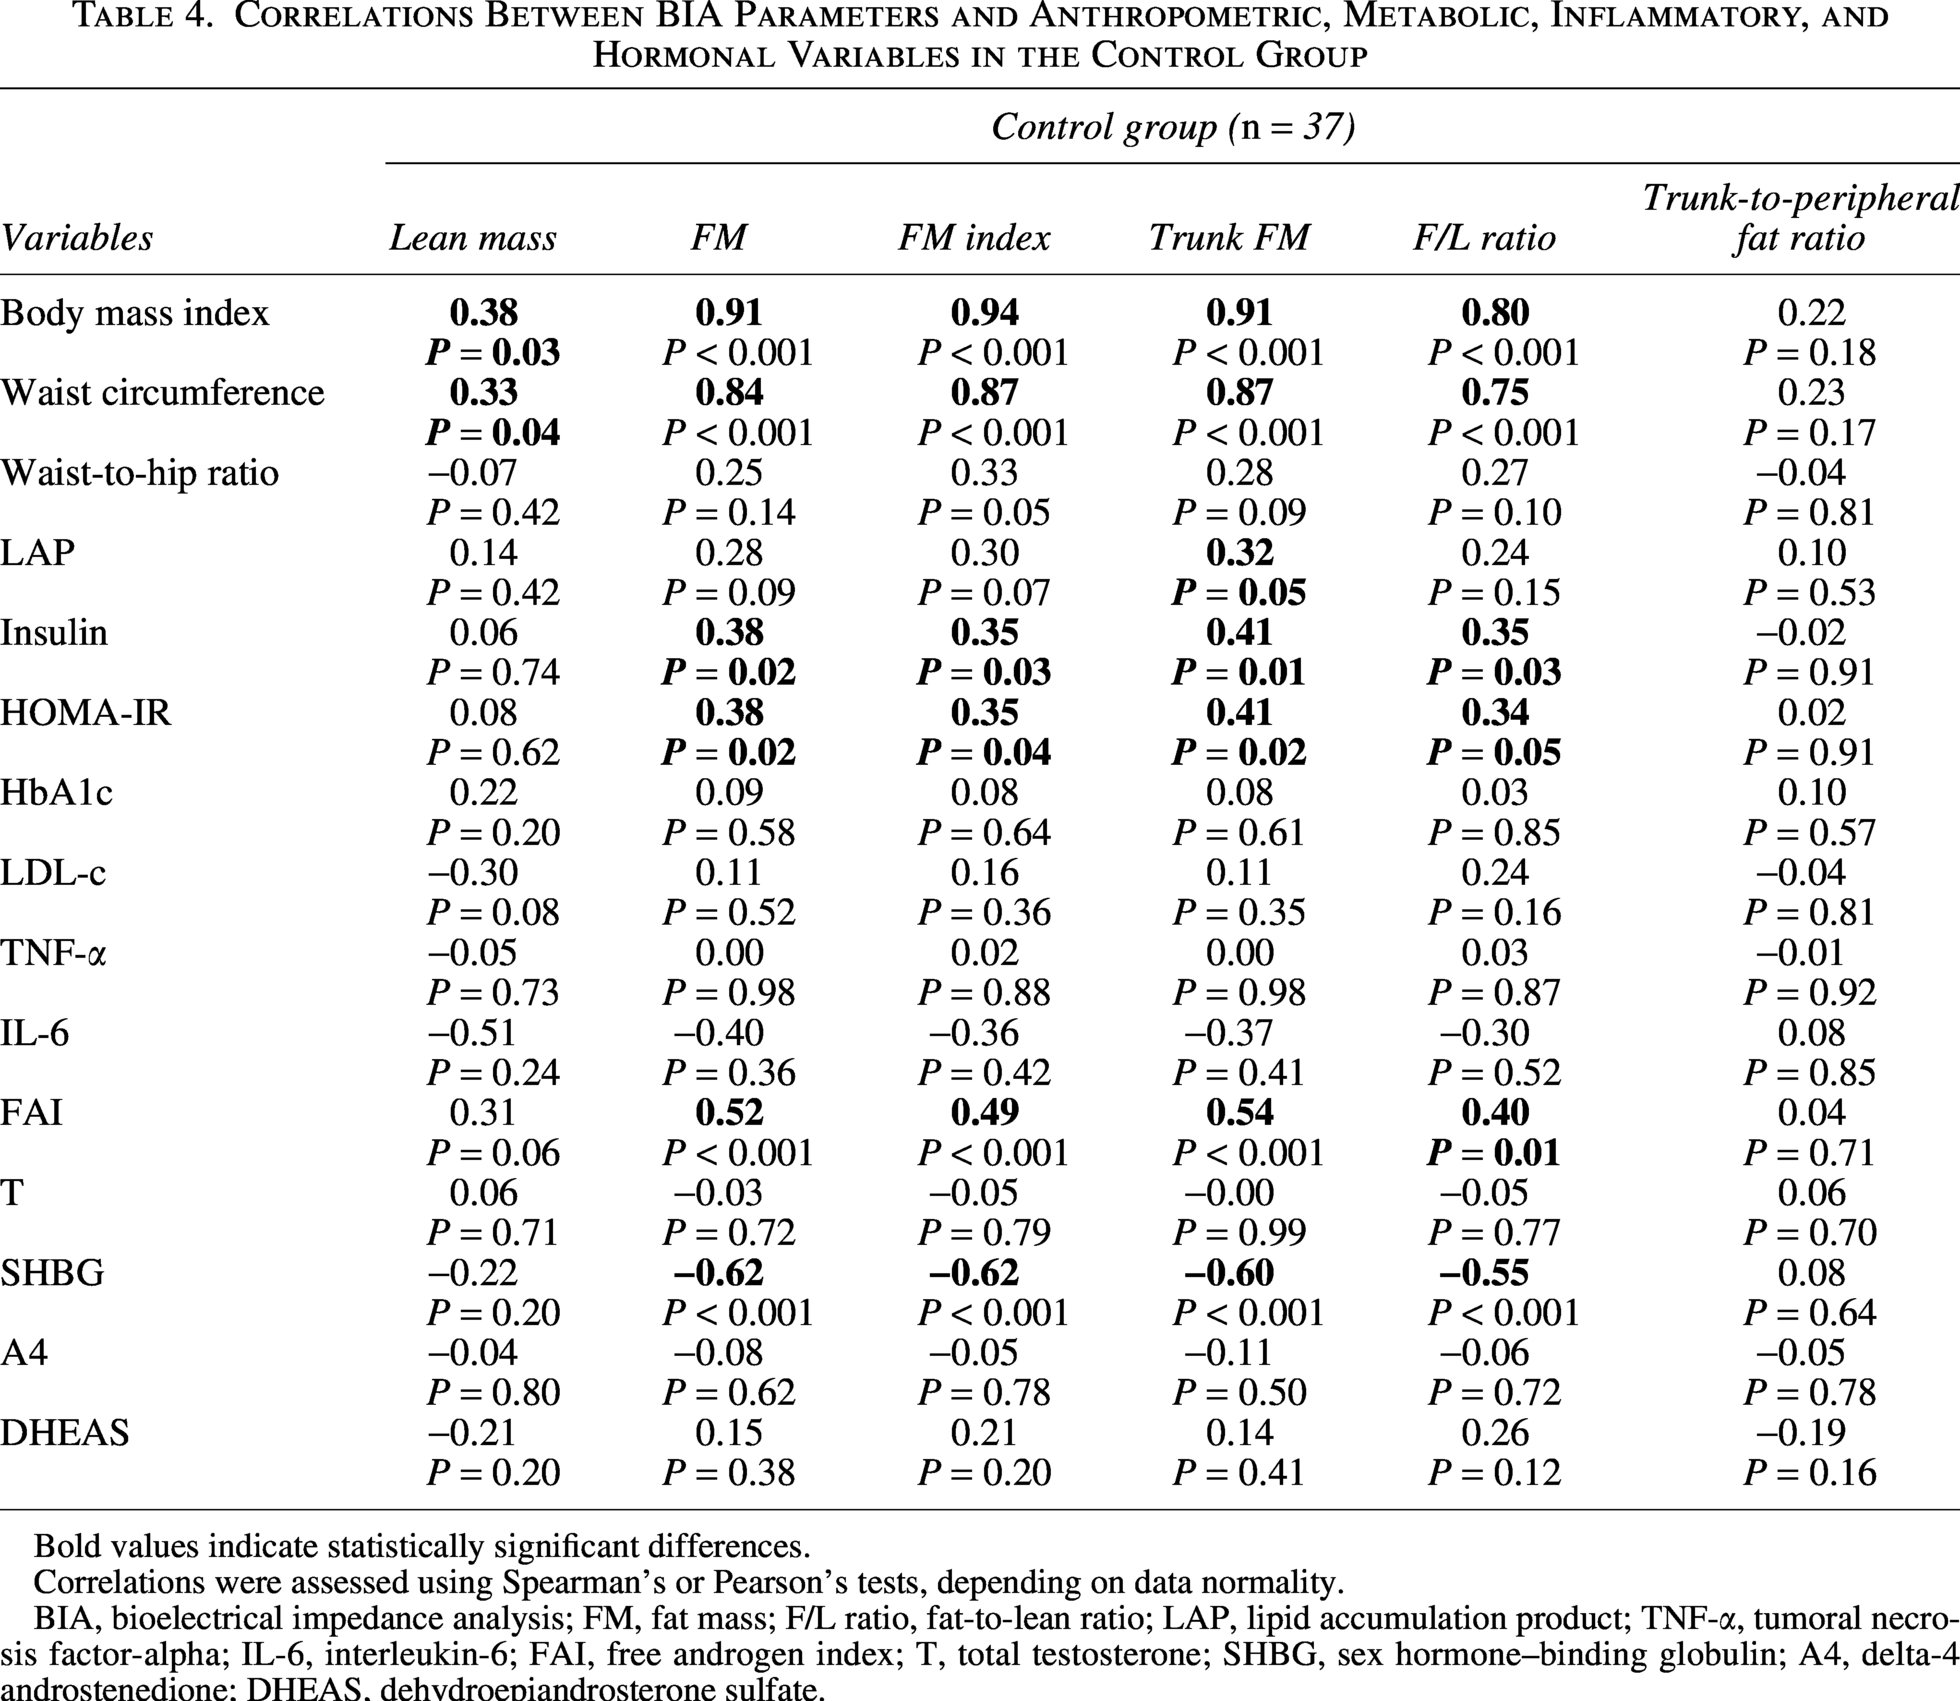
Bold values indicate statistically significant differences.
Correlations were assessed using Spearman’s or Pearson’s tests, depending on data normality.
BIA, bioelectrical impedance analysis; FM, fat mass; F/L ratio, fat-to-lean ratio; LAP, lipid accumulation product; TNF-α, tumoral necrosis factor-alpha; IL-6, interleukin-6; FAI, free androgen index; T, total testosterone; SHBG, sex hormone–binding globulin; A4, delta-4 androstenedione; DHEAS, dehydroepiandrosterone sulfate.
Discussion
In the present study, we observed that, when comparing women with PCOS to BMI-matched healthy women, circulating SHBG levels were significantly lower, whereas androgens, HbA1c, fasting insulin, and HOMA-IR were higher, along with a significant increase in FM, FM index, trunk FM, and especially in the F/L ratio. Total FM, FM index, and F/L ratio showed more consistent associations with metabolic and inflammatory markers than trunk FM, particularly in women with PCOS. In particular, trunk FM demonstrated weaker or nonsignificant correlations with HOMA-IR, HbA1c, and IL-6 in women with PCOS, whereas total FM, FM index, and F/L ratio were more frequently associated with these outcomes. However, no single BIA-derived parameter consistently outperformed the others across all metabolic domains.
Even when assessed by gold standard methods (such as MRI or CT) or DXA, available research on body composition in PCOS shows conflicting results, particularly, but not exclusively, regarding LM, which has been described as increased, decreased, or, more often, similar to that of the controls.13,14 This variability in body composition findings may arise from differences in sample characteristics and especially from the different imaging methods used. In a 2021 meta-analysis, fat distribution did not differ between women with PCOS and BMI-matched controls when using MRI or CT, but higher VAT, abdominal subcutaneous FM, and trunk FM were detected with DXA or ultrasound, especially in women without obesity. 12 This finding corroborates a previous hypothesis of VAT overestimation by DXA. 15 In fact, most previous controlled studies using DXA, including a recent one conducted with the current sample, 16 described higher total FM, excess trunk FM, comparable LM, and increased F/L ratio in women with PCOS.17,18
The lack of uniformity in results is also observed in the limited studies that have examined BIA-derived body composition measures in women with PCOS. Data from small controlled studies conducted in lean or young women,19–21 as well as from a large study including 150 women with PCOS and 240 controls,11,22 showed no statistically significant differences in body composition characteristics between groups. However, in line with our results, Cosar et al. 22 reported an upper-half-type body fat distribution in PCOS, while Ezhe and Zhang et al.23,24 described increased total adiposity, trunk FM, and F/L ratio.
Consistent with our findings, the excess deposition of trunk FM in patients with PCOS is usually accompanied by alterations in anthropometric measures (particularly BMI and WC) and by anthropometric indices, which have emerged as additional important, noninvasive, and cost-effective markers of IR 25 and VAT dysfunction. 26 In our study, the median level of LAP showed a significant correlation with FM, FM index, and F/L ratio.
Surprisingly, in the present study, the FM index and F/L ratio showed a stronger association with anthropometric indices used as clinical markers of central adiposity than trunk FM, both in the PCOS and control groups. Furthermore, significant correlations with HbA1c, insulin, and HOMA-IR were observed only for FM, FM index, and F/L ratio, while a significant correlation with IL-6 was mainly observed for F/L ratio. Taken together, these findings suggest that FM, FM index, and F/L ratio are more strongly associated with CMR in women with PCOS.
The usefulness of the FM index as a surrogate marker of CMR has already been demonstrated using BIA. 11 In parallel, the effects of F/L ratio on insulin sensitivity (IS) and MetS have already been documented by different methods.27,28 Using BIA, data from Ezhe et al. 24 demonstrated that F/L ratio is independently associated with fasting insulin, HOMA-IR, and HOMA-%β-cell, and tends to negatively correlate with glucose effectiveness or noninsulin-mediated glucose transport in women with PCOS, suggesting that the higher degrees of metabolic dysfunction in patients with PCOS may be partly attributable to their higher F/L ratio.
The relationship between LM and metabolic disorders in PCOS remains unclear. The euglycemic–hyperinsulinemic clamp has been shown to reduce insulin-stimulated glucose uptake in hyperandrogenic women, attributed to skeletal muscle IR. 29 In contrast, population-based data indicate that increases in LM or skeletal muscle are positively associated with IS, 30 and clinical evidence suggests that gains in muscle mass improve whole-body IS following exercise.31,32 Regarding FM, several studies indicate that IR and an adverse metabolic profile in PCOS are aggravated by excess adiposity, particularly central fat, including VAT and deep abdominal subcutaneous fat. 33
Consistent with the large BIA study by Zakeri et al., 11 we observed no significant correlations between LM, FM, FM index, or F/L ratio and serum androgen levels. However, in line with literature data, we found negative correlations between SHBG and body composition parameters. 34 SHBG is inversely associated with visceral adiposity, 35 and hyperinsulinemia may amplify androgen effects by inhibiting its synthesis in PCOS. 36 Also consistent with previous studies, FM, FM index, and F/L ratio correlated significantly with HbA1c, fasting insulin, and HOMA-IR, while only F/L ratio showed a consistent association with IL-6, which, along with TNF-α, contributes to obesity-related IR 37 and may exacerbate hyperandrogenism by directly affecting ovarian and adrenal function. 38
Some limitations of our study should also be acknowledged. First, the cross-sectional design precludes any inference of causality. Furthermore, we were unable to assess the regional subcompartments of abdominal FM, and the relatively small sample size studied, mainly due to strict eligibility criteria, may limit diversity and potentially affect the generalizability of the results.
To our knowledge, this is one of the few controlled studies to employ segmental multifrequency BIA to evaluate adiposity distribution in BMI-matched women with PCOS, and the first to investigate these specific features in a Brazilian population.
In conclusion, Brazilian women with PCOS showed significantly higher FM index, trunk FM, and F/L ratio than BMI-matched controls. Although BIA-derived parameters did not correlate with androgen levels, their associations with HbA1c, fasting insulin, and HOMA-IR, together with the association between F/L ratio and IL-6, highlight their relevance in reflecting metabolic dysfunction. Among BIA-derived measures, total FM, FM index, and F/L ratio were more consistently associated with metabolic dysfunction than trunk FM. Longitudinal studies with large samples and repeated assessments are needed to investigate the clinical applicability of BIA as an additional accessible, low-cost, and noninvasive tool for the assessment of metabolic dysfunction in PCOS. Given the portability and affordability of BIA, FM index and F/L ratio may be especially valuable in low- and middle-income settings, where advanced imaging techniques are not widely available.
Authors’ Contributions
Conceptualization: L.M.C.S.M.L. and L.G.K.A. Methodology: L.M.C.S.M.L. and L.G.K.A. Formal analysis and data interpretation: L.M.C.S.M.L., R.B.M.C., K.G.L., and A.B.W.T. Data curation: L.M.C.S.M.L., R.B.M.C., and K.G.L. Writing—original draft preparation: L.M.C.S.M.L., K.G.L. Writing—review and editing: L.M.C.S.M.L. and L.G.K.A., A.B.W.T. Supervision: L.M.C.S.M.L., L.G.K.A., and A.B.W.T. Approval of the final article: All authors.
Footnotes
Data Availability Statement
The datasets used to support the findings of this study are available from the corresponding author upon reasonable request and can be shared in accordance with institutional ethics approval.
Author Disclosure Statement
The authors declare no conflicts of interest.
Funding Information
This research was funded by the