
Abstract
Background and Aims:
Prospective data on the joint impact of adiposity and systemic inflammation on incident metabolic dysfunction–associated steatotic liver disease (MASLD) in type 2 diabetes (T2D) are limited. We examined the individual and combined associations of body mass index (BMI) and high-sensitivity C-reactive protein (hsCRP) with incident MASLD in patients with T2D.
Materials and Methods:
This prospective cohort study included 2796 adults with T2D free of MASLD from the Kailuan study (China). Over a 14-year follow-up, participants were classified by baseline BMI: (<24 vs. ≥24 kg/m2) and hsCRP (<3 vs. ≥3 mg/L). Multivariable Cox models estimated hazard ratios (HRs) for incident ultrasonographic steatosis.
Results:
The cumulative incidence of MASLD was 53.9%. Higher BMI: and hsCRP were independently associated with increased risk. In joint analyses, the high BMI/high hsCRP group had the highest risk [adjusted HR: 2.31; 95% confidence interval (CI): 1.94–2.74] compared with the low BMI/low hsCRP group. This risk was greater than isolated high hsCRP (HR: 1.37) or isolated high BMI: (HR: 1.93).
Conclusions:
Elevated BMI: and hsCRP are independently associated with incident MASLD in T2D. Co-elevation of both factors confers the greatest risk, suggesting that incorporating both adiposity and inflammatory markers improves risk stratification for targeted preventive strategies.
Keywords
Introduction
Metabolic dysfunction–associated steatotic liver disease (MASLD), the term proposed by the 2023 multisociety Delphi consensus, 1 is now recognized as the most common chronic liver disease worldwide, with an estimated global prevalence of approximately 38% in adults and a continuing upward trend.2–4 In parallel, type 2 diabetes (T2D) is projected to affect 589 million adults in 2025 and 853 million by 2050. 5 Among individuals with T2D, the prevalence of MASLD is as high as 65%–74%, and its presence markedly accelerates progression to cirrhosis, hepatocellular carcinoma, and cardiovascular events, with all-cause mortality increased 2.0- to 2.8-fold compared with T2D alone.6–9 These data highlight MASLD as a major hepatic and cardiometabolic complication in patients with T2D.
MASLD is defined by hepatic steatosis together with at least one cardiometabolic risk factor, underscoring metabolic dysfunction as the central driver of disease. 10 In T2D, insulin resistance interacts with adipose tissue dysfunction and chronic low-grade inflammation to promote de novo lipogenesis, lipotoxicity, and progression to metabolic dysfunction–associated steatohepatitis and advanced fibrosis.11–13 This pathophysiological milieu suggests that markers reflecting excess adiposity and systemic inflammation may jointly identify individuals at particularly high risk of developing MASLD.
Obesity and systemic inflammation are among the most potent modifiable determinants of incident MASLD. Each 5 kg/m2 increment in body mass index (BMI) confers a 2-to 3-fold higher risk of MASLD,14,15 whereas elevated hsCRP, a sensitive biomarker of low-grade inflammation, independently predicts incident MASLD and fibrosis severity, including in diabetic populations.16–18 Mechanistically, visceral adiposity promotes interleukin-6–mediated hepatic hsCRP production, thereby amplifying insulin resistance and hepatocellular injury in a vicious cycle that is particularly pronounced in T2D. 19 Recent studies have suggested that high BMI: and high hsCRP may jointly increase MASLD prevalence and fibrosis burden. 20 However, most available data are cross-sectional or derived from relatively short-term cohorts, and prospective evidence on their joint long-term impact in T2D remains limited, with inconsistent findings regarding interaction on additive and multiplicative scales.
In this 14-year prospective cohort study of 2796 patients with T2D without MASLD at baseline, we examined the individual and joint associations of baseline BMI: and hsCRP with incident MASLD. We hypothesized that concurrent elevation of both BMI: and hsCRP would confer a higher risk than either factor alone, based on comparative hazard ratios (HRs), and would identify an ultra-high-risk subgroup of patients with T2D who may benefit from combined weight-loss and inflammation-targeted preventive strategies.
Methods
Study design and population
This prospective cohort study was nested within the Kailuan study, a large-scale, ongoing, community-based longitudinal cohort established in Tangshan, China. The design, recruitment procedures, and baseline characteristics of the Kailuan cohort have been described in detail previously. 21 Briefly, between June 2006 and October 2007, 101,510 adults employed or retired from the Kailuan Group underwent standardized health examinations at 11 affiliated hospitals. For the present analysis, we restricted the cohort to 9489 participants with confirmed T2D at baseline (defined as fasting blood glucose ≥7.0 mmol/L, self-reported physician-diagnosed diabetes, or use of glucose-lowering medication). Follow-up examinations, including anthropometric measurements, laboratory tests, and abdominal ultrasonography, were conducted biennially until December 2020, with a maximum follow-up of approximately 14.5 years.
Participants were excluded if they had missing baseline abdominal ultrasonography data (n = 29); missing BMI: or hsCRP data (n = 238); hsCRP >10 mg/L (n = 534); heavy alcohol consumption (>140 grams/week in men or >70 grams/week in women, n = 1170]); prevalent MASLD at baseline (n = 4046); positive hepatitis B surface antigen, known cirrhosis, or history of malignancy (n = 163); or were lost to follow-up or lacked at least one follow-up ultrasonography examination (n = 513). After these exclusions, 2796 participants with T2D but without baseline MASLD were included in the final analytic cohort (Fig. 1). The study was approved by the ethics committee of Kailuan General Hospital (approval number: 2006-05) and conducted in accordance with the Declaration of Helsinki. All participants provided written informed consent.
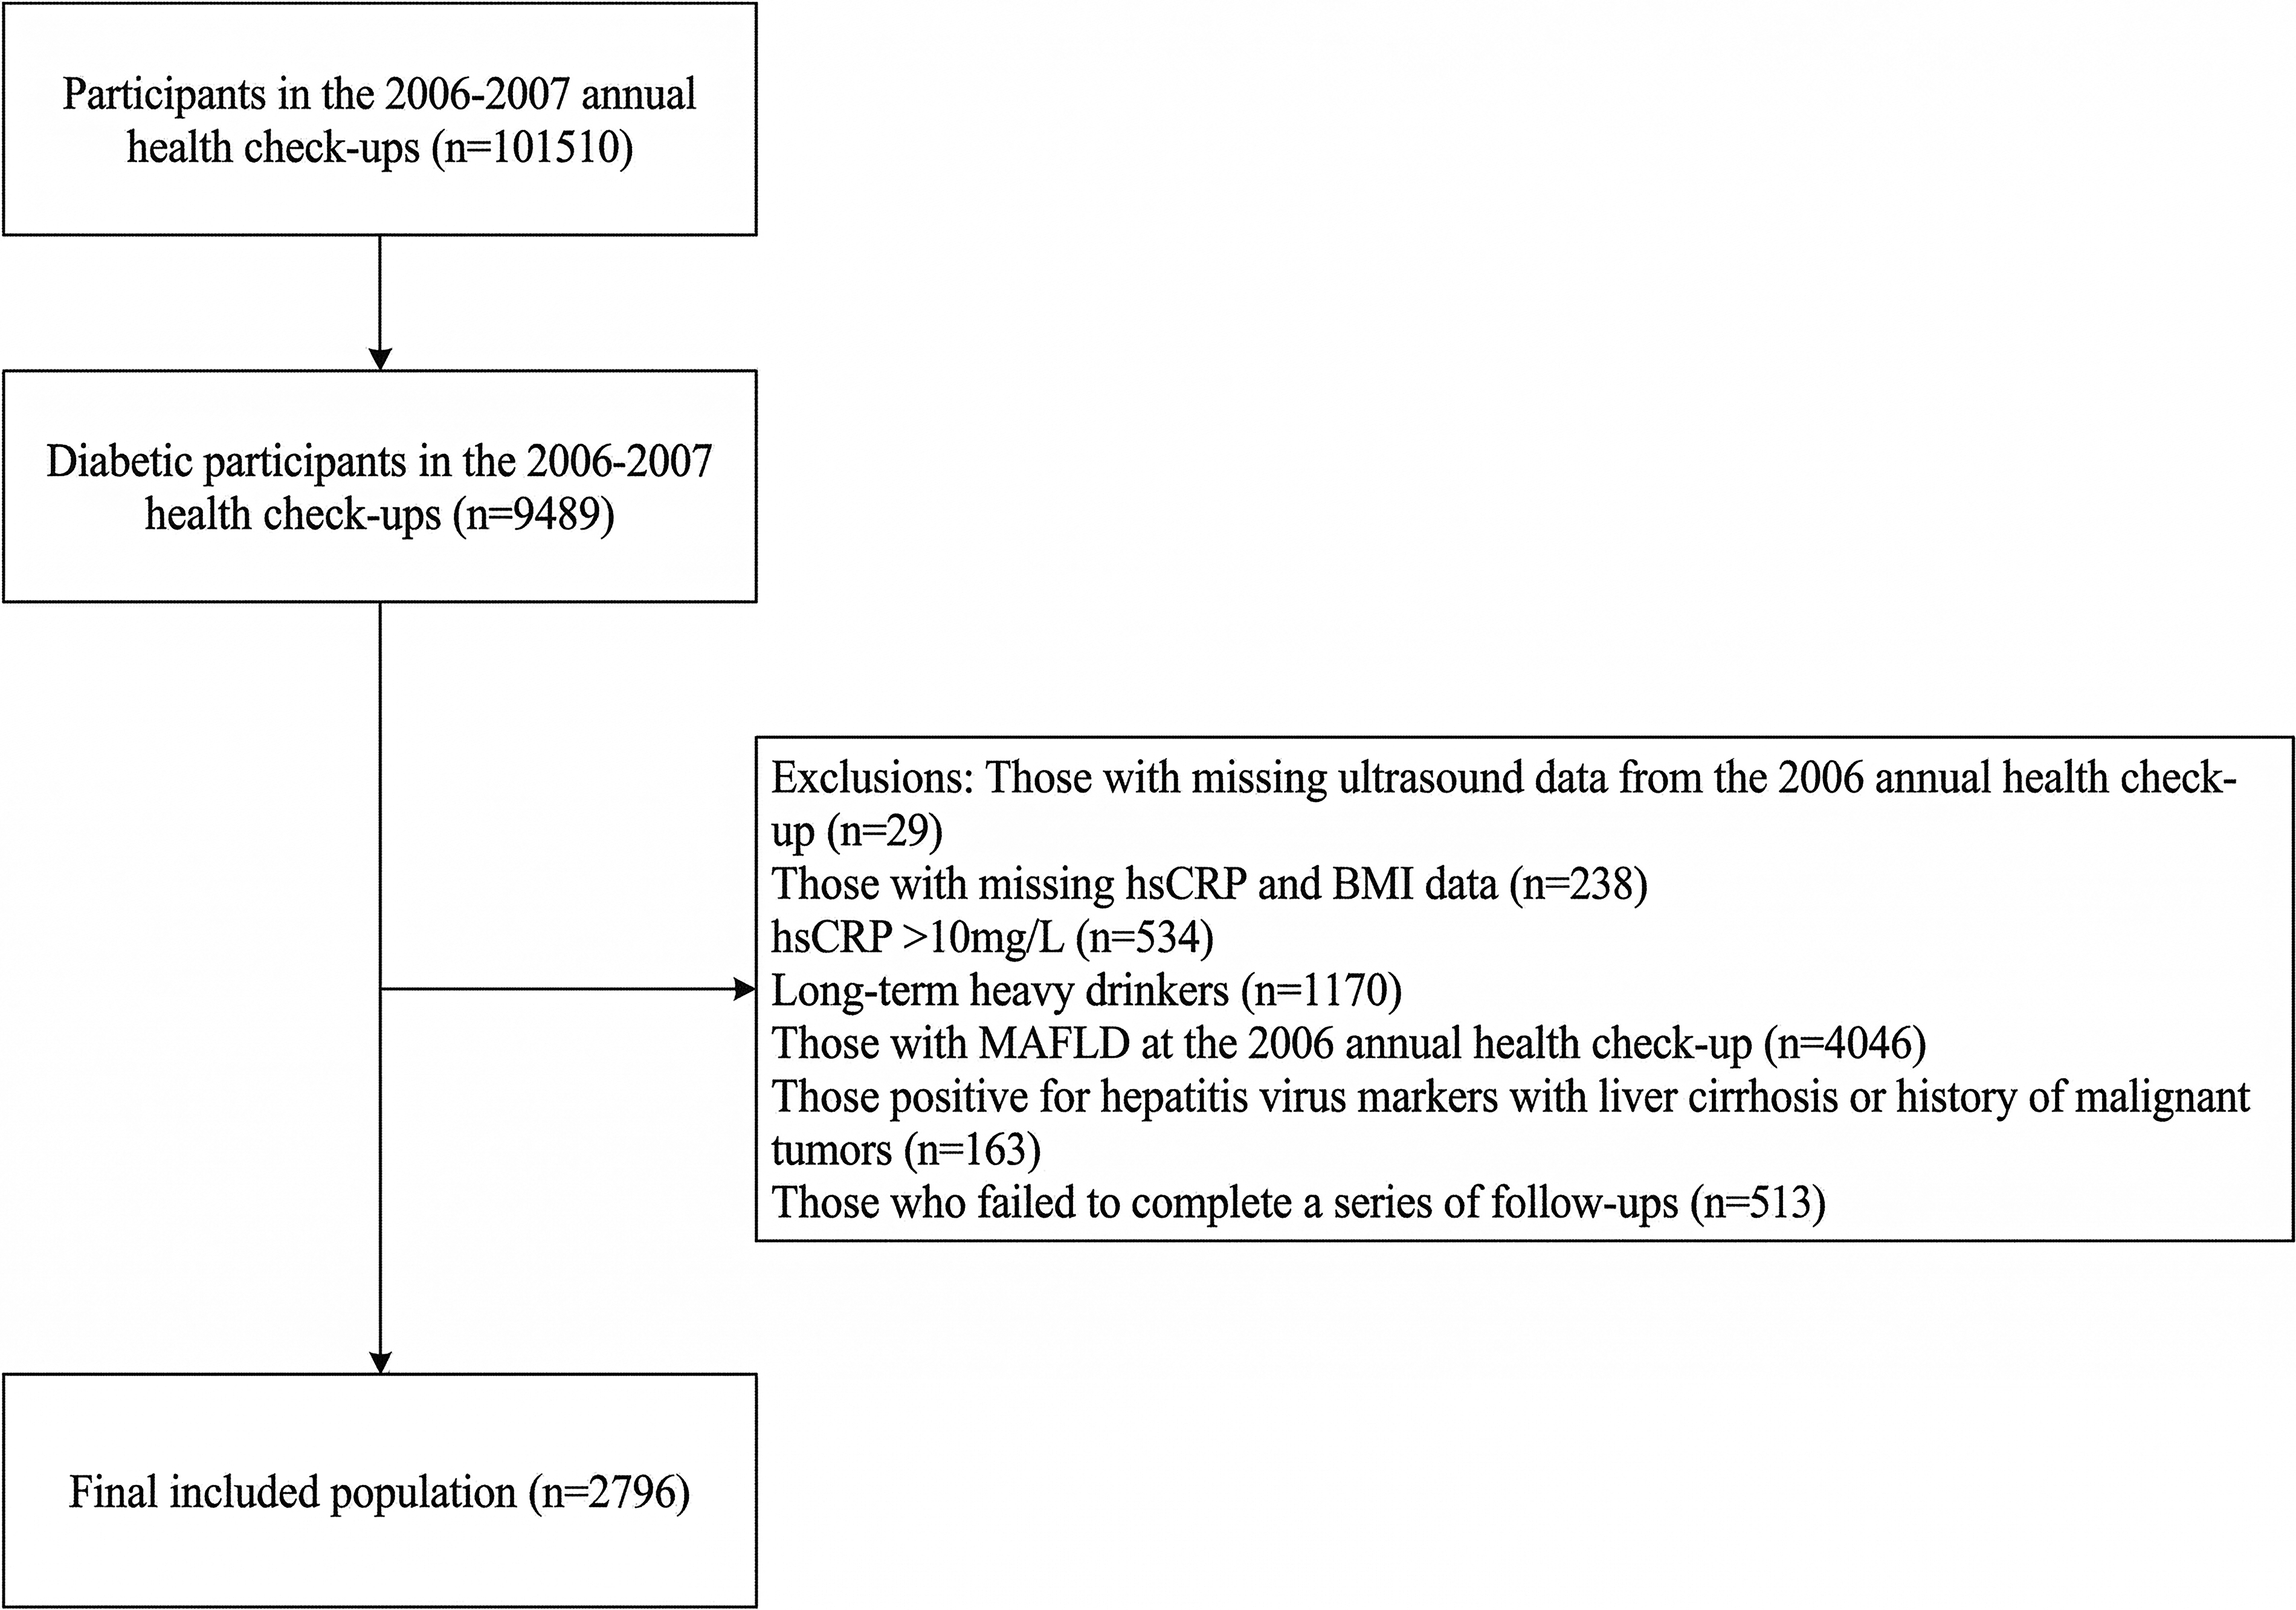
Flowchart of participants. hsCRP, high-sensitivity C-reactive protein.
Data collection
During each visit, anthropometric measurements including height, weight, waist circumference (WC), and blood pressure (BP) were recorded according to a standard protocol. Height and WC were measured to the nearest 0.1 cm and weight to the nearest 0.1 kg. BMI: was calculated as weight (kg) divided by height squared (m2). The waist-to-height ratio was calculated by dividing WC (cm) by height (cm).
Venous blood samples were obtained from the antecubital vein in the morning after an overnight fast and transferred into vacutainers containing ethylenediaminetetraacetic acid. Samples were centrifuged at 3000g for 10 min at room temperature. After separation, serum samples were immediately frozen at –80°C for storage and subsequent laboratory examinations. The level of hsCRP was measured using a commercial high-sensitivity nephelometry assay (Cias Latex CRP-H, Kanto Chemical Co. Inc.), with a detection limit of 0.1 mg/L. In-house intra- and inter-assay coefficients of variation for hsCRP were 6.53% and 4.78%, respectively. All blood variables were measured using an autoanalyzer (Hitachi 747; Hitachi) at the central laboratory of Kailuan Hospital (Tangshan, China). According to baseline hsCRP levels and American Heart Association cardiovascular disease risk cut points, hsCRP <1 mg/L was considered low, 1–3 mg/L moderate, and ≥3 mg/L elevated; hsCRP ≥3 mg/L was considered indicative of chronic inflammation. 22 For the primary joint BMI/hsCRP analysis, hsCRP was dichotomized as <3 versus ≥3 mg/L; an alternative cutoff of >2 mg/L was examined only in sensitivity analyses. For clarity, hsCRP was analyzed primarily as a dichotomous exposure (<3 vs. ≥3 mg/L) across all main analyses (Tables 1–3 and Fig. 2). The AHA categories (<1, 1–3, ≥3 mg/L) were used only for descriptive interpretation of hsCRP levels, and >2 mg/L was examined only as an alternative cutoff in sensitivity analysis (Table 4).

Comparison of cumulative incidence rates among different BMI and hsCRP Groups. Kaplan–Meier curves for incident MASLD stratified by joint BMI (<24 vs. ≥24 kg/m²) and hs-CRP (<3 vs. ≥3 mg/L) categories (log-rank test). BMI, body mass index; MASLD, metabolic dysfunction–associated steatotic liver disease.
Baseline Characteristics Stratified by Different Levels of Body Mass Index and High-Sensitivity C-Reactive Protein
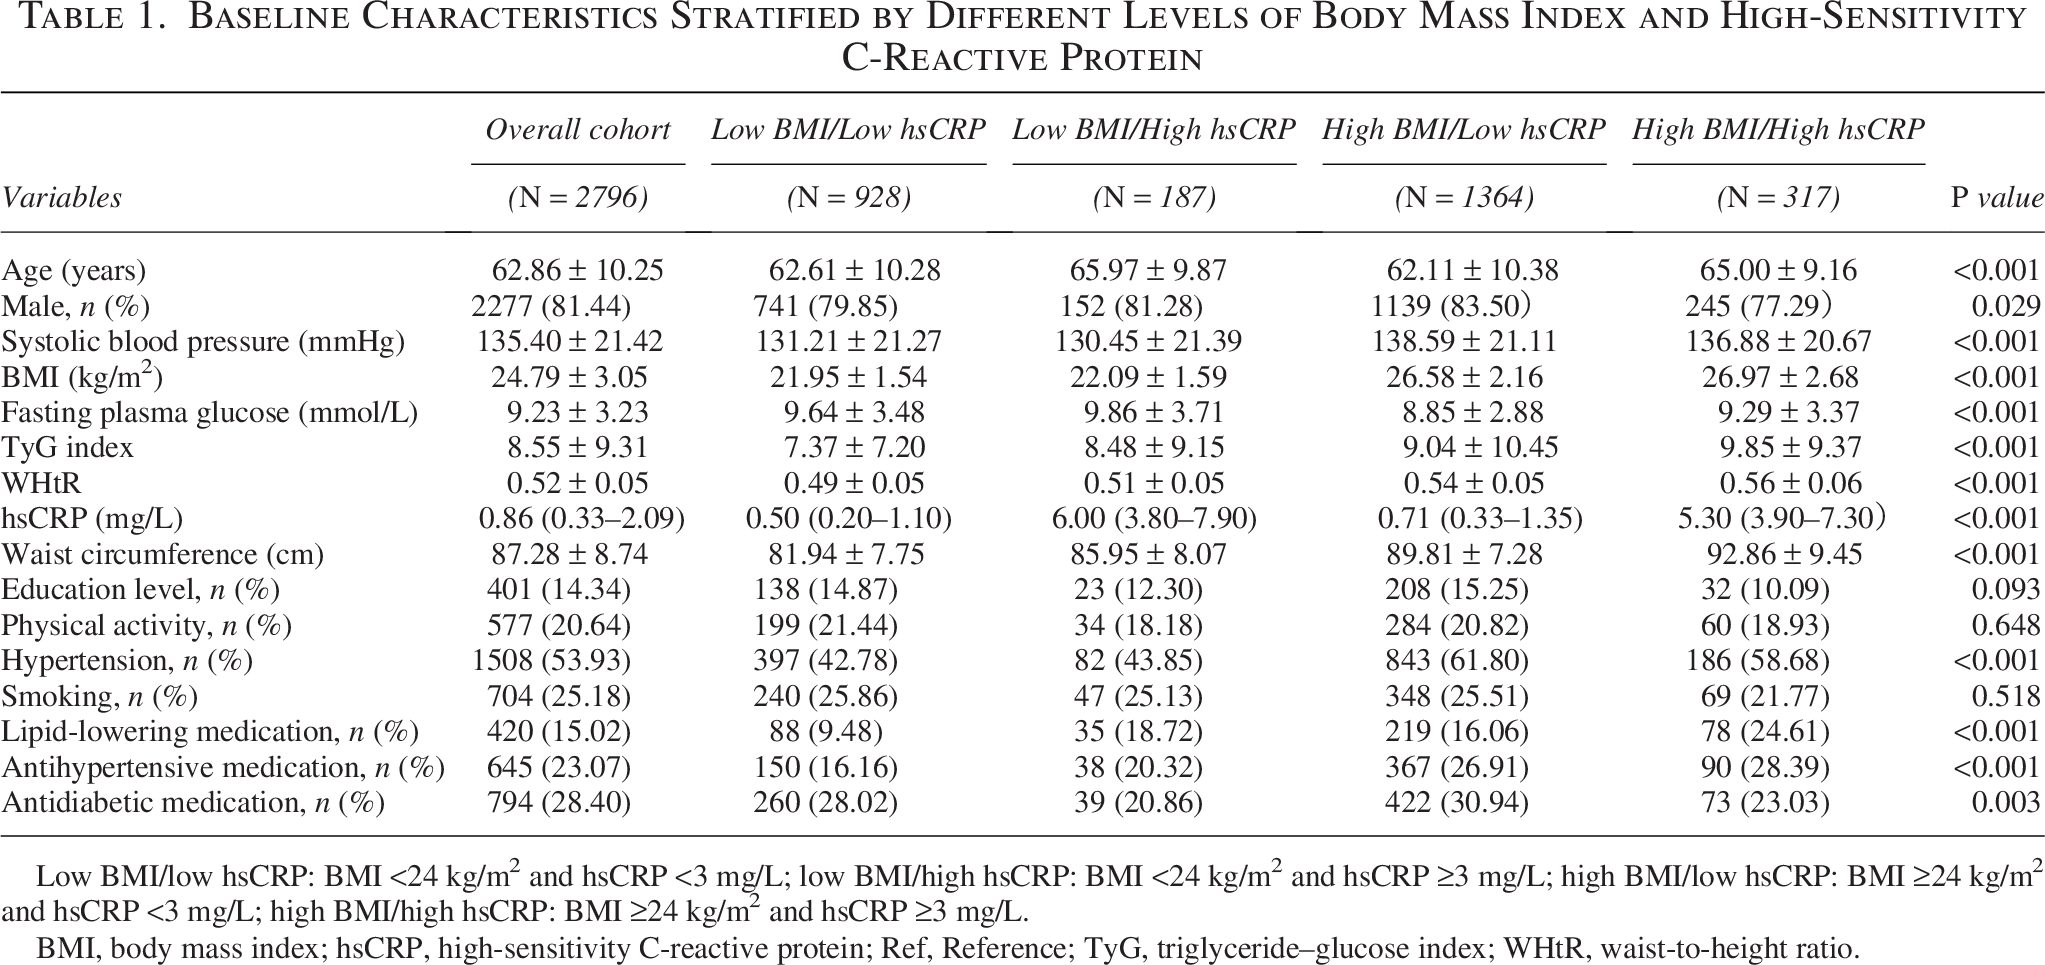
Low BMI/low hsCRP: BMI <24 kg/m² and hsCRP <3 mg/L; low BMI/high hsCRP: BMI <24 kg/m² and hsCRP ≥3 mg/L; high BMI/low hsCRP: BMI ≥24 kg/m² and hsCRP <3 mg/L; high BMI/high hsCRP: BMI ≥24 kg/m² and hsCRP ≥3 mg/L.
BMI, body mass index; hsCRP, high-sensitivity C-reactive protein; Ref, Reference; TyG, triglyceride–glucose index; WHtR, waist-to-height ratio.
Cox Regression Analysis of Body Mass Index and High-Sensitivity C-Reactive Protein in Relation to Incident Metabolic Dysfunction–Associated Steatotic Liver Disease in Individuals with Type 2 Diabetes
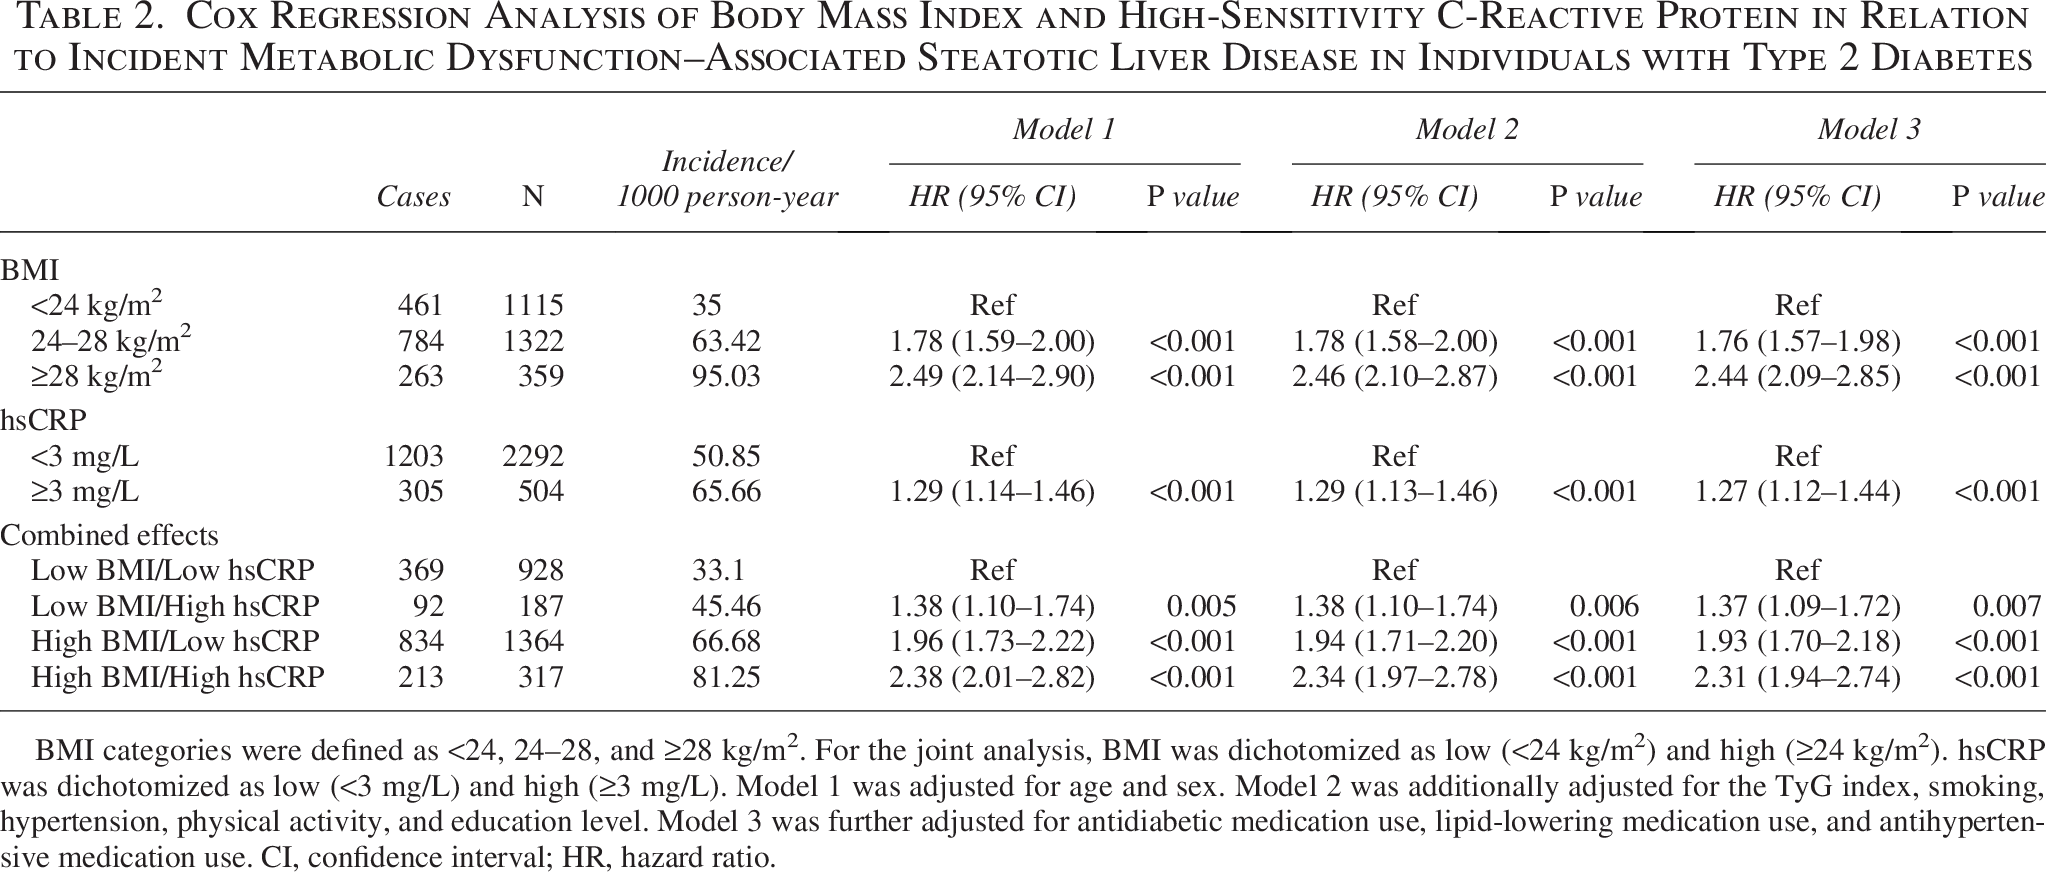
BMI categories were defined as <24, 24–28, and ≥28 kg/m². For the joint analysis, BMI was dichotomized as low (<24 kg/m²) and high (≥24 kg/m²). hsCRP was dichotomized as low (<3 mg/L) and high (≥3 mg/L). Model 1 was adjusted for age and sex. Model 2 was additionally adjusted for the TyG index, smoking, hypertension, physical activity, and education level. Model 3 was further adjusted for antidiabetic medication use, lipid-lowering medication use, and antihypertensive medication use. CI, confidence interval; HR, hazard ratio.
Stratified Analysis of the Cox Regression Model for Body Mass Index Combined with High-Sensitivity C-Reactive Protein in Relation to Incident Metabolic Dysfunction–Associated Steatotic Liver Disease in Individuals with Type 2 Diabetes
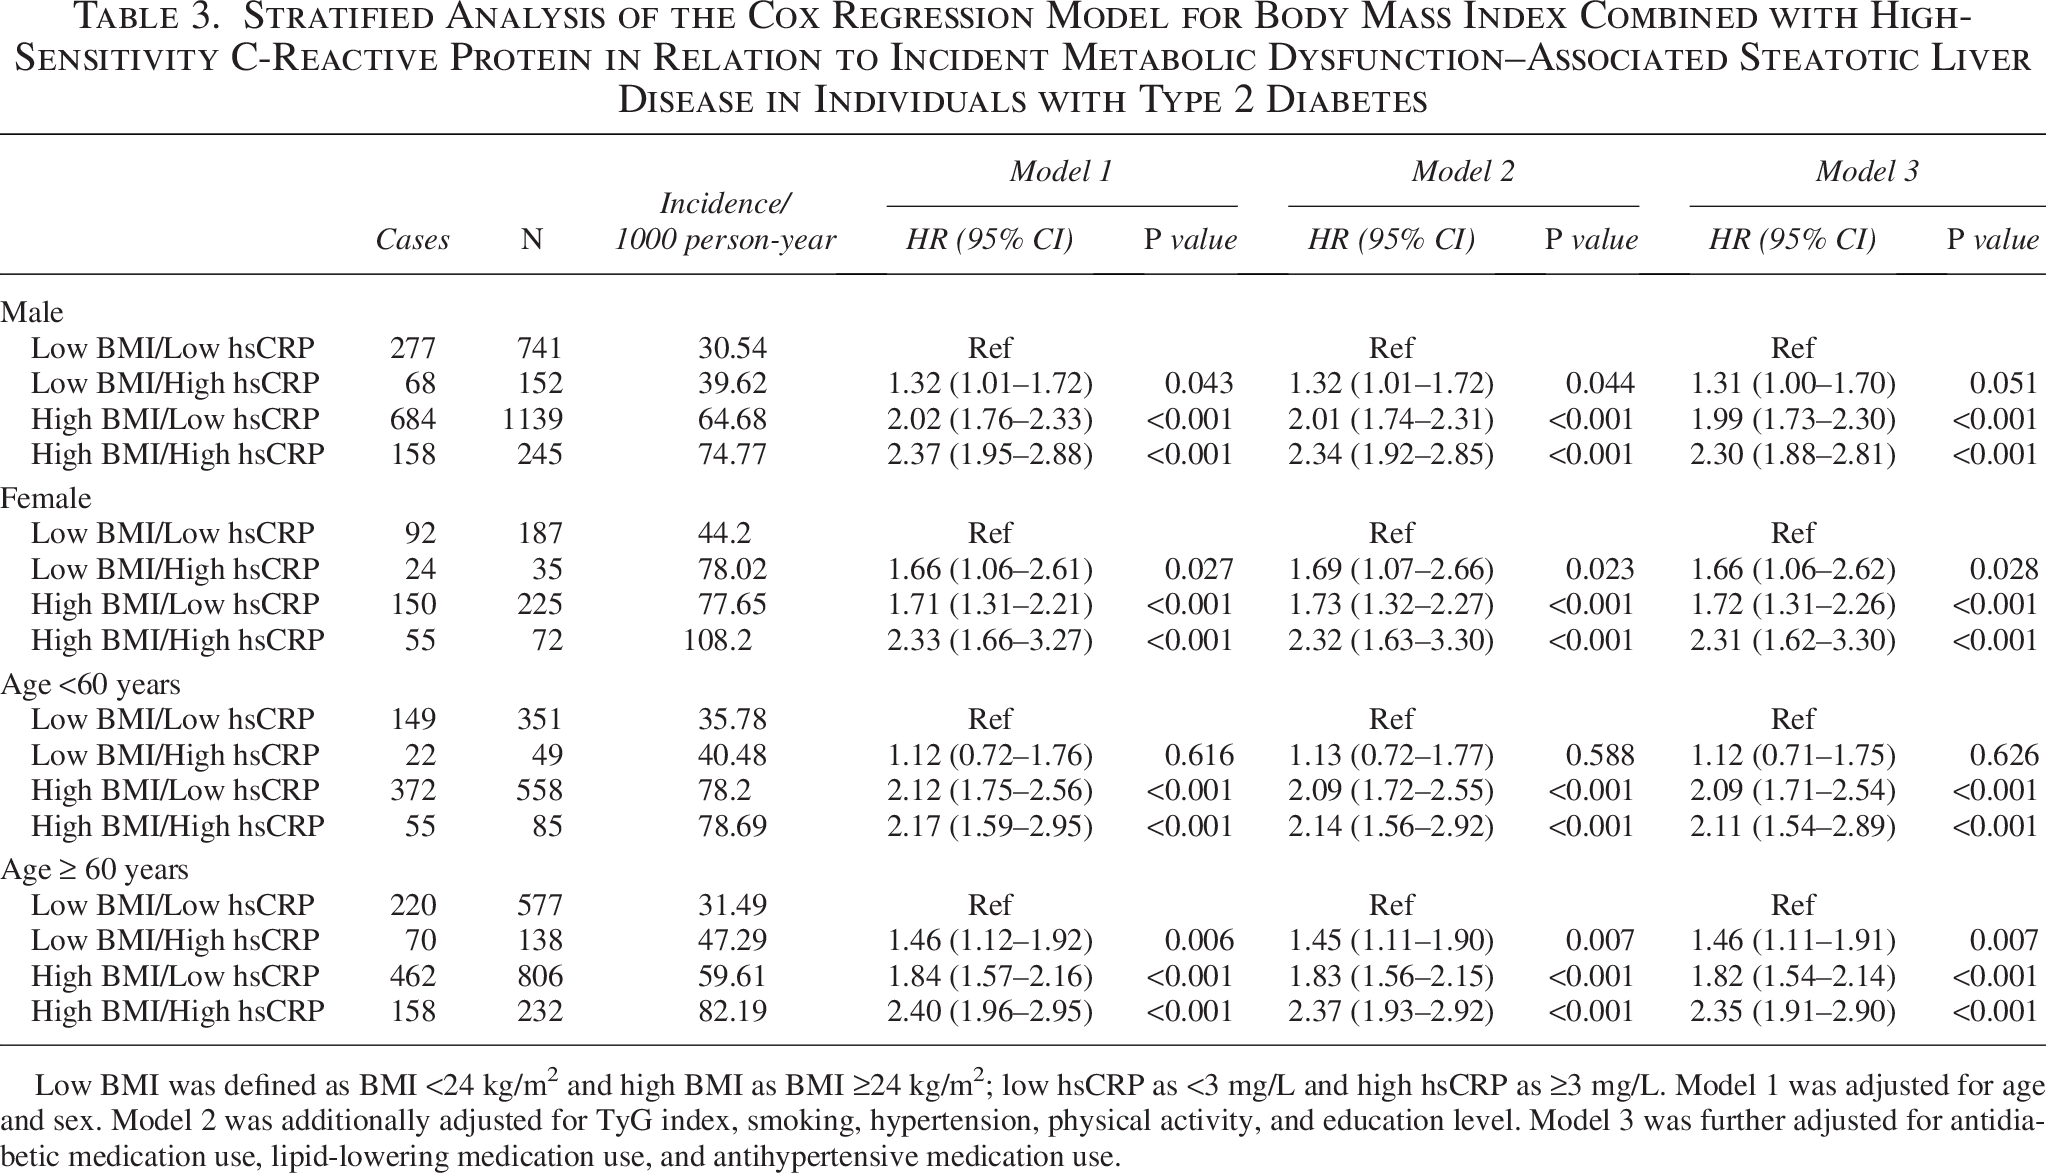
Low BMI was defined as BMI <24 kg/m² and high BMI as BMI ≥24 kg/m²; low hsCRP as <3 mg/L and high hsCRP as ≥3 mg/L. Model 1 was adjusted for age and sex. Model 2 was additionally adjusted for TyG index, smoking, hypertension, physical activity, and education level. Model 3 was further adjusted for antidiabetic medication use, lipid-lowering medication use, and antihypertensive medication use.
Sensitivity Analysis of the Cox Regression Model for Body Mass Index Combined with High-Sensitivity C-Reactive Protein in Relation to Incident Metabolic Dysfunction–Associated Steatotic Liver Disease in Individuals with Type 2 Diabetes
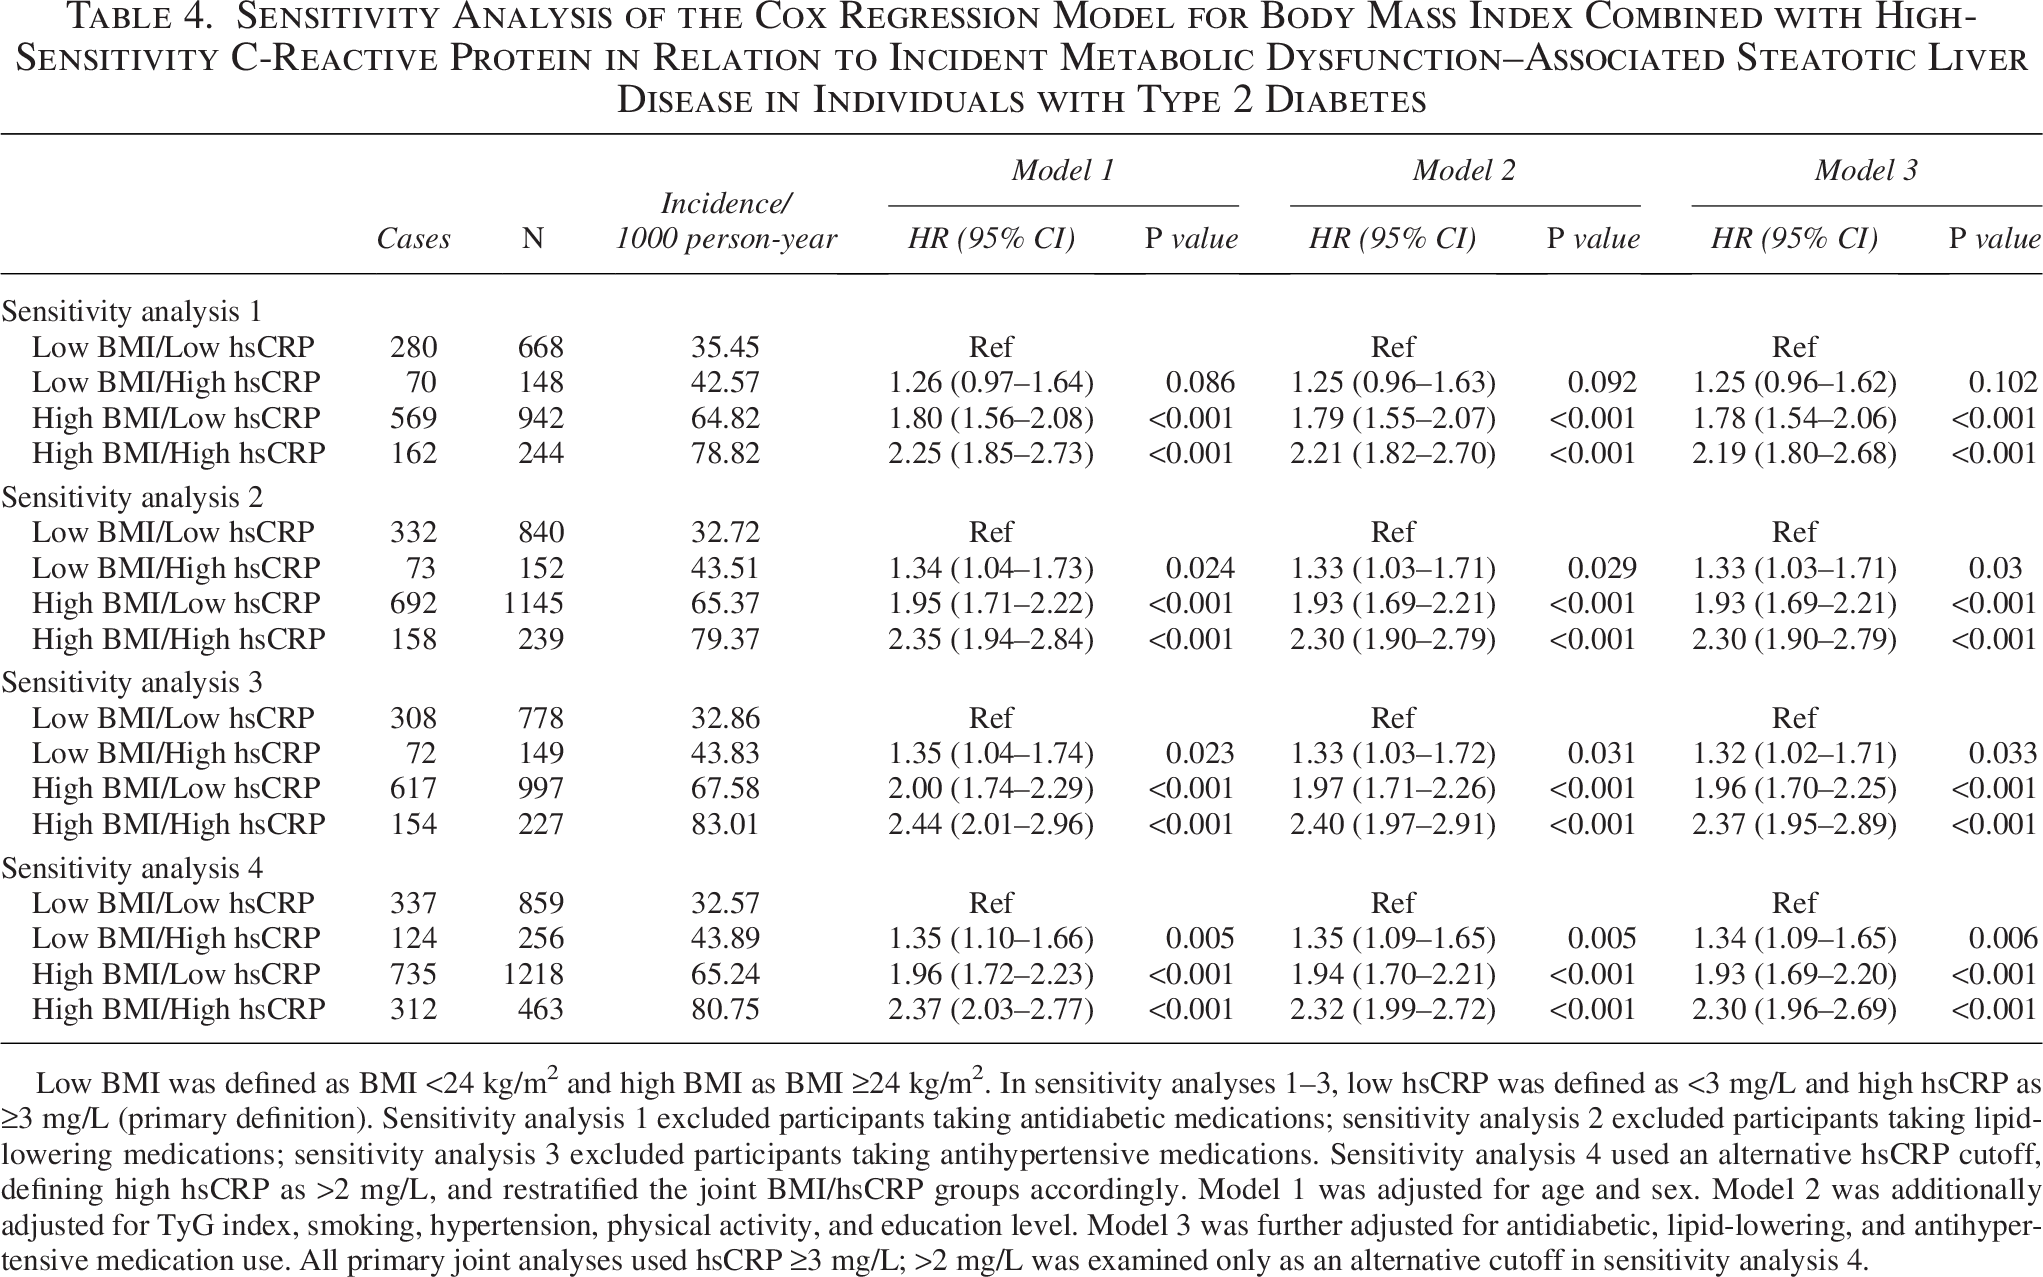
Low BMI was defined as BMI <24 kg/m² and high BMI as BMI ≥24 kg/m². In sensitivity analyses 1–3, low hsCRP was defined as <3 mg/L and high hsCRP as ≥3 mg/L (primary definition). Sensitivity analysis 1 excluded participants taking antidiabetic medications; sensitivity analysis 2 excluded participants taking lipid-lowering medications; sensitivity analysis 3 excluded participants taking antihypertensive medications. Sensitivity analysis 4 used an alternative hsCRP cutoff, defining high hsCRP as >2 mg/L, and restratified the joint BMI/hsCRP groups accordingly. Model 1 was adjusted for age and sex. Model 2 was additionally adjusted for TyG index, smoking, hypertension, physical activity, and education level. Model 3 was further adjusted for antidiabetic, lipid-lowering, and antihypertensive medication use. All primary joint analyses used hsCRP ≥3 mg/L; >2 mg/L was examined only as an alternative cutoff in sensitivity analysis 4.
Because serum insulin levels were not collected at baseline, insulin resistance could not be evaluated using the homeostasis model assessment of insulin resistance (HOMA-IR). Instead, insulin sensitivity was assessed using the triglyceride–glucose (TyG) index, calculated as ln{[fasting triglyceride (mg/dL) × fasting blood glucose (mg/dL)]/2}.
Ascertainment of incident MASLD
Follow-up started at the baseline examination (2006–2007) and ended at the date of incident MASLD diagnosis, all-cause death, loss to follow-up, or December 31, 2020, whichever came first.
Abdominal ultrasonography was performed at baseline and at each biennial follow-up by experienced radiologists who were blinded to clinical data. Fatty liver was diagnosed if at least two of the following three features were present: (1) diffusely increased near-field echogenicity of the liver parenchyma with echo intensity stronger than that of the kidney, (2) unclear display of intrahepatic vessels and bile duct structures, and (3) gradual attenuation of far-field ultrasound echo. 23 Incident MASLD was defined as new-onset fatty liver on ultrasonography during follow-up in participants free of fatty liver at baseline. According to the 2020 international expert consensus, MAFLD, now encompassed within MASLD, is diagnosed by the presence of fatty liver plus at least one of the following: overweight/obesity, T2D, or ≥2 metabolic risk abnormalities. 10 Because all study participants had T2D, the presence of ultrasonographic steatosis fulfilled the metabolic criterion for MASLD.
Other covariates
Smoking status was dichotomized as current smoker (≥1 cigarette/week for >1 year) versus never/former smoker. Physical activity was classified as active (exercise ≥3 times/week and ≥30 min/session) versus inactive. Education level was categorized as ≥high school versus <high school based on self-reported data at baseline (2006–2007). Hypertension was defined as systolic BP ≥140 mmHg, diastolic BP ≥90 mmHg, self-reported physician-diagnosed hypertension, or use of antihypertensive medication. Use of glucose-lowering, lipid-lowering, and antihypertensive medications was ascertained from standardized questionnaires at baseline and treated as binary variables (yes/no).
Statistical analysis
For the primary joint analysis, participants were classified a priori into four BMI/hsCRP categories using baseline BMI: (<24 vs. ≥24 kg/m2) and hsCRP (<3 vs. ≥3 mg/L): (1) low BMI/low hsCRP (BMI: <24 kg/m2 and hsCRP <3 mg/L); (2) low BMI/high hsCRP (BMI: <24 kg/m2 and hsCRP ≥3 mg/L); (3) high BMI/low hsCRP (BMI: ≥24 kg/m2 and hsCRP <3 mg/L); and (4) high BMI/high hsCRP (BMI: ≥24 kg/m2 and hsCRP ≥3 mg/L). These four joint categories were used consistently throughout all analyses (baseline comparisons, incidence estimation, Kaplan–Meier curves, Cox models, subgroup analyses, and sensitivity analyses), with the low BMI/low hsCRP group as the reference.
Baseline characteristics were compared across the four BMI/hsCRP joint groups using one-way analysis of variance or Kruskal–Wallis tests for continuous variables [mean ± standard deviation or median (interquartile range or IQR), as appropriate] and chi-squared tests for categorical variables, n (%). Missing covariate data were handled using multiple imputation; specifically, we used multiple imputation by chained equations to create 157 imputed datasets, including all exposures, covariates, and the outcome indicator, and combined estimates across datasets using Rubin’s rules.
Person-years were calculated from baseline until incident MASLD, death, loss to follow-up, or December 31, 2020, whichever came first. Incidence rates were reported per 1000 person-years. Kaplan–Meier curves were used to estimate cumulative incidence, with differences tested using log-rank tests.
Multivariable Cox proportional hazards models were used to estimate HRs and 95% confidence intervals (95% CIs) for the associations between BMI/hsCRP joint categories and incident MASLD. For joint analyses, HRs were estimated across the four predefined BMI/hsCRP joint categories, with the low BMI/low hsCRP group as the reference. Models were adjusted for age (continuous), sex, TyG index (continuous), smoking (current vs. never/former), physical activity (active vs. inactive), hypertension (yes vs. no), education level (≥high school vs. <high school), and use of glucose-lowering, lipid-lowering, and antihypertensive medications (yes vs. no). Subgroup analyses were performed by sex and age (<60 vs. ≥60 years). To assess the robustness of our findings, we conducted sensitivity analyses by separately excluding (1) exclusion of baseline glucose-lowering medication users, (2) exclusion of lipid-lowering medication users, (3) exclusion of antihypertensive medication users, and (4) reclassifying elevated hsCRP using >2 mg/L as an alternative cutoff (sensitivity analysis), recreating the four joint BMI/hsCRP groups, and repeating the fully adjusted Cox models. All tests were two sided, with P < 0.05 considered statistically significant. Analyses were performed using SAS version 9.4 (SAS Institute, Cary, NC, USA).
Results
Baseline characteristics of the study participants
Among the 2796 participants included in the analysis, 2277 (81.4%) were men and 519 (18.6%) were women. The mean age was 62.86 ± 10.25 years, the mean BMI: was 24.79 ± 3.05 kg/m2, and the median hsCRP was 0.86 mg/L (IQR = 0.33–2.09). The baseline characteristics of participants, stratified by BMI: categories and hsCRP levels, are presented in Table 1.
Incidence and risk of MASLD across BMI and hsCRP categories
As detailed in Table 2, the incidence of MASLD increased across BMI: categories, from 35.00 per 1000 person-years in participants with BMI: <24 kg/m2 to 63.42 and 95.03 per 1000 person-years in those with BMI: 24–28 kg/m2 and ≥28 kg/m2, respectively. In the fully adjusted model, the HRs were 1.76 (95% CI: 1.57–1.98; P < 0.001) and 2.44 (95% CI: 2.09–2.85; P < 0.001), respectively, compared with the BMI: <24 kg/m2 reference group. Across hsCRP categories (<3 vs. ≥3 mg/L, Table 2), the incidence rate was 50.85 per 1000 person-years for hsCRP <3 mg/L and 65.66 per 1000 person-years for hsCRP ≥3 mg/L. In the fully adjusted model, hsCRP ≥3 mg/L was associated with a higher risk of incident MASLD (HR: = 1.27; 95% CI: 1.12–1.44; P < 0.001) compared with hsCRP <3 mg/L.
For the joint BMI: and hsCRP categories (low BMI: <24 kg/m2; high BMI: ≥24 kg/m2; low hsCRP: <3 mg/L; high hsCRP: ≥3 mg/L), the incidence was 33.10 per 1000 person-years in the low BMI/low hsCRP group and 81.25 per 1000 person-years in the high BMI/high hsCRP group. The fully adjusted HRs were 1.37 (95% CI: 1.09–1.72; P = 0.007) for low BMI/high hsCRP, 1.93 (95% CI: 1.70–2.18; P < 0.001) for high BMI/low hsCRP, and 2.31 (95% CI: 1.94–2.74; P <0.001) for high BMI/high hsCRP compared with low BMI/low hsCRP.
Sex- and age-stratified associations of combined BMI: and hsCRP with MASLD risk
As shown in Table 3, the MASLD incidence in the high BMI/high hsCRP group was 74.77 per 1000 person-years in men and 108.20 per 1000 person-years in women. The fully adjusted HRs were 2.30 (95% CI: 1.88–2.81; P < 0.001) in men and 2.31 (95% CI: 1.62–3.30; P < 0.001) in women compared with the low BMI/low hsCRP reference group.
In age-stratified analyses, the HRs for high BMI: (irrespective of hsCRP status) were approximately 2.0 in both the <60-year and ≥60-year groups. The HR: for low BMI/high hsCRP was 1.46 (95% CI: 1.11–1.91; P = 0.007) in the ≥60-year group.
Sensitivity analyses
As summarized in Table 4, the associations between joint BMI/hsCRP categories and MASLD risk were consistent across sensitivity analyses. In analyses 1–3, excluding participants using glucose-lowering (n = 794), lipid-lowering (n = 420), or antihypertensive medications (n = 645), respectively, the incidence ranged from 32.6–35.5 per 1000 person-years in the low BMI/low hsCRP group to 78.8–83.0 per 1000 person-years in the high BMI/high hsCRP group. Fully adjusted HRs were 1.8–2.0 for high BMI/low hsCRP and 2.2–2.4 for high BMI/high hsCRP (all P < 0.001). The HR: for low BMI/high hsCRP was 1.25 (95% CI: 0.96–1.62; P = 0.098) in analysis 1 and 1.32–1.33 (P < 0.05) in analyses 2 and 3.
In analysis 4, with high hsCRP redefined as >2 mg/L, the HRs were 1.34 for low BMI/high hsCRP, 1.93 for high BMI/low hsCRP, and 2.30 for high BMI/high hsCRP (all P < 0.001).
Cumulative incidence of MASLD by joint BMI/hsCRP categories
As illustrated in Figure 2, the cumulative incidence of MASLD increased over time across all joint BMI/hsCRP categories. Divergence among the curves emerged within approximately 3 years and persisted throughout the 14-year follow-up, with cumulative incidences of approximately 40% in the low BMI/low hsCRP group and 65% in the high BMI/high hsCRP group at the end of follow-up.
Discussion
This 14-year prospective cohort study of 2796 patients with T2D without baseline MASLD demonstrated that elevated BMI: and hsCRP independently and jointly predict incident MASLD. These findings underscore the compounded risk conferred by excess adiposity and systemic inflammation and identify a high-risk subgroup that may warrant intensified preventive strategies in T2D management.
The observed dose-dependent associations of BMI: and hsCRP with incident MASLD align with the concept that these markers capture interconnected metabolic and inflammatory pathways in T2D. For BMI, each category increment corresponded to a 76%–144% higher adjusted HR, consistent with mechanisms whereby excess adiposity increases hepatic lipid accumulation via enhanced free fatty acid flux and de novo lipogenesis in the insulin-resistant milieu of T2D. 24 Similarly, hsCRP ≥3 mg/L (vs. <3 mg/L) was associated with a 27% higher risk of incident MASLD, supporting the role of chronic low-grade inflammation in amplifying metabolic dysregulation and hepatocellular injury.25,26 Jointly, the high BMI/high hsCRP group exhibited the highest risk compared with the low BMI/low hsCRP reference group in comparative analyses. Although the combined HR: was higher than that observed for isolated high BMI: or isolated high hsCRP, we did not formally test statistical interaction on additive or multiplicative scales (e.g., interaction terms in the Cox model or indices such as relative excess risk due to interaction]; therefore, our interpretation is based on comparative HRs rather than formal interaction testing. Biologically, this pattern remains compatible with the interplay between adiposity and inflammation, whereby obesity-related inflammatory signaling may amplify insulin resistance and hepatic steatosis in T2D.24,26 The similar HRs observed in men and women further suggest that this combined burden may be relevant across sexes in this cohort. 27 In addition, our findings complement emerging data showing that hsCRP levels help characterize metabolic liver disease phenotypes, including MASLD and metabolic and alcohol-associated liver disease (MetALD), and relate to disease severity. 28 Furthermore, the early divergence in cumulative incidence curves suggests that these factors may influence MASLD development relatively early and persistently over time.
Our findings extend and refine prior literature on MASLD risk factors in T2D. Consistent with global epidemiological data,2,29 which report a very high burden of MASLD and nonalcoholic fatty liver disease (NAFLD) in individuals with T2D, the approximately 50% 14-year cumulative incidence observed in our cohort highlights the progressive nature of MASLD in this high-risk population. The BMI–MASLD association corroborates large-scale burden studies,30,31 in which higher BMI: confers a 2- to 3-fold increased risk of steatotic liver disease, whereas our T2D-specific HRs (1.76–2.44) emphasize the amplified susceptibility conferred by the shared insulin-resistant milieu. 12 For hsCRP, our findings are consistent with cohorts and meta-analyses showing that inflammatory markers predict MASLD progression and cardiometabolic events in high-risk populations32–34 and with evidence linking higher hsCRP to more severe MASLD and related phenotypes such as MetALD.26,28 The joint BMI–hsCRP effect observed in our study is also in line with evidence that obesity-related inflammation accelerates hepatic fibrogenesis.35,36 Our demonstration of a strong joint effect in a large Asian T2D cohort complements Western-focused meta-analyses37,38 and suggests that ethnic differences in adiposity distribution and metabolic risk profiles may partly account for variation in risk estimates across studies. Methodologically, the use of ultrasonography-based MASLD ascertainment aligned with current consensus definitions, 10 together with adjustment for the TyG index as a surrogate of insulin resistance, improves on earlier studies that relied on indirect exposure measures. These features position our work as a bridge between epidemiological observations and mechanistic frameworks that view MASLD as a multisystem metabolic disease.11,39 Given the predominantly male Chinese T2D cohort (81.4% men), the BMI: threshold used in the joint analysis (<24 vs. ≥24 kg/m2) should be considered cohort- and ethnicity-specific and warrants validation in other ethnic and geographic populations, particularly Western populations with different body composition and visceral adiposity patterns.
Potential limitations merit consideration. Ultrasonography, while practical and widely available for large-scale cohorts, has lower sensitivity for mild steatosis than magnetic resonance imaging–based techniques or liver biopsy, which may have led to under-ascertainment of early or mild MASLD and thus an underestimation of the absolute incidence; however, its specificity and use in guideline-based diagnostic algorithms in China mitigate misclassification, and biennial assessments reduce the likelihood of systematic detection bias. 23 Importantly, if missed detection of mild steatosis was largely nondifferential with respect to baseline BMI: and hsCRP, such outcome misclassification would be expected to bias the observed associations toward the null, meaning our HRs may be conservative estimates. The absence of direct insulin measurements precluded calculation of the HOMA-IR, but adjustment for the TyG index likely captured a substantial proportion of underlying insulin resistance. Generalizability may be limited to Chinese adults with T2D, given ethnic variation in MASLD susceptibility and adiposity patterns,40,41 although the direction and magnitude of our associations are broadly consistent with international data. Accordingly, the BMI: cutoff (<24 vs. ≥24 kg/m2) should not be extrapolated as a universal threshold because differences in body composition and fat distribution, especially visceral adiposity, may shift metabolic risk at a given BMI: in Western populations. Residual confounding from unmeasured factors such as diet, genetic variants, or gut microbiota cannot be excluded, but we adjusted for a wide range of demographic, lifestyle, and clinical variables, including major cardiometabolic medications. Strengths of this study include the large sample size, long follow-up, repeated ultrasonographic assessments, and extensive sensitivity analyses, all of which reinforce the robustness and clinical relevance of our findings.
In conclusion, higher BMI: and hsCRP are each associated with an increased risk of MASLD in patients with T2D, and concurrent elevations in both markers identify a subgroup with particularly high risk. Incorporating both adiposity and inflammatory markers into MASLD risk stratification may improve identification of individuals at the highest risk and help prioritize intensified lifestyle and pharmacologic interventions. Future prospective studies and interventional trials should clarify the joint contributions of adiposity and systemic inflammation and evaluate whether combined weight-loss and anti-inflammatory strategies can effectively reduce MASLD incidence and progression in T2D.
Authors’ Contributions
C.J. and Q.X. were responsible for the study conception and article drafting. X.L. and J.W. performed the literature search, screened the abstracts, and reviewed the articles. K.L. and H.L. critically reviewed and revised the article. All authors read and approved the final article.
Footnotes
Data Availability
The datasets used and/or analyzed during the current study are available from the corresponding author upon reasonable request.
Ethics Approval and Consent to Participate
The study was conducted in accordance with the Declaration of Helsinki and was approved by the Ethics Committee of Kailuan General Hospital (approval number: 2006-05). All participants agreed to take part in the study and provided written informed consent prior to enrollment.
Author Disclosure Statement
No competing financial interests exist.
Funding Information
This study received no funding.