
Abstract
Purpose:
Metabolic syndrome (MetS) is a growing public health problem characterized by clustering of cardiometabolic risk factors and a chronic low-grade inflammatory state. Biomarkers such as Fetuin-A, YKL-40, and high-sensitivity C-reactive protein (hsCRP) have been implicated in insulin resistance, obesity, and atherosclerosis. Identifying accessible and cost-effective biomarkers that reflect the presence and severity of MetS may provide clinically relevant insight into metabolic burden. Therefore, this study aimed to evaluate whether inflammatory biomarkers are associated with the presence and dynamic severity of MetS.
Methods:
Forty-seven patients diagnosed with MetS according to National Cholesterol Education Program Adult Treatment Panel III criteria (≥3 components) and 23 healthy controls were included. Serum hsCRP, Fetuin-A, and YKL-40 levels were measured at baseline and after a 3-month follow-up. No pharmacological treatment was initiated; participants received standardized lifestyle modification advice. Associations between biomarker levels and MetS severity scores (range 3–5) were assessed using correlation analyses.
Results:
Baseline serum Fetuin-A, YKL-40, and hsCRP levels were significantly higher in patients with MetS compared to controls (all P < 0.001). During follow-up, changes in MetS severity were positively correlated with changes in hsCRP (r = 0.844, P < 0.001), Fetuin-A (r = 0.918, P < 0.001), and YKL-40 (r = 0.913, P < 0.001). Sensitivity analysis using Kendall’s tau-b confirmed robust monotonic associations (τ = 0.716–0.808, all P < 0.001).
Conclusion:
Fetuin-A and YKL-40 levels are strongly associated with both the presence and short-term changes in MetS severity. hsCRP appears to reflect longitudinal changes in metabolic burden. These findings suggest that selected inflammatory biomarkers may provide additional insight into the inflammatory and metabolic dynamics of MetS.
Introduction
Metabolic syndrome (MetS) is increasingly recognized as a global epidemic and is characterized by a constellation of metabolic abnormalities, including insulin resistance, abdominal obesity, dyslipidemia, and elevated blood pressure, accompanied by chronic inflammation of low grade. This clustered metabolic state substantially increases the likelihood of developing type 2 diabetes and markedly elevates long-term cardiovascular risk.1,2
High-sensitivity C-reactive protein (hsCRP) is an established marker of low-grade systemic inflammation and has been associated with MetS across various populations, including elderly cohorts. 3 However, most available studies rely on single-time-point hsCRP measurements, and recent large-scale analyses suggest that longitudinal changes in hsCRP may better reflect chronic inflammatory burden than baseline values alone. 4 The extent to which dynamic hsCRP variation parallels changes in MetS severity remains insufficiently understood, underscoring the need to evaluate whether shifts in hsCRP levels correspond to alterations in metabolic risk among individuals with newly diagnosed MetS.
Fetuin-A (also known as α2-HS-glycoprotein) has increasingly been recognized as a hepatokine involved in the metabolic disturbances underlying MetS. As highlighted in recent meta-analytic evidence, elevated circulating Fetuin-A levels are consistently associated with insulin resistance, dyslipidemia, and the presence of MetS, although the magnitude of these associations varies across populations. 2 Beyond its metabolic effects, Fetuin-A has been linked to early atherosclerotic changes and an increased risk of type 2 diabetes and cardiovascular events, independent of traditional risk factors. 5 Proposed mechanisms include impaired insulin receptor signaling, adipocyte dysfunction, and lipid accumulation, suggesting that Fetuin-A may contribute both to the development of MetS and its cardiometabolic complications. Nevertheless, the available literature remains heterogeneous, and the precise role of Fetuin-A in MetS pathophysiology is still not fully delineated.2,5
YKL-40 (chitinase-3-like-1) is an inflammatory glycoprotein released mainly from activated macrophages, neutrophils, and vascular smooth muscle cells, with adipose tissue representing an important source of its circulating levels. As a marker of low-grade inflammation, YKL-40 has been linked to metabolic disturbances, particularly insulin resistance, although findings across studies remain inconsistent. Evidence exploring its association with MetS is still limited, and current data do not clearly establish whether YKL-40 reflects an independent metabolic abnormality or primarily mirrors obesity-related inflammation. 6
Despite growing interest in inflammatory markers, data assessing whether Fetuin-A, YKL-40, and hsCRP can reflect both the presence and the dynamic severity of MetS remain limited. In particular, the relationship between temporal changes in these biomarkers and changes in metabolic risk has not been adequately investigated.
We hypothesized that serum Fetuin-A, YKL-40, and hsCRP levels would be higher in individuals with MetS and that changes in these biomarkers over time would parallel changes in MetS severity.
Material and Methods
Ethical approval
This study was conducted in accordance with the principles of the Declaration of Helsinki and was approved by the institutional clinical research ethics committee (approval date: 12/05/2017, Protocol no: 2017/1151, Decision no: 02). All participants provided written informed consent before enrollment.
Study population and sample selection
A total of 47 individuals diagnosed with MetS and 23 healthy controls were included. Participants were recruited from two general internal medicine outpatient clinics within the same geographical region. MetS diagnosis was established according to the National Cholesterol Education Program Adult Treatment Panel III (NCEP-ATP III) criteria, which require the presence of at least three of the following conditions: increased waist circumference (≥102 cm in men or ≥88 cm in women), elevated triglycerides (≥150 mg/dL), reduced high-density lipoprotein cholesterol (HDL-C) (<40 mg/dL in men or <50 mg/dL in women), elevated blood pressure (≥130/85 mmHg), or impaired fasting glucose (≥100 mg/dL). 7 Adults aged 18 years and older who fulfilled at least three of these components were included in the MetS group, whereas the control group consisted of individuals who did not meet the diagnostic criteria for MetS and had no known inflammatory, metabolic, or cardiovascular disease.
Participants were excluded if they had an active infection, a chronic inflammatory or autoimmune disorder, known cardiovascular disease, recent surgery within the previous 3 months, hospitalization in the previous 2 months, pregnancy, or lactation. These conditions were excluded to avoid confounding inflammatory or metabolic influences. All individuals in the MetS group were re-evaluated after a 3-month follow-up period during which no pharmacological treatment changes were made; instead, patients received standardized lifestyle modification counseling only to ensure that changes in metabolic parameters reflected natural disease progression rather than treatment effects. MetS severity was quantified using a simple score ranging from 3 to 5, corresponding to the number of NCEP-ATP III criteria fulfilled by each participant (one point per criterion).
Data collection
Demographic characteristics (age and sex), anthropometric variables (weight, height, body mass index [BMI]), waist circumference, and blood pressure values were obtained from patient records at the time of diagnosis. Routine laboratory parameters, including fasting blood glucose, lipid profile, liver and kidney function tests, complete blood count, and uric acid levels, were extracted from the hospital electronic medical record system.
After an overnight fast of 12–14 hr, venous blood samples were collected into plain vacuum tubes. Following a resting period of 20–60 min, samples were centrifuged at 1000g for 10 min. The serum fraction was transferred into microtubes and stored at −80°C until analysis. Serum samples for the measurement of Fetuin-A, YKL-40, and hsCRP were obtained both at baseline (diagnosis visit) and at the 3-month follow-up visit. Serum hsCRP, YKL-40, and Fetuin-A concentrations were measured using commercial ELISA kits (Elabscience Biotechnology Co., Ltd., Wuhan, PRC; catalog numbers E-EL-H5134, E-EL-H0037, and E-EL-H0386, respectively). All assays were performed strictly according to the manufacturer’s instructions. Optical density values were obtained at 450 nm using an ELX800 microplate reader (BioTek Instruments, Winooski, VT, USA). According to the manufacturer’s data, the detection limits were 9.38 pg/mL for hsCRP, 37.5 pg/mL for YKL-40, and 5.63 ng/mL for Fetuin-A. The intra- and inter-assay coefficients of variation for all assays were below 10%, and the analytical measurement ranges were 15.63–1000 pg/mL for hsCRP, 62.5–4000 pg/mL for YKL-40, and 9.38–600 ng/mL for Fetuin-A. No procedural modifications were made.
Statistical analysis
An a priori power analysis was performed using the effect size (r = 0.654) reported by Huddam et al. 8 With an alpha error of 0.05 and a statistical power of 80%, the minimum required sample size was calculated as 68 participants; thus, the final sample size of 70 subjects was sufficient.
Data were analyzed using SPSS version 20.0 (SPSS Inc., Chicago, IL, USA). The distribution of continuous variables was assessed using the Kolmogorov–Smirnov test together with visual inspection of histograms and Q–Q plots. Descriptive statistics were presented as mean ± standard deviation for normally distributed variables, median (25th–75th percentiles) for nonnormally distributed variables, and frequencies (%) for categorical variables. Comparisons between the MetS and control groups were performed using the independent samples t-test for normally distributed variables and the Mann–Whitney U test for nonnormally distributed variables. Categorical variables were analyzed using the chi-square test. Within the MetS group, baseline and 3-month biomarker levels were compared using the paired samples t-test or the Wilcoxon signed-rank test, depending on distributional characteristics. MetS severity was defined as the number of NCEP-ATP III criteria met and was treated as an ordinal variable. Changes in biomarker levels and MetS severity over the 3-month period were calculated as the absolute difference between follow-up and baseline values (Δ = 3-month value—baseline value).
Correlations between MetS severity scores and serum Fetuin-A, YKL-40, and hsCRP levels were evaluated using Spearman’s correlation test due to the ordinal structure of the MetS score and the nonnormal distribution of biomarker variables. A two-tailed P-value <0.05 was considered statistically significant.
Results
Baseline demographic and laboratory characteristics of the study population are presented in Table 1. The study included a total of 70 participants, consisting of 46 females (66%) and 24 males (34%). Of these, 47 individuals (31 females and 16 males) met the diagnostic criteria for MetS, while the control group comprised 23 individuals (15 females and 8 males) without MetS. Age distribution was similar between the groups (P = 0.803). Consistent with the diagnostic definition of MetS, waist circumference and BMI were significantly higher in the MetS group. Systolic and diastolic blood pressure values were also significantly elevated. In addition, fasting blood glucose, triglyceride levels, and leukocyte counts were significantly higher in participants with MetS, whereas HDL-C levels were significantly lower compared with controls. Importantly, serum Fetuin-A, hsCRP, and YKL-40 levels were substantially elevated among MetS patients relative to controls (all P < 0.001).
Baseline Demographic, Anthropometric, and Laboratory Characteristics of the MetS and Control Groups

P < 0.05 was considered statistically significant. Data are presented as mean ± standard deviation or median (25th–75th percentiles) for continuous variables and as number (percentage) for categorical variables.
BMI, body mass index; FBG, fasting blood glucose; TG, triglyceride; LDL-C, low-density lipoprotein cholesterol; HDL-C, high-density lipoprotein cholesterol; SBP, systolic blood pressure; DBP, diastolic blood pressure; hsCRP, high-sensitivity C-reactive protein; Fetuin-A, alpha-2-HS-glycoprotein; YKL-40, chitinase-3-like protein 1.
At the 3-month follow-up, anthropometric and biochemical parameters of the MetS group were reassessed, and the results are presented in Table 2. Body weight and BMI remained unchanged, whereas waist circumference decreased significantly (P < 0.001). Fasting glucose, triglyceride, and LDL-C levels were reduced, while HDL-C levels showed no significant change. Systolic and diastolic blood pressure values were also lower at follow-up. Albumin and creatinine levels remained stable. Although hsCRP, Fetuin-A, and YKL-40 levels were lower at 3 months, these changes did not reach statistical significance (all P > 0.05).
Baseline and 3-Month Follow-up Values in Patients with MetS (n = 47)

P < 0.05 was considered statistically significant. Data are presented as mean ± standard deviation or median (25th–75th percentiles) for continuous variables and as number (percentage) for categorical variables.
BMI, body mass index; FBG, fasting blood glucose, TG, triglyceride; LDL-C, low-density lipoprotein cholesterol, HDL-C, high-density lipoprotein cholesterol; SBP, systolic blood pressure, DBP, diastolic blood pressure; hsCRP, high-sensitivity C-reactive protein, Fetuin-A, alpha-2-HS-glycoprotein; YKL-40, chitinase-3-like protein 1.
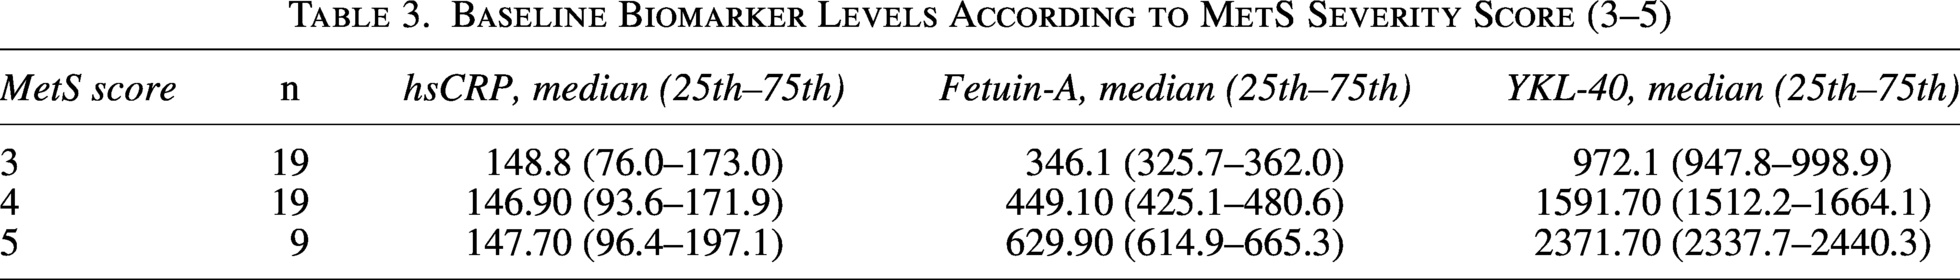
MetS severity was graded according to the number of fulfilled NCEP-ATP III criteria (range: 3–5). In the MetS group, the median severity score decreased from 4 at baseline to 3 at the 3-month follow-up. Baseline biomarker levels stratified by MetS severity are presented in Table 3. No significant association was observed between baseline MetS score and hsCRP levels (r = 0.042, P = 0.780). In contrast, strong positive correlations were identified between baseline MetS score and serum Fetuin-A (r = 0.928, P < 0.001) as well as YKL-40 (r = 0.928, P < 0.001).
Baseline Biomarker Levels According to MetS Severity Score (3–5)
Correlation analysis at baseline across the entire study population demonstrated significant associations between inflammatory biomarkers and metabolic parameters (Table 4).
Correlation of Baseline Inflammatory Biomarkers with Metabolic Parameters (n = 70)
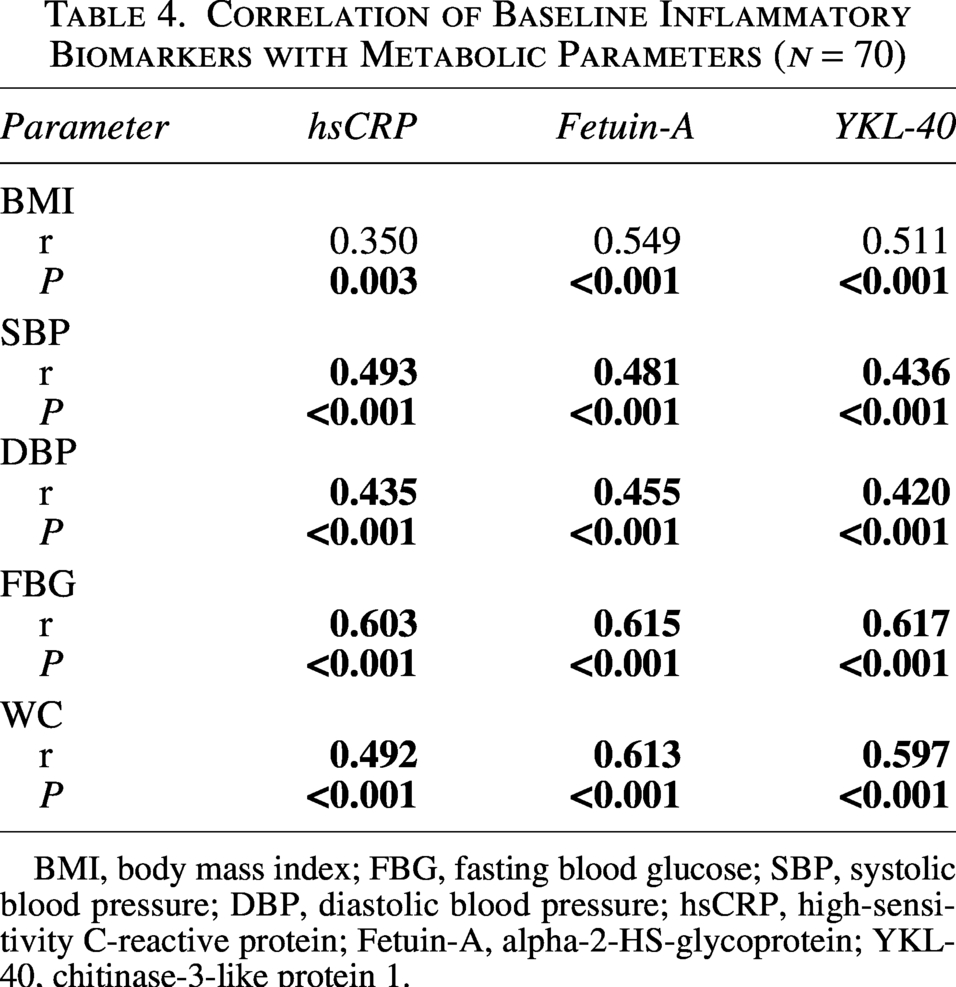
BMI, body mass index; FBG, fasting blood glucose; SBP, systolic blood pressure; DBP, diastolic blood pressure; hsCRP, high-sensitivity C-reactive protein; Fetuin-A, alpha-2-HS-glycoprotein; YKL-40, chitinase-3-like protein 1.
During the 3-month follow-up, changes in MetS severity were also positively correlated with changes in inflammatory biomarkers. Spearman analysis demonstrated significant associations between the change in MetS score and changes in hsCRP (r = 0.844, P < 0.001), Fetuin-A (r = 0.918, P < 0.001), and YKL-40 (r = 0.913, P < 0.001) (Figs. 1–3).

Correlation between changes in hsCRP and MetS severity score (Δ0–3 months).

Correlation between changes in Fetuin-A and MetS severity score (Δ0–3 months).
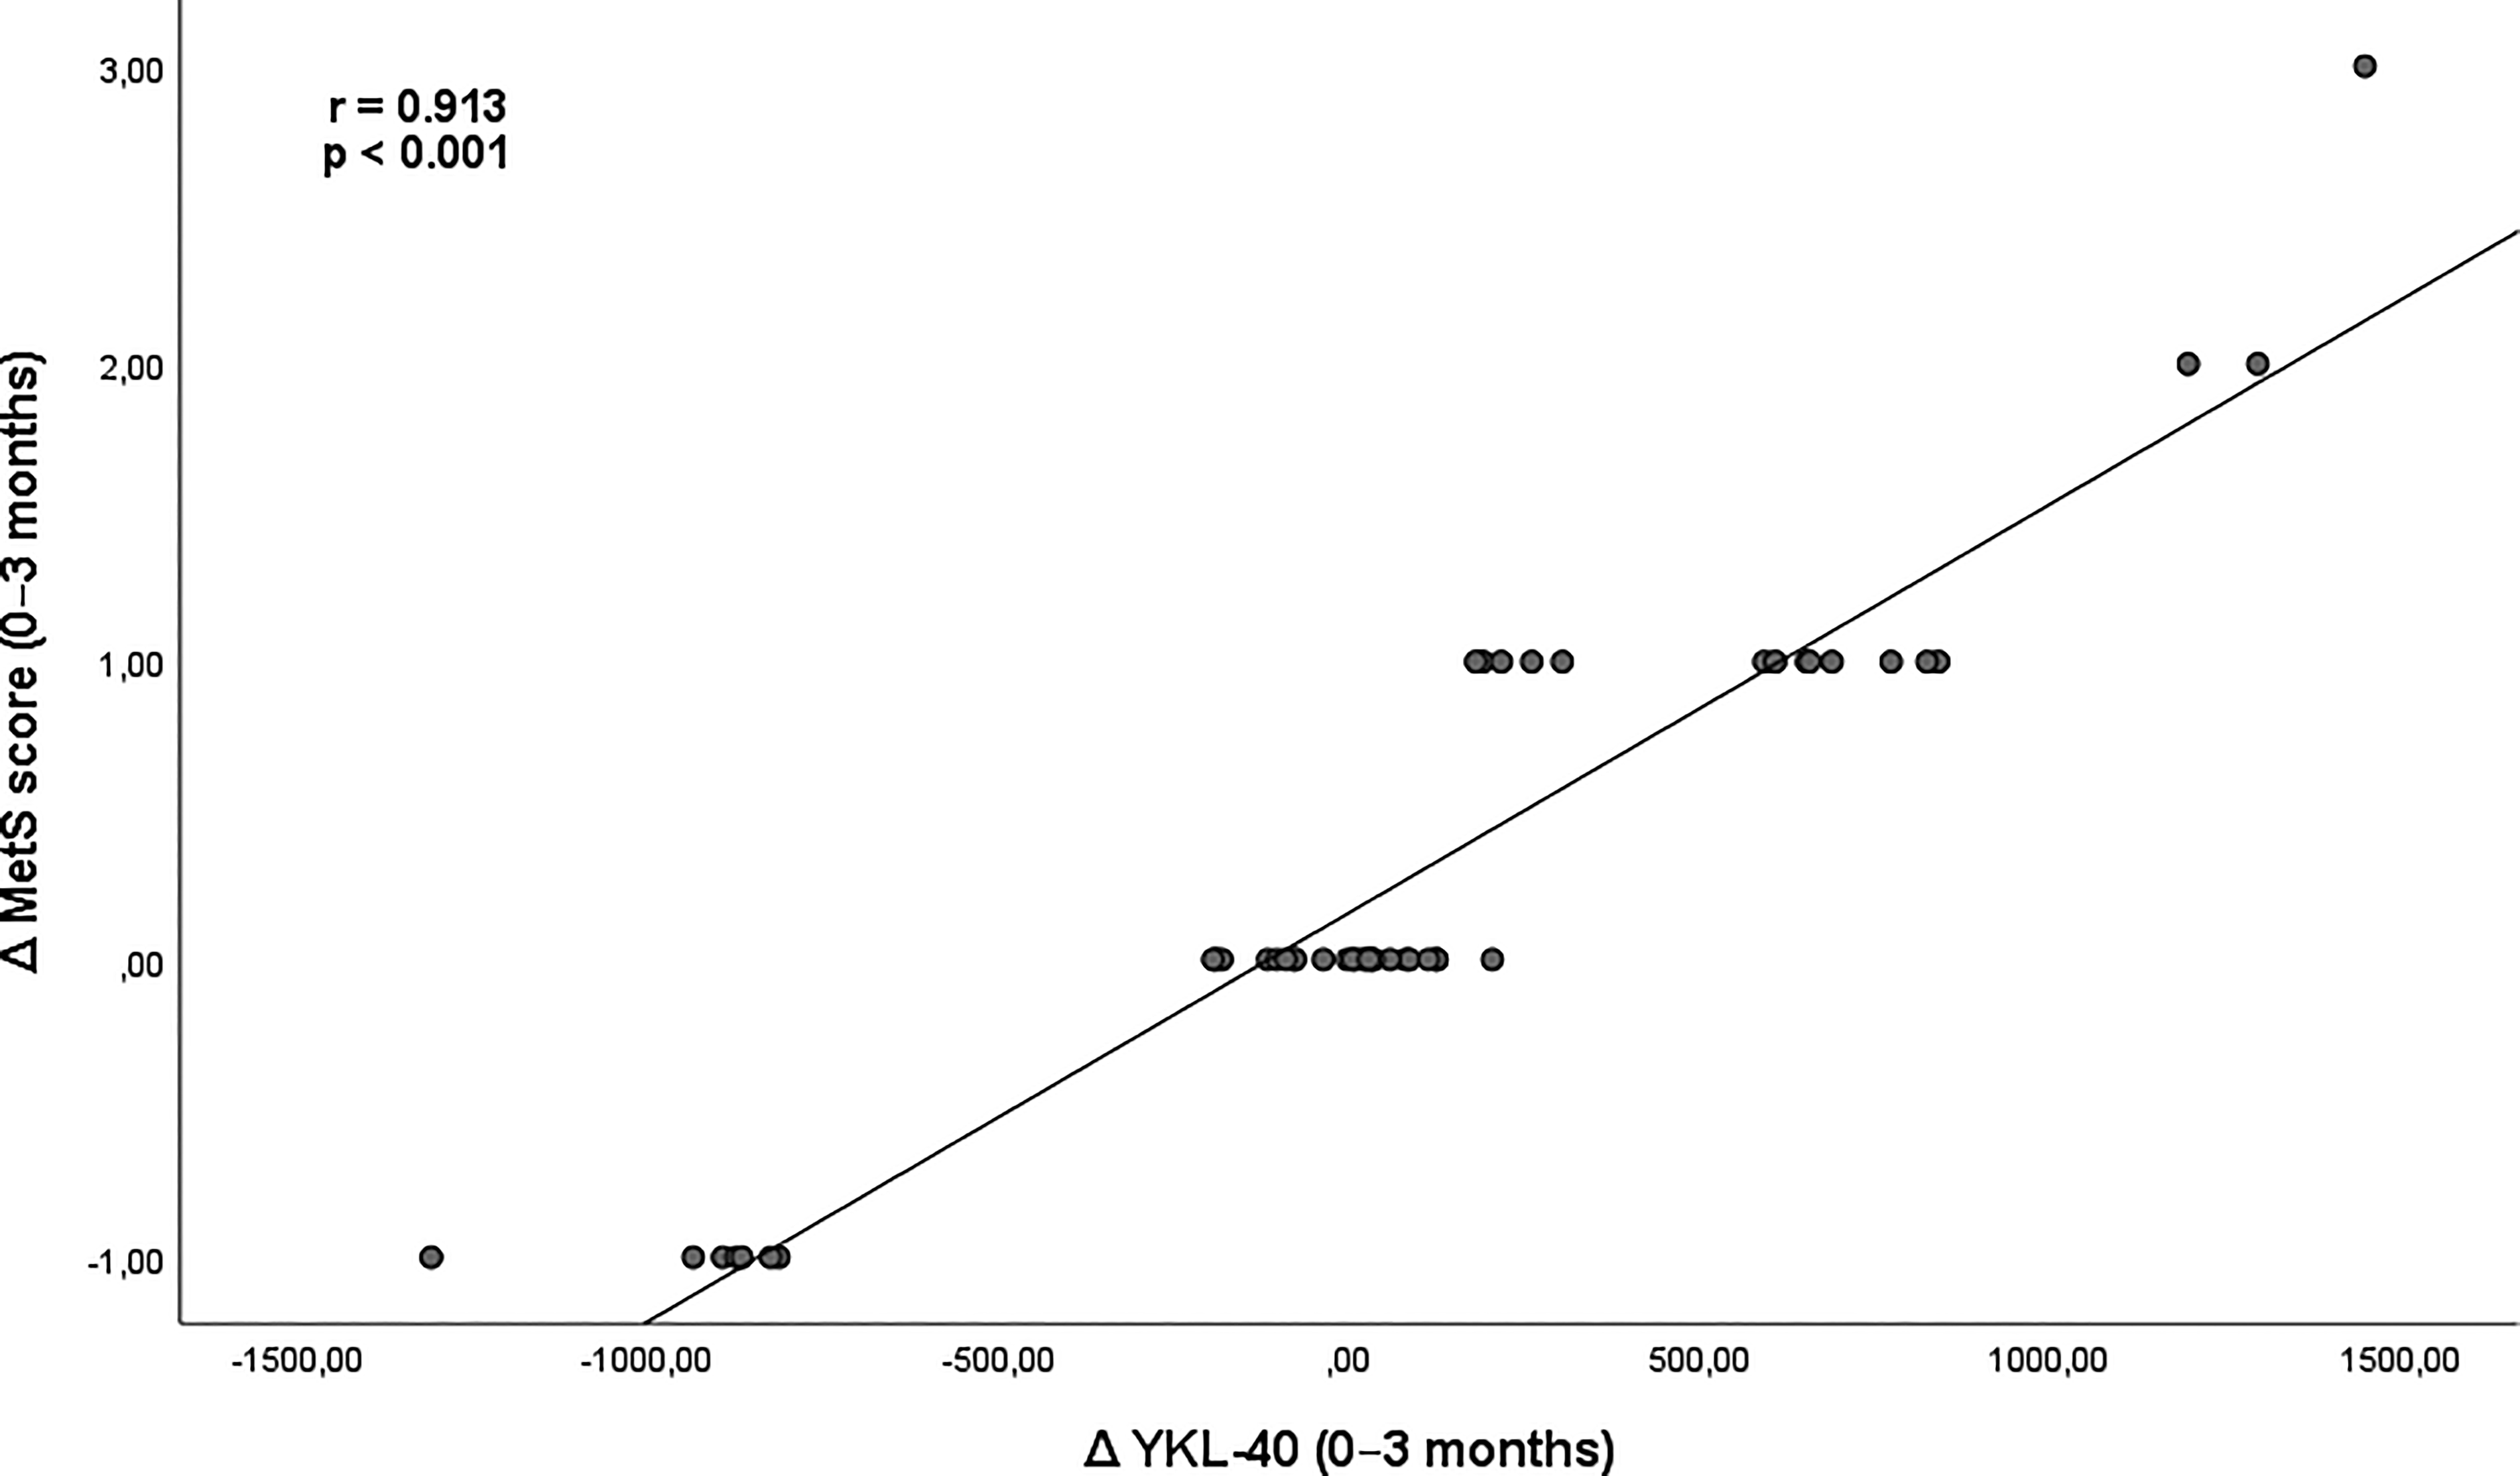
Correlation between changes in YKL-40 and MetS severity score (Δ0–3 months).
Given the ordinal structure of the MetS severity score (range 3–5), we additionally performed Kendall’s tau-b analysis as a sensitivity test. The monotonic associations remained robust, with tau coefficients of 0.808 for Fetuin-A, 0.803 for YKL-40, and 0.716 for hsCRP (all P < 0.001), supporting the stability of the observed correlations.
Discussion
The main finding of this study is that serum Fetuin-A, YKL-40, and hsCRP levels are markedly higher in individuals with MetS compared with healthy controls and that changes in MetS severity over a 3-month period were positively associated with changes in these inflammatory biomarkers. These results affirm our hypothesis that inflammatory biomarkers—particularly Fetuin-A and YKL-40—are closely associated with both the presence and the severity of MetS.
Low-grade systemic inflammation is recognized as a core component of MetS, and hsCRP is one of the most widely studied inflammatory biomarkers in this context. Recent evidence shows that individuals with MetS exhibit substantially higher hsCRP levels than healthy controls, particularly in populations with severe obesity and chronic metabolic dysfunction. 9 A systematic review of adolescents with MetS likewise demonstrated consistently elevated hsCRP across studies, supporting its role as a reliable marker of metabolic derangement. 10 Similarly, a hospital-based cross-sectional study in an elderly population showed that hsCRP levels were significantly higher in individuals with MetS and remained an independent predictor of MetS even after adjustment for major confounders. 3 Most importantly, a nationwide cohort study and accompanying meta-analysis demonstrated that both baseline hsCRP levels and longitudinal increases in hsCRP were independent predictors of incident MetS, showing a clear dose–response relationship. 4 These findings indicate that hsCRP is not only associated with the presence of MetS but also reflects its progression over time. Our results are consistent with this literature: hsCRP levels were significantly higher in patients with MetS compared with controls. However, baseline hsCRP did not correlate with MetS severity in our cohort, suggesting that hsCRP may reflect the presence of metabolic inflammation rather than the degree of metabolic clustering. The change in hsCRP strongly correlated with the change in MetS score during the 3-month follow-up, indicating that hsCRP may be more informative as a dynamic marker of short-term metabolic modification.
Fetuin-A is recognized as a key regulator of metabolic inflammation and insulin resistance. In the review by Singh et al., Fetuin-A was reported to be not only a hepatocyte-derived glycoprotein but also expressed in adipocytes, where it promotes toll-like receptor 4 (TLR4)-mediated inflammatory signaling, thereby playing a central role in the pathophysiology of MetS. 11 This mechanistic framework is supported by clinical findings. Eswar et al. demonstrated that Fetuin-A levels were markedly higher in overweight and obese individuals when MetS was present and that Fetuin-A was tightly linked to both metabolic and biochemical abnormalities. 12 Similarly, the meta-analysis by Pan et al. showed significantly elevated Fetuin-A levels in individuals with MetS and identified rising Fetuin-A as a meaningful predictor of future MetS risk. 2 More recent data from Gavril et al. further associated Fetuin-A with MetS-related dyslipidemia—particularly higher triglycerides and lower HDL-C—and highlighted its potential value as a cardiometabolic risk biomarker. 5 Taken together, these mechanistic and clinical insights suggest that Fetuin-A reflects both the inflammatory burden and the metabolic derangements characteristic of MetS. The strong alignment between these observations and the patterns seen in our study supports the concept that Fetuin-A acts as an integrative biomarker, capturing the interplay between adipose-tissue inflammation, lipid dysfunction, and insulin resistance. In our study, Fetuin-A demonstrated a clear stepwise increase across MetS severity categories and showed a robust correlation with short-term changes in metabolic burden.
YKL-40 has emerged as a multifaceted biomarker linking inflammation, metabolic dysfunction, and cardiovascular risk. Mechanistic reviews indicate that YKL-40 promotes endothelial dysfunction, macrophage activation, extracellular matrix remodeling, and insulin-signaling impairment—pathways central to the development of cardiometabolic disease.13,14 These biological properties provide a compelling rationale for its association with MetS. Clinical data reinforce this concept: Akboğa et al. first demonstrated that higher YKL-40 levels were closely related to both the presence and severity of MetS. 15 Building on this, Schernthaner et al. reported that YKL-40 was elevated particularly in individuals with obesity-related metabolic disturbances and suggested that YKL-40 reflects a broader inflammatory–cardiometabolic phenotype rather than obesity alone. 16 More recent evidence strengthens this interpretation. Chou et al. showed that YKL-40 was significantly associated with triglyceride-glucose body mass index, estimated insulin resistance, and MetS in nondiabetic adults, independent of BMI. 6 This supports the view that YKL-40 reflects metabolic inflammation beyond adiposity and may help identify early metabolic decompensation even in individuals without overt hyperglycemia. Taken together, these findings are in line with our observations, in which YKL-40 closely tracked overall metabolic burden and its short-term improvement. YKL-40 showed a pronounced association with MetS severity and its change over time, suggesting that it may reflect dynamic shifts in metabolic inflammation rather than static anthropometric features alone.
The magnitude of correlation observed in our cohort was notably high. This may partly reflect the ordinal structure of the MetS severity score and the relatively narrow range of severity categories (3–5), which could have amplified monotonic associations and should therefore be interpreted with caution.
This study has limitations. It was conducted at a single center with a relatively modest sample size, which may limit the generalizability of the findings. Although lifestyle modification counseling was standardized, adherence to dietary and behavioral recommendations could not be objectively verified, and unmeasured behavioral factors may have influenced biomarker dynamics. The follow-up period was limited to 3 months, preventing assessment of long-term sustainability of metabolic improvements. In addition, only selected inflammatory biomarkers were evaluated; therefore, a more comprehensive inflammatory or mechanistic profile could not be established.
In conclusion, our findings provide evidence that hsCRP, Fetuin-A, and YKL-40 are associated with MetS. Fetuin-A and YKL-40 demonstrated strong associations with both MetS severity and short-term changes in metabolic burden, whereas hsCRP appeared more reflective of overall inflammatory status than severity stratification. Larger and longer-term prospective studies are needed to clarify their diagnostic and prognostic value.
Data Availability
The datasets generated and/or analyzed during the current study are available from the corresponding author on reasonable request.
Ethical Considerations
This study was conducted in accordance with the principles of the Declaration of Helsinki and was approved by the Aydın Adnan Menderes University Faculty of Medicine Clinical Research Ethics Committee (Approval date: 12 May 2017; Protocol No: 2017/1151; Decision No: 02).
Consent to Participate
Written informed consent was obtained from all participants prior to enrollment.
Authors’ Contributions
H.B.U. conceived and supervised the study and contributed to data interpretation. H.B. contributed to patient recruitment and data acquisition. E.D.T. contributed to study design, data collection, statistical analysis, and article drafting. M.Y. performed laboratory analyses and contributed to data interpretation. All authors critically revised and approved the final article.
Footnotes
Author Disclosure Statement
No competing financial interests exist.
Funding Information
This study was supported by the Aydın Adnan Menderes University Scientific Research Projects Coordination Unit (Project No: