
Abstract
Objective:
To investigate sex-specific associations between depot-specific adipose tissue distribution and prediabetes among U.S. adults.
Methods:
This cross-sectional analysis included 2993 adults from the 2011–2016 National Health and Nutrition Examination Survey. Android and gynoid fat percentages were measured using dual-energy X-ray absorptiometry. Sex-stratified multivariable logistic regression models were employed to assess these associations, adjusting for demographic, lifestyle, and metabolic covariates.
Results:
Individuals with prediabetes had significantly higher android and gynoid fat percentages than normoglycemic controls in both sexes. After full adjustment, higher android fat was consistently associated with increased odds of prediabetes in both men [odds ratio (OR) = 1.044, 95% confidence interval (CI): 1.013–1.077] and women (OR = 1.052, 95% CI: 1.023–1.083). In contrast, higher gynoid fat was associated with reduced odds of prediabetes in women only (OR = 0.940, 95% CI: 0.910–0.972), with no significant association observed in men (OR = 0.965, 95% CI: 0.930–1.001).
Conclusions:
The association between regional adiposity and prediabetes is fundamentally modified by sex. While android fat is a uniform risk factor, gynoid fat appears to be protective, specifically in women. These findings underscore the necessity of sex-specific assessment of body fat distribution for early cardiometabolic risk stratification.
Introduction
The latest International Diabetes Federation Diabetes Atlas (2025) reports that the number of adult diabetic patients worldwide has reached 590 million in 2025, almost 11.1% of the adult population aged 20–79 years are living with diabetes, and their projections show that this number will surge by 46%, reaching over 860 million by 2050. 1 A substantial proportion of these cases progress from prediabetes, an intermediate hyperglycemic state defined by blood glucose levels that are above normal but below the diagnostic threshold for diabetes. In fact, the annual progression rate from prediabetes to type 2 diabetes mellitus (T2DM) is estimated to be 5%–10%, and it is projected that up to 70% of individuals with prediabetes will eventually develop T2DM. 2 T2DM has consequently evolved into a global noncommunicable disease epidemic, posing a major public health and economic burden. Diabetes leads to severe chronic microvascular and macrovascular complications (e.g., nephropathy, cardiovascular disease, and neuropathy), which profoundly impair patients’ quality of life and increase mortality.3–7 Therefore, intervening at the prediabetes stage is crucial for mitigating the impending tidal wave of diabetes and its associated burdens.
To mitigate the risk of progression to diabetes and its vascular complications, individuals with prediabetes are advised to monitor not only blood glucose levels but also body weight, 8 often indexed by body mass index (BMI), given that obesity is a paramount risk factor for diabetes incidence. 9 However, BMI has notable limitations, as it cannot distinguish between fat and lean mass. This limitation is exemplified by sarcopenic obesity—a condition characterized by coexisting low muscle mass and high adiposity—which can occur even in individuals with a normal-range BMI. 10 Consequently, direct measures of adiposity, particularly regional fat distribution assessed via computed tomography (CT) or dual-energy X-ray absorptiometry (DXA), provide a more accurate evaluation of obesity-related metabolic risk than BMI alone. 11 These imaging modalities enable precise quantification of android and gynoid fat depots, two distinct regional adipose tissue compartments. 12 Accumulating evidence links both android and gynoid fat depots to prediabetes risk.12,13 Crucially, males usually have more android fat than gynoid fat, whereas females have less, and there are also sex differences in body fat percentage. 14 Meanwhile, android fat is more closely related to T2DM than gynoid fat. 15 Despite these insights, whether the associations between android and gynoid fat and prediabetes differ by sex remains inadequately explored. To address this gap, we aimed to investigate the sex-specific associations between DXA-measured adipose tissue distribution and prediabetes in a nationally representative sample of U.S. adults.
Methods
Study population
A total of 1488 participants with prediabetes and 1505 normoglycemic participants were included from the National Health and Nutrition Examination Survey (NHANES) between 2011 and 2016. Prediabetes was diagnosed according to the American Diabetes Association criteria, 16 which include a glycated hemoglobin (HbA1c) level of 5.7%–6.4%, a fasting plasma glucose (FPG) level of 100–125 mg/dL, or a 2-hr postprandial glucose (2 hr-PG) level of 140–199 mg/dL. Participants were excluded if they were aged <18 years, had diagnosed diabetes, were pregnant, reported an unusual diet, or had incomplete data on key study variables (see Fig. 1 for the participant selection flowchart.). The NHANES data used in this study were collected during the survey periods spanning from January 2011 to December 2016. This study was approved by the National Center for Health Statistics Research Ethics Review Board and adhered to the principles of the Declaration of Helsinki. All participants provided written informed consent.
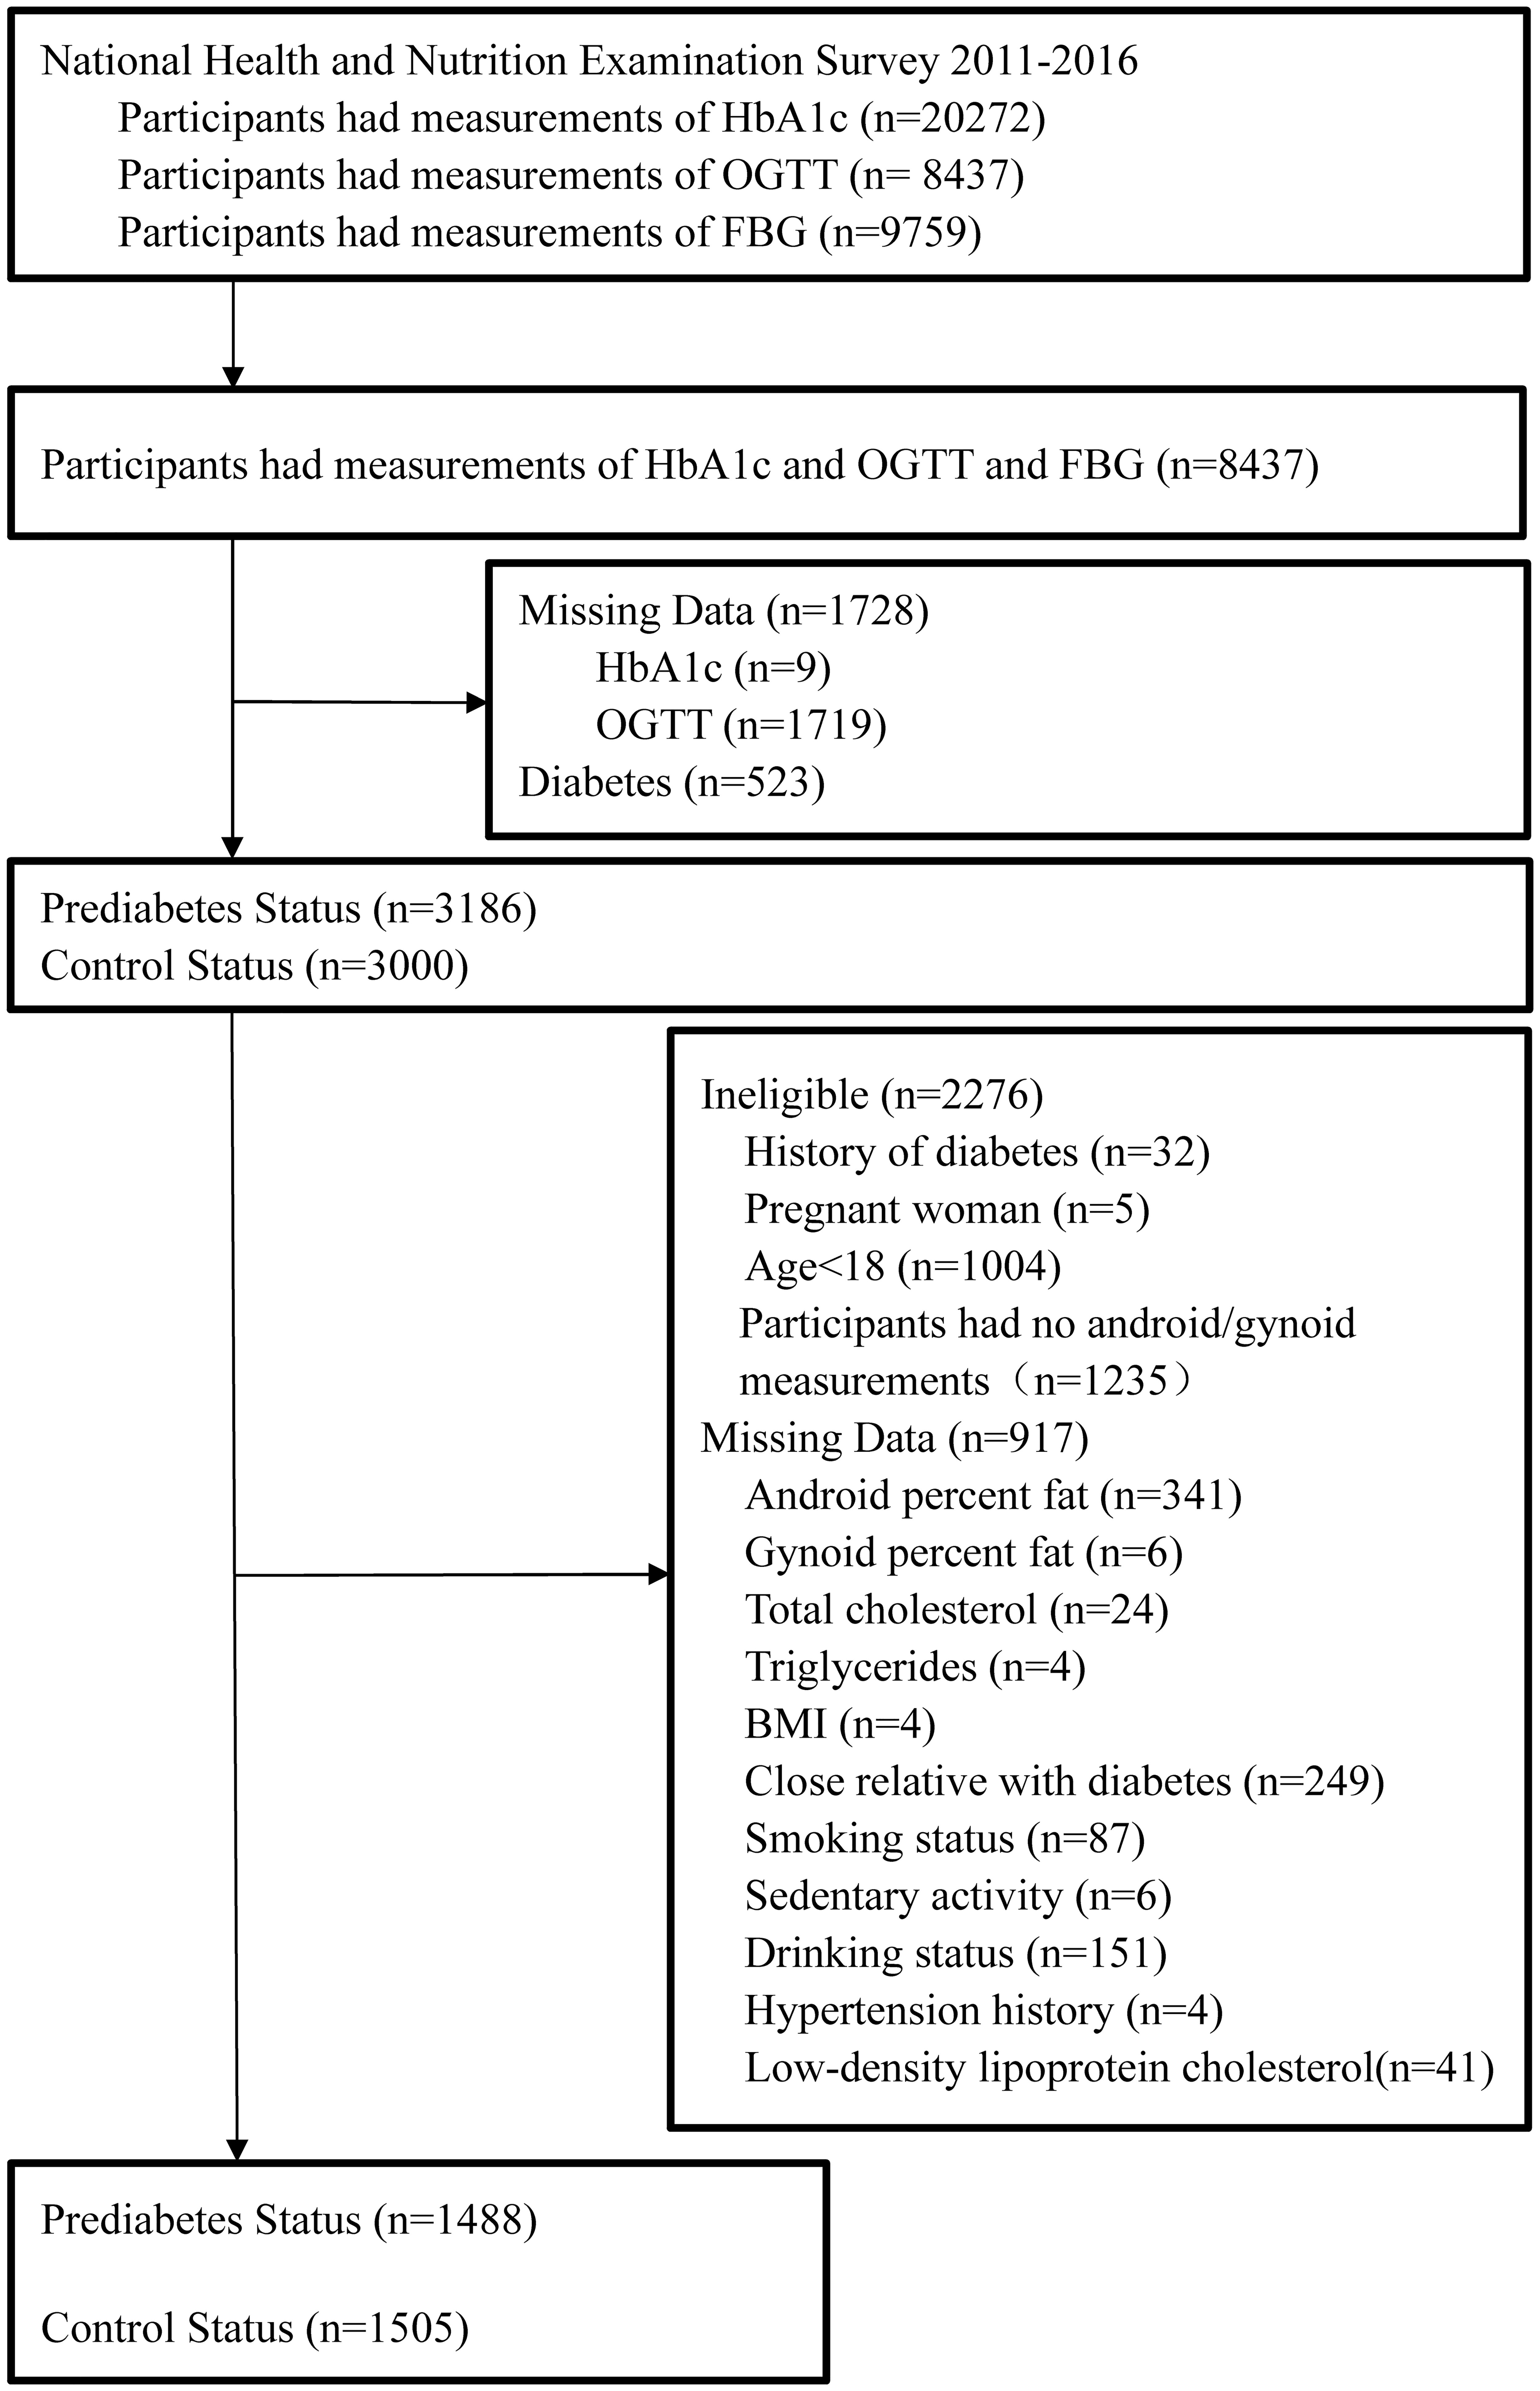
Flowchart of participant selection from NHANES 2011–2016. This chart outlines the derivation of the study cohort. Of 20,272 NHANES participants with HbA1c data, 8437 with concurrent HbA1c, oral glucose tolerance test (OGTT), and FPG measurements were initially assessed. After excluding 1728 due to missing glycemic data and 523 with diabetes, 6186 participants were categorized into prediabetes (n = 3186) and control (n = 3000) groups. Both groups underwent further exclusions: 2276 for ineligibility (e.g., age <18, pregnancy, or lack of body composition data) and 917 for missing covariate data (e.g., anthropometrics, lipids, and lifestyle factors). The final analytic sample included 2993 participants (prediabetes: n = 1488; control: n = 1505). HbA1c, glycated hemoglobin.
Data collection
Data on age, sex, smoking status, alcohol consumption, family history of diabetes, and physical activity were obtained from standardized demographic and questionnaire components of NHANES. Fasting blood samples were used for laboratory examinations including FPG, 2 hr-PG, HbA1c, total cholesterol (TC), high-density lipoprotein cholesterol (HDL-C), low-density lipoprotein cholesterol (LDL-C), and triglycerides (TG). Whole-body DXA scans were performed using a Hologic scanner (Hologic, Inc., Bedford, MA, USA) by trained and certified radiology technologists. Android and gynoid fat masses and percentages were derived from these scans. The android area was defined as the lower trunk area bounded by two lines: the pelvic horizontal cut line on its lower side and a line automatically placed above the pelvic line. The upper gynoid line was placed 1.5 times of the height of the android region below the pelvic line, and the lower gynoid line was placed such that the distance between the two gynoid lines was twice the height of the android region. 17 All these lines were automatically placed by Hologic APEX, version 4.0 software.
Statistical analysis
Categorical variables are expressed as frequency (percentage), and non-normally distributed continuous variables are expressed as median (interquartile range). The chi-square test was used to compare categorical variables, and the Mann–Whitney U test was used to compare continuous variables. Spearman’s rank correlation coefficients were calculated to evaluate the associations of both android and gynoid fat percentages with continuous metabolic variables. Multivariable logistic regression analysis was used to calculate the odds ratio (OR) with 95% confidence interval (CI) for the risk of prediabetes. All statistical tests were two-sided, and a P value of <0.05 was considered statistically significant. Statistical analyses were performed by Stata Statistical Software, version 14.0 (StataCorp LLC, College Station, TX, USA).
Results
Baseline characteristics
The baseline characteristics of participants with prediabetes and those with normoglycemia are shown in Table 1. In both males and females, there were significant differences in age, BMI, TC, TG, HDL-C, LDL-C, hypertension history, android fat percentage, and gynoid fat percentage between participants with prediabetes and those with normoglycemia (all P < 0.05). Sex-specific differences were observed for several variables. Smoking status differed significantly between groups only among men (P < 0.05), whereas alcohol consumption and family history of diabetes showed significant differences only among women (both P < 0.05). Notably, both males (33.1% vs. 29.0% android fat; 28.8% vs. 27.7% gynoid fat) and females (42.2% vs. 37.3% android fat; 43.7% vs. 42.5% gynoid fat) with prediabetes had higher android and gynoid fat percentages compared with normoglycemic individuals. There were no significant differences with respect to sedentary activity between participants with prediabetes and those with normoglycemia (P > 0.05).
Baseline Characteristics of the Participants with Prediabetes and Normoglycemia
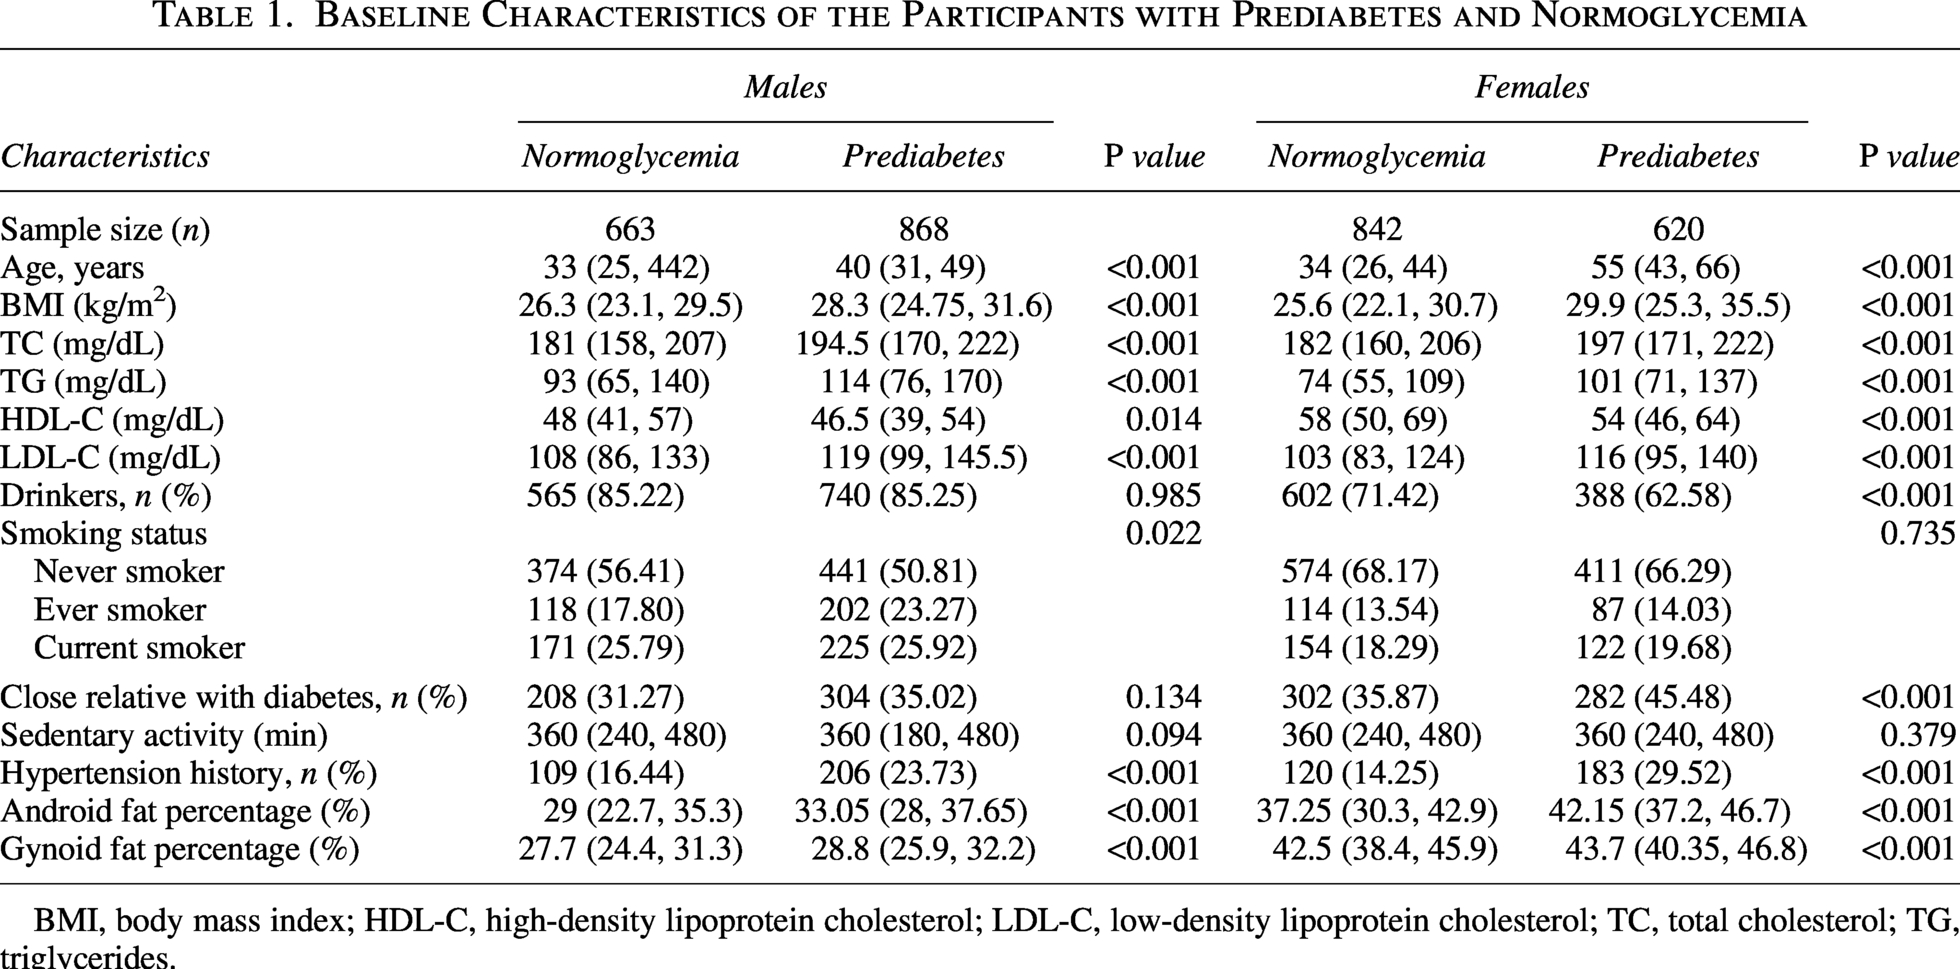
BMI, body mass index; HDL-C, high-density lipoprotein cholesterol; LDL-C, low-density lipoprotein cholesterol; TC, total cholesterol; TG, triglycerides.
Correlates of android fat
The correlations between android fat percentage and metabolic and lifestyle variables are detailed in Table 2. In the overall cohort, android fat was positively correlated with age, BMI, TC, TG, LDL-C, FPG, 2 hr-PG, and HbA1c, and negatively correlated with HDL-C and the HDL-C-to-LDL-C ratio (all P < 0.05). These correlation patterns were consistent in both men and women when analyzed separately. A notable exception was observed for sedentary activity. Android fat showed a significant positive correlation with sedentary time in men and in the combined cohort, but this association was absent in women.
Correlations Between Android Fat Percentage and Clinical Parameters
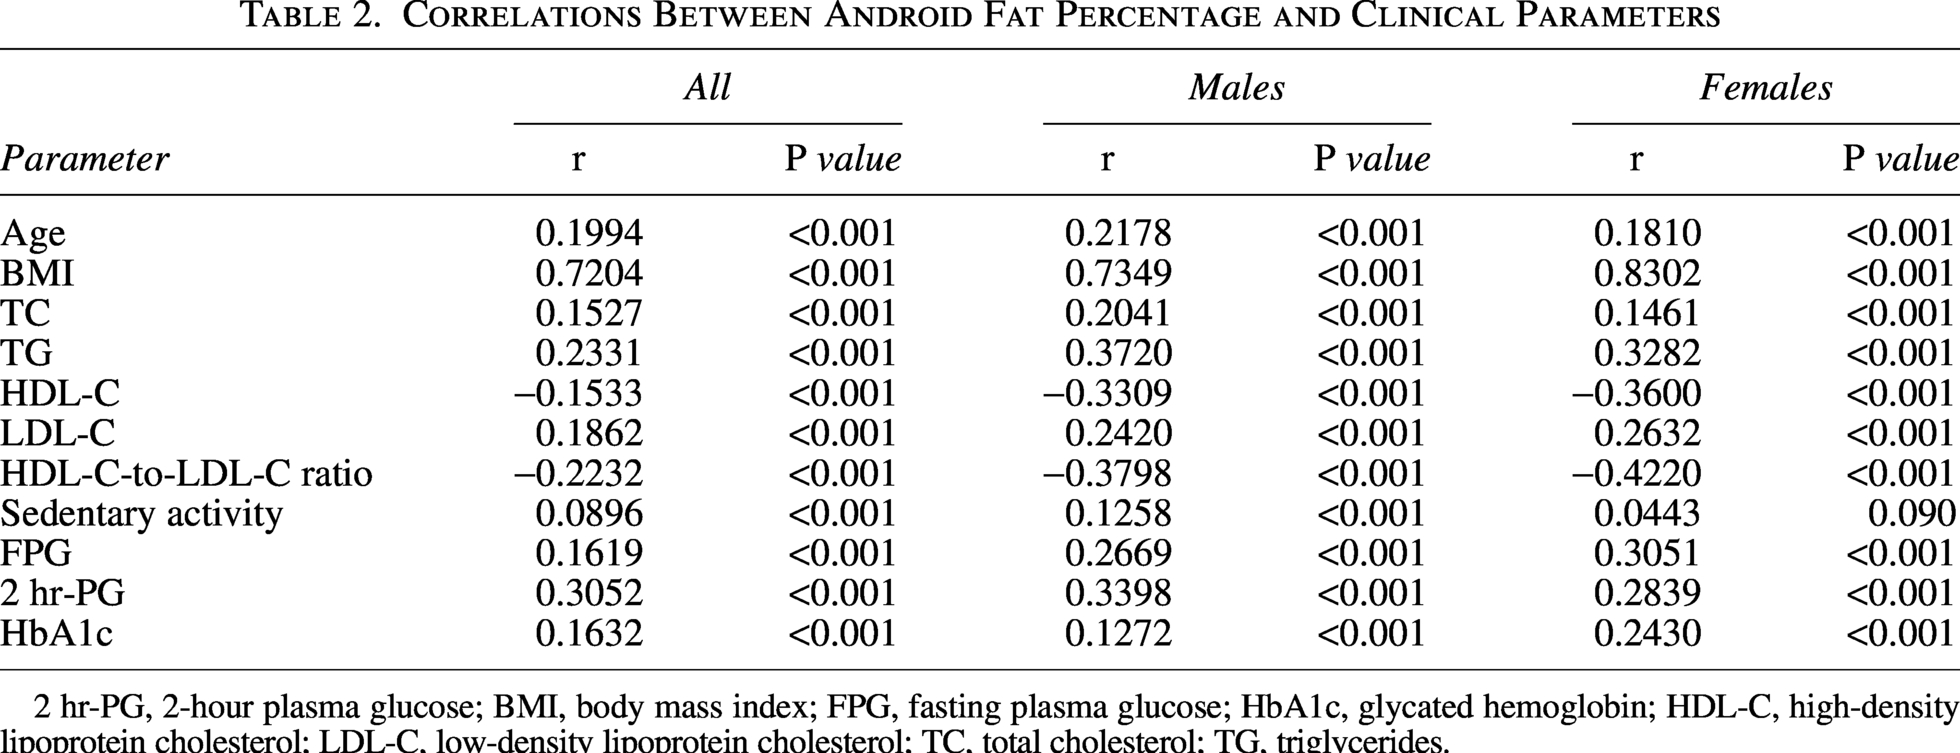
2 hr-PG, 2-hour plasma glucose; BMI, body mass index; FPG, fasting plasma glucose; HbA1c, glycated hemoglobin; HDL-C, high-density lipoprotein cholesterol; LDL-C, low-density lipoprotein cholesterol; TC, total cholesterol; TG, triglycerides.
Sex-modified associations of gynoid fat
The correlations between gynoid fat percentage and metabolic markers are detailed in Table 3. Notably, we observed a classical case of effect modification by sex. For key variables including TG, FPG, HDL-C, and the HDL-C-to-LDL-C ratio, the direction of association in the sex-combined cohort was reversed or masked compared with the sex-stratified analyses. Specifically, in the total population, gynoid fat percentage showed a significant negative correlation with TG and FPG. However, when analyzed separately, these associations were significantly positive in both men and women. Conversely, for HDL-C and the HDL-C-to-LDL-C ratio, a negative correlation was evident in both sexes but was not apparent in the combined analysis.
Correlations Between Gynoid Fat Percentage and Clinical Parameters
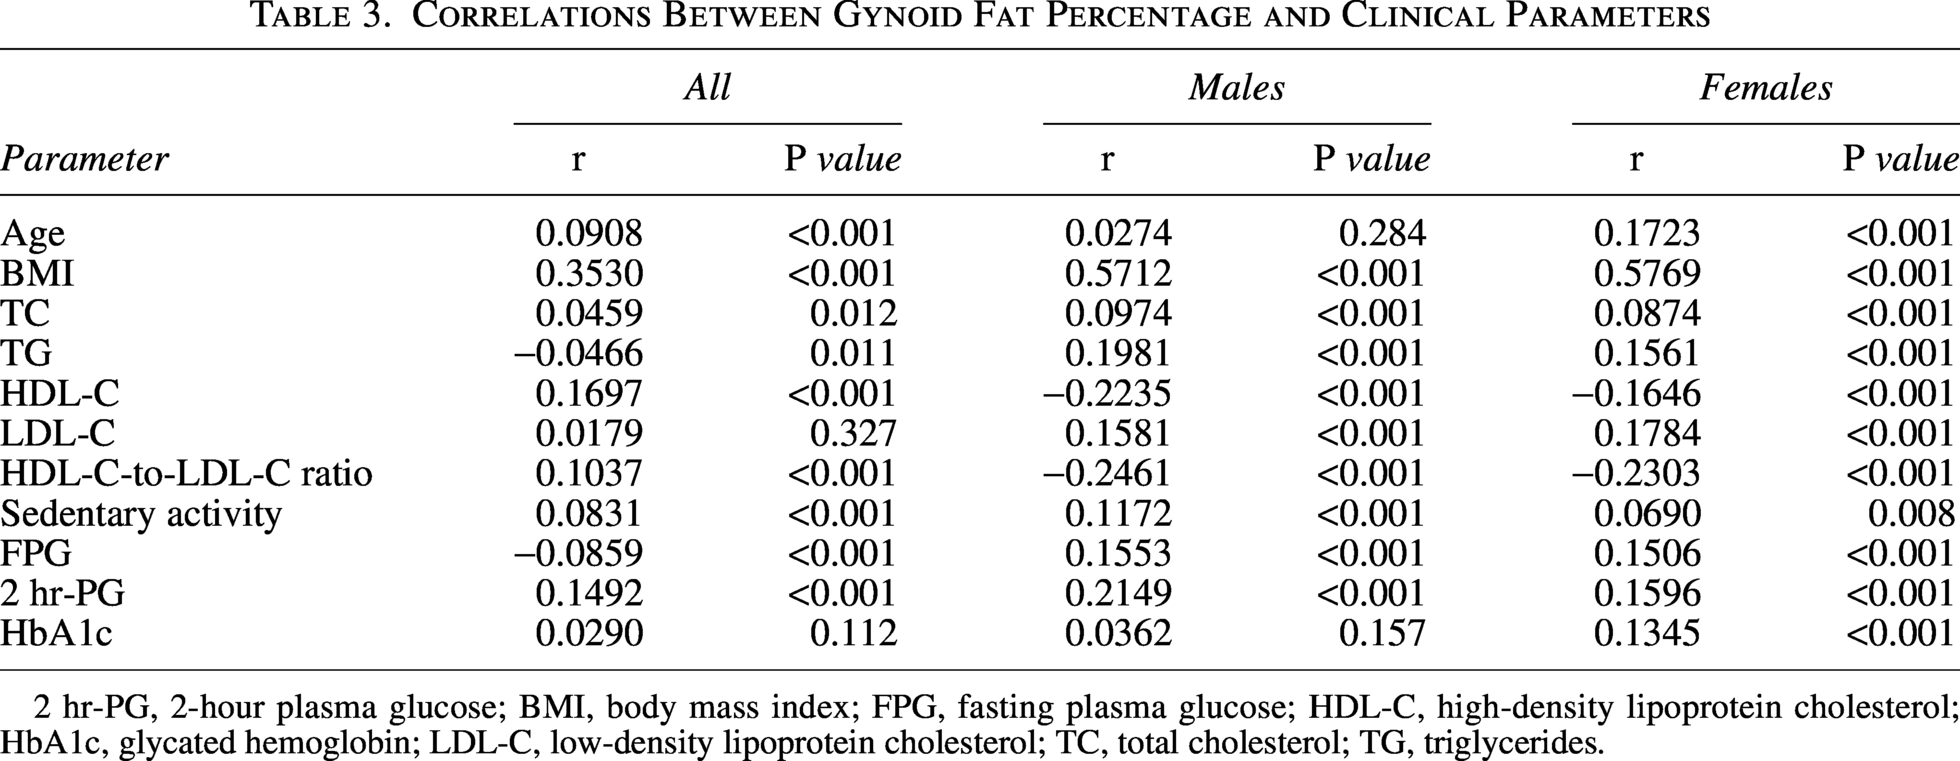
2 hr-PG, 2-hour plasma glucose; BMI, body mass index; FPG, fasting plasma glucose; HDL-C, high-density lipoprotein cholesterol; HbA1c, glycated hemoglobin; LDL-C, low-density lipoprotein cholesterol; TC, total cholesterol; TG, triglycerides.
Beyond these effect-modified associations, gynoid fat percentage was consistently positively correlated with BMI, TC, sedentary activity, and 2 hr-PG across all groups (all P < 0.05). A positive correlation with LDL-C was found only in the sex-specific analyses, and a positive correlation with HbA1c was observed exclusively in women (P < 0.05).
Multivariable logistic regression analyses
Model 1: Association in the total cohort (adjusted for sex)
In a model adjusted for age, BMI, lipid profiles, lifestyle factors, family history of diabetes, and sex, both android and gynoid fat percentages were independently associated with prediabetes. Each 1% increase in android fat was associated with 4.7% higher odds (OR = 1.047, 95% CI: 1.026–1.069, P < 0.001), whereas each percent increase in gynoid fat was associated with 4.7% lower odds (OR = 0.953, 95% CI: 0.931–0.976, P < 0.001). In this model, female sex was itself a protective factor (OR = 0.682, 95% CI: 0.500–0.930, P = 0.016).
Model 2: Sex-stratified analyses
When analyses were stratified by sex, the deleterious association between android fat and prediabetes remained significant and consistent in both men (OR = 1.044, 95% CI: 1.013–1.077, P = 0.005) and women (OR = 1.052, 95% CI: 1.023–1.083, P < 0.001). In contrast, the association of gynoid fat was strongly modified by sex. A protective effect was observed exclusively in women (OR = 0.940, 95% CI: 0.910–0.972, P < 0.001), with no significant association observed in men (OR = 0.965, 95% CI: 0.930–1.001, P = 0.059). These results are presented in Table 4.
Relative Odds of Prediabetes According to Clinical Parameters Among Male and Female
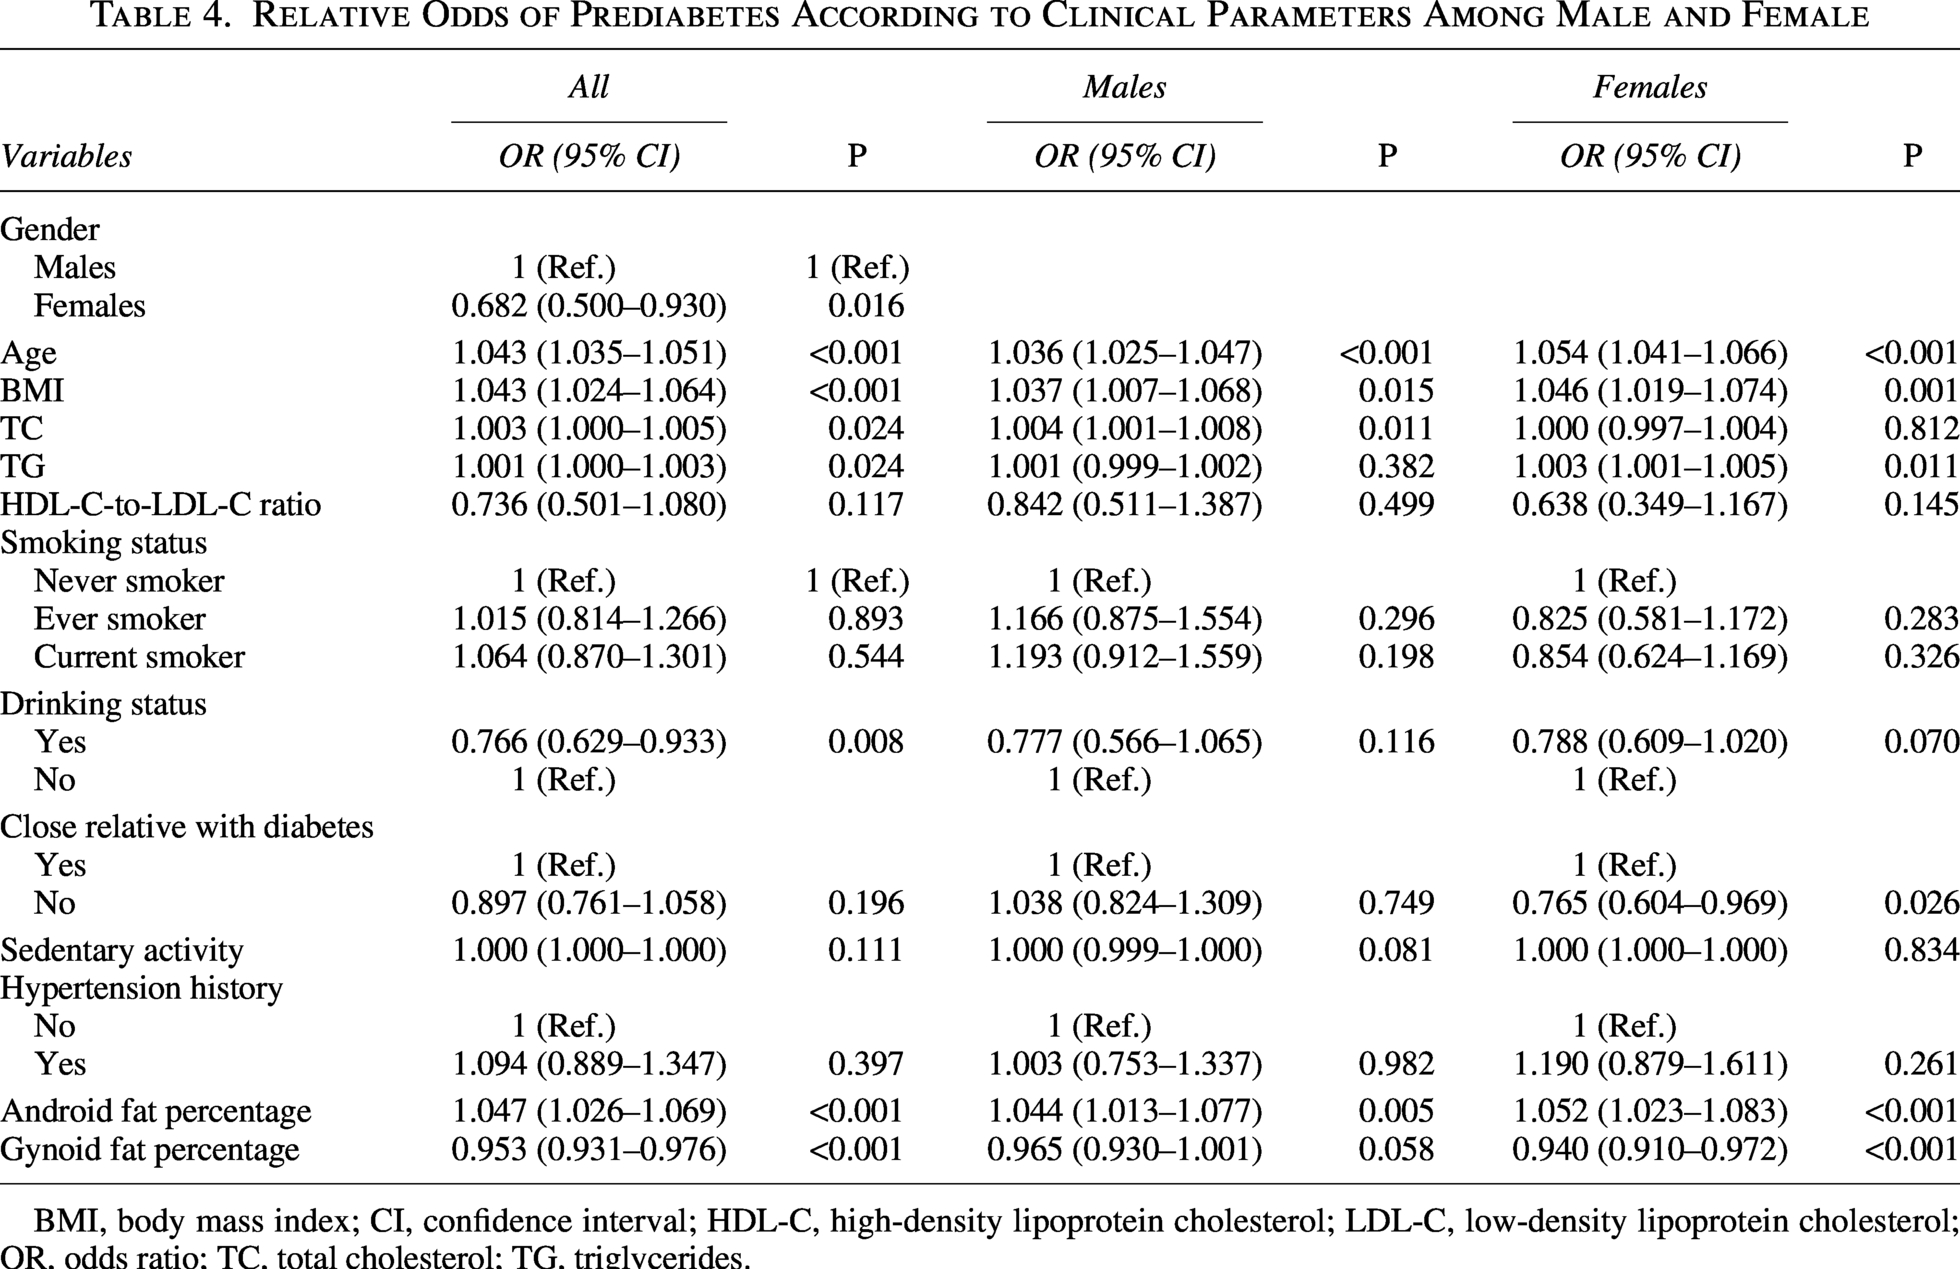
BMI, body mass index; CI, confidence interval; HDL-C, high-density lipoprotein cholesterol; LDL-C, low-density lipoprotein cholesterol; OR, odds ratio; TC, total cholesterol; TG, triglycerides.
Discussion
This study investigated the association between adipose tissue distribution and prediabetes. The results of this sex-specific study showed that both men and women with prediabetes had higher android and gynoid fat percentage compared to normoglycemic individuals. Both in males and females, android fat percentage remained independently associated with prediabetes, whereas the association between gynoid fat percentage and prediabetes was just observed only in females.
Our findings that individuals with prediabetes exhibit elevated TC and LDL-C, alongside reduced HDL-C, point to a more pronounced dyslipidemic profile. This characteristic lipid triad is a well-established consequence of underlying insulin resistance.18,19 Insulin resistance in adipose tissue promotes unrestrained lipolysis, elevating circulating free fatty acids (FFAs). These FFAs drive hepatic overproduction of triglyceride-rich very-low-density lipoprotein. Concurrently, impaired lipoprotein lipase activity delays the clearance of triglyceride-rich lipoproteins. The resultant lipid remodeling leads to the observed atherogenic dyslipidemia. 19 Furthermore, the hyperglycemic and insulin-resistant state of prediabetes directly impairs vascular homeostasis. It promotes oxidative stress and inflammation, which inhibit vasodilatory factors, increase reactive oxygen species, and uncouple endothelial nitric oxide synthase. 20 This cascade leads to endothelial dysfunction, a key precursor to atherosclerosis. Notably, hyperglycemia may also exacerbate dyslipidemia by increasing the formation of oxidized LDL. 20 The confluence of dyslipidemia, endothelial dysfunction, and glycemic variability creates a potent milieu that accelerates atherosclerosis and increases vascular stiffness, which likely explains the higher prevalence of hypertension observed in our prediabetes cohort. 21
Weight gain frequently precedes the onset of diabetes, although not all individuals with prediabetes are clinically obese. 22 As a primary modifiable risk factor, obesity exacerbates insulin demand and resistance, thereby elevating prediabetes risk.22–24 This aligns with our observation of significantly higher BMI and both android and gynoid fat percentages in the prediabetes group. As expected, and consistent with established sexual dimorphism,25,26 women in our cohort—regardless of glycemic status—stored more fat in the gynoid region than the android region, whereas the opposite pattern was observed in men. Critically, the metabolic impact of these fat depots differs. Excessive accumulation of android fat is a hallmark of dysfunctional adipose tissue, driving insulin resistance, systemic inflammation, and endothelial dysfunction. 27 This pathophysiological cascade culminates in the classical atherogenic dyslipidemia triad—elevated triglycerides, low HDL-C, and a shift toward small, dense LDL particles 19 —thereby explaining the strong positive correlation we observed between android fat percentage and adverse lipid profiles. In contrast, gynoid fat is often considered a metabolically protective depot due to its distinct functional properties.28,29 However, our correlation analyses revealed a more nuanced picture: gynoid fat displayed significant positive correlations with several atherogenic markers—particularly TC and 2 hr-PG—that were similar in direction to those observed for android fat. This suggests that, in the context of prediabetes, even lower-body fat may not be entirely benign and could reflect a state of generalized adiposity overload.
To isolate the independent effects of adipose tissue distribution, we constructed multivariable logistic regression models adjusted for key demographic, lifestyle, and metabolic confounders. These models confirmed that both android and gynoid fat percentage were independently associated with prediabetes in the overall cohort. Crucially, sex-stratified analyses revealed a depot-specific pattern: The deleterious association with android fat percentage was consistent in both sexes, whereas the protective association with gynoid fat percentage was significant only in women. This sex-specific and depot-dependent relationship elucidates distinct metabolic roles. The protective effect of gynoid fat in women aligns with its physiological role as a safe lipid sink, supported by greater adipogenic potential and a beneficial adipokine profile.28,30 Its neutral association in men highlights fundamental sex differences in adipose tissue biology regulated by sex hormones. 31 Conversely, android fat was a uniform risk factor across sexes, underscoring the central pathogenic role of visceral adiposity in driving insulin resistance and dysmetabolism. 32 Collectively, our findings demonstrate that regional fat distribution is a more critical determinant of metabolic risk than overall adiposity. 33 The data suggest a potential sexual dichotomy in risk modulation: In women, protective gynoid fat may partially counterbalance the risk from android fat, whereas in men, android fat accumulation presents an unopposed hazard. This underscores the clinical utility of assessing body fat patterning over BMI alone for early risk stratification and for developing sex-tailored prevention strategies targeting prediabetes. 34
While simple anthropometric measures such as waist-to-hip ratio (WHR) offer practical tools for such assessment, the use of DXA in this study was essential for identifying this sex-specific pattern of adiposity-related association. DXA enabled precise, depot-specific quantification of android and gynoid fat, revealing that gynoid fat is protective exclusively in women—a pattern of sexual dimorphism that would likely be obscured by a single composite index like WHR. These findings align with evidence from the Women’s Health Initiative, in which DXA-derived trunk fat significantly improved the prediction of incident diabetes beyond BMI, waist circumference (WC), and WHR. 35
We acknowledge that DXA is neither cost-effective nor practical for population-wide screening. However, it serves a distinct and critical role as a reference standard for identifying the pathophysiological patterns associated with sex differences in metabolic disease. Importantly, previous studies have demonstrated that, among all adiposity indices derived from DXA, bioelectrical impedance analysis (BIA), and anthropometry, measures of abdominal adiposity—including DXA-/BIA-derived trunk fat, DXA-derived android and visceral fat, and WC—exhibit the strongest correlations and absolute agreement with magnetic resonance imaging (MRI)-determined visceral fat (the current imaging reference standard). 36 Notably, WC appears to be the most straightforward and effective measure for assessing visceral fat in clinical and field settings. These findings validate the use of simple anthropometric indices as practical proxies for visceral adiposity.
The Kuwait Wellbeing Study provides particularly valuable insights, as it directly compared the predictive performance of WHR and DXA-derived adiposity indices for prediabetes within the same cohort. 14 The results demonstrated that visceral fat area (VAT) mass achieved the highest area under the curve (AUC) (0.680), followed by the android-to-gynoid fat ratio (0.647) and android fat mass (0.646), whereas WHR showed lower predictive ability. This head-to-head comparison suggests that DXA-derived measures, particularly VAT, may outperform anthropometric indices in identifying prediabetes risk, with VAT showing the highest AUC in both the total sample and sex-stratified analyses. This finding is consistent with a recent study in patients with T2DM, which reported that the visceral fat area-to-hip circumference ratio outperformed WHR in predicting insulin resistance, with sex-specific AUC values of 0.71 in men and 0.69 in women. 37 Furthermore, the Kuwait study also reported that gynoid fat was associated with prediabetes only among males [adjusted prevalence ratio (aPR) Q4 vs. Q1 = 1.71, 95% CI: 1.22–2.41], but not among females (aPR Q4 vs. Q1 = 1.27, 95% CI: 0.90–1.78). 14 In our DXA-based analysis of NHANES 2011–2016 data (n = 2993 U.S. adults), we extended these findings by a sex-stratified approach with full covariate adjustment. Unlike the Kuwait study, which adjusted only for age in sex-stratified analyses, our fully adjusted models (including BMI) revealed that android fat increased the odds of prediabetes in both men and women, whereas gynoid fat was protective only in women (Table 4). In contrast, the positive association reported in Kuwaiti males likely reflects confounding by overall adiposity rather than a true independent effect of gynoid fat.
In contrast to studies relying solely on anthropometric indices such as WHR (including a recent NHANES-based analysis using 2021–2023 data that identified WHR as having the highest discriminatory power among the indices evaluated in the total population and in females), 38 the present study offers several distinct advantages. First, by utilizing DXA data, we achieved precise, depot-specific quantification of android and gynoid fat, whereas WHR serves as a composite proxy that cannot distinguish between distinct fat depots. Second, although WHR demonstrated strong predictive performance in females, our sex-stratified approach using DXA-derived body composition measures further identified a sex-specific pattern of association: Gynoid fat was found to be protective exclusively in women, a finding that a single composite index such as WHR cannot directly explain. These advantages allow us not only to confirm the association between adiposity and prediabetes but also to provide correlational evidence that may inform our understanding of the observed sex differences.
Taken together, evidence from the Kuwait study, our DXA-based analysis of NHANES 2011–2016 data, and the recent NHANES 2021–2023 anthropometric study collectively forms a coherent narrative: While WHR is the best practical screening tool among simple anthropometric measures, DXA-derived visceral and regional adiposity measures show stronger statistical associations with prediabetes by directly quantifying the fat depots—particularly VAT—that are most strongly associated with prediabetes status. Our study further demonstrates that the association between regional adiposity and prediabetes is significantly modified by sex: Android fat is uniformly associated with higher risk, whereas lower levels of gynoid fat are associated with higher risk specifically in women, suggesting a potential protective role of gynoid fat in females.
These findings highlight the potential importance of sex-specific assessment of body fat distribution for early cardiometabolic risk stratification. Our results provide correlational evidence that may inform the refinement of simpler tools—for instance, by supporting the exploration of sex-specific WHR cutoffs—to enhance risk stratification in clinical practice. Taken together, our study further corroborates the sex-specific predictive value of WHR identified in the recent NHANES 2021–2023 analysis by providing correlational evidence consistent with the hypothesized biological basis underlying this sex difference, underscoring the value of the sex-stratified approach we have taken.
This study possesses several key strengths. First, it utilizes a large, nationally representative sample of U.S. adults from NHANES, enhancing the generalizability of our findings. Second, we employed DXA-derived measurements of android and gynoid fat percentage, which provide a more precise and direct assessment of regional adiposity than traditional proxies such as BMI or WC. Most importantly, the ample sample size enabled robust sex-stratified analyses, allowing us to uncover and quantify the pronounced effect modification by sex in the relationship between fat distribution and prediabetes—a nuanced association that has been inadequately explored in prior research.
Several limitations of this study should be acknowledged. First, the cross-sectional design precludes the determination of causal or temporal relationships between adipose tissue distribution, dysglycemia, and dyslipidemia. Longitudinal studies are warranted to establish causality, and mechanistic investigations are needed to elucidate the underlying biological pathways. Second, the DXA eligibility criteria of NHANES excluded individuals exceeding the scanner’s weight or height limits. This may introduce selection bias and limit the generalizability of our fat distribution estimates to individuals with severe obesity. Third, despite adjusting for a comprehensive set of covariates, residual confounding from unmeasured or imperfectly measured factors (e.g., dietary habits, genetic predisposition, or detailed physical activity patterns) cannot be ruled out. Fourth, DXA is more costly and less accessible than simple anthropometric measures such as WHR ratio, limiting its direct applicability in routine clinical settings. Nevertheless, our findings may guide the refinement of sex-specific cutoffs for simpler tools. Last, the operational definitions of android and gynoid regions by DXA, while standardized, are anatomical approximations. They may not fully capture the functional heterogeneity within these depots or correlate perfectly with metabolically distinct visceral and subcutaneous compartments quantified by CT. Future research should prioritize longitudinal assessments using multimodal imaging (e.g., combining DXA with CT/MRI) to track dynamic changes in fat distribution from prediabetes onset and to refine depot-specific diagnostic or prognostic thresholds.
Conclusions
Our study provides robust evidence of a sex-specific and depot-dependent relationship between adipose tissue distribution and prediabetes. We found that higher android fat percentage is a consistent risk factor in both sexes, whereas higher gynoid fat percentage is associated with reduced odds of prediabetes exclusively in women. These findings highlight the importance of considering both sex and fat depot location in cardiometabolic risk assessment and demonstrate the value of DXA in identifying sex-specific patterns of association. Our results provide correlational evidence that may inform the refinement of simpler anthropometric tools (e.g., via sex-specific WHR cutoffs) for risk stratification in clinical practice. Prospective studies are needed to confirm causality and to elucidate the underlying mechanisms.
Ethics Approval and Consent to Participate
This study protocol was approved by the NHANES Institutional Review Board and was performed in accordance with the Declaration of Helsinki, with all NHANES participants providing signed informed consent.
Footnotes
Acknowledgments
The authors would like to thank all the volunteers who participated in the NHANES.
Authors’ Contributions
C.W. and Q.Z. designed the study. C.W., Z.S., Q.Z., and R.Y. extracted the data. C.W. and Z.S. analyzed the data. Z.S. and Q.X. wrote the article. All authors draft the work and revise it critically for important intellectual content, and contribute to the final approval of the version to be published.
Data Availability Statement
Author Disclosure Statement
The authors declared no conflicts of interest.
Funding Information
This research received no specific grant from any funding agency, commercial, or not-for-profit sectors.