
Abstract
Diabetes, a chronic disorder, is showing a rapidly increasing trend globally. India holds the second position in the global diabetes epidemic. The present investigation is an assessment of different anthropometric measurements and their association with type 2 diabetes to determine their diagnostic potential for diabetes as well as its co-morbidities. In this cross-sectional study, we have measured anthropometric parameters and blood biomarkers in subjects with diabetes. We have presented the comparisons of cost- and time-effective anthropometric variable with costly and time-dependent biochemical variables in control and diabetic groups (n = 233/group). Correlations between anthropometric variables and biochemical measurements, as well as the diagnostic utility of anthropometric variables for diabetes, were evaluated. The diagnostic utility of anthropometric variables for diabetes was assessed through receiver operating characteristic (ROC) curves. Neck circumference, sagittal abdominal diameter (SAD), skinfold thickness, and body roundness index (BRI) displayed high specificity and diagnostic utility for diabetes, emphasizing their potential in predicting diabetes and the further development of metabolic syndrome. The study highlights the importance of cost- and time-effective anthropometric assessments in diabetes risk evaluation and calls for further research to elucidate this intricate relationship and develop personalized management strategies.
Introduction
Diabetes is a serious and chronic disease characterized by elevated blood glucose concentration. It is recognized as a serious public health concern with considerable impacts on functional capacities and quality of life, leading to significant morbidities and premature mortality. 1 In 2017, around 462 million individuals were affected by type 2 diabetes, corresponding to almost 6.28% of the world’s population, or a prevalence rate of 6,059 cases per 100,000. 1 Further, according to the Global Burden of Diseases, Injuries, and Risk Factors Study (GBD) 2019, diabetes was found to be the eighth leading cause of death and disability in the world. 2 In India as well, the burden of diabetes is increasing in leaps and bounds in both urban and rural areas with India ranking after China in the global diabetes epidemic. 3
The two most common forms of diabetes are type 1 and type 2 diabetes. Type 1 often develops in childhood, while type 2 diabetes has a strong genetic component and a robust association with obesity and lifestyle. There are two primary problems in type 2 diabetes. First, the pancreas is not able to produce enough insulin, and second, the cells respond poorly to insulin (a condition called insulin resistance). Insulin is a hormone that regulates the movement of sugar into the cells and hence is important for the metabolism of carbohydrates, proteins, and lipids in the body. Resistance to insulin by the body cells stems from decreased signaling in the insulin receptor substrate/phosphoinositide-3-kinase/protein kinase B axis, impacting the metabolic effects of insulin. 4 When the body does not respond to insulin, the insulin-producing beta-cells become exhausted and ultimately stop working. Insulin resistance, hence, denotes the body’s diminished ability to effectively use insulin, resulting in elevated blood glucose levels, and has emerged not only as a precursor to diabetes mellitus but also as a pivotal component of metabolic syndrome. 5 This condition, often intertwined with excess adiposity, serves as a harbinger of various metabolic disturbances, including cardiovascular diseases, fatty liver disease, and dyslipidemia.
In recent decades, there have been several studies that report a number of invasive and non-invasive procedures for predicting diabetes and associated problems such as fat accumulation, development of hypertension, and obesity. Anthropometrics, encompassing physical measures of an individual’s size and form obtained without advanced equipment, still provide an accessible method to estimate disease risk factors. There are several benefits to anthropometrics, such as their being non-invasive and requiring less time and minimum expertise for recording with fewer chances of error. Being non-invasive, anthropometric assessment is also often preferred by patients. 6 It is also cost-effective, as anthropometrics does not require any high-end apparatus and can be performed using basic tools like measuring tapes, weighing balances, etc. While body mass index (BMI) is a widely used anthropometric measure, other measures like waist circumference and skinfold thicknesses measured using calipers offer cost-effective options applicable to large populations without imposing substantial costs or medical burdens. The challenge lies in identifying anthropometric measures that best capture the type of adiposity predictive of disease.7,8 A myriad of anthropometric indices, such as body roundness index (BRI), waist-to-hip ratio (WHR), and A Body Shape Index (ABSI), are employed to assess diabetes, obesity, cardiovascular risk, and metabolic syndrome. 9 These indices, along with indirect markers of insulin resistance like the Homeostasis Model Assessment for IR (HOMA-IR) form a comprehensive toolkit for evaluating the intricate relationship between diabetes, obesity, and insulin resistance. 10 Recognizing the economic feasibility and widespread accessibility of anthropometric measurements in various clinical settings, this study aims to compare different anthropometric measurements between normal and diabetic subjects and evaluate the potential of these indices for predicting diabetes and its associated co-morbidities, such as obesity and other cardiovascular diseases. The findings from this study may pave the way for more effective and accurate management of these complex conditions.
Methods
Study population
The present investigation was a cross-sectional study carried out collectively at the Department of Physiology and the Departments of Medicine and Biochemistry at King George’s Medical University (KGMU) in Lucknow, Uttar Pradesh, India. The study participants were recruited from the Medicine outpatient department (OPD) of KGMU, Lucknow, after obtaining ethical clearance from the Institutional Ethics Committee under Protocol No. 125th ECMIB/P3. Informed consent was secured from all participating patients. Subject recruitment and sample collection were done between September 2023 and December 2023. The study design was strategically conceived as a one-time cross-sectional analysis, eliminating the need for follow-up assessments. The participant cohort comprised a total of 233 cases and 233 controls. Cases were recruited from the Medicine OPD of KGMU, Lucknow, and controls were recruited from the general population coming for routine check-ups.
Sample size
The sample size was calculated as follows. If n is the sample size required per formula, and n1 is the sample size for cases (group 1) and n2 is the sample size for controls (group 2), then n2/n1 = k = 1.


Here, p1 and p2 = proportions (incidence) of groups 1 and 2, Δ = |p2−p1| = absolute difference between two proportions, n1 = sample size for group 1, n2 = sample size for group 2, α = probability of type I error (usually 0.05), β = probability of type II error (usually 0.05) and z = critical Z value for a given α or β. Hence, the sample size for groups 1 and 2 was 222, each (Total (n) = n1+n2 = 444). The following study parameters were considered. Alpha and beta were set at 0.05 with a power of 0.95. A 5% washout rate during the study was considered. Thus, the total sample size was 233 in each group. 11 The present study, hence, included a total of 444 subjects who were categorized into two categories: control and diabetic.
Inclusion and exclusion criteria
All patients with type 2 diabetes of any age group were included as cases (diabetic), and apparently healthy subjects were included as controls. Patients with type 1 diabetes, or with any known endocrinal, renal or nutritional disorder or any known anatomical deformity that could interfere with anthropometric data, and pregnant females were excluded from the study.
Anthropometry
The anthropometric measurements were taken as per standard protocols routinely followed in our laboratory. 5 We measured height and weight using standard techniques as proposed by Jelliffe et al. 12 Briefly, weight was measured on a portable scale before a meal, with the participants wearing minimal and lightweight clothing. The portable scale was placed on a flat surface and adjusted for zero balance. Body weight was recorded to the nearest 0.1 kg. For height measurement, a rigid stadiometer was used, capturing the measurement to the nearest centimeter while participants were barefoot and wearing minimal clothing to allow for clear posture observation. Additionally, BMI was calculated using the formula BMI = weight/height^2, expressed in kilograms per square meter.
Neck circumference was measured just below the laryngeal prominence, perpendicular to the long axis of the neck, to the nearest 0.1 cm. Participants were required to stand upright with relaxed shoulders, and a standard flexible, inelastic measuring tape was used. 13 Hip circumference was measured at the widest point over the great trochanter using a standard measuring tape. Waist circumference, following WHO recommendations, was measured with the subject standing after a regular expiration, to the nearest centimeter midway between the lowest rib and the iliac crest.
The sagittal abdominal diameter (SAD) was recorded with participants in a supine position and their knees bent, utilizing a standardized sliding beam caliper at the highest point of the abdomen. Skinfold thickness was measured using the Harpenden skinfold caliper. The skinfold, located approximately 2.0 cm above the measurement mark, was grasped between the thumb and index finger. The caliper’s jaws were then placed perpendicular to the length of the fold, and the handle of the caliper was released to apply full tension on the fold for approximately 3 sec. During this time, the needle on the caliper dial settled into a final position, representing the true thickness of the fold. To prevent errors due to parallax, the caliper dial was read at eye level, and thickness was measured to the nearest tenth of a millimeter (0.1 mm). 14
Furthermore, the ABSI was calculated using the formula:
ABSI = waist circumference/BMI ^2/3 × height^1/2. 15
This index provided additional insights into the relationship between waist circumference, BMI, and height in assessing body shape.
In 2013, Thomas et al.
16
developed another index termed the BRI, which is calculated using the following equation:
BRI values range from 1 to 16, and rounder individuals tend to have larger values. 16
Biochemical assays
For the collection of blood samples, a small area around the antecubital vein was cleansed using rectified spirit. Then, 3 mL of venous blood was drawn using a disposable syringe. The collected blood sample was transferred either to a serum vial for insulin estimation or to a fluoride vial for glucose estimation. For serum collection, the blood was allowed to clot for 10 min at room temperature and was then subjected to centrifugation at 5000 rpm. For plasma extraction, whole blood was collected into centrifuge tubes containing an anticoagulant and promptly centrifuged at 5000 rpm after collection.
Serum insulin levels were assessed using the insulin enzyme immunoassay kit (EIA-2935, DRG International, Inc. USA) following the manufacturer’s protocol. Briefly, 25 µL of each standard, control, and sample was added into appropriate wells and mixed with 25 µL of enzyme conjugate. The plate was then incubated at room temperature for 30 min. After three washes with the provided wash solution, 50 µL of enzyme complex was added to each well, and the plate was again incubated at room temperature for 30 min. Similarly, after three washes, 50 µL of substrate solution was added to each well, and the plate was incubated at room temperature for 15 min. The reaction was stopped by adding 50 µL of stop solution to each well. The plate containing the samples was read at 450 nm using a Spectra Max M2 microplate reader (Molecular Devices, San Jose, CA, USA). The analytical sensitivity for this assay was 1.76 µIU/mL.
For fasting blood glucose (FBG) estimation, a mono-reagent glucose estimation kit (Proton Biologicals India Pvt. Ltd., Bangalore, India) was employed in adherence to the manufacturer’s protocol. It was an endpoint type of reaction where separate wells were labeled as blank, standard, and test wells. Glucose reagent (10 µL each) was added to all three types of wells. In the standard well, 10 µL of glucose standard solution (concentration, 100 mg/dL) was added. The test samples were added to test wells. The plate was incubated at 37°C for 10 min and then read at 505 nm with a Spectra Max M2 microplate reader. The final concentration of glucose in mg/dL was calculated using the formula:

Calculation of HOMA-IR (homeostasis model assessment of insulin resistance)
HOMA-IR, or the Homeostasis Model Assessment of Insulin Resistance, is a robust index employed for the assessment of insulin resistance. 10 For the calculation of HOMA-IR, the product of FBG levels and insulin levels is divided by 405. Here, the concentration of insulin is reported in µU/mL, and that of glucose is reported in mg/dL. The thresholds for HOMA-IR may exhibit variations among different populations due to race, age, gender, existing medical conditions, and complications. Tang et al. 17 have provided comparative cut-off values for HOMA-IR ranging from 1.7 to 3.8 for healthy individuals in different populations.
Statistics
The statistical analysis was conducted using GraphPad Prism software (Version 5.0, GraphPad Software, Inc., San Diego, CA, USA). All the data were presented as mean ± SD. To examine the differences between the pre-diabetic and diabetic groups, the Student’s unpaired t-test was employed. Pearson’s correlation coefficient was calculated to explore the relationships between different measurements of interest. Receiver operating characteristic (ROC) curves evaluated classification model performance by illustrating the trade-off between sensitivity and specificity, where sensitivity reflects the proportion of true positives, while specificity indicates the proportion of true negatives.
Results
Demographic parameters
Table 1 summarizes the demographic details of the study groups. Here, we compared the data on age, gender, marital status, and socio-economic status of the subjects in two groups. The age distribution was similar (P = 0.113, Student’s t-test), with a mean age of 42.09 ± 19.87 years in the control group and 43.76 ± 20.16 years in the diabetic group (Table 1). The gender distribution (P = 0.525, Student’s t-test), marital status (p = 0.275, Student’s t-test), and socio-economic status (P = 0.158, Student’s t-test) showed no significant difference between the two groups. These results suggest demographic comparability between the control and diabetic groups.
Demographic Parameters

*P < 0.05 was considered statistically significant.
Anthropometric parameters
There were significant differences in several anthropometric parameters when compared between the controls and diabetics. A tabulated comparison is given in Table 2. Briefly, no differences were observed in the weight and height between control and diabetic subjects (Fig. 1), but the mean BMI was notably higher in the diabetic group (32.01 ± 1.41 kg/m2) compared to the control group (28.13 ± 1.43 kg/m2, P < 0.0001, Student’s t-test, Fig. 1). Neck, waist, and hip circumference were also significantly higher in the diabetic group (P = 0.010, P = 0.006, and P = 0.046, respectively, Fig. 1) as compared to the controls. Further, the SAD (P = 0.022, Student’s t-test, Fig. 2) and skin fold thickness (P = 0.027, Student’s t-test, Fig. 2) were found to be significantly higher in the diabetic group, while there were no differences in the waist-to-hip or waist-to-height ratio (Fig. 2). In terms of body shape indices, the diabetic group had a slightly higher mean ABSI (P = 0.027, Student’s t-test; Fig. 2), and BRI (P = 0.035, Student’s t-test, Fig. 2). Biochemical measurements revealed that the diabetic group had higher insulin levels (P = 0.041, Student’s t-test; Table 2, Fig. 2), mean FBG (P < 0.0001), and HOMA-IR (P < 0.0001; Fig. 2).
Mean ± SD (n = 233/group) of weight, height, BMI, neck circumference, waist circumference, and hip circumference of subjects in control and diabetic groups. The group means were compared using Student’s t-test. For significance, alpha was set at 0.05. SD, standard deviation; BMI, body mass index.
Mean ± SD (n = 233/group) of SAD, skinfold thickness, ABSI, WHR, waist-to-height ratio, BRI, insulin, FBG, and HOMA-IR. The group means were compared using Student’s t-test. For significance, alpha was set at 0.05. SD, standard deviation; ABSI, A Body Shape Index; BRI, body roundness index; HOMA-IR, homeostasis model assessment of insulin resistance; WHR, waist-to-hip ratio; FBG, fasting blood glucose; SAD, sagittal abdominal diameter.
Anthropometric Parameters between Diabetic Patients and Control Groups
The Student’s t-test was used to calculate the P value.
*P < 0.05 was considered statistically significant.
BMI, body mass index; NC, neck circumference; WC, waist circumference; HC, Hip circumference; SAD, sagittal abdominal diameter; SFT, skinfold thickness; ABSI, A Body Shape Index; WHR, waist-to-hip ratio; BRI, body roundness index; FBG, fasting blood glucose; HOMA-IR, Homeostasis Model Assessment of Insulin Resistance.
We further compared the distribution of different parameters in our study population and found that among the individuals with diabetes, 50.4% were found to be overweight and 32.4% were categorized as obese. These values were significantly different from those of the control group, where 41.8% were found to be overweight (P = 0.0004, Student’s t-test) and 25.8% were obese (P = 0.0008, Student’s t-test; Table 3). It is important to note that the diabetic group had almost 83% of individuals who were either overweight or obese. Further, we found that 70.49% of the diabetic individuals had abnormally high waist circumference, as compared to 59.8% of the controls (P = 0.013; Table 3). Similarly, the SAD was found to be abnormally high in 82.4% of diabetics as compared to 69.3% of control individuals (P = 0.0008; Table 3). We, however, did not find any significant change in the WHR and neck circumference between the two groups (Table 3).
Distribution of Different Anthropometric Parameters Among Diabetic Patients and Control Groups

*P value < 0.05 was considered statistically significant.
BMI, body mass index; NC, neck circumference; WC, waist circumference; WHR, waist-to-hip ratio; SAD, sagittal abdominal diameter; OR, odds ratio; CI, confidence interval.
Correlations between anthropometric variables and biochemical measurements
We found a positive correlation of neck circumference with BMI (r = 0.714, P < 0.0001) and waist-to-height ratio (r = 0.732, P < 0.0001; Table 4), FBG (I = 0.261, P < 0.0001), WHR (r = 0.195, P = 0.007), and HOMA-IR (r = 0.161, P = 0.035; Fig. 3). SAD and subcutaneous fat thickness (SFT) showed positive correlations with BMI (r = 0.440 and r = 0.581, respectively, P < 0.0001) and waist-to-height ratio (r = 0.536 and r = 0.609, respectively, P < 0.0001). SFT also showed a moderate positive correlation with FBG (r = 0.260, P < 0.0001) and HOMA-IR (r = 0.180, P = 0.019; Fig. 3). ABSI showed a moderate positive correlation with BMI (r = 0.257, P < 0.0001), WHR (r = 0.260, P < 0.0001), waist-to-height ratio (r = 0.721, P < 0.0001), insulin (r = 0.295, P < 0.0001), and FBG (r = 0.479, P < 0.0001). BRI showed a strong positive correlation with BMI (r = 0.799, P < 0.0001) and waist-to-height ratio (r = 0.998, P < 0.0001) and a moderate positive correlation with WHR (r = 0.224, P = 0.002), FBG (r = 0.412, P < 0.0001), and HOMA-IR (r = 0.215, P = 0.005; Table 4, Fig. 3).
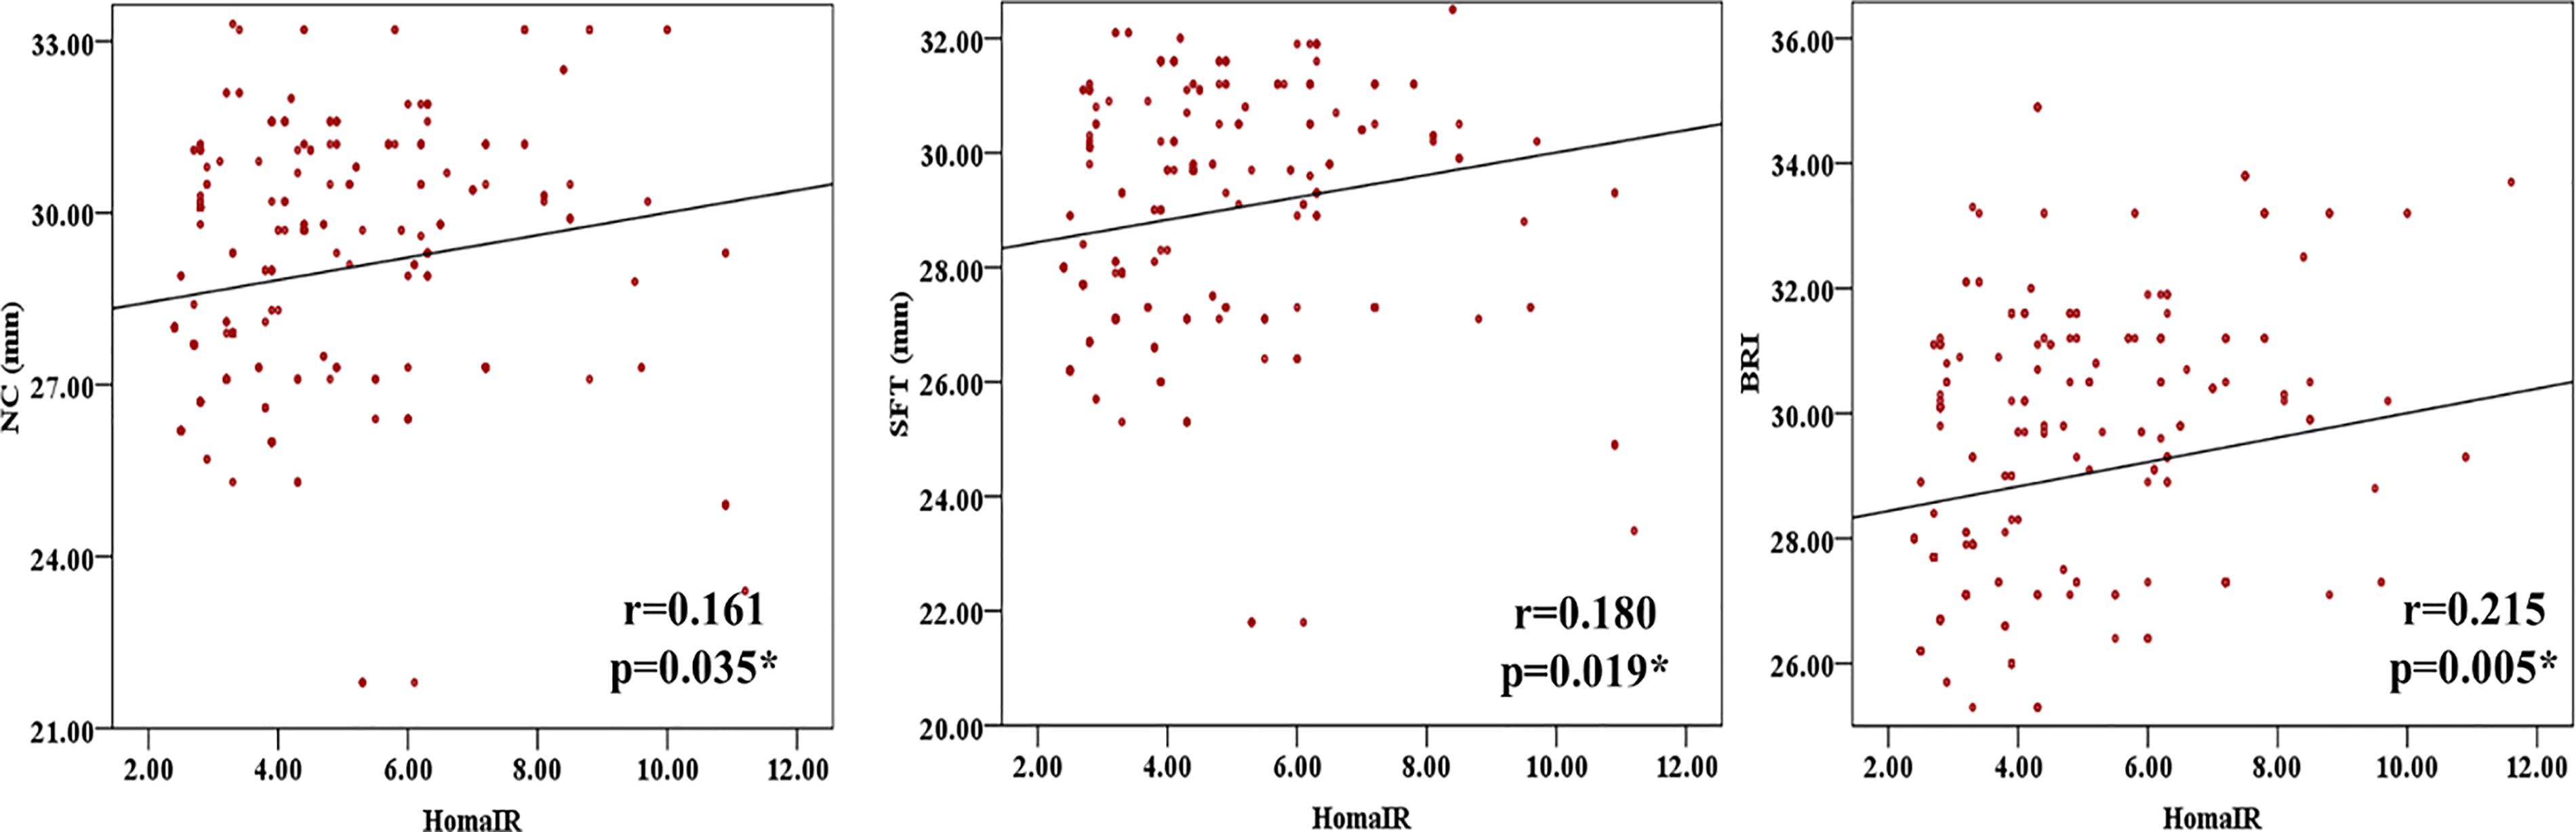
Scatter plots with Pearson’s correlation coefficient (r value), and significance level (P value) to show the relationship between the parameters as indicated on the X and Y axis. A solid line in the scatter plots denotes linear regression between the two parameters being tested.
Correlation Between Anthropometric Parameters and Diabetic Markers
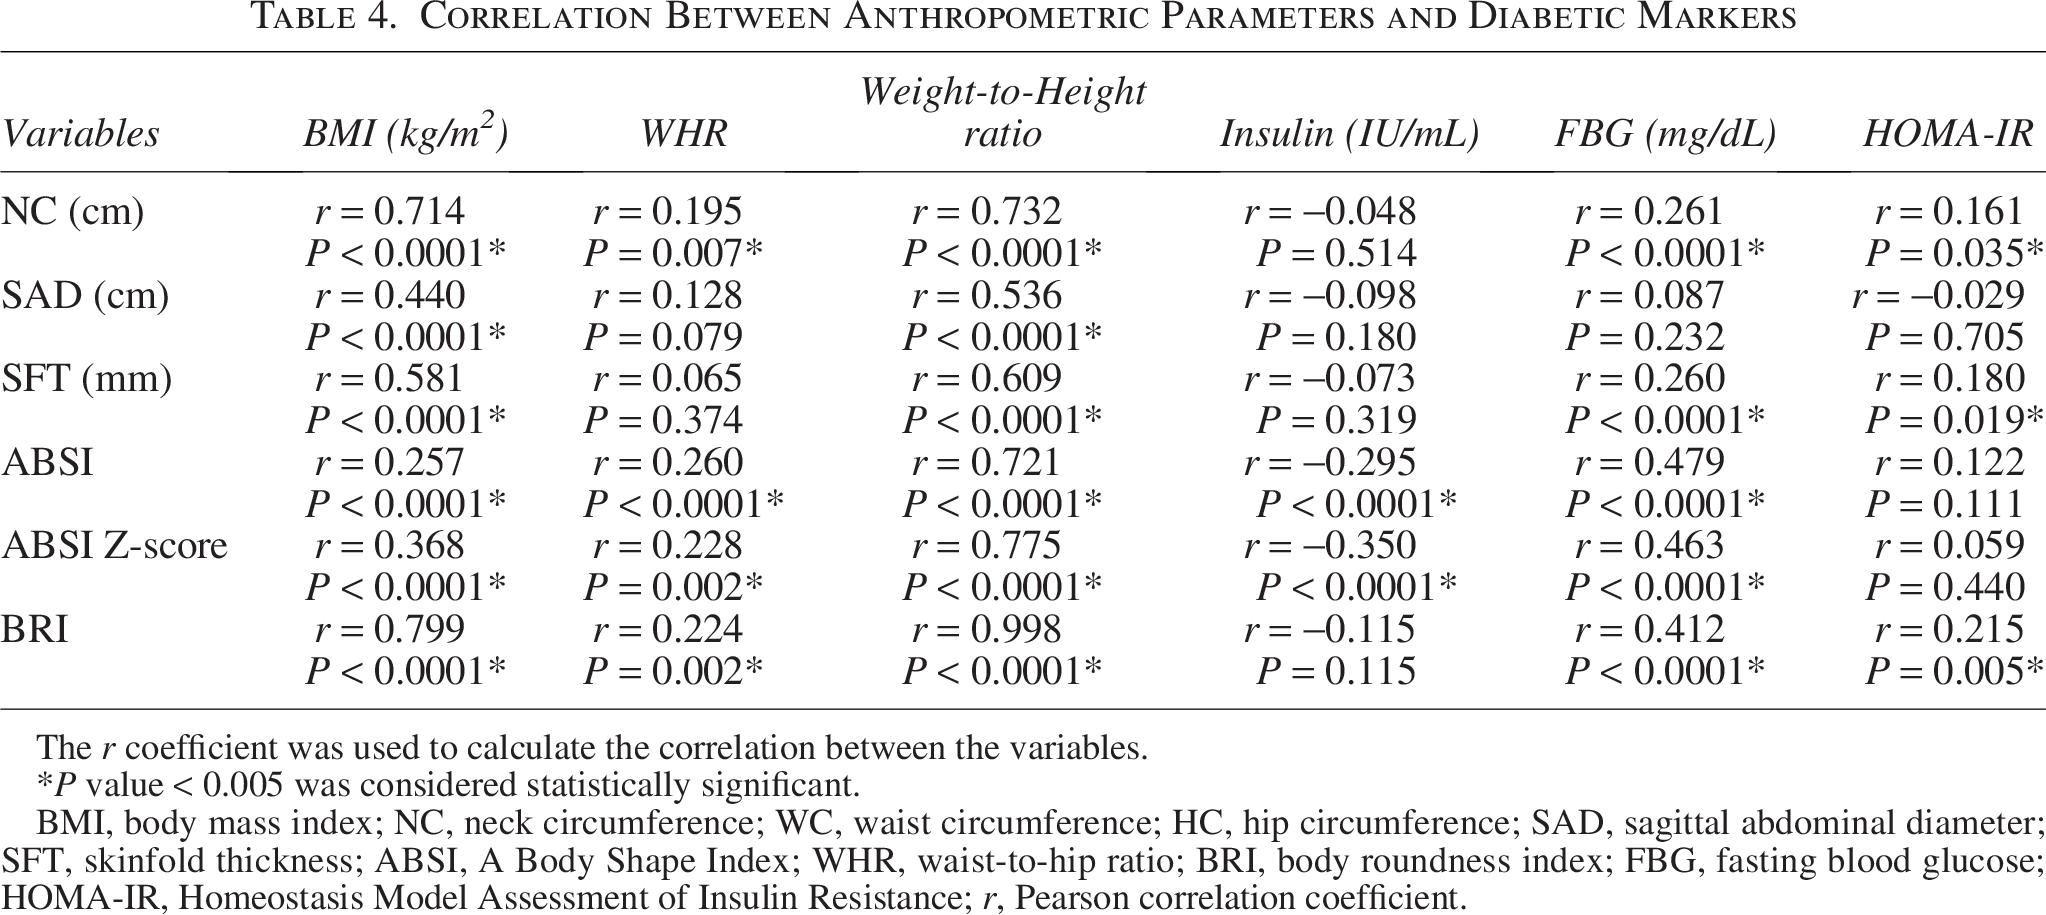
The r coefficient was used to calculate the correlation between the variables.
*P value < 0.005 was considered statistically significant.
BMI, body mass index; NC, neck circumference; WC, waist circumference; HC, hip circumference; SAD, sagittal abdominal diameter; SFT, skinfold thickness; ABSI, A Body Shape Index; WHR, waist-to-hip ratio; BRI, body roundness index; FBG, fasting blood glucose; HOMA-IR, Homeostasis Model Assessment of Insulin Resistance; r, Pearson correlation coefficient.
Diagnostic utility of anthropometric variables for diabetes
Neck circumference demonstrated a strong diagnostic utility in predicting diabetes, with a sensitivity of 98.0% and a specificity of 69.6% (Table 5, Fig. 4). This was based on a cut-off value derived from an area under the curve (AUC) of 0.741 (95% confidence interval [CI]: 0.620–0.862, P < 0.0001). SAD showed a moderate diagnostic utility, with a sensitivity of 89.0% and a specificity of 83.0%, based on a cut-off value derived from an AUC of 0.629 (95% CI: 0.490–0.768, P = 0.045). SFT demonstrated a strong diagnostic utility, with a sensitivity of 97.0% and a specificity of 56.0%, based on a cut-off value derived from an AUC of 0.817 (95% CI: 0.725–0.909, P < 0.0001; Fig. 4). ABSI showed a moderate diagnostic utility, with a sensitivity of 91.1% and a specificity of 70.0%, based on a cut-off value derived from an AUC of 0.601 (95% CI: 0.457–0.745, P = 0.116). BRI demonstrated a strong diagnostic utility, with a sensitivity of 91.0% and a specificity of 57.0%, based on a cut-off value derived from an AUC of 0.708 (95% CI: 0.591–0.826, P = 0.001).

ROC curves between sensitivity and 1-specificity of different anthropometric parameters, i.e., NC, SAD, SFT, ABSI, BRI, and ROC. NC, neck circumference; SAD, sagittal abdominal diameter; SFT, skinfold thickness; ABSI, A Body Shape Index; BRI, body roundness index; ROC, receiver operating characteristic.
Cut-off Values, Sensitivity, and Specificity for Different Anthropometric Measures
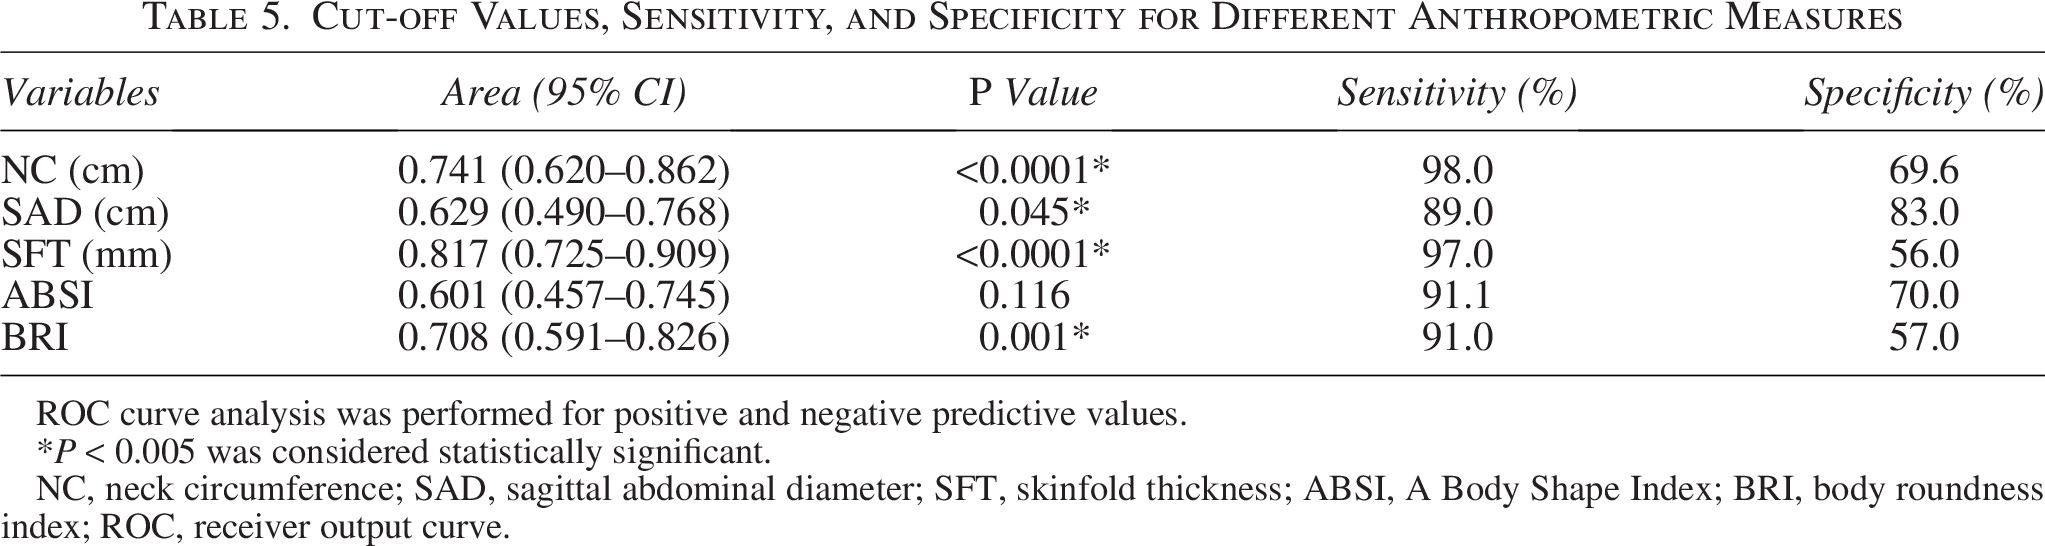
ROC curve analysis was performed for positive and negative predictive values.
*P < 0.005 was considered statistically significant.
NC, neck circumference; SAD, sagittal abdominal diameter; SFT, skinfold thickness; ABSI, A Body Shape Index; BRI, body roundness index; ROC, receiver output curve.
Discussion
This study evaluated multiple anthropometric and biochemical parameters in individuals diagnosed with type 2 diabetes and non-diabetic controls. Although body weight and height did not differ significantly between groups, BMI was higher in subjects with diabetics, as compared to controls. This finding is consistent with the widely recognized association between excess adiposity and impaired glucose regulation. Chan et al. 18 , in a study on U.S. population, evaluated 51,529 males and suggested that a BMI greater than 35 kg/m2 was associated with an increased risk of developing type 2 diabetes compared to those with BMIs lower than 23 kg/m2 suggesting that obesity increases the risk for diabetes. Several other studies have also noted that the prevalence of pre-diabetes, as well as the risk of conversion to diabetes, is substantially higher in obese individuals when compared to normal weight adults. 19
At the same time, BMI has a known limitation because it does not distinguish lean mass from fat mass and does not take into account the regional fat accumulation. Individuals with similar BMI values may differ considerably in visceral adiposity, muscle mass, and cardiometabolic risk. 20 For this reason, reliance on BMI alone may underestimate risk in some individuals while overestimating it in others. These concerns have encouraged the use of other anthropometric measures that more directly reflect body fat distribution.
In the present study, we have compared several anthropometric parameters and found greater neck circumference, waist circumference, hip circumference, SAD, and skinfold thickness in individuals with diabetes. These findings suggest that central and upper body adiposity are more pronounced in subjects with diabetes. 21 Waist circumference has frequently been reported to have predictive value for type 2 diabetes, as reported in several populations such as British women, 22 and Indian men and women. 23 Our findings also support the clinical relevance of waist circumference.
Interestingly, we did not find any increase in waist-to-hip or waist-to-height ratio between controls and diabetics in our study population. Other studies have suggested a similar predictive power of BMI, waist circumference, waist-to-height ratio, and WHR for type 2 diabetes. 24 Ratios can sometimes mask clinically meaningful changes when both numerator and denominator increase proportionally. Population structure, sex composition, body frame, and sample size may also influence the performance of such indices. These results emphasize that ratios, particularly BMI, waist-to-height ratio, and WHR, do not perform uniformly across all settings.
We also examined ABSI and BRI and found that these indices were greater in diabetics as compared to controls. As per a study conducted on 6,990 hypertensive adults without diabetes in China, of whom 816 developed diabetes during the study period, a dynamic increase in BRI was associated with an increased risk of developing diabetes, whereas its reversal was associated with a reduced risk. 25
Correlation analysis further demonstrated a positive relationship between the two most important blood parameters relevant to type 2 diabetes, FBG and HOMA-IR, and anthropometric measures, particularly neck circumference, skinfold thickness, and BRI. The positive correlation suggests that these parameters may hold good diagnostic utility for diabetes. Neck circumference may capture upper body fat, which is linked to free fatty acid flux and insulin resistance. Skinfold thickness provides a direct estimate of subcutaneous adiposity, while BRI reflects the total roundness and abdominal fat burden. These parameters can thus be applied to predict metabolic syndrome in several populations, including overweight/obese individuals, diabetic individuals, and post-menopausal women. 26
To make conclusive predictions on their diagnostic utility, anthropometric variables for diabetes were assessed through ROC curves. Neck circumference showed strong diagnostic utility with high sensitivity and specificity, suggesting its usefulness as a rapid screening measure. SAD, skinfold thickness, and BRI also demonstrated good diagnostic utility. Previous findings have also reported the predictive potential of neck circumference.27,28 In contrast, ABSI was the only index that did not perform well and was the weakest predictor of insulin resistance in our study. Previous studies have reported similar findings, where the lowest AUC or the lowest odds ratio for insulin resistance was associated with ABSI. 29 Our results suggest that its value in this population is limited. Amongst all tested parameters, skinfold thickness yielded the maximum AUC in the ROC curve, indicating strong potential as a marker of metabolic risk in this cohort. Previous studies by Mensink et al. 30 and Chei et al. 31 also support this finding.
Several strengths of this study are that the participants were recruited from a relatively uniform geographic location, coming from the same location with similar lifestyle, culture, and eating habits, which may reduce confounding from major lifestyle differences. Furthermore, anthropometric measurements were conducted systematically, and biochemical assessments allowed direct comparison with clinically relevant markers. However, limitations should also be acknowledged. The cross-sectional design prevents causal inference, and the temporal relationship between adiposity markers and diabetes cannot be established. The sample size, while carefully calculated, may limit the generalizability of the findings. Furthermore, the inclusion of only type 2 diabetes patients may restrict the broader applicability of these results to other forms of dysglycemia.
Implications and Future Perspectives
Overall, the findings indicate the significance of anthropometric measures, i.e., neck circumference, SAD, skinfold thickness, and BRI, in predicting diabetes and related metabolic risk. These parameters not only are easy to record, non-invasive, and require less time and basic skills for measurement but also are cost-effective and often preferred by the patients. 6 Furthermore, the simplicity of anthropometric measurements makes them accessible for both health care providers and patients. The research contributes to the understanding of complex conditions associated with diabetes, obesity, and insulin resistance, paving the way for more effective management strategies. Further research, including randomized controlled trials, is imperative for a comprehensive grasp of this intricate relationship. The study’s implications extend to clinical practice, emphasizing the importance of incorporating anthropometric assessments alongside traditional biochemical markers in diabetes risk evaluation. Future research could explore longitudinal studies to establish causality and evaluate the effectiveness of interventions targeting specific anthropometric parameters. Additionally, investigating the impact of cultural and regional variations on these associations may contribute to personalized approaches in diabetes prevention.
Authors’ Contributions
S.V., R.T., N.V., and S.S. designed the study; S.V. carried out sampling and assays; S.V., S.S., and A.K.V. analyzed the data and prepared figures; N.V. and A.M. interpreted the data; S.V. and R.T. wrote the article; and all authors approved the final version of the article.
Footnotes
Acknowledgments
The authors thank Dr. Aakansha Sharma, University of Lucknow, for reading the final draft of this article and for her insightful comments.
Author Disclosure Statement
No competing financial interests exist.
Funding Information
A grant from