
Abstract
Background:
There are few objective tools to quantify lymphatic disease changes in anatomy and physiology of affected tissues. Tissue sodium could be a relevant physiological indicator of lymphatic disease. However, the importance of sodium to lymphatic physiology in humans has not been well-characterized nor exploited for clinical applications due to a lack of imaging methods to observe sodium and lymphatics together in vivo. The purpose of this study was to apply 23Na-MRI to measure tissue sodium content (TSC) in human subjects with or without lower extremity lymphedema (LEL) and investigate the relationship between lymphatic dysfunction and tissue sodium.
Methods and Results:
A prospective, cross-sectional observational clinical trial enrolled participants with LEL and controls without lymphedema. 23Na-MRI measured standardized TSC in the mid-calf. For each leg with lymphedema, clinical stage was determined by a licensed clinician, and lymphedema severity was determined by radiology assessment of noncontrast hydrogen (1H)–magnetic resonance lymphangiography (MRL). Linear mixed-effects models determined differences in TSC between cases and controls and measured the association of TSC with clinical stage and lymphedema severity. Image subregions were analyzed to observe spatial patterns of TSC involvement. Results found that TSC was nearly 50% higher in lymphedema (n = 52 legs) in the skin (1.51-fold) and adipose tissue (1.47-fold) compared with controls (n = 31 legs; p < 0.001) and was directly related to both clinical stage and lymphedema severity by 1H-MRL in the skin (p < 0.001) and adipose tissue (p < 0.001). TSC accumulated in patterns in the anterior subcutaneous adipose tissue, increasing with disease severity.
Conclusion:
23Na-MRI demonstrates that standardized TSC is distinctly elevated in lymphedema, sensitive to lymphedema disease severity, and a potential objective imaging tool for evaluating lymphedema in future clinical trials.
Keywords
Introduction
Lymphedema burdens the quality of life for over 10 million affected individuals.1,2 In cancer survivors, lymphedema is the most common comorbidity, with an estimated 27%–41% of women with gynecological cancers or pelvic malignancies developing secondary leg lymphedema.3,4 Primary lymphedema can also arise from congenital malformation of lymphatic vessels and disproportionately affects females. 5 In both etiologies, there is an identified source of lymphatic impairment that leads to sustained lymph stasis, causing eventual chronic limb swelling, tissue fibrosis, and inflammation. Lymphedema of the extremities often manifests in the skin in early disease and progresses to adipose tissue changes as the disease advances.6,7 There are limited objective tools to quantify lymphatic disease changes in anatomy and physiology of affected tissues.
Sodium appears to be an important aspect of lymphatic physiology. Preclinical research demonstrated that lymphatic capillaries grow in a tissue microenvironment of excess sodium,8–10 and lymphatics clear tissue sodium with immune cell participation.11,12 However, the importance of sodium to lymphatic physiology in humans has not been well-characterized nor exploited for clinical applications due to a lack of imaging methods to observe sodium and lymphatics together in humans. 13
Sodium (23Na)-MRI is a noninvasive molecular imaging technique that can quantify tissue sodium content (TSC) in the extremities. 14 23Na-MRI has already demonstrated high TSC in edematous adipose tissue of patients with lipedema.15,16 It can be applied in series with nontracer-based 1H–magnetic resonance lymphangiography (MRL), which can identify patterns of extravascular edema in lymphatic disease.17,18 The purpose of this study was to apply 23Na-MRI together with 1H-MRL to measure TSC in human subjects with or without lower extremity lymphedema (LEL) and report the relationship between lymphatic disease severity and tissue sodium.
We tested the hypothesis that TSC accumulates in legs with lymphedema compared with contralateral limbs and limbs from controls without lymphatic disease. Upon finding that TSC levels are significantly higher in legs with lymphedema, we tested the hypothesis that TSC increases with the severity of lymphedema. Severity was defined by clinical stage and MRL-based lymphedema severity. We observed spatial variation in TSC accumulation in leg lymphedema and further partitioned each leg into anatomical subregions to analyze TSC patterns. Results show that skin and subcutaneous adipose tissue increase with disease severity and edema severity and accumulate in distinct anatomical locations in legs affected by lymphedema.
Materials and Methods
Recruitment
This observational clinical trial was registered (NCT#05242900) and approved by the Institutional Review Board (VUMC #202424, #210181). Recruitment for this prospective, cross-sectional study of participants with LEL and without lymphatic disease (controls) was carried out from May 2020 to August 2024. Written consent was obtained electronically through REDCap. 19 Study design and inclusion and exclusion criteria are reported in Figure 1.
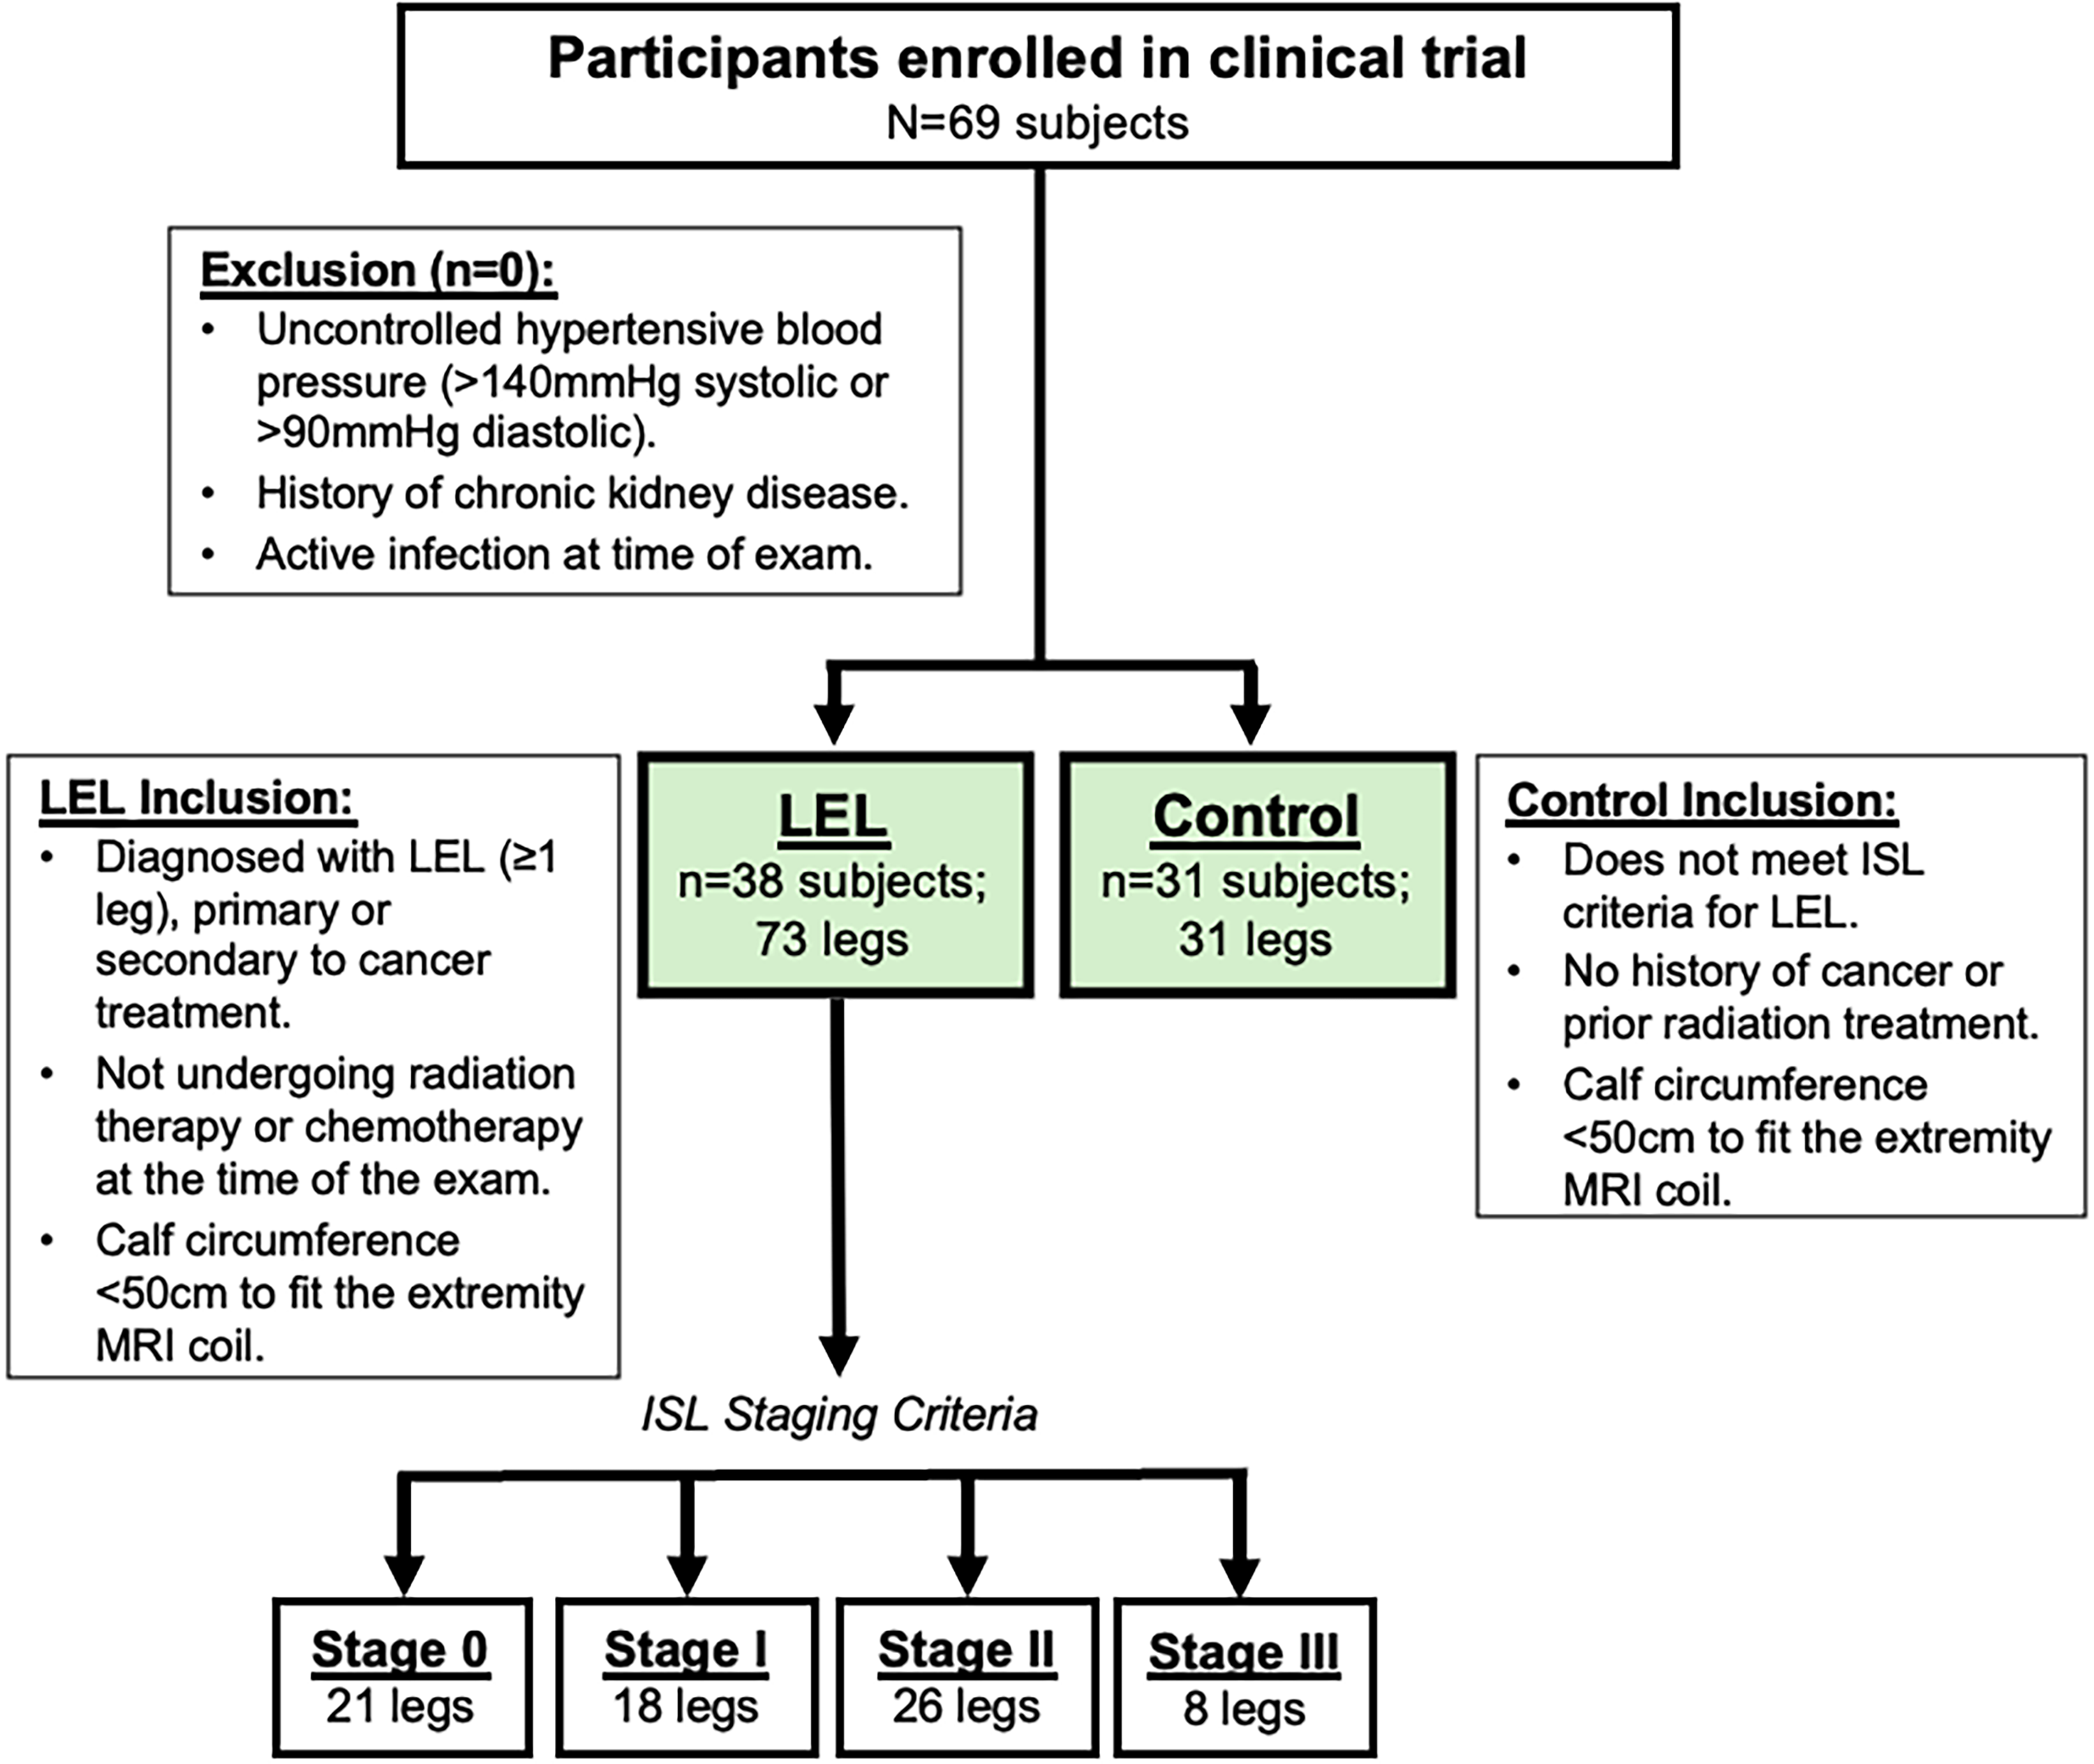
Study design flow chart. Participants enrolled (N = 69) in the prospective, observational clinical trial (NCT#05242900) were 38 subjects with lower extremity lymphedema (LEL) and 31 control subjects. 23Sodium-MRI images were acquired in each leg separately for participants with lymphedema (n = 73 legs) and in a single leg in controls (n = 31 legs). Legs with lymphedema were further categorized by clinical lymphedema stage based on evaluation by a licensed clinician (International Society of Lymphology [ISL] 2020 Criteria, Stages 0, I, II, and III).
Biophysical exam
In participants with LEL, each leg was evaluated independently using the International Society of Lymphology (ISL) stage criteria (Supplementary Table S1). 6 Staging was performed by a Lymphology Association of North American-certified physical therapist (P.M.C.D., 13+ years of experience) or was determined via the participants’ electronic health records. Height, weight, and bioimpedance spectroscopy (L-Dex U-400, ImpediMed Inc.) were also measured.
Multinuclear MRI exam
Participants with LEL received imaging in both legs, while only one leg was scanned in controls. The multinuclear MRI workflow can be visualized in Supplementary Fig. S1.
Subjects were positioned supine, feet-first, in a 3.0 T MRI (Ingenia, Philips Healthcare) equipped for 23Na/1H imaging. 23Na-MRI was performed at the widest part of the calf using a single-tuned transmit/receive 23Na extremity coil (Rapid Biomedical GmbH). Inside the coil, the calf rested upon a platform with four sodium solutions (10, 20, 30, and 40 mmol/L). Fat-water Dixon 1H-MRI scans were acquired in series with 23Na-MRI for anatomical reference.
Participants were scanned in a similar position with a 1H anterior torso coil placed over the distal lower extremities. Nontracer MRL was acquired bilaterally in the same region using previously published sequence parameters.18,20 Imaging protocols are found in Supplementary Table S2.
Sodium (23Na)-MRI analysis
23Na-MRI magnitude signal intensity was fit voxel-wise with a linear calibration of mean signal intensity in sodium solutions to calculate standardized TSC maps. Three regions of interest (ROIs) were manually segmented from the fat-water images: skin, subcutaneous adipose tissue (SAT), and skeletal muscle. ROIs were applied to the standardized TSC maps to calculate mean TSC for each ROI (units: millimoles per Liter; mmol/L). Cross-sectional area of each ROI (mm2) and leg circumference (cm) were also determined for leg composition measurements.
Radiological scoring of MRL
Three radiologists (Y.L. board-certified, 18 years of experience; A.O. resident, 3 years of experience; and N.N. resident, 3 years of experience) rated subcutaneous edema and lymphatic vessel qualities indicative of lymphedema in MRL scans. Each radiologist, blinded to stage, viewed an axial image and coronal maximum intensity projection, providing a score for each leg individually (MRL lymphedema severity score criteria in Supplementary Table S3). Images were viewed at a window width/level such that the background was null. Radiologists completed a consensus step, where cases with no agreement were reconsidered, while still blinded to disease status and the scores of other radiologists. The mode (majority) score for MRL severity for each leg was used in subsequent analyses.
Subregional analysis of SAT
Patterns of tissue sodium storage in the SAT were explored by segmenting the whole region into 8 equiangular radial subregions (R1–R8, 45° intervals), as demonstrated in Supplementary Fig. S2. Because images were registered to a template, subregions maintain anatomical orientation, that is, R1 is always anterior lateral. Mean SAT TSC in each subregion was calculated.
Statistical approach
The primary statistical hypothesis was to test the TSC measured by 23Na-MRI between lymphedema stages. Sample size and power analysis were conducted using a one-way analysis of variance (ANOVA) F test with a 1:1:1 allocation for Stage 0:Stage I:Stage II lymphedema (PASS 15, NCSS Statistical Software), based on preliminary data, which did not include Stage III cases. Sample sizes of 10, 10, and 10 legs obtained from three groups (or a total sample of 28 subjects) achieved ≥80% power to detect differences between stages with a 0.05 significance level. To test the hypothesis that TSC in lymphedema was different than controls, we planned to enroll 30 control subjects to match the LEL group size.
We first evaluated the hypothesis that TSC is elevated in affected legs with unilateral LEL, where lymphatic impairment is localized to one affected leg, compared with the contralateral leg (ISL Stage 0). Statistical differences in regional TSC, leg circumference, SAT cross-sectional area, and muscle cross-sectional area between affected and contralateral legs were determined via two-tailed paired t-tests or nonparametric Wilcoxon signed-rank tests, depending on normality by the Shapiro–Wilk test.
To evaluate the hypothesis that TSC is elevated in LEL compared with controls, optimal full matching of age and body mass index (BMI) was performed for the following models (Supplementary Data). Regional TSC, leg circumference, SAT cross-sectional area, and muscle cross-sectional area were compared between lymphedema and control legs with linear mixed-effects models. “Subject” was considered a random intercept to account for two legs from the same subject. Age and BMI were covariates. Differences between groups were compared using the Wald test.
Multinomial baseline-category logit regression models evaluated the association between TSC and clinical lymphedema severity. Stage I legs were considered “early” lymphedema, and Stage II and III legs were grouped together as “advanced” lymphedema, since both stages present with adipose remodeling. Group (early or advanced) was treated as the outcome, and models were adjusted for age and BMI.
To compare the difference in TSC among stages, all legs from participants with LEL were considered. Linear mixed-effects models adjusted for age and BMI were performed to relate ISL stage (Stages 0, I, II, and III) to skin, SAT, and muscle TSC.
To compare MRL-based lymphedema severity scored by three reviewers, the inter-rater agreement for edema status (either apparent or not apparent) and lymphedema severity score (mild, moderate, severe) was determined with Fleiss Kappa (>0.75 considered excellent agreement). Linear mixed-effects models evaluated the relationship between TSC in each ROI and edema severity scores, with “subject” as a random effect.
Next, three hypotheses regarding subregional SAT TSC were analyzed. The first hypothesis was that subregional TSC differed from the mean SAT TSC. LEL legs (Stages I, II, and III) were considered separately from control legs. Mixed-effects models compared SAT TSC in each of the eight subregions to the whole SAT region in each group:

Subject and leg side are “nested” random effects to account for observations within subjects and legs.
Second, TSC in each subregion was compared between LEL and controls with mixed-effects models and corrections for age and nonlinear BMI. Third, TSC in each subregion was compared between legs with early and advanced lymphedema (as previously defined) using linear mixed-effects models.
Statistical analyses were performed using R Statistical Software (version 4.4.0). Two-sided p < 0.05 was considered significant. p Values were adjusted using the Tukey method for multiple comparisons, as appropriate. Skewed data were transformed to the log scale to meet the homogeneity of variance assumption.
Results
We enrolled 69 participants, consisting of 38 participants with LEL in at least one leg and 31 female control participants (Fig. 1). Participant characteristics are presented in Supplementary Table S4.
Tissue sodium is elevated in legs affected by lymphedema
A subset of enrolled participants was diagnosed with unilateral LEL (n = 21participants; age = 62.2 ± 8.58 years, BMI = 27.53 ± 6.41 kg/m2, leg L-Dex score = 22.16 ± 27.71, where L-Dex >10 indicates unilateral LEL). Of these participants, the numbers that had ISL Stage I/II/III in their affected leg were 5/11/5. This cohort was studied to understand the effect of lymphatic disease on tissue sodium, while using the contralateral limb as an internal reference to represent background physiology (Fig. 2a, b).
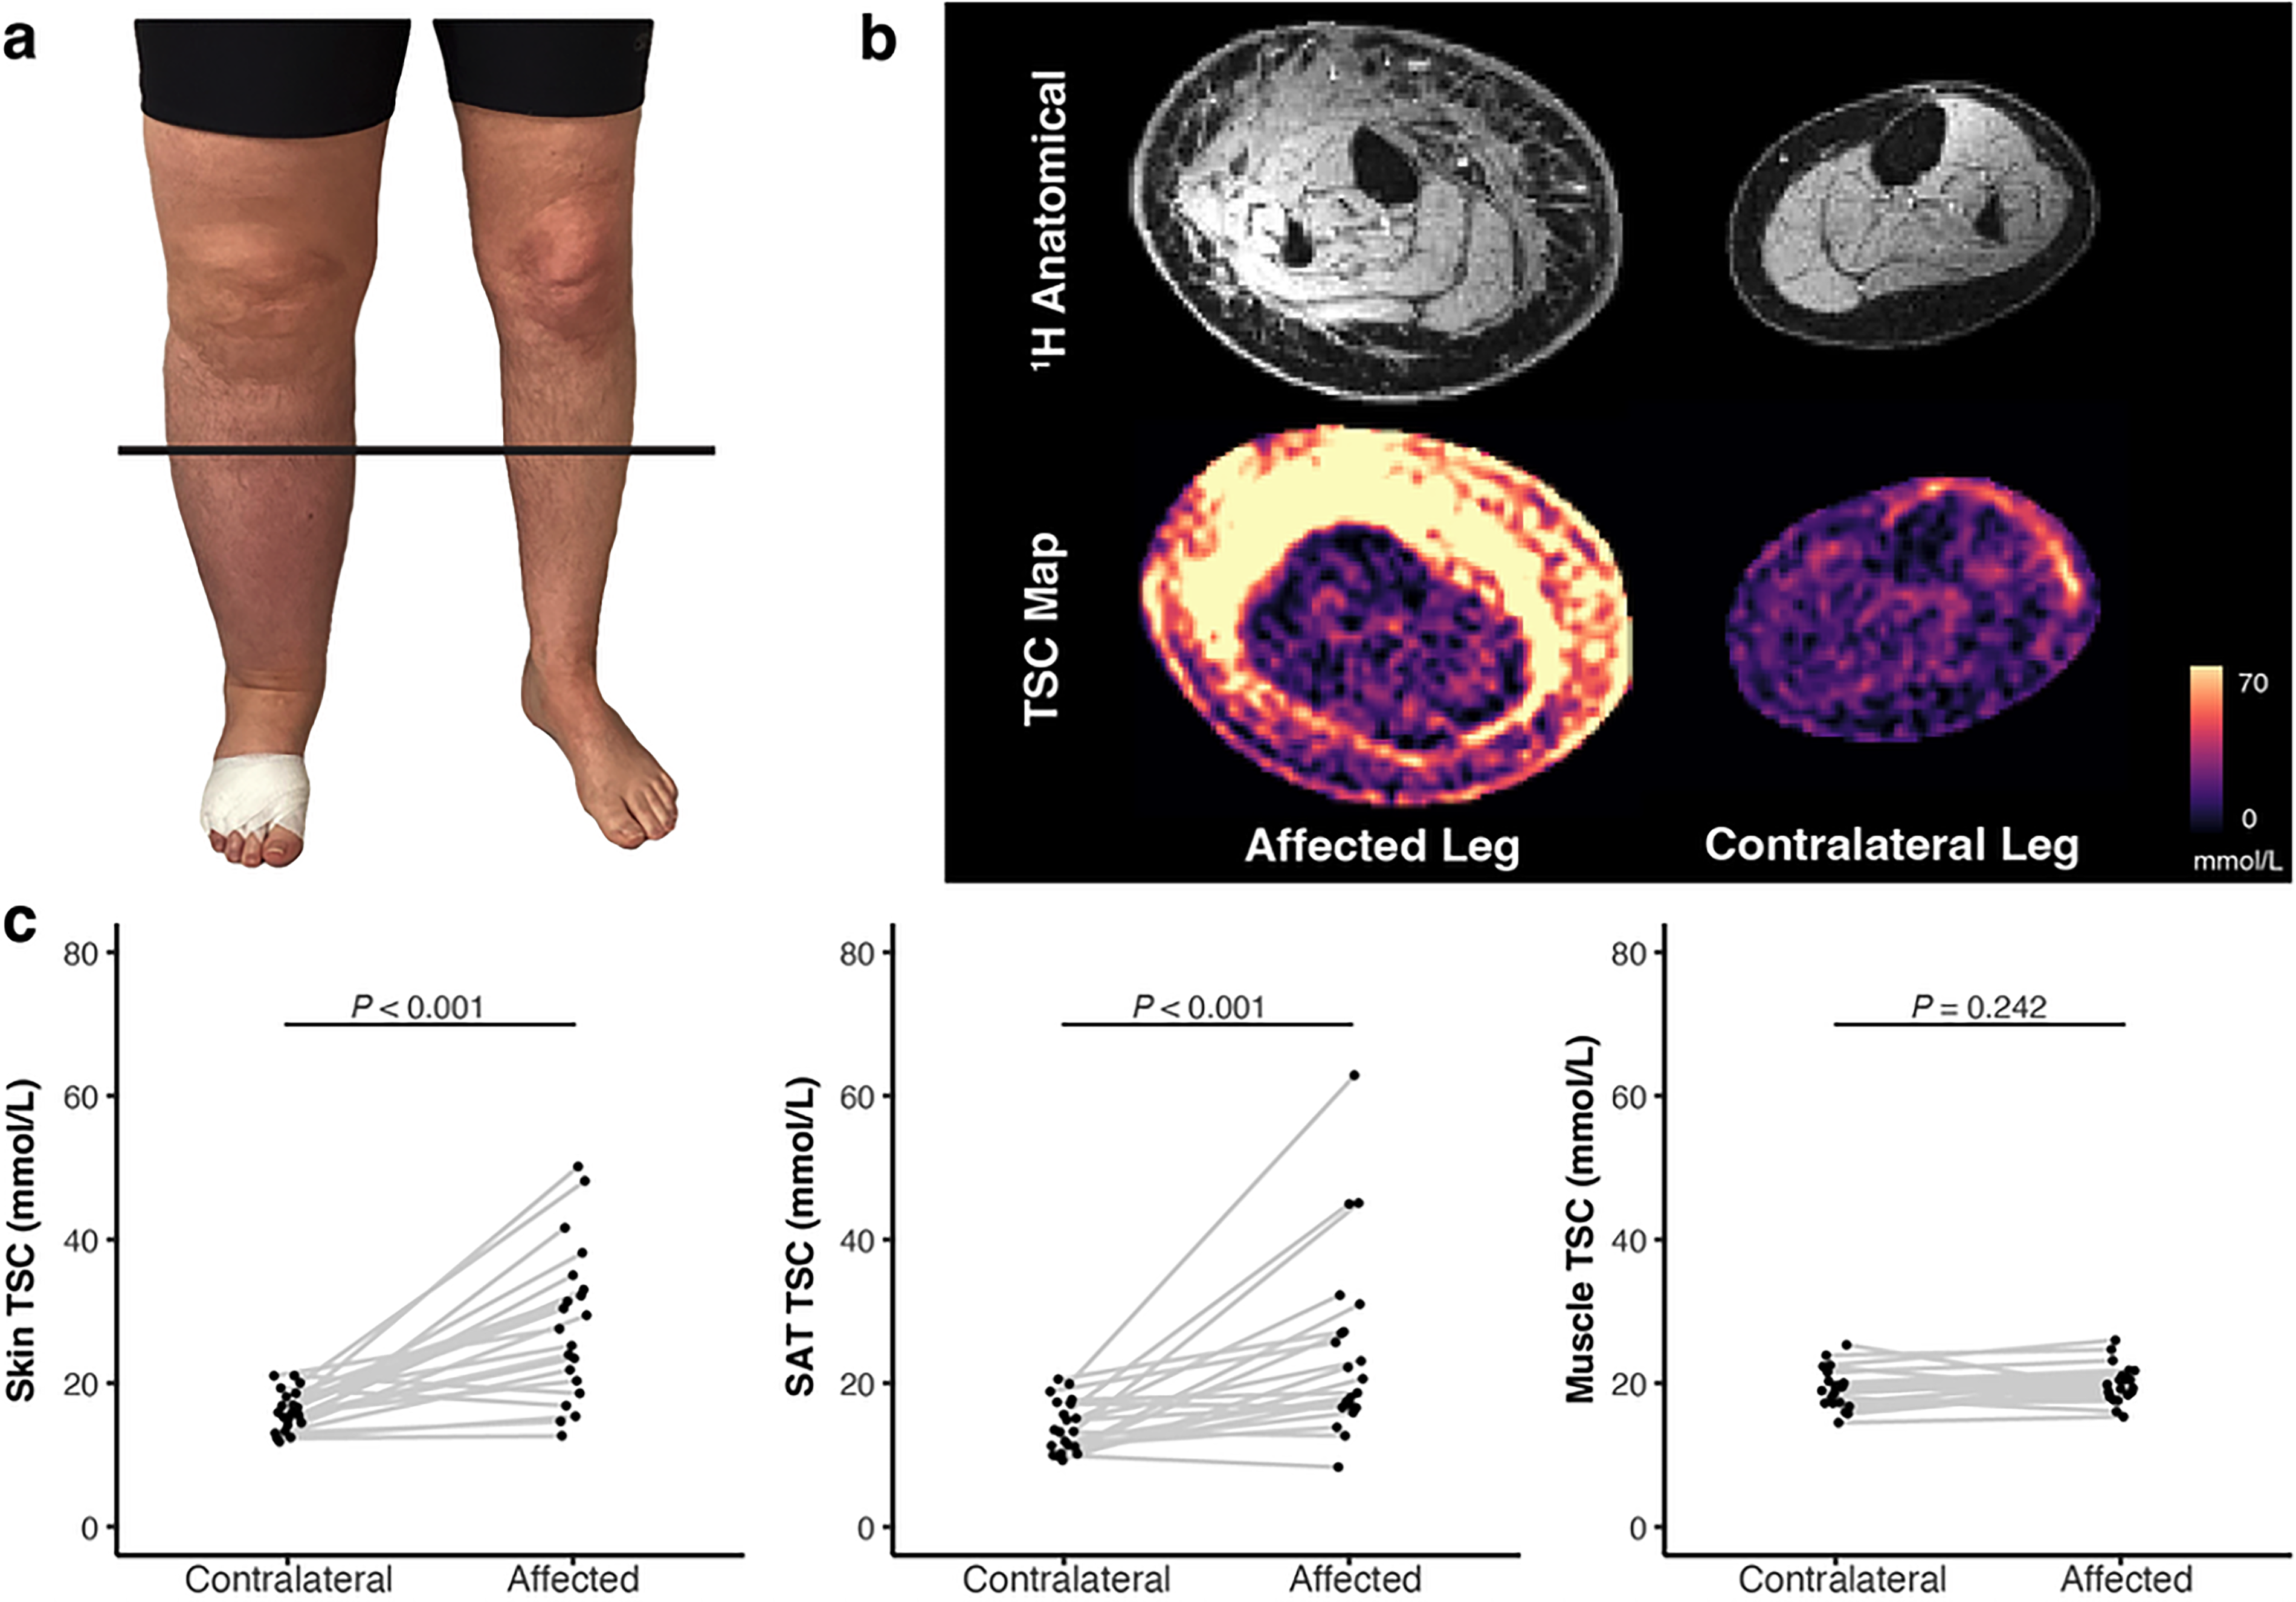
TSC in unilateral lower extremity lymphedema.
TSC was significantly higher in affected compared with contralateral legs in the skin (affected TSC = 28.10 ± 10.55 mmol/L, contralateral TSC = 16.09 ± 2.81 mmol/L, p < 0.001) and SAT (affected TSC = 24.61 ± 12.94 mmol/L, contralateral TSC = 13.92 ± 3.56 mmol/L, p < 0.001), but was not significantly different in the muscle (p = 0.242; Fig. 2c). Leg circumference (p < 0.001) and SAT cross-sectional area (p < 0.001) were significantly higher in affected compared with contralateral legs, consistent with limb swelling and adipose tissue remodeling in lymphedema. However, muscle cross-sectional area was not significantly different (p = 0.454; Supplementary Table S5).
Tissue sodium is elevated in lymphedema compared with control legs
Participants with LEL (38 participants, age = 59.97 ± 10.93 years, BMI = 28.01 ± 6.55 kg/m2) and controls (31 participants, age = 45.90 ± 12.93 years, BMI = 29.90 ± 5.49 kg/m2) were matched for age and BMI with propensity score weights in linear models. Legs with lymphedema (n = 52 legs) had 1.51-fold higher skin TSC (p < 0.001, 95% confidence interval [CI]: 1.29, 1.67) and 1.47-fold higher SAT TSC (p < 0.001, 95% CI: 1.20, 1.81) than controls (n = 31 legs; Fig. 3). There was a smaller, but significant, effect in muscle where TSC was 1.11-fold higher in LEL versus controls (p = 0.004, 95% CI: 1.03, 1.18). Results are summarized in Figure 3 and Supplementary Table S6.
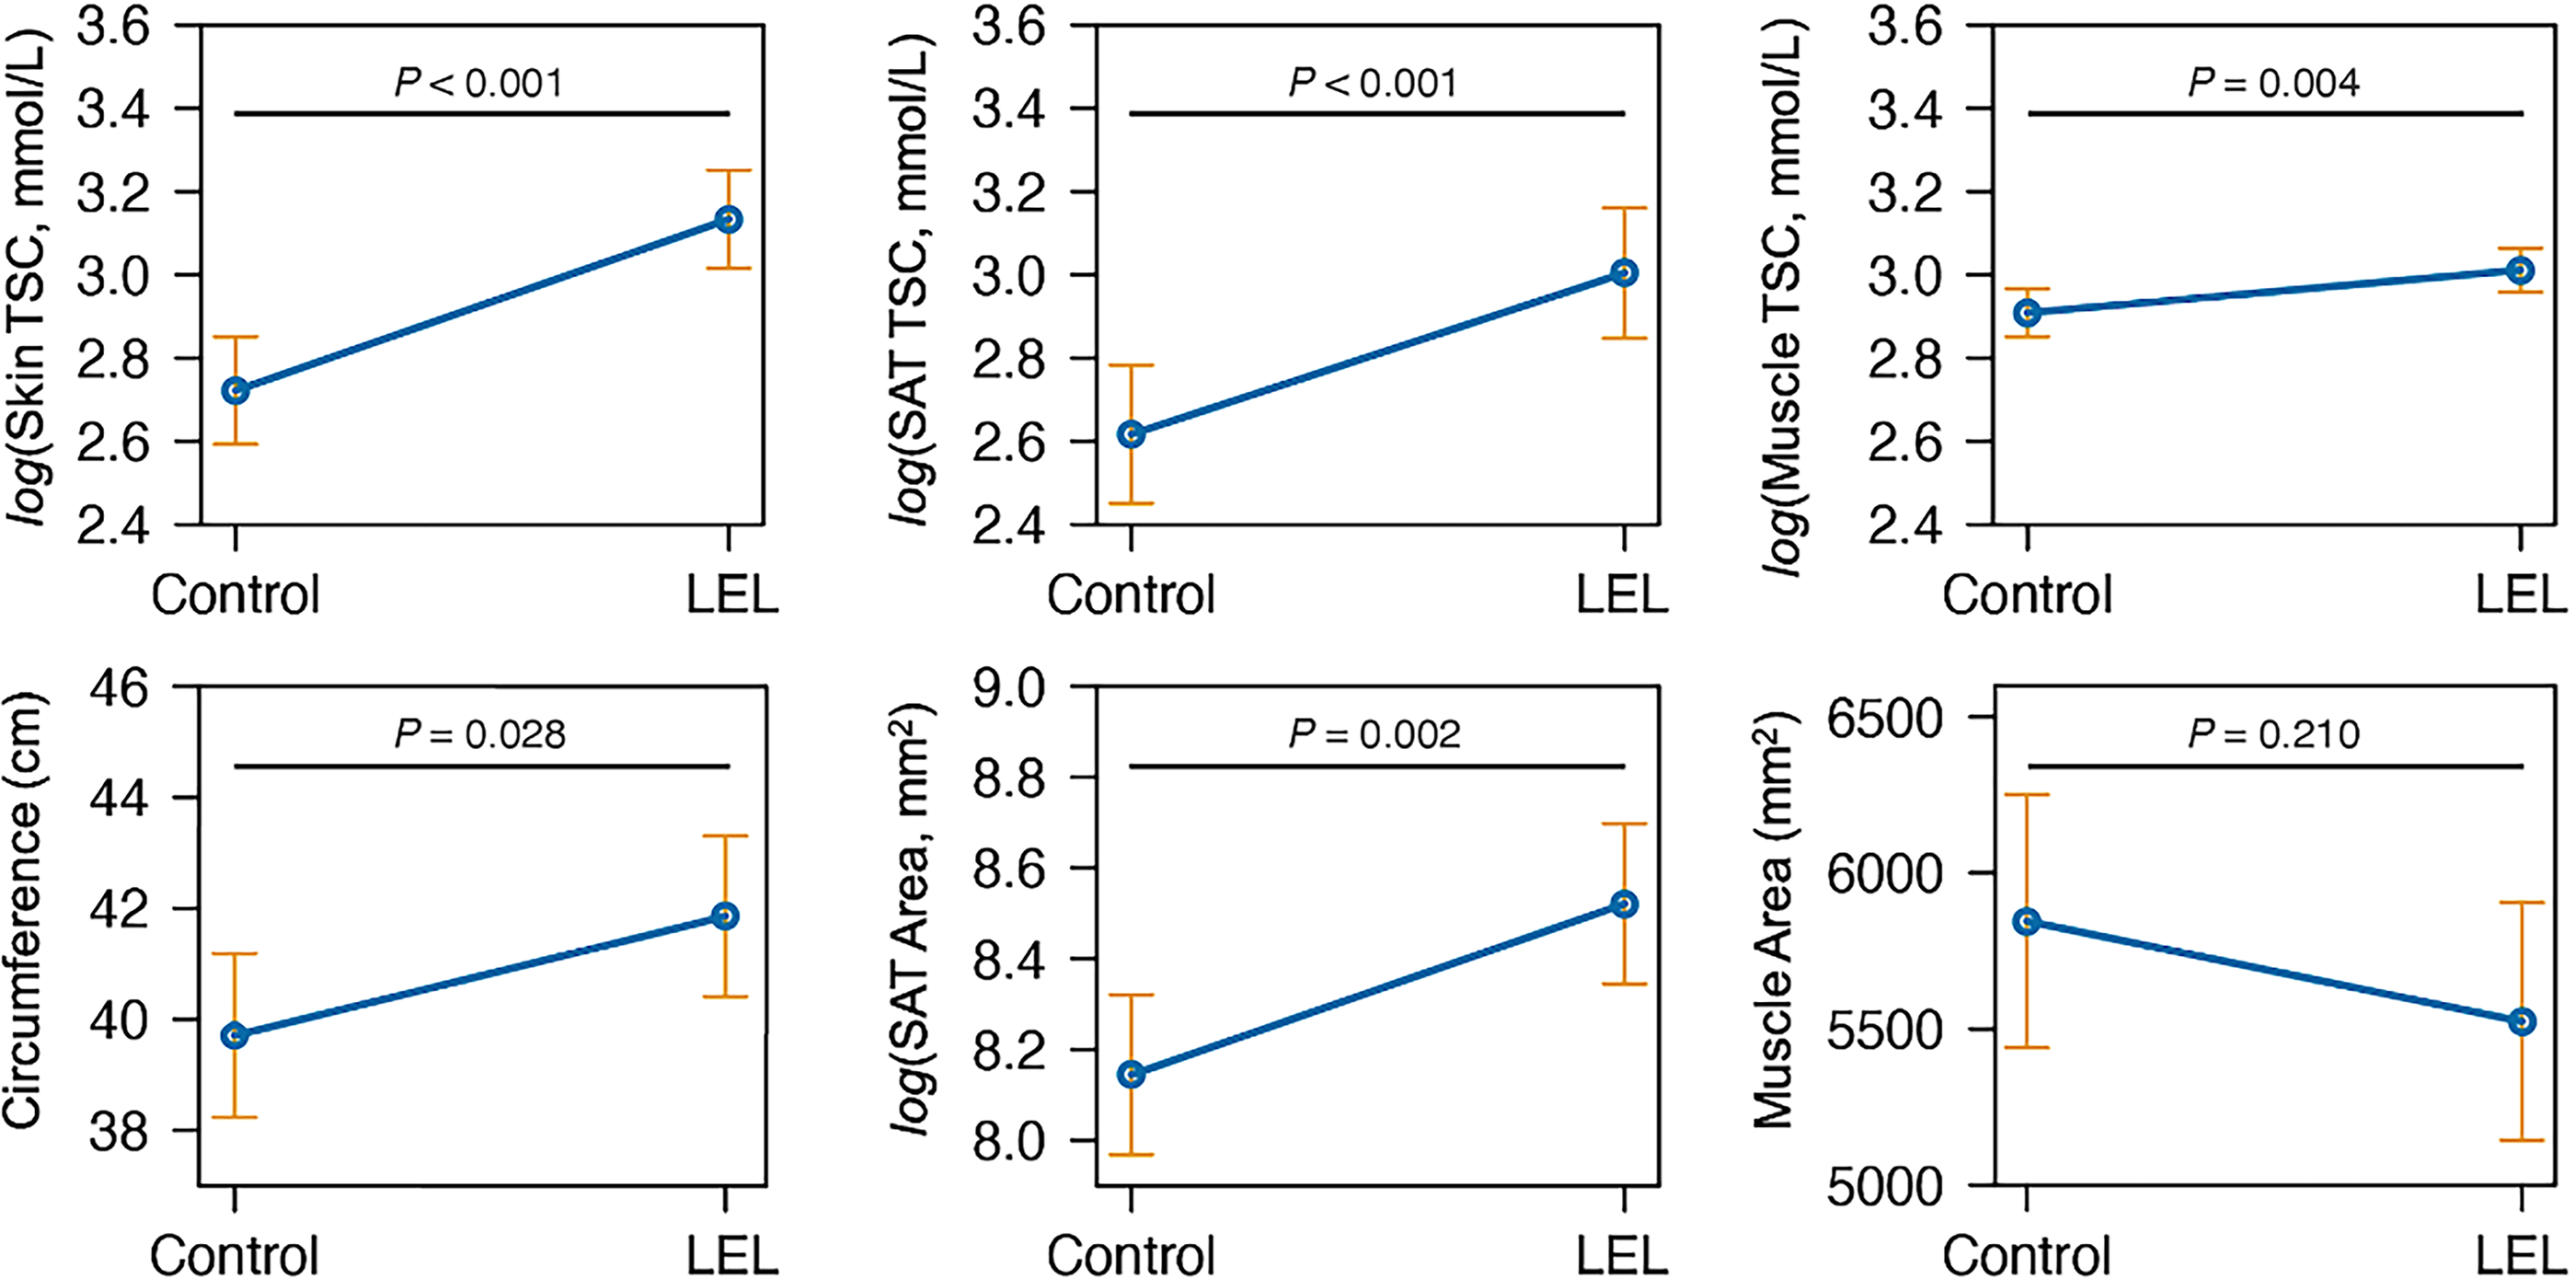
Marginal mean of TSC in LEL legs versus controls. In row 1, from left to right, TSC measurements in the skin, SAT, and muscle (in units of mmol/L) are compared between n = 52 lymphedema legs and n = 31 control legs with linear mixed-effects models. In row 2, anthropomorphic and composition metrics are reported of leg circumference, SAT cross-sectional area, and muscle cross-sectional area in the central image slice. Analyses on the logarithmic scale were done to satisfy the homogeneity of variance assumption. The orange error bars represent the 95% confidence interval of the estimated means. p value based on the Wald test of the respective linear mixed-effects model.
Tissue sodium is associated with clinical lymphedema severity
In early LEL compared with controls, skin TSC (odds ratio [OR] =1.52; p = 0.002) and SAT TSC (OR = 1.23; p = 0.029) are differential, while muscle TSC was not (p = 0.122) (Table 1). Skin TSC (OR = 1.59, p < 0.001), SAT TSC (OR = 1.31, p = 0.003), and muscle TSC (OR = 1.56, p = 0.003) were significant predictors of advanced LEL (Table 1). TSC was not significantly different in contralateral from control legs in any region (all p > 0.05).
Descriptive Statistics of Tissue Sodium Content by Severity and Association Between Clinical Lymphedema Severity and Tissue Sodium Content
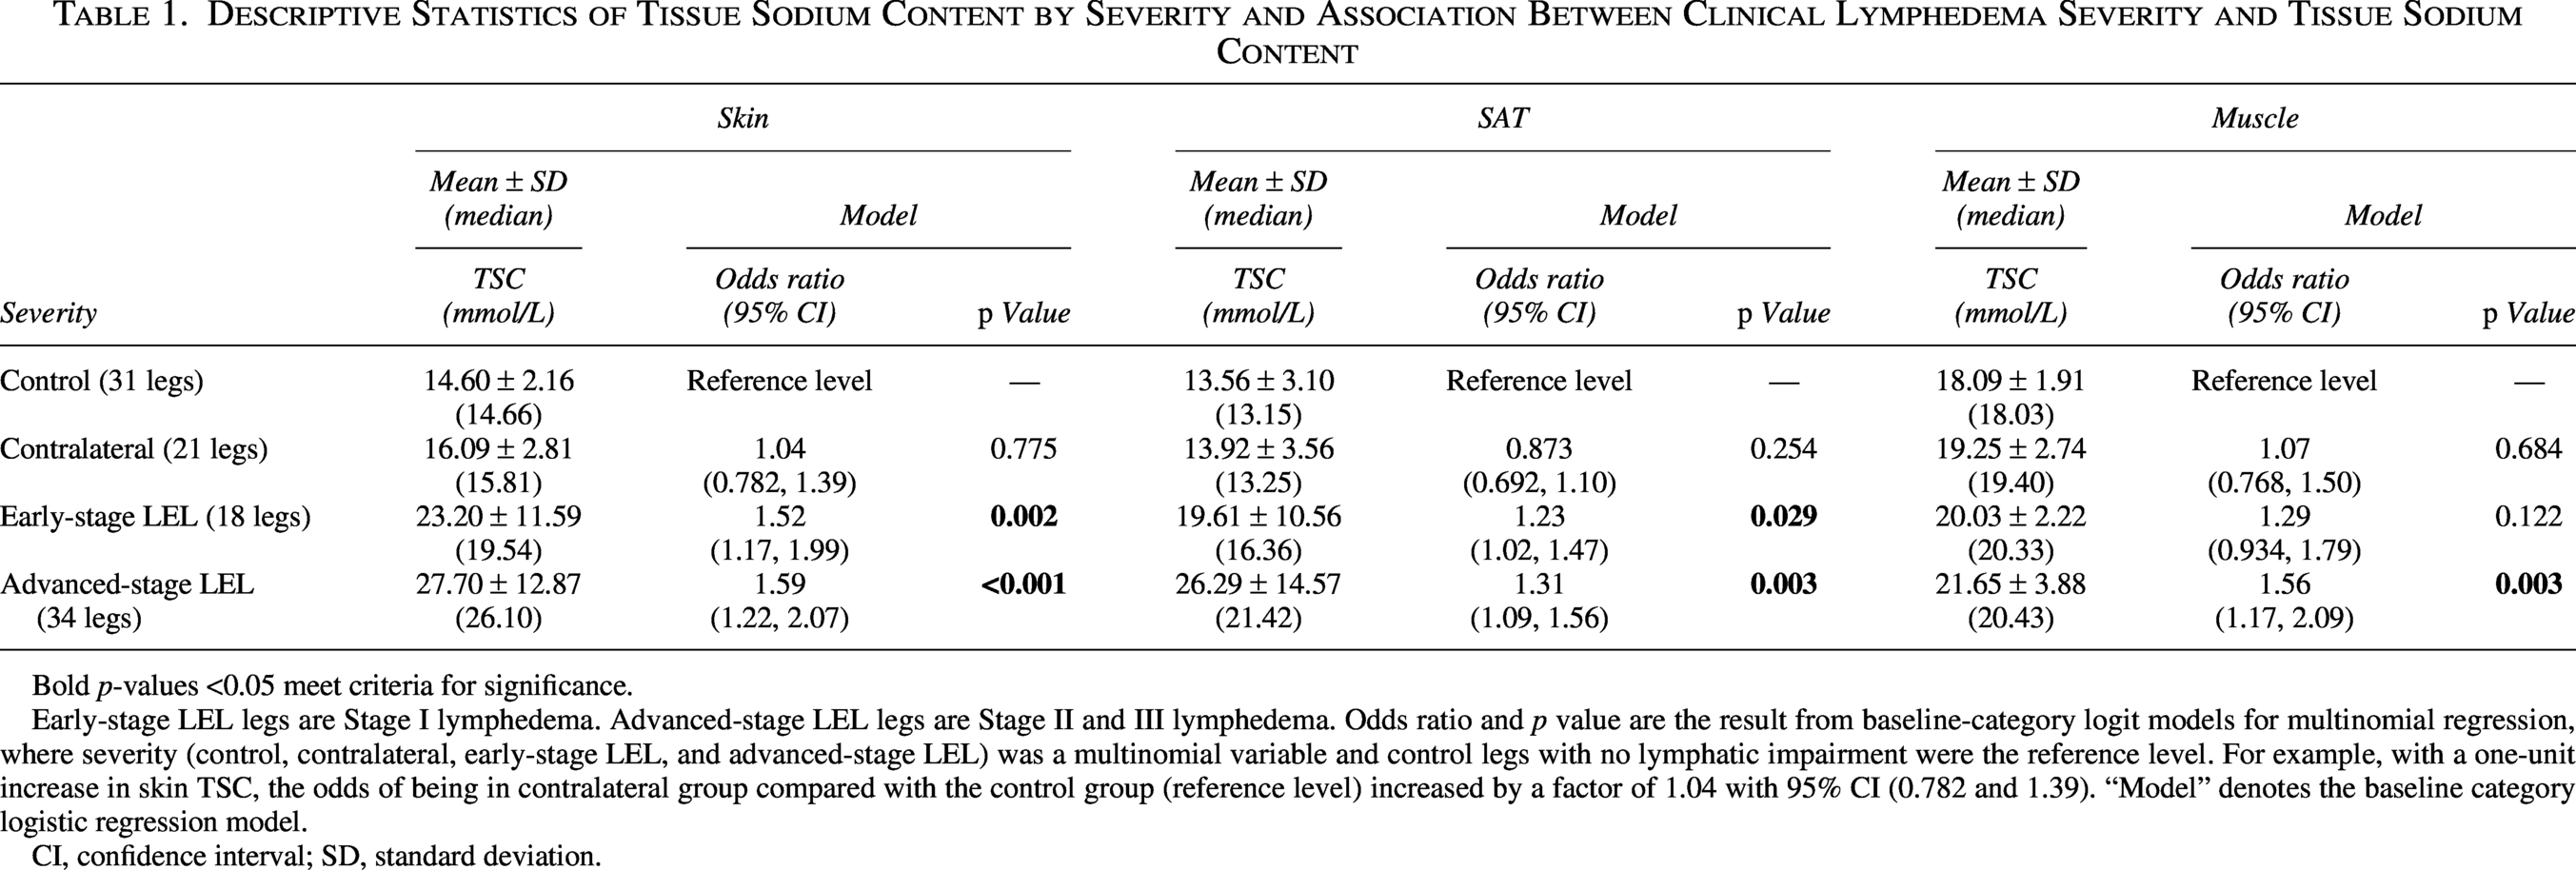
Bold p-values <0.05 meet criteria for significance.
Early-stage LEL legs are Stage I lymphedema. Advanced-stage LEL legs are Stage II and III lymphedema. Odds ratio and p value are the result from baseline-category logit models for multinomial regression, where severity (control, contralateral, early-stage LEL, and advanced-stage LEL) was a multinomial variable and control legs with no lymphatic impairment were the reference level. For example, with a one-unit increase in skin TSC, the odds of being in contralateral group compared with the control group (reference level) increased by a factor of 1.04 with 95% CI (0.782 and 1.39). “Model” denotes the baseline category logistic regression model.
CI, confidence interval; SD, standard deviation.
In the 73 legs from subjects with LEL, clinical lymphedema stage (Stages 0, I, II, and III) was linearly related to skin TSC (mixed-effects model ANOVA p < 0.001) and SAT TSC (ANOVA p < 0.001), although muscle TSC was only significantly different at Stage III (ANOVA p = 0.008; Fig. 4). Supplementary Table S7 contains descriptive statistics of TSC measurement model results at each stage.
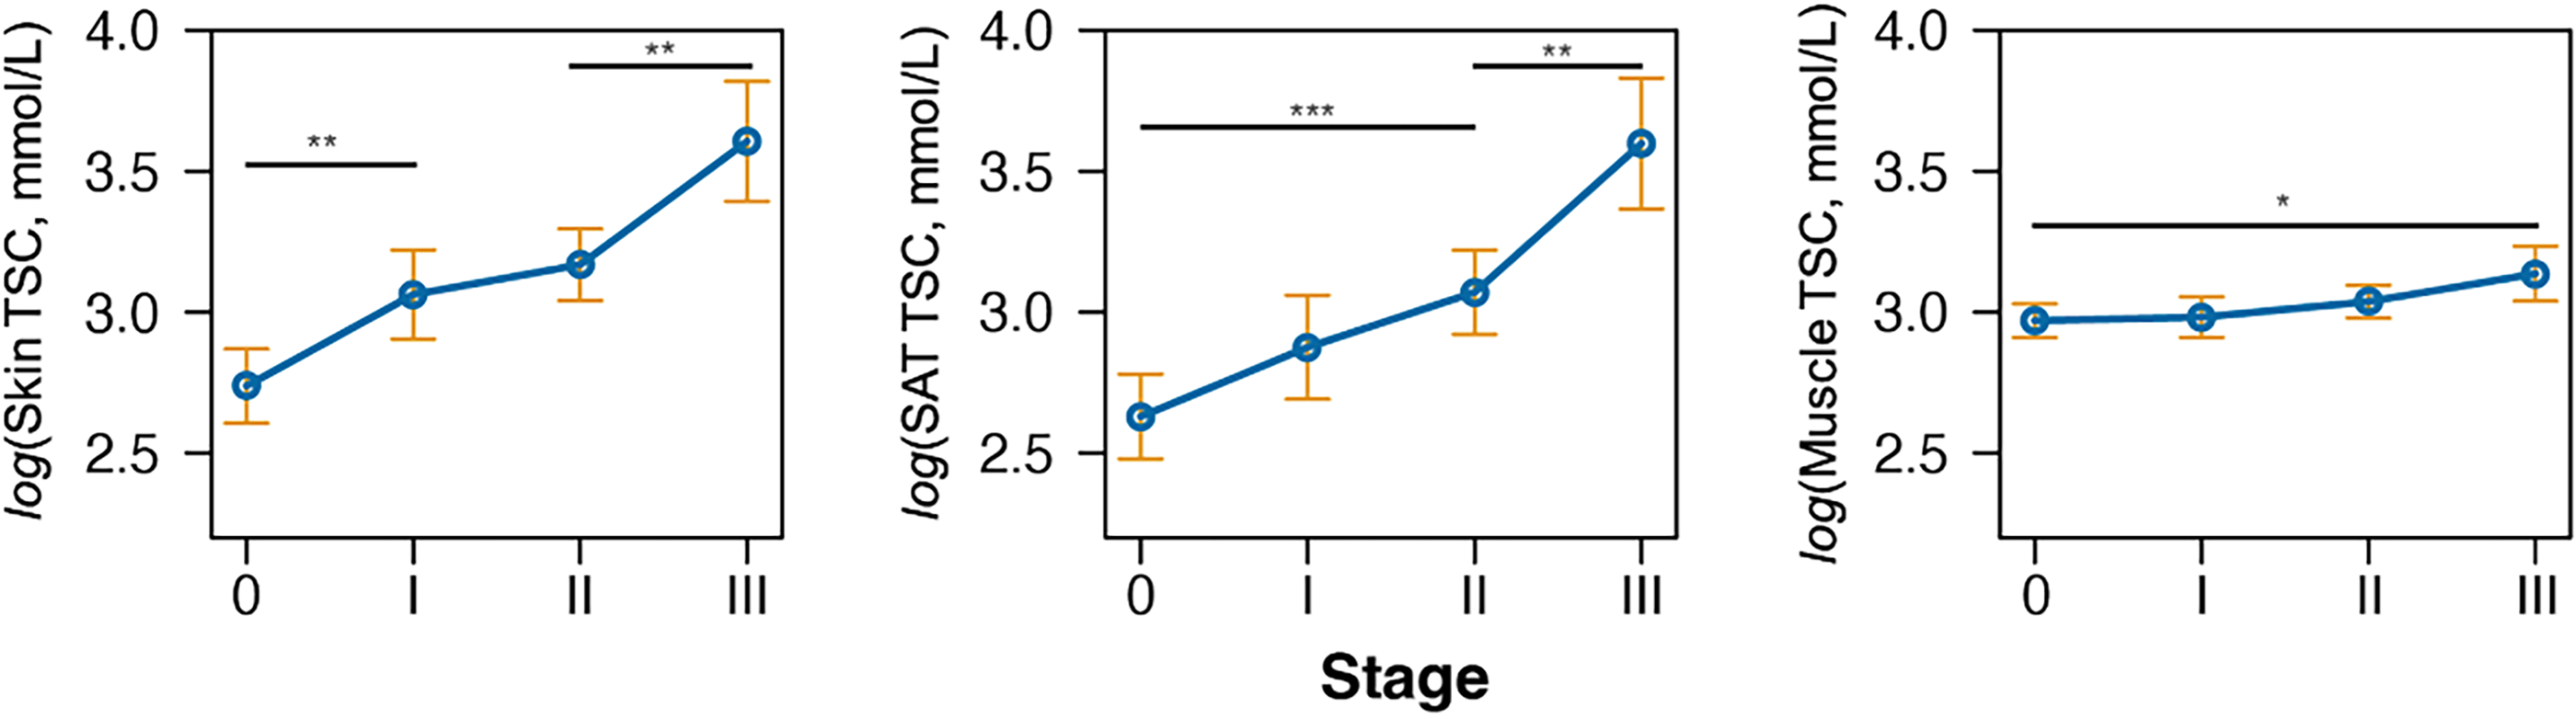
Marginal mean of TSC across lymphedema clinical stages. Marginal mean TSC and 95% confidence intervals (orange error bars) are reported for n = 21, Stage 0 legs; n = 18, Stage I legs; n = 26, Stage II legs; and n = 8, Stage III legs. From left to right, stage was a significant predictor of TSC in the skin (analysis of variance [ANOVA] based on mixed-effect model, p < 0.001), SAT (p < 0.001), and muscle (p = 0.008). Not all significant differences are shown on the plots for readability. All p values are found in Supplementary Table S6. TSC values are shown on the logarithmic scale to satisfy the homogeneity of variance assumption. p values were adjusted for multiple comparisons with the Tukey method. *p < 0.05, **p < 0.01, ***p < 0.001. n.s., not significant.
Tissue sodium is associated with MRL-based lymphedema severity
Two participants with LEL were excluded from this analysis, as they did not receive an MRL scan. Thus, 69 legs with either Stage 0 (n = 20 legs), I (n = 16 legs), II (n = 25 legs), or III (n = 8 legs) LEL from 36 participants (age = 60.17 ± 11.15 years, BMI = 27.86 ± 6.19 kg/m2) were analyzed.
Strong statistical consensus was reached, in which 57 legs had apparent edema and 12 legs had no apparent edema (Fleiss Kappa [95% CI] = 0.967 (0.901, 1.00), p < 0.001, percent agreement = 99.0%). Of legs with apparent edema, radiologists reached an acceptable consensus that 27 legs had mild lymphedema, 18 legs had moderate lymphedema, and 12 legs had severe lymphedema (Fleiss Kappa [95% CI] = 0.708, p < 0.001, percent agreement = 79.2%). Supplementary Table S8 reports regional TSC in cases with each MRL lymphedema severity score. Figure 5a shows MRL and 23Na-MRI case examples, representing each MRL severity category. MRL severity scores are directly related to skin TSC (ANOVA p < 0.001) and SAT TSC (ANOVA p < 0.001; Fig. 5b). In agreement with prior analyses, muscle TSC is only significantly elevated in cases with severe lymphedema on MRL (compared with the mild group; p < 0.001).
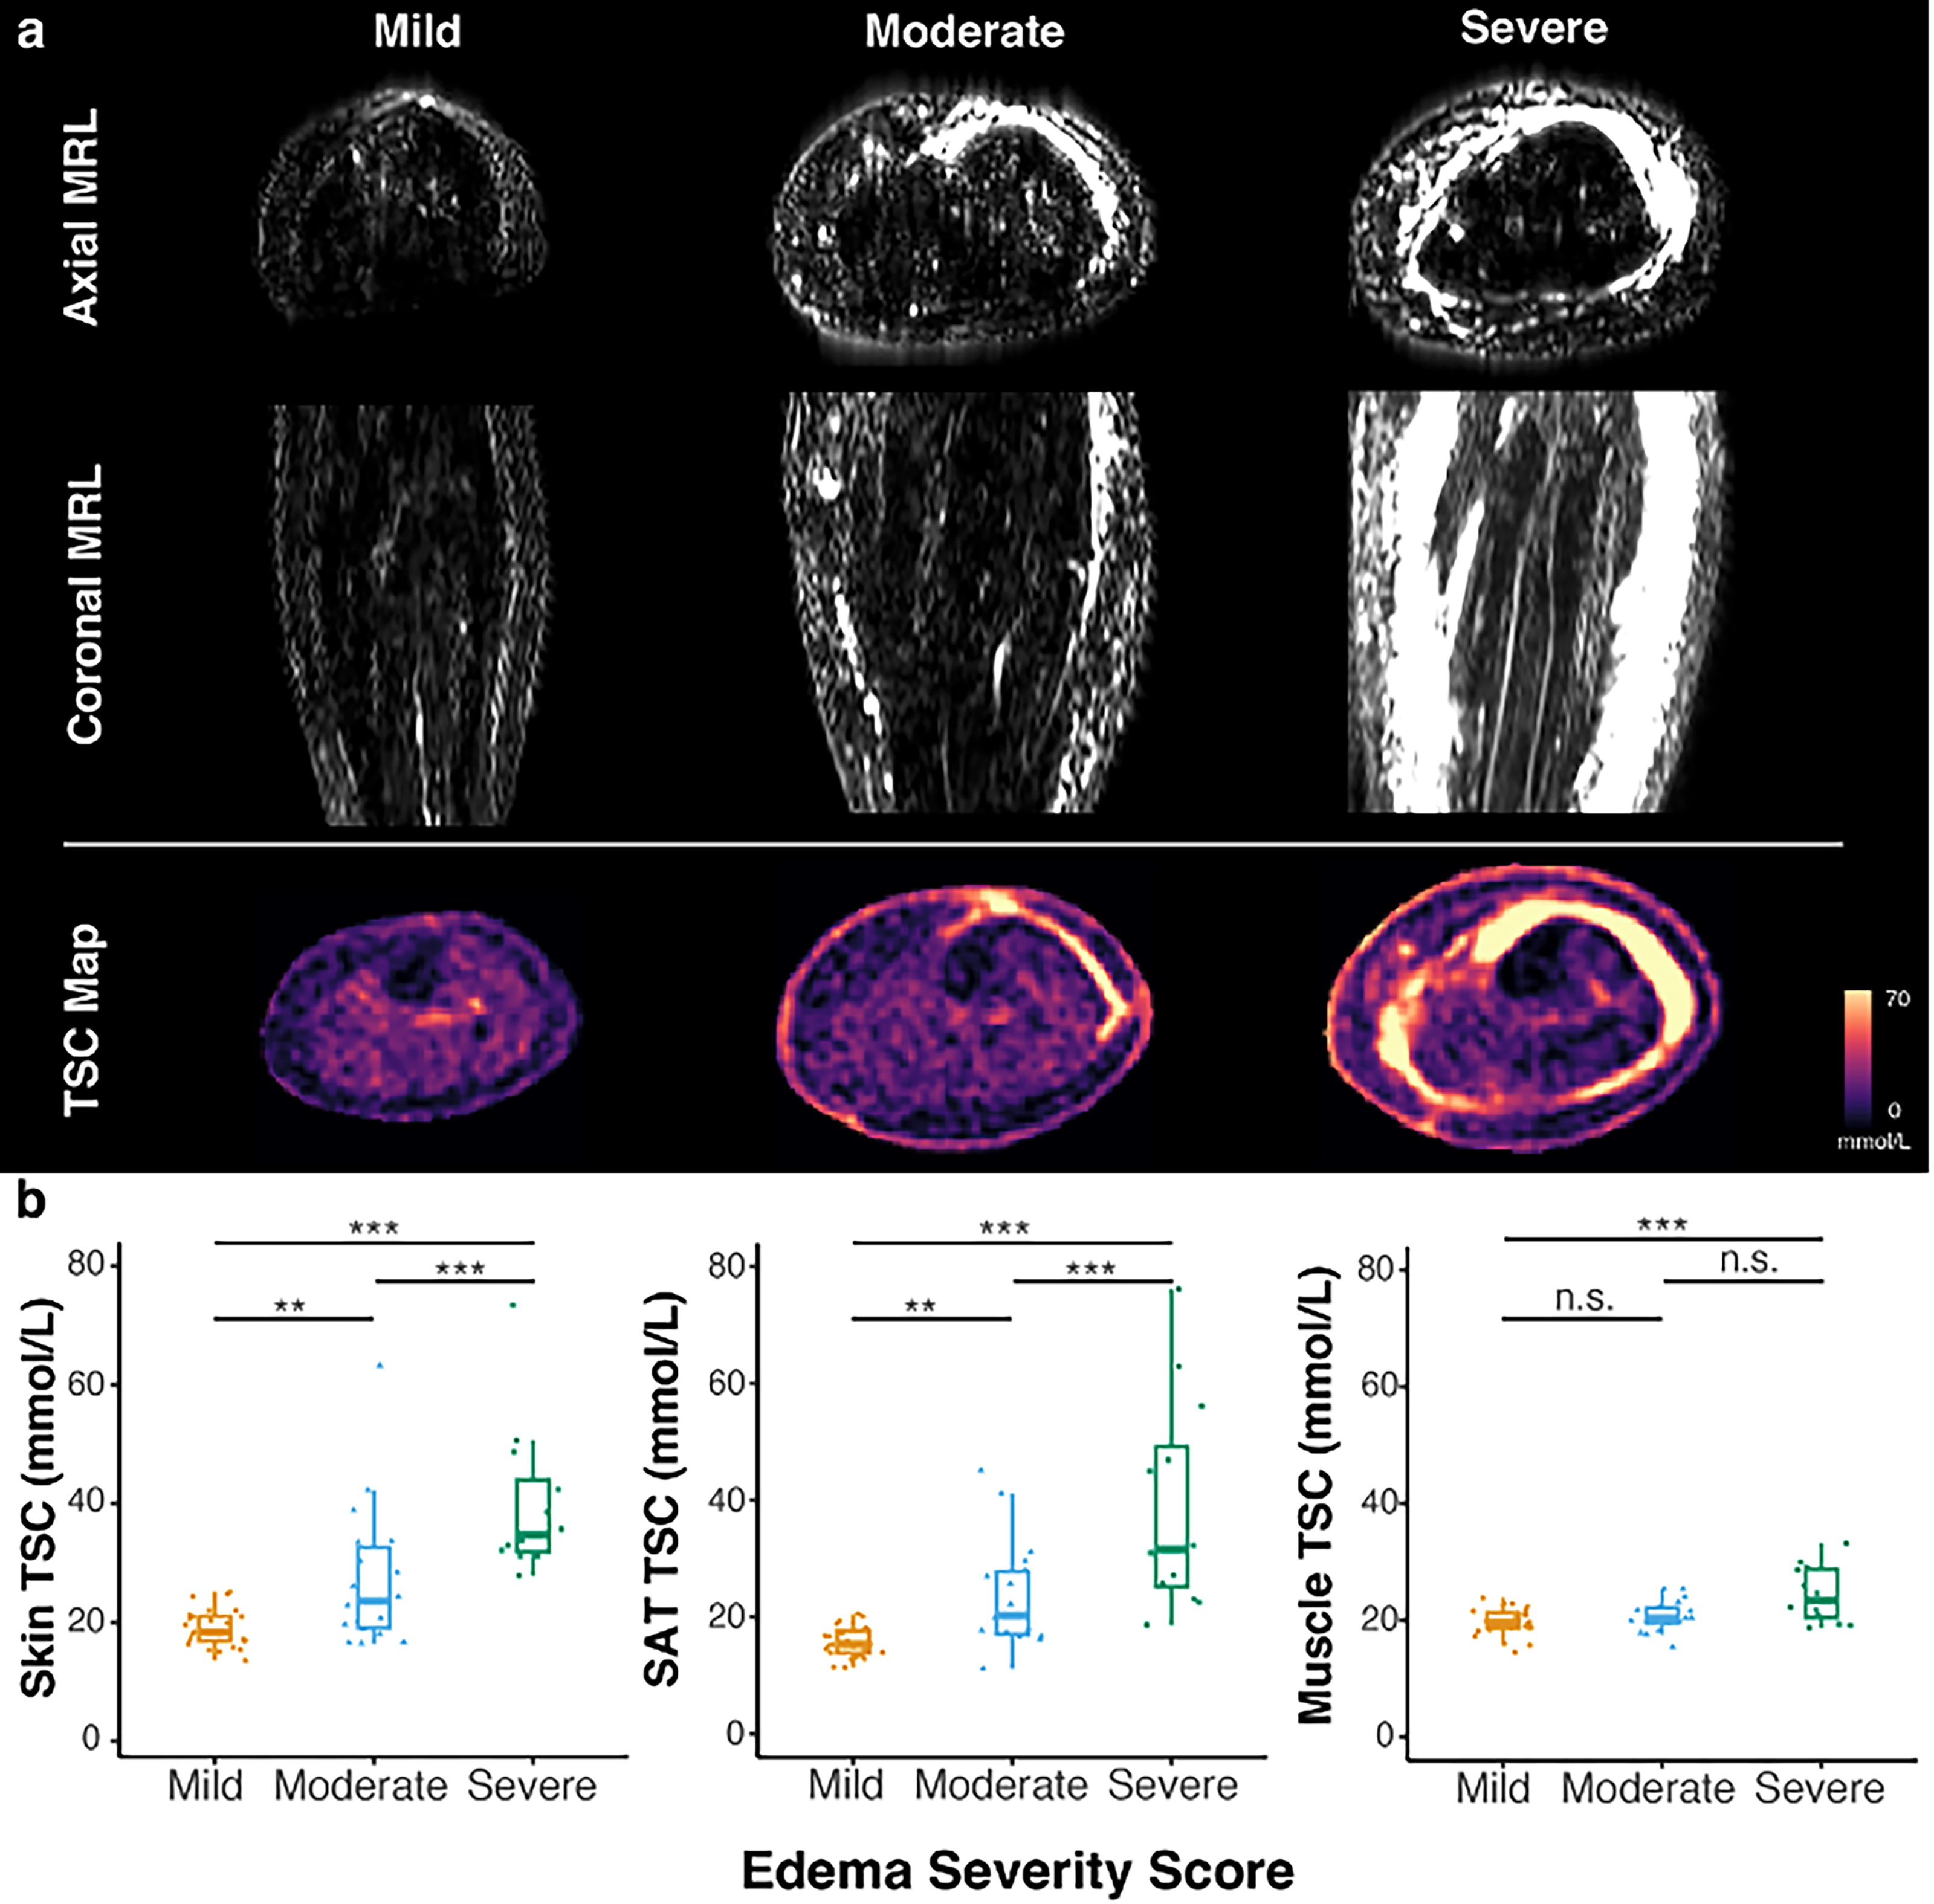
MRL-determined lymphedema severity relates to TSC.
Preferential tissue sodium in anterior SAT with lymphedema
Prior analyses overlooked the spatial variation of sodium in the SAT region, considering the mean TSC of the whole region. A subregional analysis method investigated patterns in SAT TSC, for example, between a control, early, and advanced LEL leg (Fig. 6a).
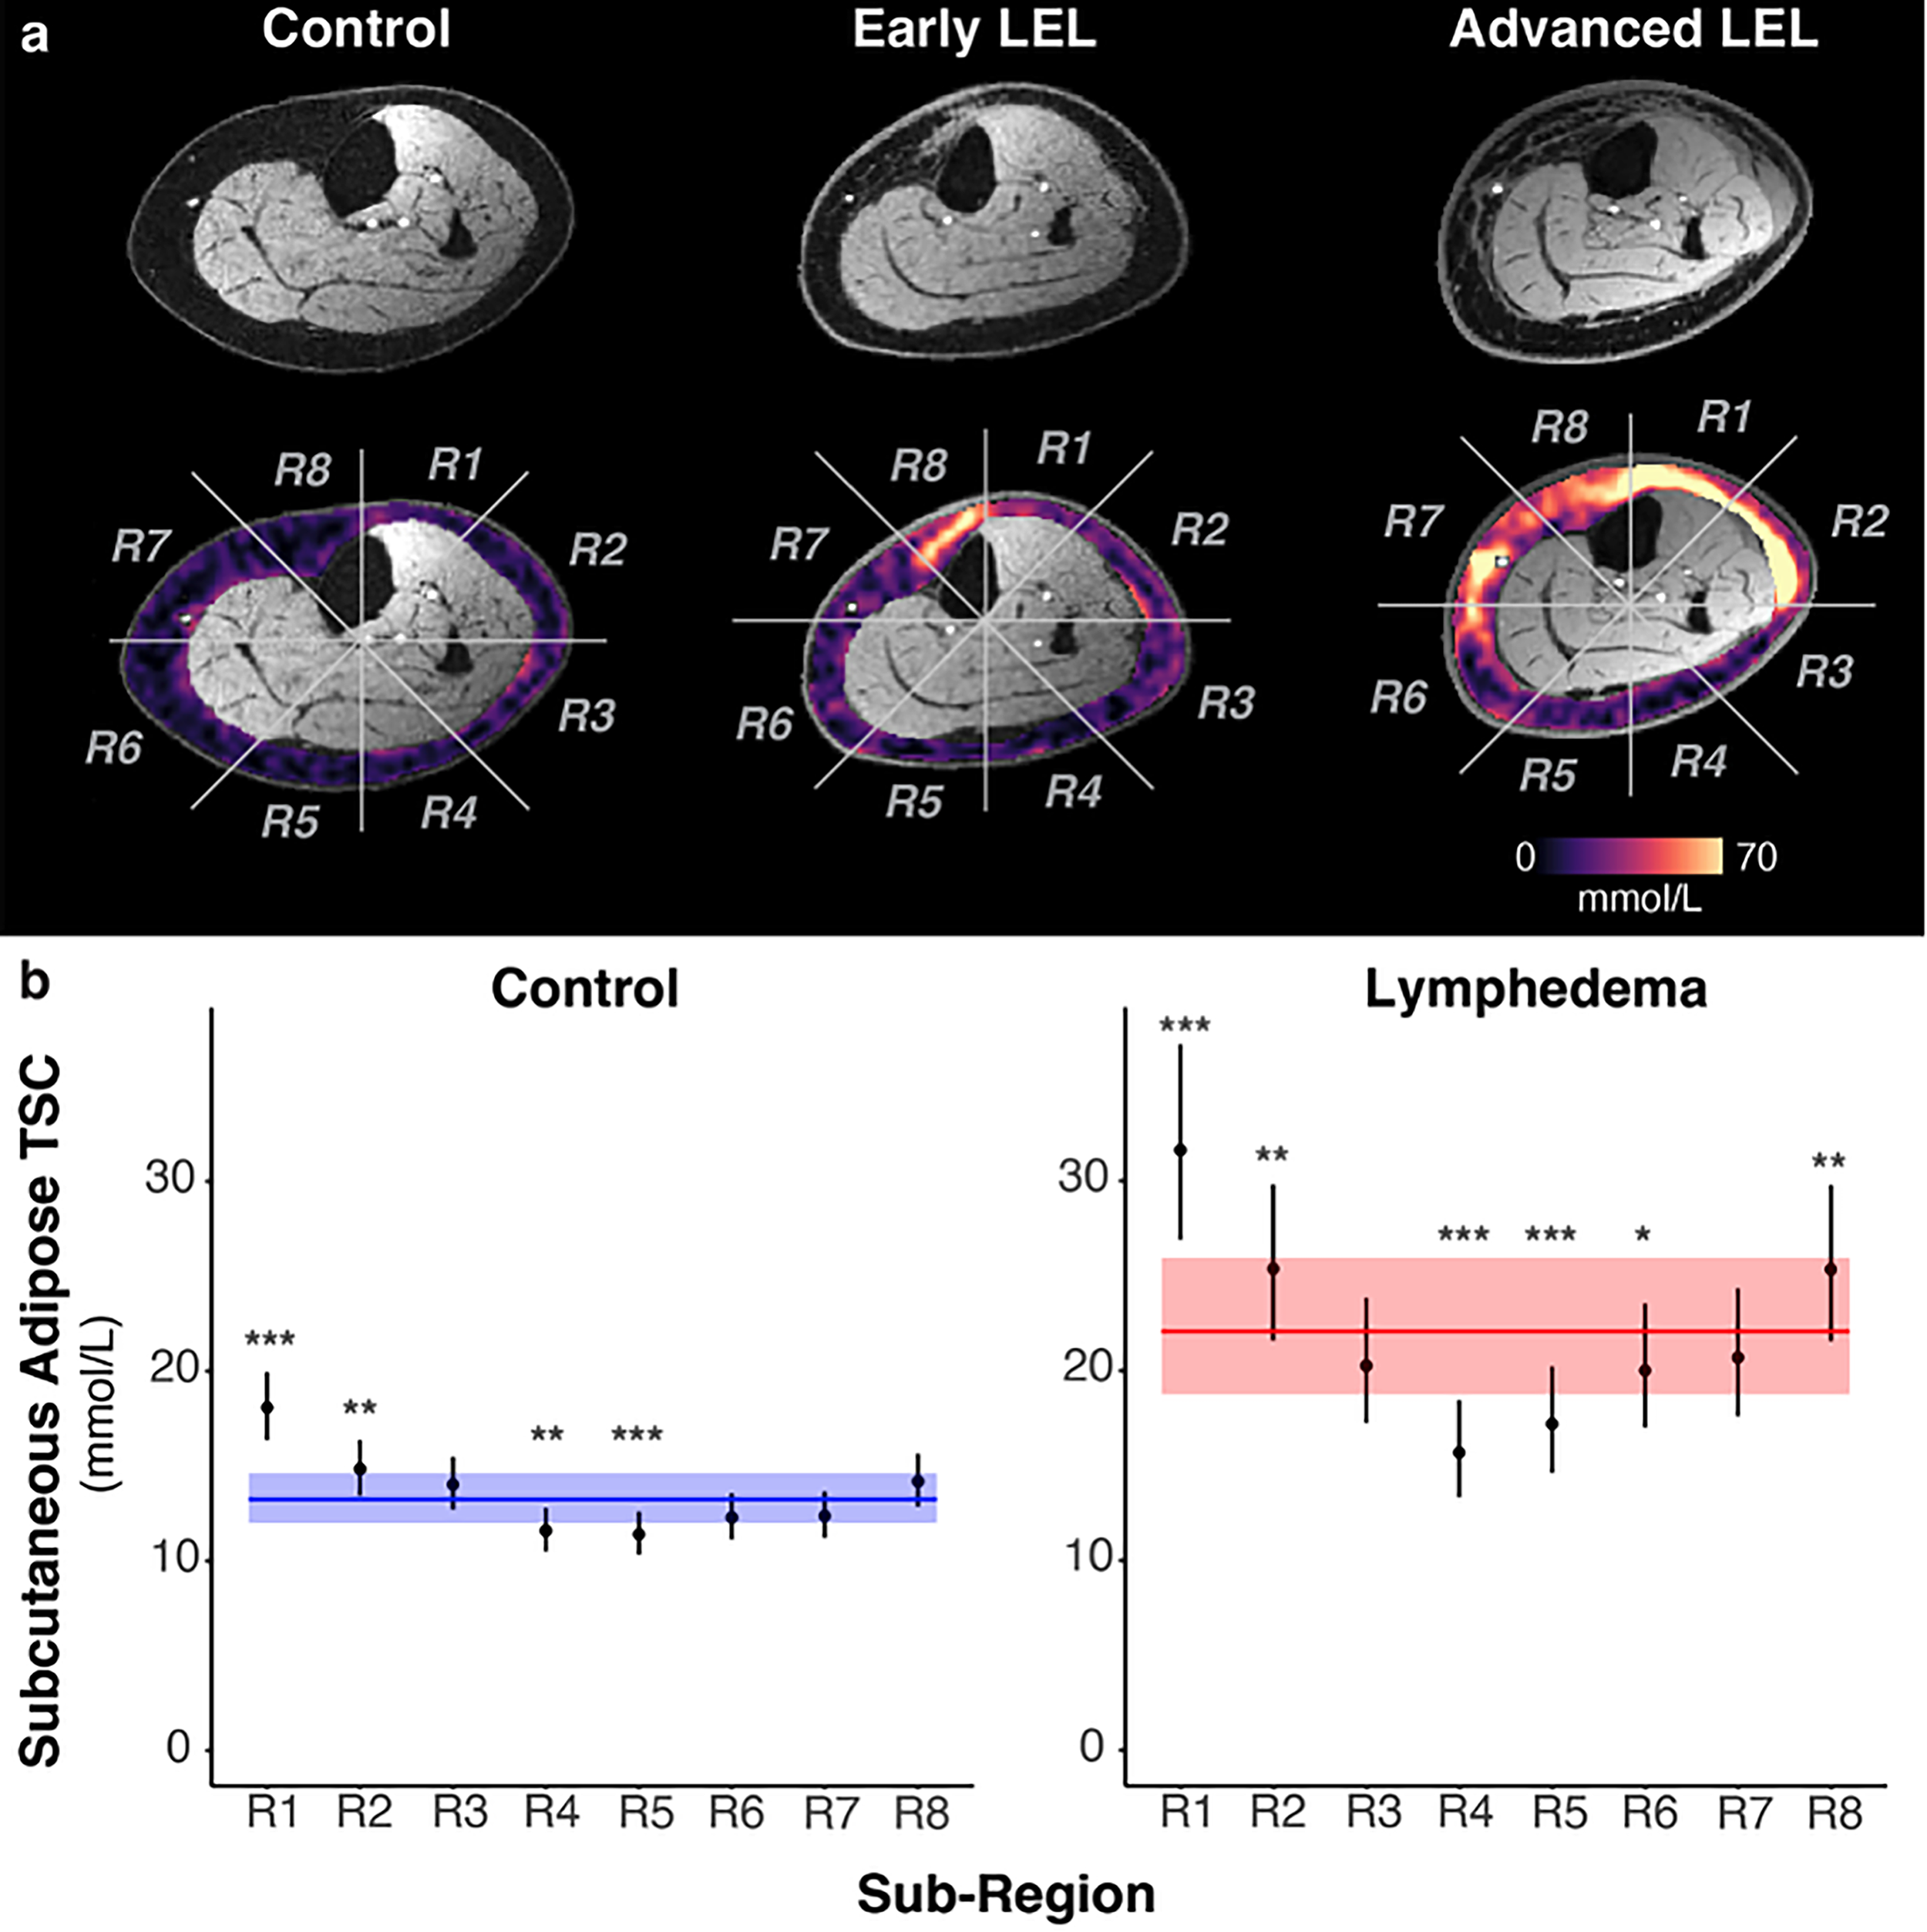
Subregional TSC in the subcutaneous adipose tissue.
In both LEL and control legs, several subregions in the anterior and anterolateral leg (R1, R2, and R8) had significantly higher mean TSC than the whole-SAT region, while posterior subregions (R4 and R5) were significantly lower (Fig. 6b). TSC in LEL was significantly higher than controls in seven of the eight subregions (p < 0.05 except for R4); interestingly, TSC in R4 (posterior) was not significantly different (p = 0.215; Supplementary Table S9).
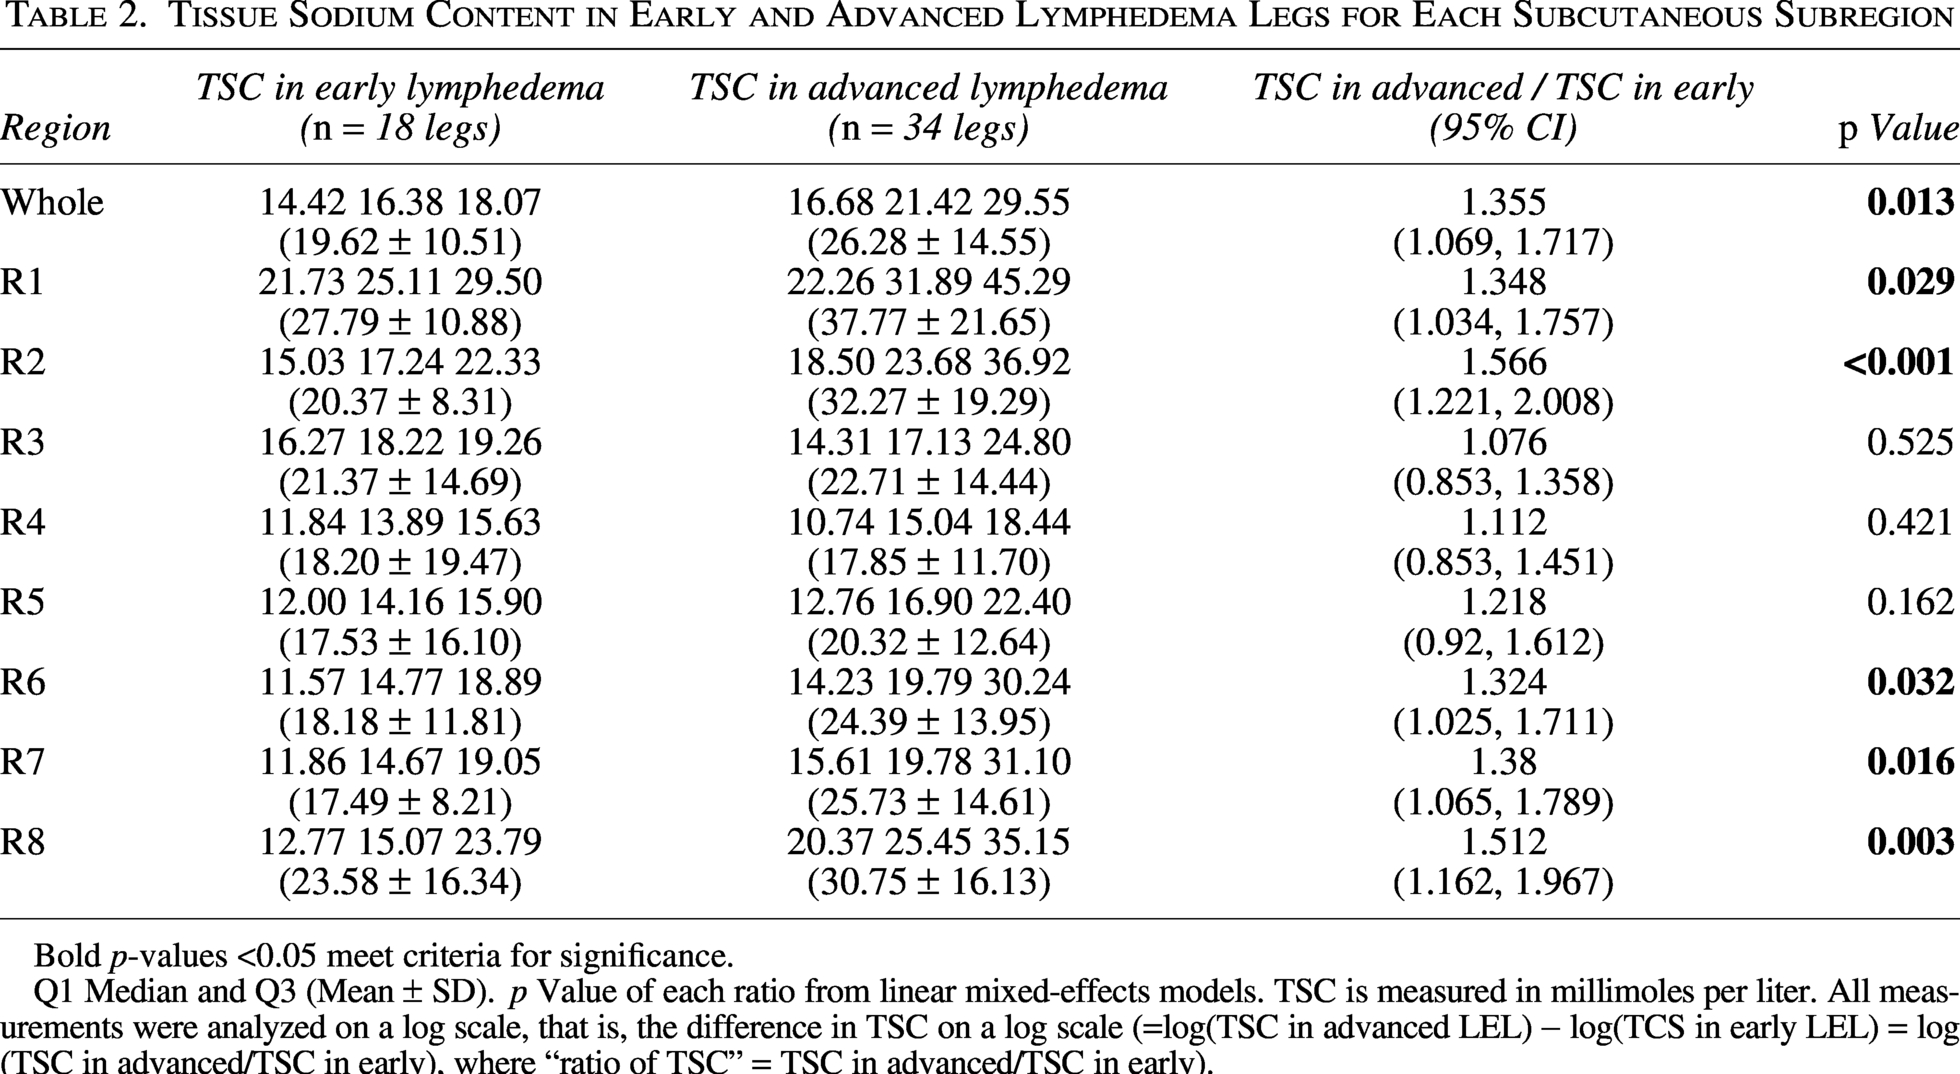
Furthermore, certain subregions (R1, R2, R6, R7, and R8) had significantly higher TSC in advanced lymphedema compared with early lymphedema (Table 2). Estimated ratios of advanced to early lymphedema TSC in anterior regions of R2 (ratio = 1.566, p < 0.001), R7 (1.380, p = 0.016), and R8 (1.512, p = 0.003) were larger than the ratio in the whole region (1.355, p = 0.013). Thus, anterior subregions have a greater relative difference between early and advanced disease than the whole subcutaneous region.
Tissue Sodium Content in Early and Advanced Lymphedema Legs for Each Subcutaneous Subregion
Bold p-values <0.05 meet criteria for significance.
Q1 Median and Q3 (Mean ± SD). p Value of each ratio from linear mixed-effects models. TSC is measured in millimoles per liter. All measurements were analyzed on a log scale, that is, the difference in TSC on a log scale (=log(TSC in advanced LEL) − log(TCS in early LEL) = log(TSC in advanced/TSC in early), where “ratio of TSC” = TSC in advanced/TSC in early).
Discussion
Noninvasive sodium imaging by 23Na-MRI demonstrated higher TSC in legs with lymphedema compared with contralateral legs in unilateral LEL cases. The unilateral cohort demonstrated the local effect of lymphatic impairment on TSC, which was observed downstream to damaged lymphatics in the affected limb, and, despite potential variations in physiology (i.e., dietary or renal sodium handling), represented in both limbs. Furthermore, tissue sodium was nearly 50% higher in lymphedema skin (1.51-fold) and SAT (1.47-fold) compared with controls without lymphedema. Together, findings provide evidence that excess sodium accumulation is the result of lymphatic impairment in lymphedema.
Skin showed accumulation of TSC in early LEL at Stage I (1.38-fold compared with Stage 0, p = 0.008). Importantly, the SAT TSC, though often unremarkable in 23Na-MRI studies of cardiovascular and renal disease, 14 exhibited significant elevation in lymphedema by Stage II (1.55-fold compared with Stage 0, p < 0.001). At this lymphedema stage, fibrosis becomes palpable, and biopsies confirm a mixed tissue composition of fluid, fat, and fibrosis.21,22 Thus, it is possible that the increase in TSC at this inflection point could be due to both edema accumulation and adipose tissue remodeling into fibrosis. 23 This interpretation is consistent with increased sodium concentration around negatively charged proteins, especially glycosaminoglycans in extracellular matrix, which can exceed 300 mmol/L in joint cartilage. 24
The application of 23Na-MRI and noncontrast 1H-MRL showed that legs with evidence of edema on MRL had nearly twofold higher adipose TSC than those without apparent edema. Skin and SAT TSC are also positively correlated with MRL lymphedema severity. Observing a correlation between two distinct image contrasts on 23Na/1H MRI strengthens the conclusion that tissue sodium accumulates with subcutaneous edema and emphasizes that sodium is an important component of edema physiology. Future studies are investigating the spatial extent to which sodium and edema correlate and applying flow-sensitive MRL strategies to relate TSC to a quantitative measurement of lymphatic function.
In legs with lymphedema, the anterior leg SAT TSC is more than 1.5-fold increase compared with controls (subregions R2, R7, and R8). Both control and lymphedema legs stored the most sodium in the anterior SAT subregions. The anterior SAT region, where we observed the greatest elevation in TSC in lymphedema compared with controls, may be particularly prone to edema accumulation because it bisects the mapped anterolateral and anteromedial lymphatic territories in the legs that drain to inguinal lymph nodes. 25 This is also a region that may be impacted by compression therapy in those with prior treatment, which may apply local padding unevenly to distribute bandaging pressures. Overall, results suggest that tissue sodium storage reflects regions prone to edema and tissue remodeling, warranting further physiological imaging studies to understand both anatomy and function of lymphatic pathways and their role in lymphedema.
TSC measured by 23Na-MRI has advantages over current tools for lymphedema. 26 Noninvasive tools designed to measure fluid accumulation, such as bioimpedance spectroscopy,6,27 have reduced sensitivity and reliability in advanced disease when adipose remodeling is predominant.28–30 Limb circumference and volume changes may be nonspecific to internal tissue changes. 31 Unlike lymphoscintigraphy and near-infrared fluorescent lymphangiography, 23Na-MRI is standardized, provides molecular specificity without the use of exogenous contrast agents, and captures physiological changes in deeper tissue regions, such as the adipose tissue. Because this established protocol is standardized against known concentrations of saline, TSC is comparable across participants and studies. 32 Furthermore, 23Na-MRI can be applied with other MRI techniques; for example, conventional 1H-MRI, which is appropriate to study fat accumulation, tissue edema, and skin thickness. 33 To apply 23Na-MRI, specialized hardware is required, called a radiofrequency coil, which is tuned to 23Na magnetic resonance frequency. The acquisition and analysis protocol we employ to standardize the measure of TSC has been applied at numerous centers and is feasible on clinical-grade 3 T MRI scanners. 14 A demonstration video is available for further instructions on applying standardized 23Na-MRI in the extremities (https://app.jove.com/v/30915/using-23na-magnetic-resonance-imaging-to-measure-sodium-muscle).
This study reports initial observations of TSC in patients with leg lymphedema. The cross-sectional design did not allow for conclusions to be made regarding disease progression or the potentially dynamic nature of tissue sodium. The LEL cohort (n = 38) had mixed etiologies of lymphatic impairment due to primary or secondary cancer-related lymphedema. The cohort does not include lymphedema associated with filariasis, heart failure, or trauma. Findings represent bulk tissue sodium, although it could be interesting to observe separately in compartments of fibrotic tissue, adipose tissue remodeling, and edematous tissue.
Conclusions
23Na-MRI demonstrates that standardized TSC measurement is distinctly elevated in the skin and SAT affected by lymphedema compared with contralateral, unaffected legs without lymphatic impairment and control legs. Skin and SAT sodium increase with increasing lymphedema clinical stage and with edema severity score derived from MRL. Adipose TSC accumulates locally in the anterior leg in controls and to a greater extent in patients with lymphedema. These findings reveal tissue sodium as a prominent feature of lymphatic physiology, anatomy, and function in patients with lymphedema.
23Na-MRI begins to address the need for objective diagnostic tools for lymphedema that are sensitive to disease mechanisms and could serve as outcome measures in emerging clinical trials. As new therapies are being developed to treat lymphedema,34–36 sensitive metrics of disease severity and treatment response are needed, where imaging could fill a technology gap.37–39
Authors’ Contributions
S.L.T.: Methodology, software, formal analysis, investigation, writing—original draft, and visualization. V.N.C.: Methodology, validation, investigation, and data curation. S.-C.C.: Methodology, formal analysis, writing—reviewing and editing, and visualization. M.D.P.: Methodology, software, validation, formal analysis, and funding acquisition. M.E.G.: Investigation, data curation, and project administration. J.A.B.: Investigation and data curation. C.N.W.: Investigation and data curation. M.P.D.: Investigation and data curation. A.O.S.: Investigation and data curation. M.A.: Methodology, data curation, validation, formal analysis, and funding acquisition. Y.L.: Methodology, formal analysis, visualization, and supervision. A.O.: Methodology and formal analysis. N.N.: Methodology and formal analysis. A.J.B.: Conceptualization, resources, and supervision. P.M.C.D.: Conceptualization, methodology, resources, validation, and writing—reviewing and editing. R.L.C.: Conceptualization, methodology, resources, writing—original draft, supervision, project administration, and funding acquisition.
Footnotes
Acknowledgments
The authors thank the Vanderbilt Institute of Imaging Sciences (VUIIS) Human Imaging Core technologists for providing experiment support. The authors are grateful to Philips for the experimental support from Charles Nockowski and Ryan Robison, PhD.
Author Disclosure Statement
The authors declare no conflicts of interest.
Funding Information
Funding was provided by the National Institutes of Health (NIH) National Heart, Lung, and Blood Institute grant R01HL155523 (PI: R.L.C.) and R01HL157378 (PI: R.L.C.); Lipedema Foundation grant #12 (P.M.C.D.); and the Institutional National Research Service Award T32 EB001628 (PI: Gore, Postdoctoral Fellow M.D.P.) and F32 Postdoctoral Fellowship (PI: M.A.). The content is solely the responsibility of the authors and does not necessarily represent the official views of the NIH. Imaging experiments were performed at the VUIIS Human Imaging Core, with instruments funded by NIH grant 1S10OD021771-01. Research resources included REDCap, supported by the National Center for Advancing Translational Sciences Clinical Translational Science Award Program of the NIH, award number UL1 TR000445.
Supplemental Material
Supplemental Material
References
Supplementary Material
Please find the following supplemental material available below.
For Open Access articles published under a Creative Commons License, all supplemental material carries the same license as the article it is associated with.
For non-Open Access articles published, all supplemental material carries a non-exclusive license, and permission requests for re-use of supplemental material or any part of supplemental material shall be sent directly to the copyright owner as specified in the copyright notice associated with the article.