
Abstract
Background/Aim:
Although various distinctive morphological features such as hyperproliferation of adipocytes, fibrosis, and inflammation have been described in the progression of lipedema, the underlying mechanisms of these changes are not yet fully understood. In this study, we aimed to investigate the neutrophil-to-lymphocyte ratio (NLR), platelet-to-lymphocyte ratio (PLR), mean platelet volume (MPV), and platelet distribution width (PDW) to demonstrate the role of inflammation in lipedema.
Methods:
The retrospective study consisted of 60 lipedema patients (Group 1) and 40 healthy controls (Group 2). The age, height, weight, and body mass index (BMI) of all participants were recorded, along with the lipedema type and stage for Group 1. Laboratory results, including complete blood count, C-reactive protein (CRP), and erythrocyte sedimentation rate (ESR), were obtained for all participants. Hemoglobin, leukocyte, lymphocyte, neutrophil, and platelet counts, NLR, PLR, MPV, PDW, CRP, and ESR were evaluated.
Results:
The mean age was 45.45 ± 10.17 years in Group 1 and 44.90 ± 10.69 years in Group 2; the BMI was 32.15 ± 5.05 in Group 1 and 30.94 ± 4.98 in Group 2, with no significant difference between the groups (p > 0.05). The most common type was Type 2 lipedema. Platelet counts, CRP, NLR, and PLR levels were significantly higher in Group 1 than in Group 2 (p < 0.05). There was no difference between groups in MPV and PDW values (p > 0.05). There was a positive correlation between BMI and both leukocyte count and CRP levels (p < 0.05).
Conclusion:
In our study investigating inflammation in lipedema—an etiology that is still not fully understood—NLR, PLR, platelet count, and CRP levels were found to be significantly higher in the patient group. The increase in BMI was correlated with leukocyte count and CRP levels. This finding is important for elucidating the etiopathogenesis of the disease, and we believe it may guide future research in this area.
Introduction
Lipedema is a painful, chronic, and progressive adipose tissue disorder, typically presenting as symmetric enlargement of the hips and legs in women. 1 It is often misdiagnosed as obesity or lymphedema. It may be associated with physical and psychosocial morbidity. 2 While it is reported that lipedema affects approximately 11% of women after puberty, 22%–34% of admissions to lymphedema centers are said to be lipedema cases. 3
The pathophysiology of lipedema is not as well understood as that of lymphedema. Just as interstitial fluid accumulation induces inflammation and fibrosis in lymphedema, it is possible that in lipedema, interstitial fluid buildup may also drive inflammation and subsequent tissue remodeling processes. 4 In obesity, adipocyte hypertrophy has been associated with an increase in macrophages and increased gene expression of pro-inflammatory factors. 5 Monocytes-macrophages may play a role in the pathogenesis of venous insufficiency development because they lead to the release of growth factors, cytokines, and matrix metalloproteinases, causing an inflammatory response and tissue damage. 6 Although various distinctive morphological features such as hyperproliferation of adipocytes, fibrosis, and inflammation have been described in lipedema, the underlying mechanisms of these changes remain unclear. When subcutaneous adipose tissue was studied in patients with lower limb lipedema, compared to healthy control tissue, findings included hypertrophic and hyperplastic adipocytes, increased intercellular fibrosis, crown-like structures, and elevated macrophage levels. Moreover, it has been reported that the adipose tissue of individuals with lipedema is exposed to tissue inflammation and excessive fluid accumulation.7–9 All these findings suggest the presence of inflammation in lipedema.
Commonly utilized markers for evaluating inflammatory processes across various diseases include parameters that may be simply and inexpensively derived from a complete blood count, such as neutrophil count, lymphocyte count, platelet count, neutrophil-to-lymphocyte ratio (NLR), platelet-to-lymphocyte ratio (PLR), mean platelet volume (MPV), platelet distribution width (PDW), and plateletcrit (PCT), which represents the percentage of platelets in the blood.10–12 It has been reported that MPV decreases during active clinical phases of rheumatological diseases and shows a negative correlation with C-reactive protein (CRP) and erythrocyte sedimentation rate (ESR), suggesting that it may be used as a negative acute-phase reactant.11,12 NLR has been reported to be effective in demonstrating systemic inflammation in rheumatic diseases, including rheumatoid arthritis and Behçet’s disease.13,14 It has been predicted that NLR may be used as a subclinical inflammatory marker and to predict the development of amyloidosis in familial Mediterranean fever. 15 It was also found that NLR and MPV showed inflammation in patients with fibromyalgia syndrome (FMS). 16
In this study, we aimed to investigate the role of inflammation in the etiopathogenesis of lipedema by comparing NLR, PLR, MPV, and PDW values, which have not been previously studied in this patient group versus healthy controls, and to evaluate the relationship of these inflammatory parameters with lipedema severity.
Materials and Methods
Our study was designed retrospectively and included a total of 100 women: 60 patients diagnosed with lipedema (Group 1), who presented to our hospital’s Physical Medicine and Rehabilitation outpatient clinic between January 2020 and July 2023, and 40 healthy controls (Group 2) selected from hospital staff. All participants’ data were retrospectively reviewed from electronic medical records. Before starting the study, ethical approval was obtained from the Hitit University Clinical Research Ethics Committee (Date: January 14, 2025, Decision No: 2025/03).
The inclusion criteria were being between 18 and 65 years of age and having a diagnosis of lipedema. Exclusion criteria were other types of edema with a predominantly nonlipedema component (lymphedema, venous edema, edema due to heart or renal failure, etc.), having a body mass index (BMI) of >50.0, a rheumatological disease, a history of cancer, or being under 18 years of age. Healthy controls were selected from hospital staff aged 18–65 years without any known comorbidities.
The age, height, weight, and BMI of all participants were recorded, along with the lipedema type and stage for Group 1. The complete blood count, CRP, and ESR results of all participants were collected during the examination. From the complete blood count results, the following parameters were analyzed: Hemoglobin (g/dL), leukocyte (×109/L), lymphocyte (×109/L), neutrophil (×109/L), and platelet (×109/L) counts, MPV (fL), and PDW (fL). The NLR was calculated by dividing the absolute neutrophil count by the absolute lymphocyte count, and the PLR was calculated by dividing the absolute platelet count by the absolute lymphocyte count.
The diagnosis of lipedema was based solely on the patient’s history and clinical signs. To date, no techniques or objective, examiner-based tests have been established to confirm the diagnosis. Lipedema stages, which are based on morphology rather than pain intensity, are as follows: 17
Stage 1: Increased subcutaneous adipose tissue, enlargement of the hypodermis, and pearl-sized fat lobules, while the skin surface remains smooth.
Stage 2: Subcutaneous adipose tissue has a nodular or mass-like appearance with an irregular, rough skin surface.
Stage 3: Large nodular fat accumulations and fat lobules, leading to deformations in the legs or around the knees are observed.
Stage 4: Lipolymphedema has developed.
There are five types of lipedema: In Type 1 lipedema, the hips are primarily affected; in Type 2, the hips and thighs; in Type 3, the hips and thighs extending down to the ankles in a cuff-like pattern; in Type 4, the arms are affected, and there may be a fat pad around the wrist; and in Type 5, the lower legs are primarily involved. 17
Reliability analysis
The diagnosis of lipedema was made by two physical medicine and rehabilitation specialists (A.C.T. and E.E.). The consistency of categorical assessments between the two measures was examined using Cohen’s kappa coefficient (κ). Accordingly, κ = 0.805 was found for the lipedema stage. κ = 0.857 for type 1 lipedema (present/absent), κ = 0.838 for type 2 lipedema (present/absent), κ = 0.861 for type 3 lipedema (present/absent), and there was complete agreement in the assessment of type 4 lipedema (present/absent) and type 5 lipedema (present/absent; κ = 1).
Statistical analysis
The statistical analyses were performed using the IBM Statistical Package for the Social Sciences (SPSS) version 22.0. Descriptive statistics were presented as mean ± standard deviation for continuous variables with a normal distribution and as median (minimum–maximum) for variables without a normal distribution, while categorical variables were presented as frequencies and percentages. The normality of continuous variables was tested using the Shapiro–Wilk test. In the comparison of the patient and control groups, variables with a normal distribution were analyzed using the independent samples t-test, while variables without a normal distribution were analyzed using the Mann–Whitney U test. For comparisons involving more than two independent groups, the Kruskal–Wallis test was used for variables that were not normally distributed. When a statistically significant difference was identified, post hoc pairwise comparisons were conducted using appropriate adjustment methods. The comparison of categorical variables was performed using the chi-square test. To examine relationships between continuous variables, Pearson correlation analysis was used for normally distributed variables, and Spearman correlation analysis was used for nonnormally distributed variables.
Receiver operating characteristic (ROC) analysis was conducted to assess the diagnostic performance of the NLR, PLR, MPV, and PDW parameters. Based on the ROC analysis, the optimal sensitivity and specificity values were determined, and the corresponding threshold value was calculated using the formula Distance = √[(1-sensitivity)2 + (1-specificity)2], derived from the Pythagorean theorem. Given that MPV and PDW showed a negative correlation with ESR and CRP, the analysis was conducted with an emphasis on the decreasing values of these parameters, as they were deemed more relevant for indicating positive results. A p value of less than 0.05 was considered statistically significant in all analyses.
Results
The mean age was 45.45 ± 10.17 years in Group 1 and 44.90 ± 10.69 years in Group 2, with no significant difference between the groups (p > 0.05). The BMI was 32.15 ± 5.05 in Group 1 and 30.94 ± 4.98 in Group 2, and it was comparable between the groups (p > 0.05; Table 1).
Comparison of Demographic and Laboratory Parameters of Patient and Control Groups
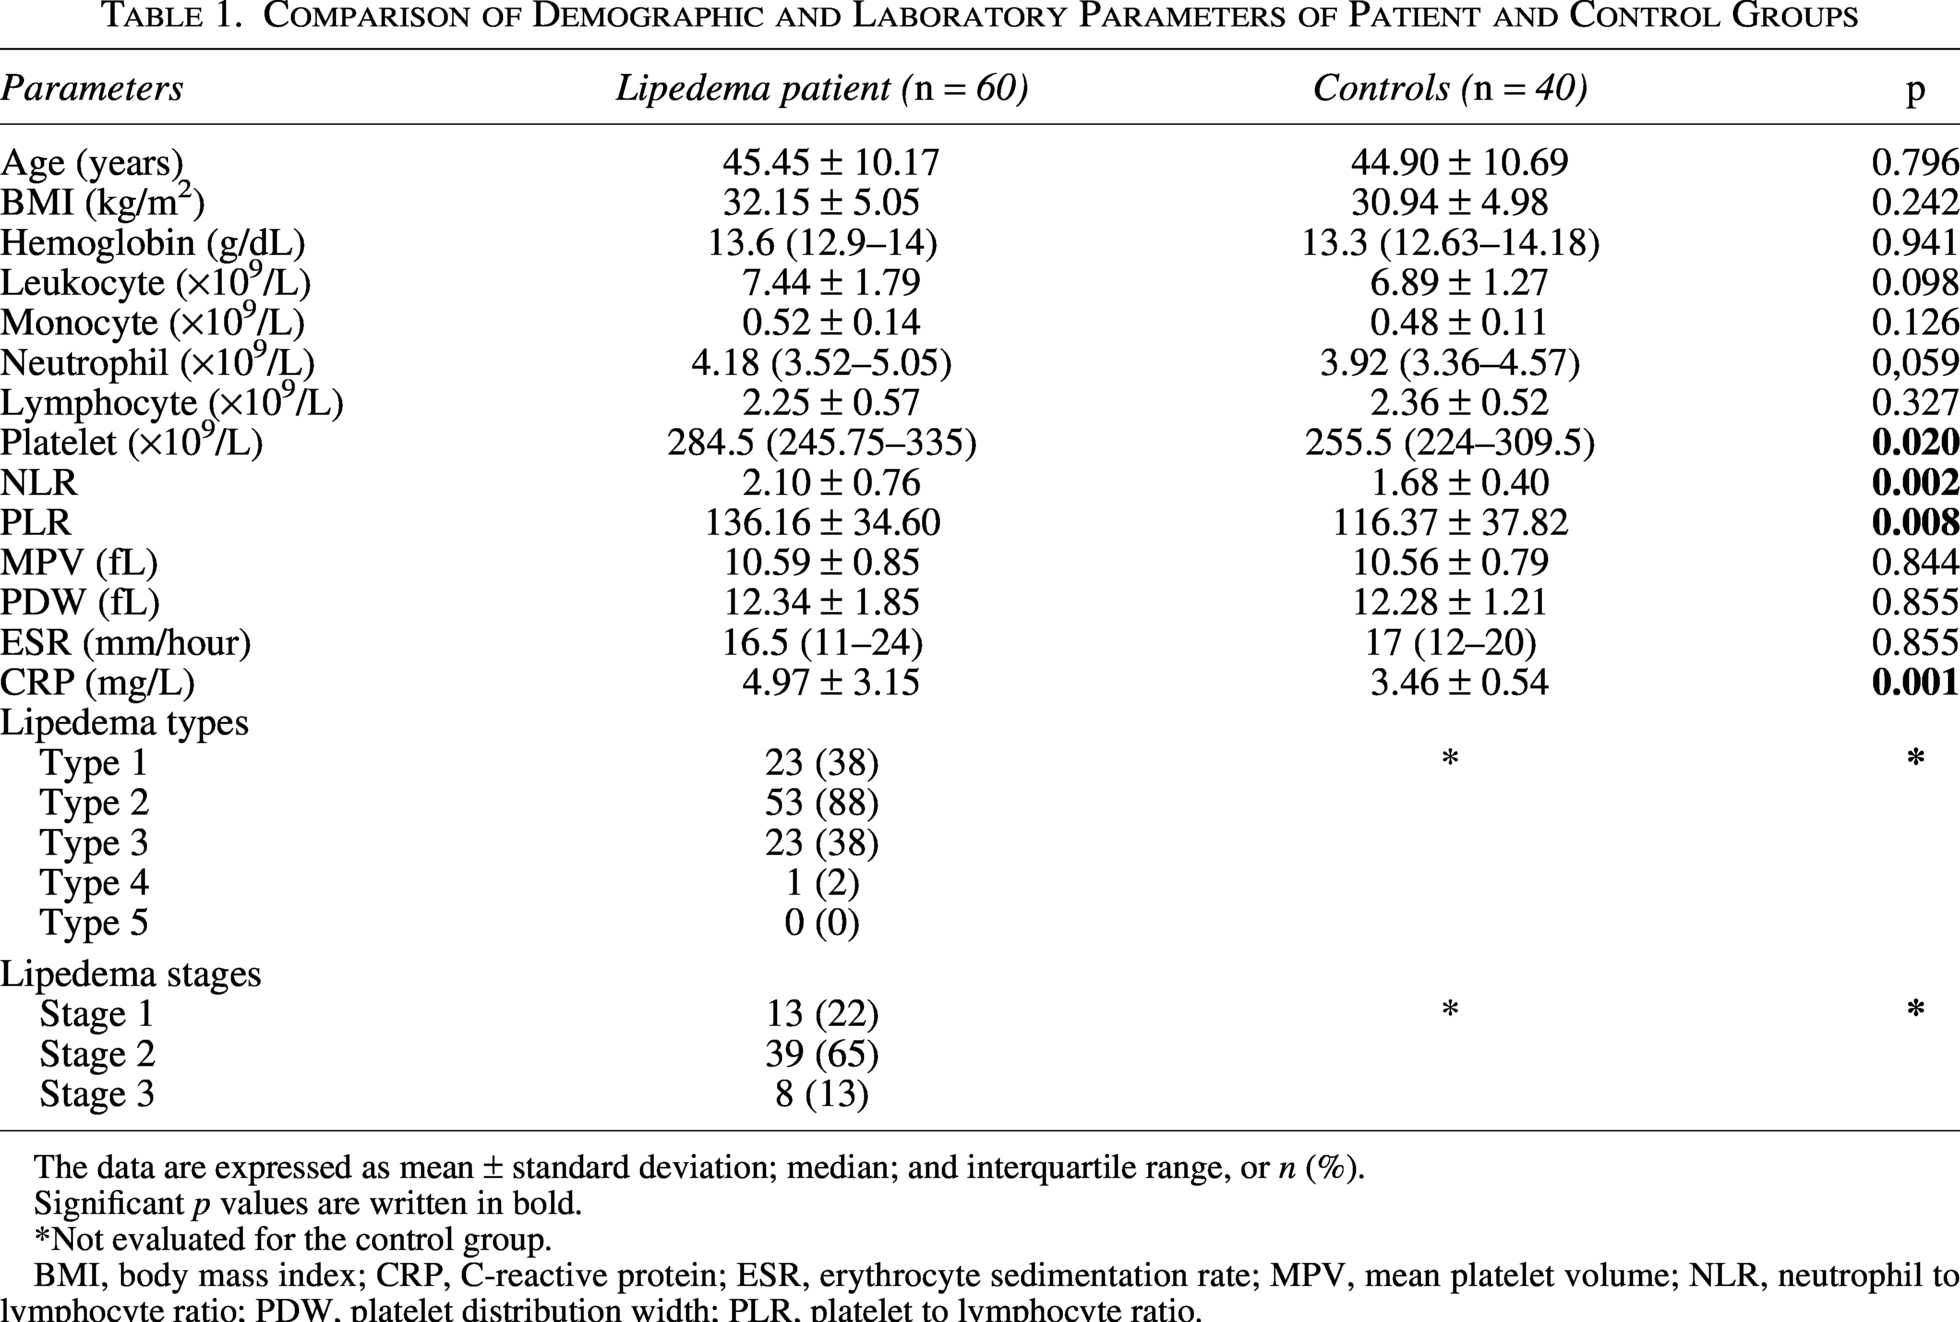
The data are expressed as mean ± standard deviation; median; and interquartile range, or n (%).
Significant p values are written in bold.
*Not evaluated for the control group.
BMI, body mass index; CRP, C-reactive protein; ESR, erythrocyte sedimentation rate; MPV, mean platelet volume; NLR, neutrophil to lymphocyte ratio; PDW, platelet distribution width; PLR, platelet to lymphocyte ratio.
Considering that one patient could have multiple types of lipedema, the most common type was type 2 lipedema (88%). The most common lipedema stage in the patients was stage 2 (65%; Table 1).
Hemoglobin, leukocyte, lymphocyte, and neutrophil counts, MPV, PDW, and ESR were comparable between groups, while platelet counts were significantly higher in Group 1 (p < 0.05; Table 1).
Compared to Group 2, Group 1 showed statistically significantly higher values for NLR (2.10 ± 0.76 vs. 1.68 ± 0.40), PLR (136.16 ± 34.60 vs. 116.37 ± 37.82), and CRP (4.97 ± 3.15 vs. 3.46 ± 0.54; p < 0.05; Table 1).
There was a positive correlation between body mass index and leukocyte count (r = 0.271, p = 0.036) and CRP (r = 0.286, p = 0.027), as well as between age and leukocyte count (r = 0.225, p = 0.019; Table 2).
Correlation Analysis of Demographic and Laboratory Parameters in Lipedema Patients (n = 60)
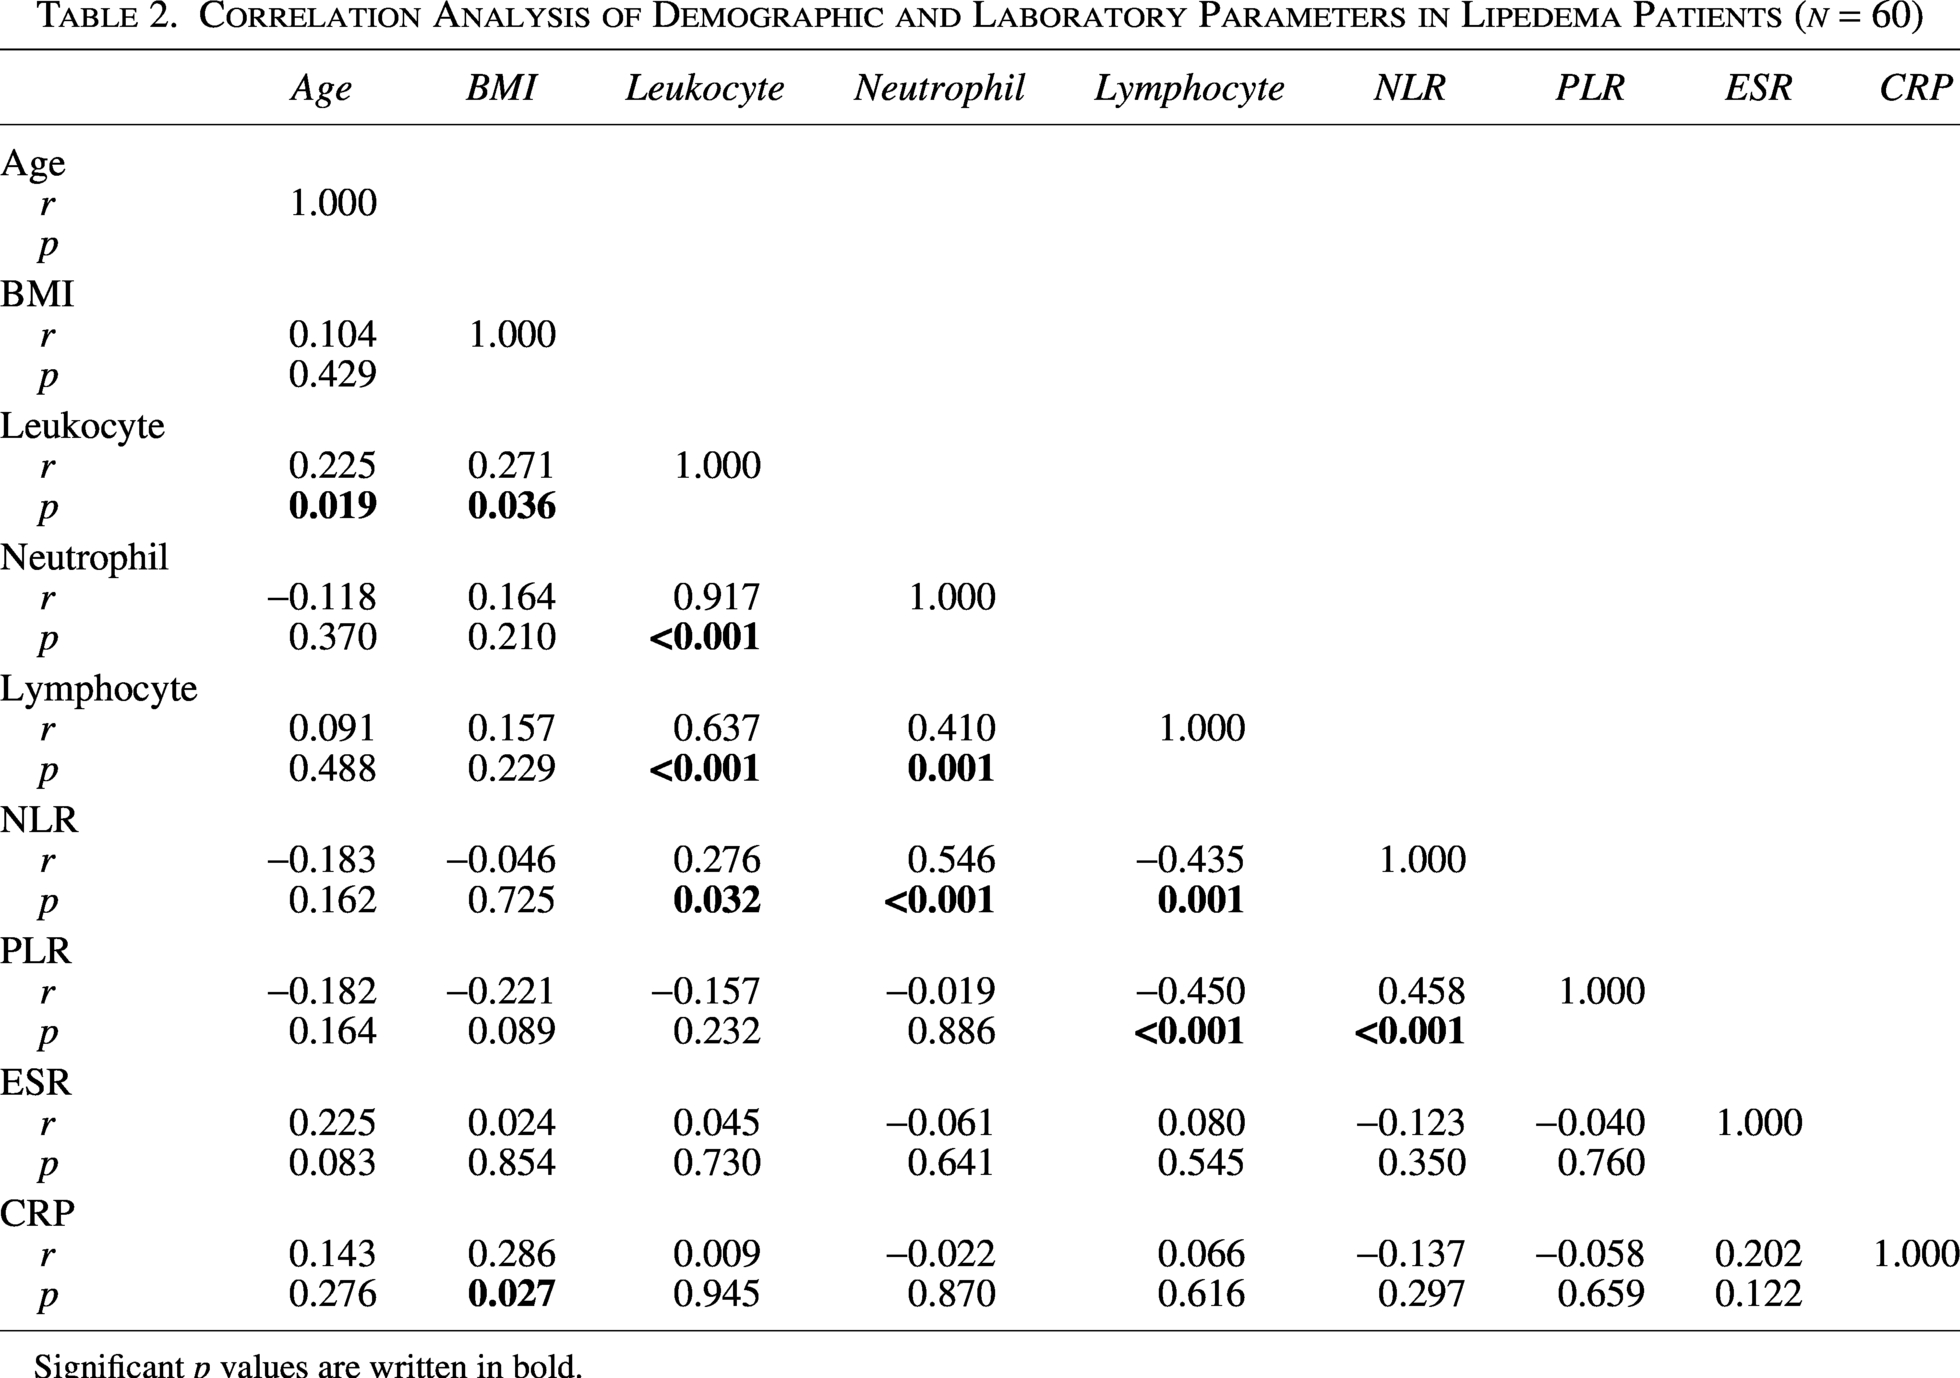
Significant p values are written in bold.
In the control group, there was no association between BMI and hematological parameters.
A comparison of lipedema stages revealed statistically significant differences in age, BMI, PLT, and PLR values (p < 0.05). Post hoc analysis showed significant differences in age between Stages 1 and 2 and in BMI between Stages 1–3 and Stages 2–3. Similarly, PLT and PLT levels were higher in Stage 3 compared to Stage 2. However, no significant differences were observed between groups in ESR, CRP, hemoglobin, WBC, and other hematological parameters (p > 0.05; Table 3).
Comparison of Demographic and Laboratory Parameters According to Lipedema Stages
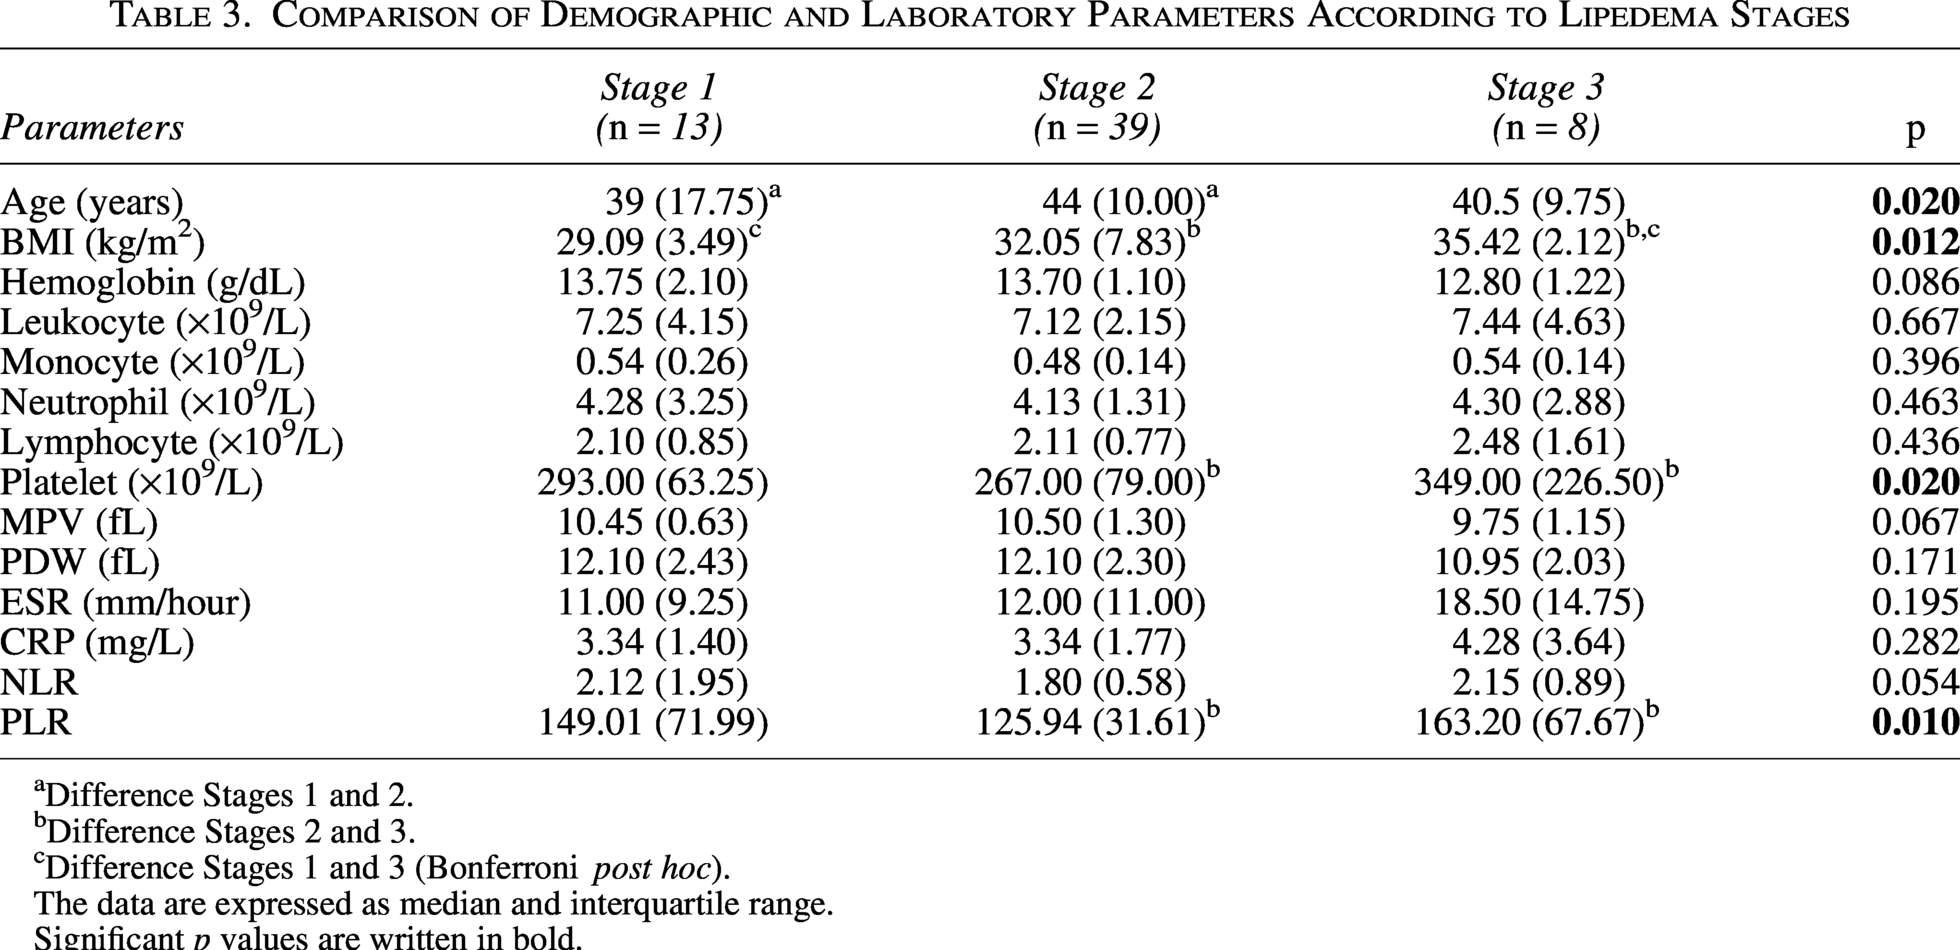
Difference Stages 1 and 2.
Difference Stages 2 and 3.
Difference Stages 1 and 3 (Bonferroni post hoc).
The data are expressed as median and interquartile range.
Significant p values are written in bold.
The ROC analysis results for the diagnostic values of NLR, PLR, MPV, and PDW, based on the threshold values of ESR >20 mm/hour and CRP >5 mg/dL, are presented in Table 4 and Figure 1. According to the ROC analysis results, none of these parameters demonstrated statistical significance in their diagnostic performance.
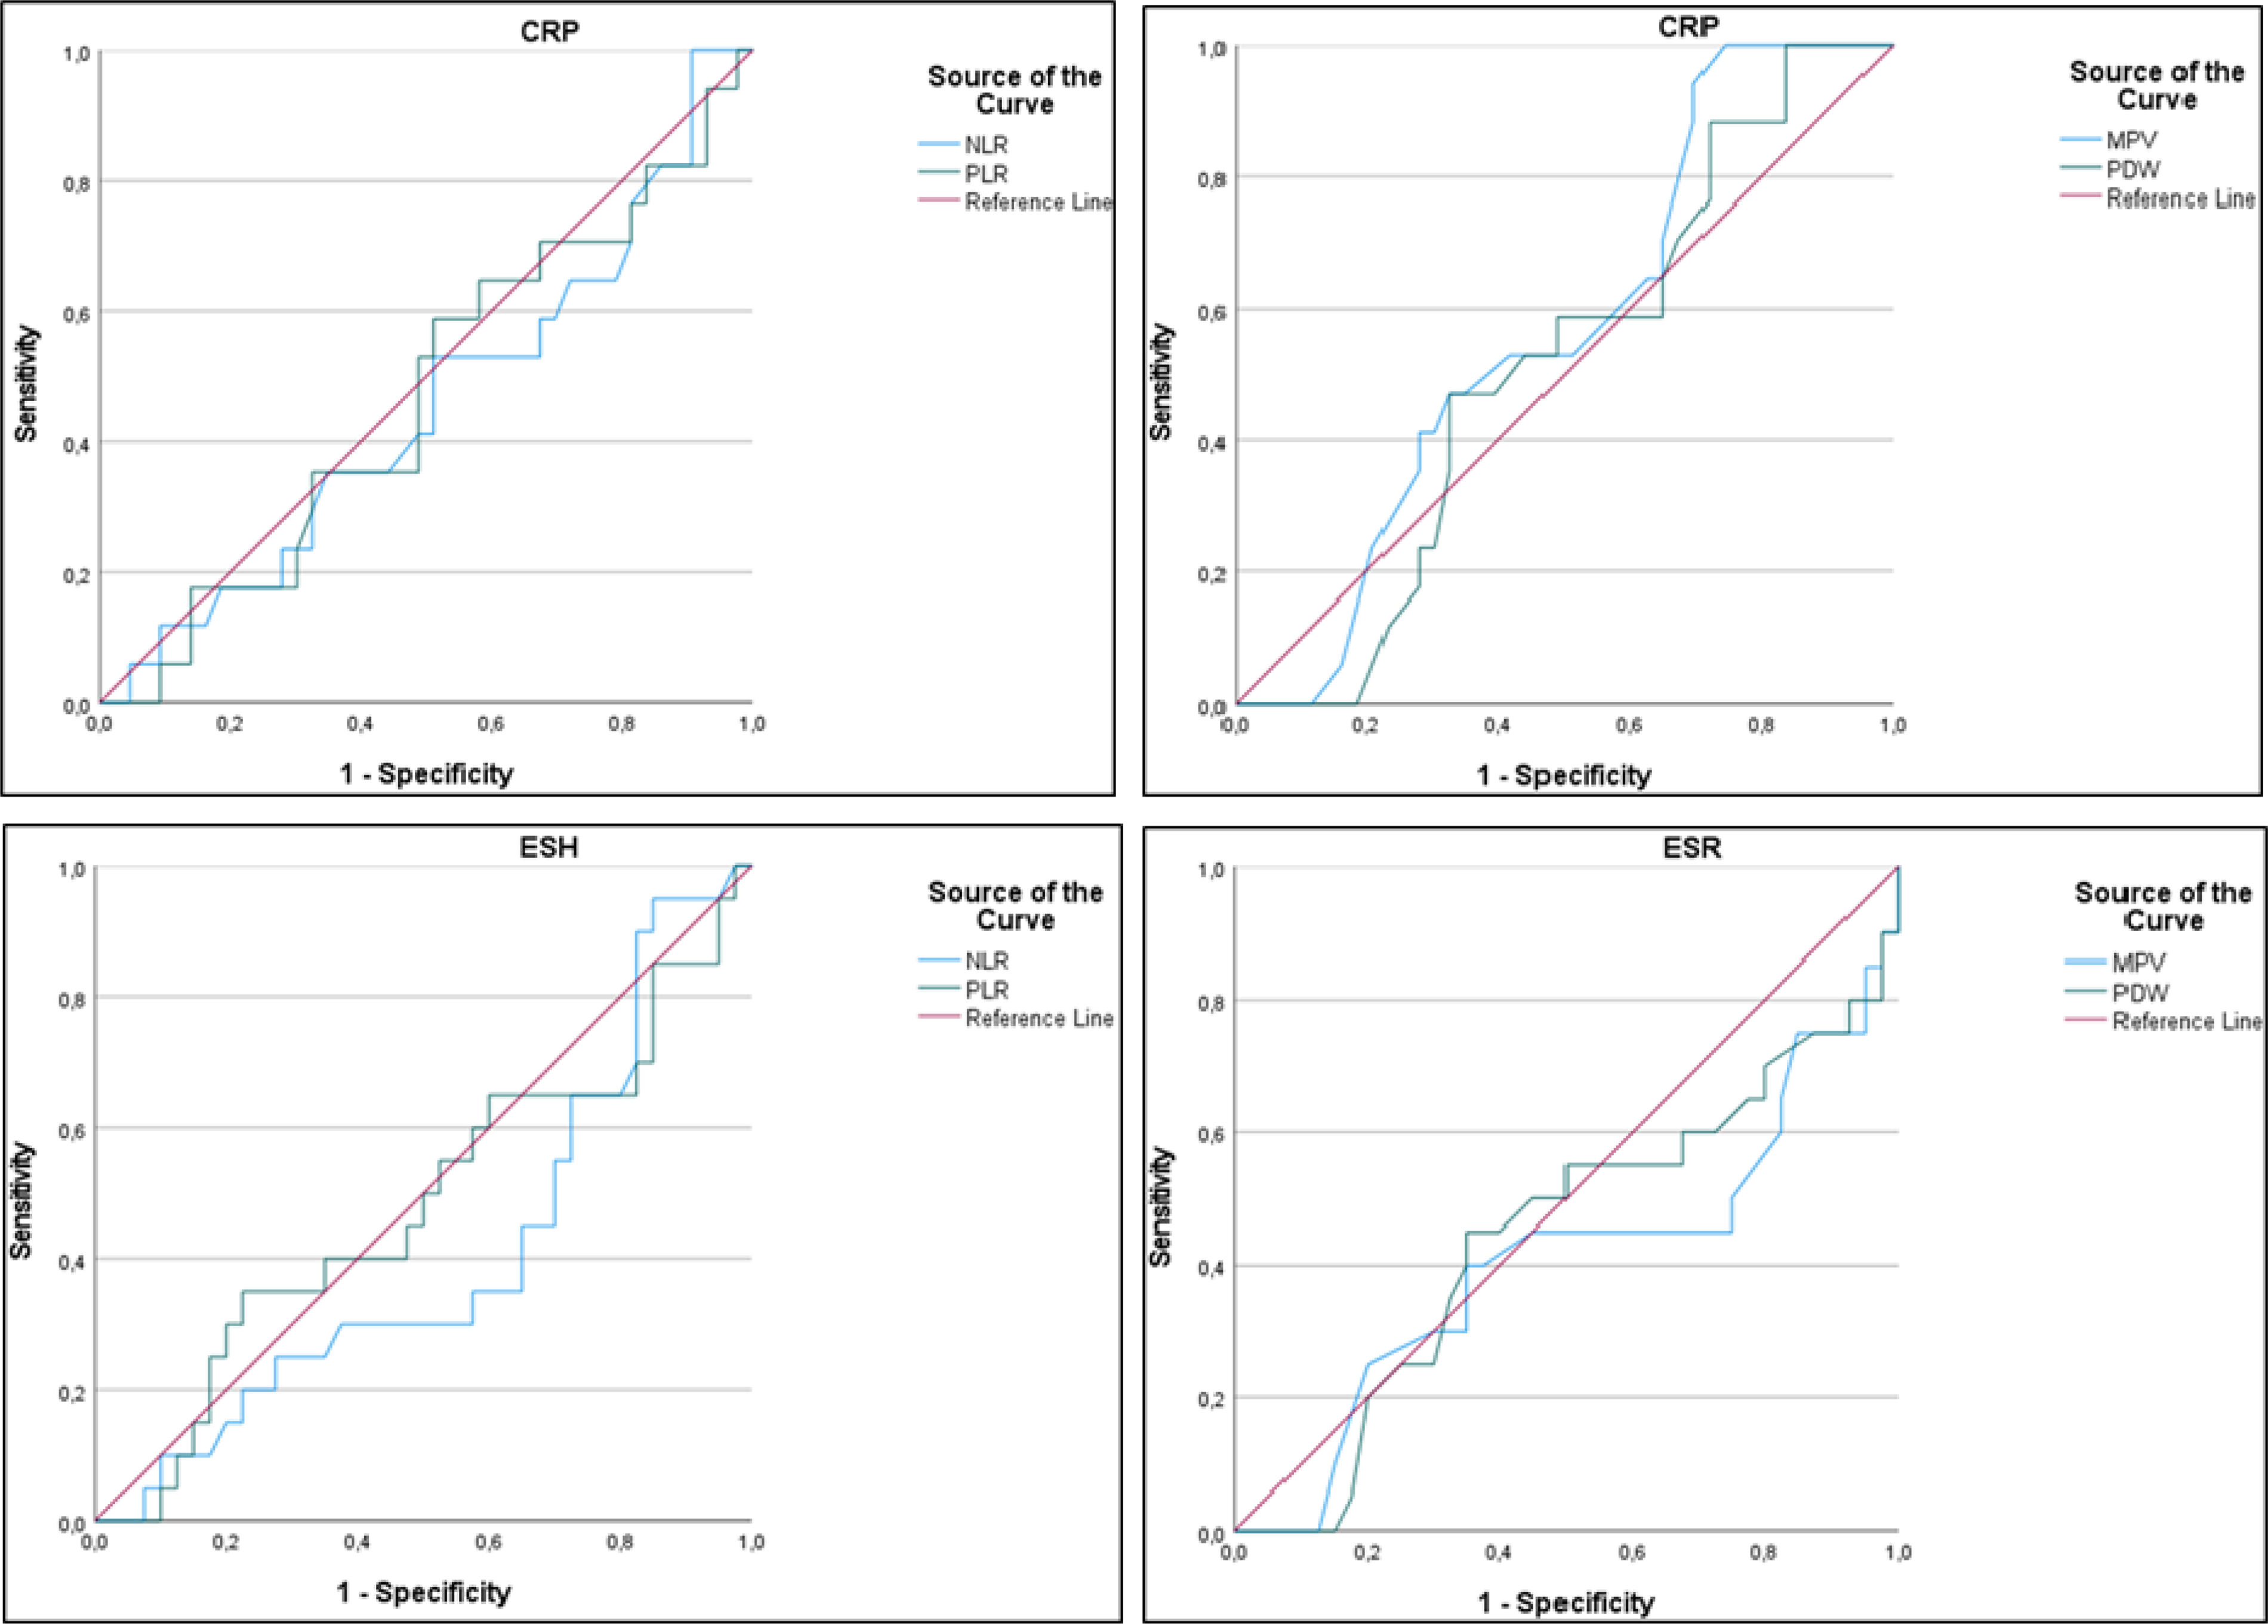
The cut-off graph for NLR, PLR, MPV, and PDW parameters in patients with lipedema, based on the threshold values of ESR >20 mm/hour and CRP >5 mg/dL. CRP, C-reactive protein; ESR, erythrocyte sedimentation rate; MPV, mean platelet volume; NLR, neutrophil to lymphocyte ratio; PLR, platelet to lymphocyte ratio; PDW, platelet distribution width.
Receiver Operating Characteristic Curve Analysis Results of Platelet and Lymphocyte Parameters in Patients with Lipedema Based on Erythrocyte Sedimentation Rate and C-Reactive Protein Threshold
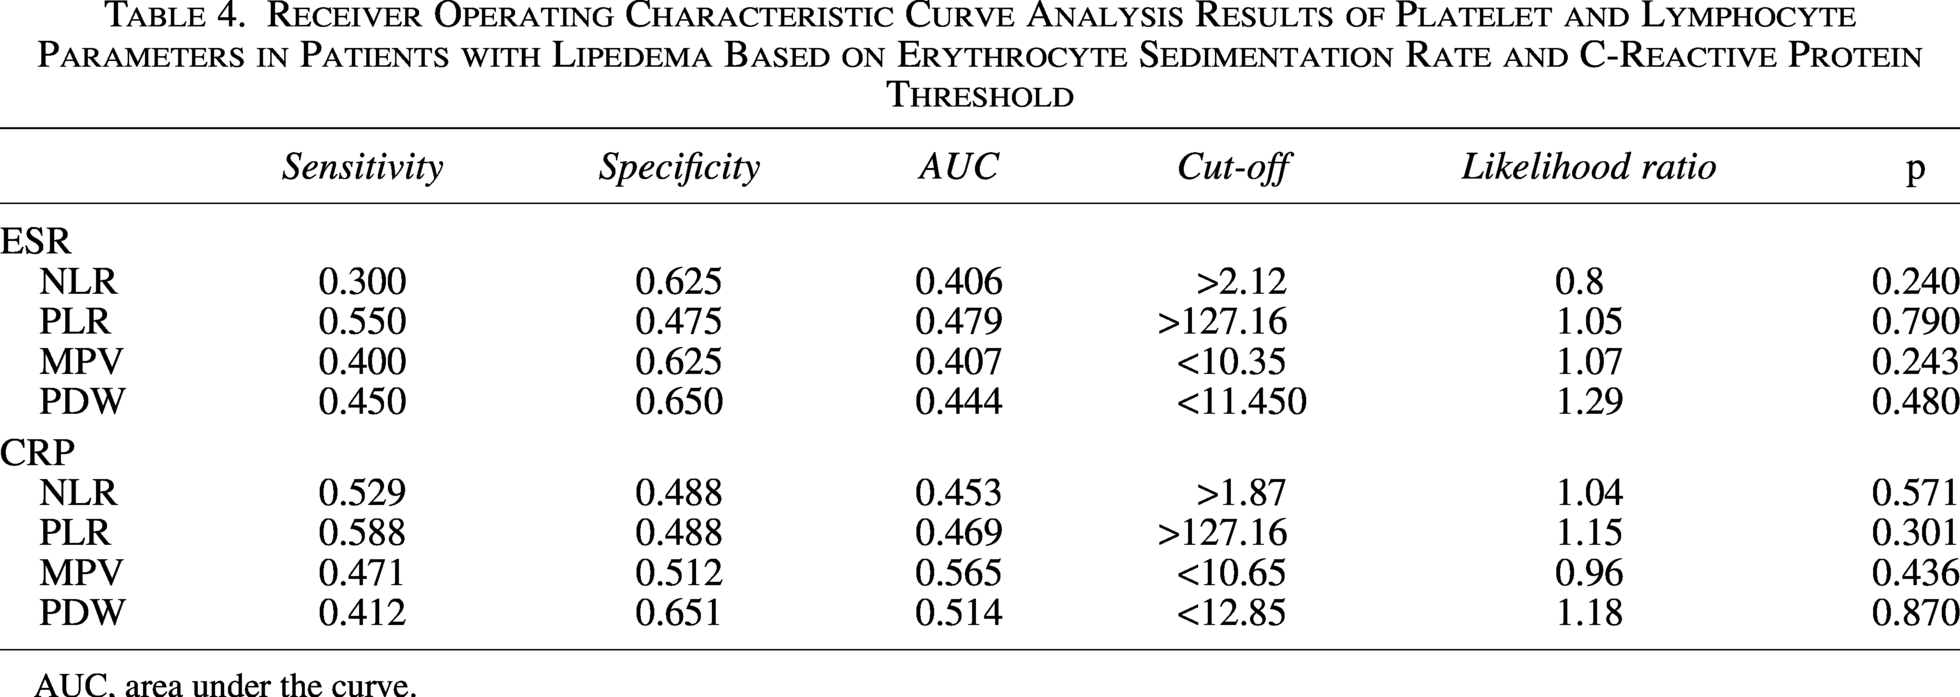
AUC, area under the curve.
Discussion
In our study investigating the presence of inflammation in lipedema, a condition with an etiology that remains unclear, we found that NLR, PLR, and platelet counts were significantly elevated in the patient group. An increase in BMI was associated with higher leukocyte counts and CRP levels. This finding is important for elucidating the etiopathogenesis of the disease, and we believe it may guide future research in this area.
The enlargement of subcutaneous adipose tissue (SAT) in lipedema occurs through adipocyte hypertrophy and the formation of new fat cells. Similar to lymphedema, inflammatory markers in lipedema include immune cell infiltrates in the SAT, where elevated macrophages surrounding fat cells have been shown to form crown-like structures. 4 A tissue remodeling process, resembling but distinct from obesity, leads to hypoxia, resulting in necrosis, inflammation, and fibrosis. 18 Adipocyte hyperproliferation exerts pressure on capillaries, causing hypoxia, which in turn induces the production of inflammatory cytokines, macrophage infiltration, and adipocyte necrosis.19,20 In primary obesity, although increased expression of inflammation-related genes has been detected in both abdominal and gluteofemoral SAT, this association has been shown to be significantly weaker in the gluteofemoral SAT, unlike in lipedema. 5 Immunohistochemical analysis of skin biopsies taken from affected tissues in patients with chronic venous insufficiency revealed an increase in leukocyte counts, particularly T lymphocytes and macrophages. 21 Compared to healthy vascular tissues, monocyte/macrophage infiltration in varicose veins was predominantly found above and below the endothelium. 6
The neutrophil-to-lymphocyte ratio has been reported as a prognostic marker to assess systemic inflammatory responses and has been associated with increased disease activity in many systemic, rheumatological, neurological disorders, and cancers. 16 Several studies have shown that NLR values are higher in patients with rheumatoid arthritis compared to controls.22,23 Erden et al. also reported elevated NLR levels in patients with ankylosing spondylitis. 24 In another study, significantly higher NLR levels were found in patients with FMS compared to healthy controls. 16 Tasoglu et al. evaluated the correlation between severe knee osteoarthritis and NLR, reporting that patients with severe knee osteoarthritis had higher blood NLR values compared to those with mild knee osteoarthritis. In the same study, ROC curve analysis revealed that a blood NLR of ≥2.1 predicted severe knee OA with 50% sensitivity and 77% specificity. 23 In our study, we also found that the NLR levels were higher in the lipedema patient group. However, in the ROC analysis, NLR did not demonstrate statistical significance as a diagnostic criterion. Therefore, although these parameters point to inflammation, large-scale studies are needed in this area. A limiting factor of our study is that the symptoms of lipedema patients were not evaluated due to the retrospective design, and the relationship between inflammation and symptoms such as pain, tenderness, and bruising should be evaluated in new studies.
In inflammatory conditions, platelets are activated, leading to significant changes in their structure and function. 24 In diseases such as rheumatoid arthritis, where the inflammatory response is elevated, lower MPV levels have been observed, and it has been suggested that this may be due to the intense consumption of platelets at the site of inflammation. This low level may be attributed to increased usage during the acute phase. It has been reported that in inflammatory diseases, large-volume platelets migrate to the site of inflammation and are consumed there, which secondarily stimulates platelet production and leads to an increase in circulating platelet count. 25 In a study conducted on AS, it was reported that PLR levels were elevated in the patient group and that PLR demonstrated diagnostic value. 24 Obesity is also associated with increased platelet counts, 26 and this is further supported by observed reductions in platelet counts following weight loss after bariatric surgery. 27 Aydın et al. reported that when women were divided according to whether their BMI was below or above 30, platelet counts were higher in the group with a BMI above 30. 28 In our study, both the platelet counts and PLR were found to be higher in the lipedema group.
Platelet indices such as PDW and MPV have previously been investigated as inflammatory markers in inflammatory diseases. 16 Kısacık et al. reported that PDW was significantly lower in patients with ankylosing spondylitis and rheumatoid arthritis compared to controls. 29 Işık et al. suggested that PDW could be considered a negative acute-phase reactant for rheumatoid arthritis. 30 PDW is an indicator of variability in platelet volüme. 31 In a study conducted by Illeez et al. involving 216 patients with AS, PDW values were found to be significantly lower in the AS group, and PDW values were reported to be comparable in patients during both the active and remission phases of the disease. 32 Yazıcı et al. reported that MPV was associated with inflammatory markers and disease activity in rheumatoid arthritis. 33 In a study conducted on patients with fibromyalgia, MPV levels were found to be elevated, while PDW levels were found to be decreased. 16 In our study, MPV and PDW values in patients with lipedema were comparable to those in the control group.
Human CRP, which increases in many inflammatory, infectious, and malignant diseases, is a β-globulin. 34 Previous studies have shown a strong association between high BMI levels and high CRP, which is an indicator of low-grade inflammation.35,36 Keskin et al., in their study examining the relationship between obesity and inflammation, divided patients into three groups based on BMI: below 25, between 25 and 30, and above 30 and demonstrated significant differences in ESR and CRP parameters among the groups. 34 Keleş et al., in their study evaluating the effects of obesity starting in young adulthood on metabolic parameters and dividing patients into two groups based on BMI (below 25 and above 25), reported that ESR and CRP values were comparable between the groups. 37 In our study, the CRP level in lipedema patients was significantly higher compared to that in the controls, while ESR values were comparable between the groups. We also found a positive correlation between BMI and CRP. However, in the control group patients, BMI and CRP were not related.
In a study by Kruppa et al. involving 32 patients with lipedema, it was reported that subcutaneous fat tissue, fat cell hypertrophy, interstitial fibrosis, and increased macrophage ratio were associated with an increased stage of lipedema. 5 A study reported that in subcutaneous adipose tissue affected by lipedema, anti-inflammatory M2-like macrophages appeared to be the dominant type in Stage I, but this effect was no longer significant in more severe stages, and pro-inflammatory macrophages became prominent in advanced stages. 38 Our study found a correlation between lipedema stage and PLT and PLR. Although Type 2 lipedema was more common among our patients, it was not possible to generalize our results based on type because a patient may have more than one type of lipedema simultaneously. However, although Stage 2 patients were in the majority, our study showed that inflammation increased with the stage.
Our study has some limitations. The retrospective design limits causal inferences between lipedema and laboratory markers, as it is based on historical data without the ability to control for temporal changes or interventions. Another limitation of our study is that the relationship between the patients’ symptoms and inflammation was not evaluated.
In conclusion, in our study evaluating the role of inflammation in lipedema, we found that NLR, PLR, platelet counts, and CRP were elevated in lipedema patients. We also found that the increase in BMI was correlated with leukocytes and CRP. Due to the lack of etiology-based treatments for lipedema, the discovery of new, promising biomarkers could provide potential solutions for combating this complex disease.
Authors’ Contributions
The authors declare that they have all participated in the design, execution, and analysis of the article and that they have approved the final version.
Footnotes
Author Disclosure Statement
The authors report no conflicts of interest. None of the authors have any conflict of interest, financial or otherwise. The authors have no competing interests to declare.
Funding Information
The authors declare that this study has received no financial support.