
Abstract
Single-cell technologies have favored extensive advancements in cell-type discovery, cell state identification, development of lineage tracing, and disease understanding among others. Further, single-cell multi-omics data generated using modern technologies provide several views of omics contribution for the same set of cells. Analyzing these views of multi-omics data is hindered by large dimensions of the same. In this regard, one effective approach is dimensionality reduction and thereby visualization (in 2D or 3D space) of the integrated views of multi-omics data. However, dimension reduction and visualization of these datasets remain a challenging task since obtaining a low-dimensional embedding that preserves information about local and global structures in data is difficult. Moreover, combining different views obtained from each omics layer to interpret the underlying biology is even more challenging. In this work, we introduce NeuroMDAVIS, a novel unsupervised deep neural network model, for joint visualization of biological datasets having multiple modalities. Joint visualization refers to transforming the feature space of each modality and combining them to produce a latent embedding that supports visualization of the multi-modal dataset in the newly transformed feature space. NeuroMDAVIS transforms the feature space of each modality and integrates them into a shared latent space, capturing both modality-specific and common information across different layers. The model effectively learns both local and global relationships within the data, providing a meaningful low-dimensional representation for further analysis. NeuroMDAVIS is able to capture both individual modality-specific information as well as common information across all modalities. When it comes to visualization capability, NeuroMDAVIS competes against state-of-the-art visualization models such as t-distributed Stochastic Neighbor Embedding (t-SNE), Uniform Manifold Approximation and Projection (UMAP), Fast interpolation-based t-SNE (Fit-SNE), the Siamese network-based visualization method (IVIS), and the manifold learning-based generalized version of UMAP, called MultiMAP. Downstream analyses have reflected effective classification and clustering performance over all the datasets, in terms of accuracy, precision, recall, F1 score, and various cluster validity indices. To the best of our knowledge, NeuroMDAVIS is the first model to offer joint visualization for multi-modal biological datasets. It competes with the state-of-the-art visualization methods, providing a robust and efficient approach for understanding complex multi-omics data.
Keywords
INTRODUCTION
With technological advancements, the realm of molecular biology has advanced into a plethora of possibilities. Single-cell technology has opened up newer dimensions for omics data analyses that lead to unraveling of the disease or developmental processes at the cellular level. Single-cell RNA-sequencing (scRNA-seq) allows measurement of mRNA expressions at a cellular resolution. Current scRNA-seq protocols include DROP-seq (Macosko et al., 2015), SMART-seq2 (Picelli et al., 2013), 10x Genomics (Weisenfeld et al., 2017; Marks et al., 2019; Zheng et al., 2017; Satpathy et al., 2019), 10x Chromium (Farbehi et al., 2019), CEL-seq2 (Hashimshony et al., 2016) and MARS-seq (Adil et al., 2021). Assay for Transposase-Accessible Chromatin with sequencing (ATAC-seq) (Buenrostro et al., 2015), on the other hand, allows sequencing of open chromatin regions within the genome. More recently, joint sequencing technologies have come up, which allow simultaneous measurement of more than one modalities thereby offering multiple views of the same cells of interest. These technologies include CITE-seq (Stoeckius et al., 2017), REAP-seq (Peterson et al., 2017) (joint measurement of proteins and transcriptome), scM&T-seq (Angermueller et al., 2016), scMT-seq (Y. Hu et al., 2016), scTrio-seq (Hou et al., 2016) (simultaneous measurement of methylome and trascriptome), and sci-CAR (Cao et al., 2018), SNARE-seq (S. Chen et al., 2019) and SHARE-seq (Clyde, 2021) (joint measurement of chromatin accessibility and transcriptome in single-cells or nuclei). All these technologies facilitate deeper understanding of the cellular identity and processes in organs and tissues.
Addressing the challenges in data analysis with an eye towards interpretability has become necessary as data volumes have increased. A recently developed interpretable framework, called scMoMtf (Lan et al., 2024), capable of multi-task learning, can address some of these challenges involved in single-cell multi-omics data analysis. However, multi-omics datasets originate from different sources, and a large number of dimensions in each modality makes the data incredibly complex. Thus, reduction of dimension while preserving the inherent structures within the data, is a basic requirement for easy exploration and interpretation of data. Visualizations help in identifying patterns, clusters, outliers, and correlations within these single and multi-omics datasets.
The task of visualization can be thought as a refined dimension reduction (DR) task, where the number of reduced dimensions is limited to two or three. Some of the DR techniques developed so far are used to accomplish visualization task. Earlier, most of the DR methods were linear in nature (Van Der Maaten et al., 2009). However, a large number of nonlinear DR techniques for data visualization have come up during the last decade. These methods possess the ability to handle data nonlinearity. Methods such as Stochastic Neighbor Embedding (SNE), t-distributed SNE (t-SNE) (Van der Maaten and Hinton, 2008), and Fast interpolation-based t-SNE (Fit-SNE) (Linderman et al., 2019) assume that the data follow a particular theoretical distribution. Hence, they try to learn a low-dimensional embedding that follows a similar distribution, which, however, may contradict the assumption. Some methods, such as Isomap and Uniform Manifold Approximation and Projection (UMAP) (Becht et al., 2018), try to reconstruct the hidden topological structure within the data but fail to do so when the actual structure is complex. Other neural network-based methods such as IVIS (Szubert et al., 2019), SOM (Kohonen, 1990), and Autoencoders try to learn a suitable nonlinear transformation to project the data into a low dimension. Neural network-based methods have an edge over the others since they mostly do not assume any distribution of the data, and are nonparametric.
Interestingly, when it comes to visualizing observations from multi-omics experiments, there is no joint data visualization method that can combine views from several omics layers. Such a joint visualization can assist researchers in explaining the underlying biology of a system/process in a better way. MultiMAP (Jain et al., 2021), a recently developed method for dimensionality reduction and multi-omics integration (a more generalized version of UMAP), enables shared visualization of multi-omics datasets. It creates a nonlinear manifold representing different omics modalities, allowing the identification of shared features across cells in a co-embedded space. However, the shared visualization produced by MultiMAP generates separate embeddings for each of the omics modalities.
Thus, motivated by the wide benefits of using neural networks, in this work, we have introduced a multi-modal data visualization model developed under a deep learning framework to address this challenge. NeuroMDAVIS is capable of extracting crucial features from the data and producing an effective joint visualization. It is a feed-forward deep learning model that does not assume any kind of data distribution to visualize high-dimensional data. Most of the state-of-the-art methods have been observed to perform well on complex datasets when conjugated together with an initialization step like that of applying a Principal Component Analysis (PCA), to reduce the number of dimensions to something less than or equal to 50 (Kobak and Linderman, 2021). NeuroMDAVIS does not require any such initialization, which makes it more efficient and effective. Our primary aim is multi-omics data visualization; in this study, we have limited our experiments to multi-omics datasets only. NeuroMDAVIS is the first of its kind to generate a joint visualization of different omics modalities. It facilitates visualizing multi-omics modalities jointly, thereby providing an integrated view that captures correlations and interactions among modalities directly in the same space. However, it can be applied to other domains as well. Additionally, we have also explored how NeuroDAVIS, a precursor of NeuroMDAVIS (Maitra et al., 2024), performs on these multi-omics datasets when used on each omics modality separately.
METHODS
The unsupervised deep learning model, called NeuroMDAVIS, developed in this work, allows joint visualization of high-dimensional multi-omics datasets. To the best of our knowledge, it may be considered as the first model that allows joint visualization of multi-omics data. NeuroMDAVIS is a generalized version of NeuroDAVIS (Maitra et al., 2024) introduced earlier to provide visualization of a single data modality. Nevertheless, NeuroMDAVIS incorporates significant changes to the network architecture over NeuroDAVIS. Figure 1A and B describes the overall workflow and the detailed architecture of the proposed model.

NeuroMDAVIS architecture represents a novel structure as shown in Figure 1B. It consists of four different types of layers, viz., an Input layer, a Latent layer, one or more Hidden layer(s) and a Reconstruction layer. Hidden layer(s) are of two types, viz., Shared hidden layer(s) and Modality-specific hidden layer(s). Input layer, Latent layer, and Shared hidden layer(s) are densely connected, i.e., each node in any of these layers is connected to each node of its adjacent layer(s). However, Modality-specific hidden layer(s) does not share a completely dense connection; instead, it shares a dense connection modality-wise only.
Let
Input layer of NeuroMDAVIS takes an identity matrix of order
Forward propagation
We have considered a dataset

For the Latent layer, we have

Here, the weight parameters, controlled by the input

Thus, for the first Modality-specific hidden layer, we have
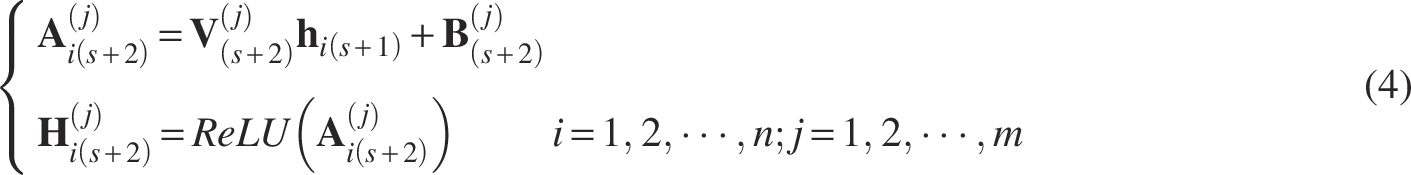
For the remaining Modality-specific hidden layer(s), we have

Finally, at the Reconstruction layer, a reconstruction (lossy) of the original data is formed. For the Reconstruction layer, we have

Thus, NeuroMDAVIS projects the latent embedding for a sample, obtained at the Latent layer, to different
NeuroMDAVIS enables DR and visualization of high-dimensional multi-omics data. Similar to NeuroDAVIS, NeuroMDAVIS also tries to reconstruct the data to be visualized. For

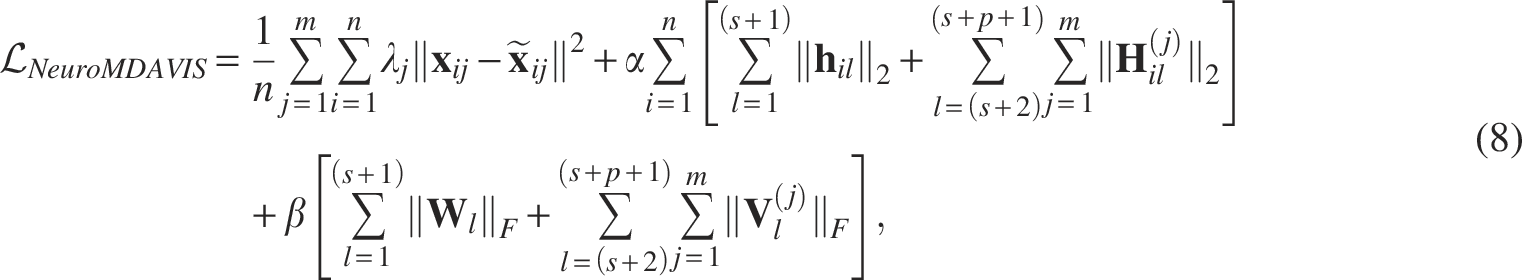
To avoid overfitting and minimization of model complexity, L2 regularization, involving activities of nodes and weights, has been considered. The objective function thus becomes
We have used the Adam optimizer for training NeuroMDAVIS. The number of epochs needed for convergence has been set empirically by monitoring the convergence behavior of the training loss. Section 3.4 further explains how other hyperparameters have been tuned. On convergence, NeuroMDAVIS learns a parametric function that can efficiently produce the omics modalities reconstructed from the low-dimensional latent embedding. This latent embedding has then been extracted to produce a joint visualization of the multi-omics data.
The first two layers of NeuroMDAVIS, viz., Input layer and Latent layer, are used to learn suitable regressors. In other words, they control the points in the low-dimensional embedding in each iteration, while the remaining part of the network tries to optimize a function that can project the low-dimensional data into high dimension. Once NeuroMDAVIS is trained on a training dataset, we can visualize the data at the Latent layer. The weights from the Latent layer through the Reconstruction layer have been learned in such a way that it can project any low-dimensional point to a high-dimensional space.
In order to visualize new observations (not present during training but having a similar distribution), the Input layer of NeuroMDAVIS has to be presented with an identity matrix, which will be of the order of the number of observations in this unseen data (test dataset). This test dataset must contain the same number of omics modalities as the training data. Thus, the Input layer dimension will be equal to the size of the test dataset. The weights between the Input layer and the Latent layer need to be initialized again, and only the sub-network comprising the Input layer and the Latent layer needs to be re-trained, allowing the weights connecting these two layers to be updated, while the others are kept frozen to the already learned values. These weights are then used to visualize new samples.
Let there be
RESULTS
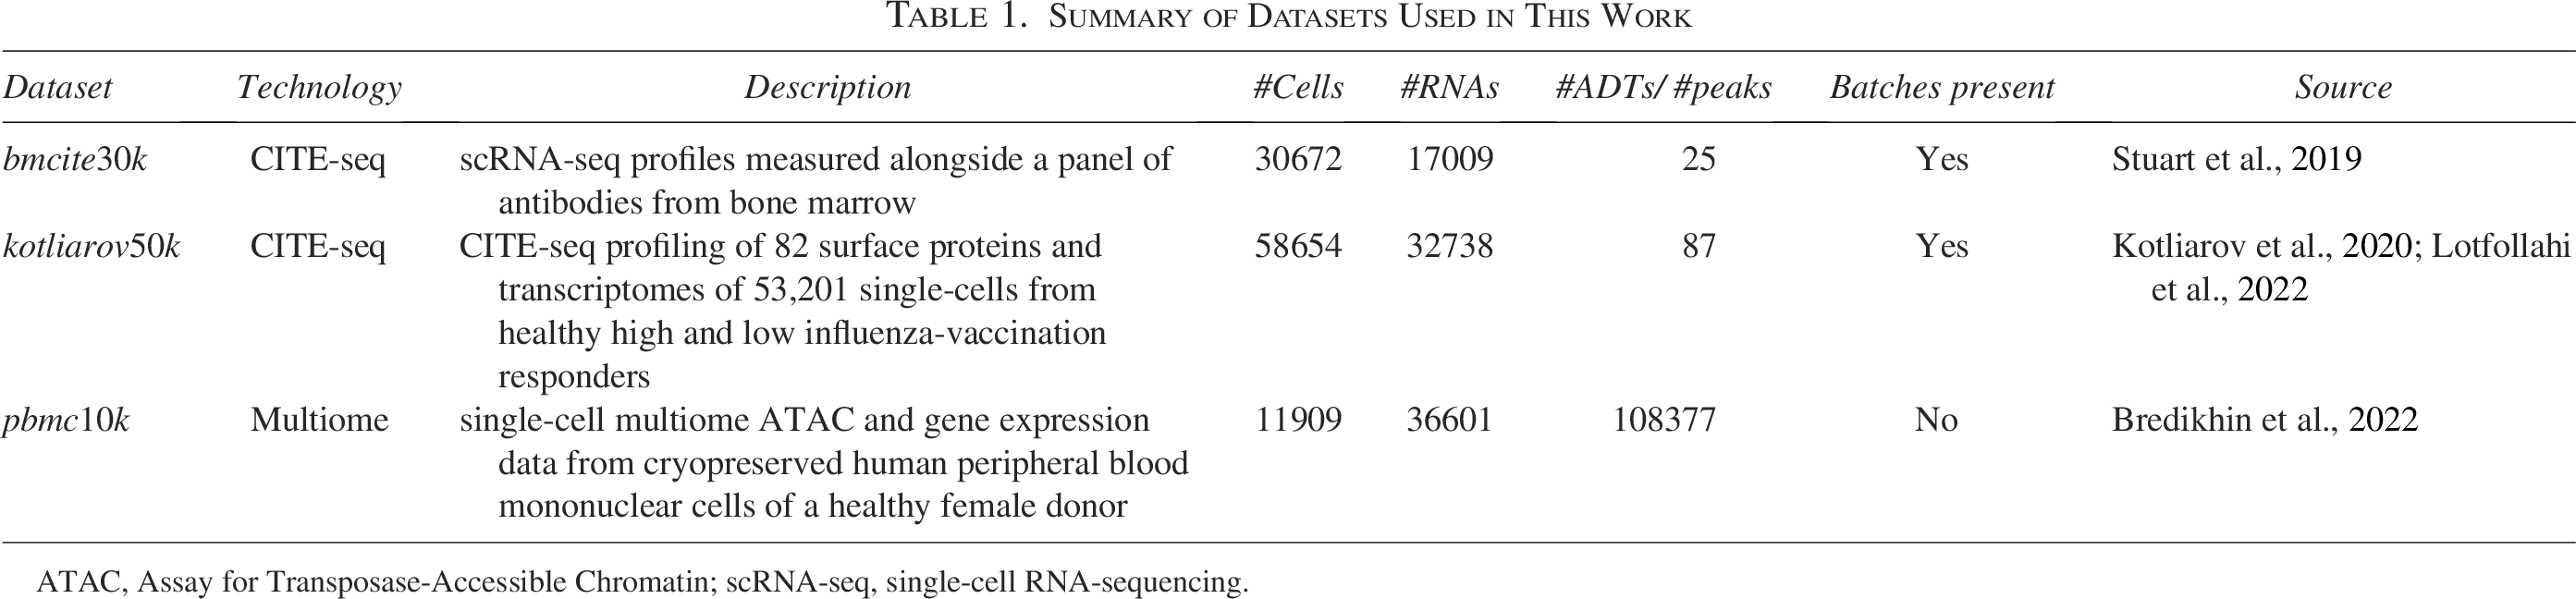
Superior performance of NeuroMDAVIS has been demonstrated on multi-omics datasets (Table 1), including CITE-seq (Section 3.1.1) and multiome data (Section 3.1.2), over some state-of-the-art visualization methods, such as t-SNE, UMAP, IVIS, and Fit-SNE. Moreover, it has also been compared against the shared embedding produced by MultiMAP in Section 3.2. Table 2 presents a comparison of basic features of NeuroMDAVIS with those of the above existing methods. Finally, the sensitivity analysis of hyperparameters has been discussed in Section 3.4.
Summary of Datasets Used in This Work
Summary of Datasets Used in This Work
ATAC, Assay for Transposase-Accessible Chromatin; scRNA-seq, single-cell RNA-sequencing.
Comparison of Basic Features of the Visualization Methods Used in This Study
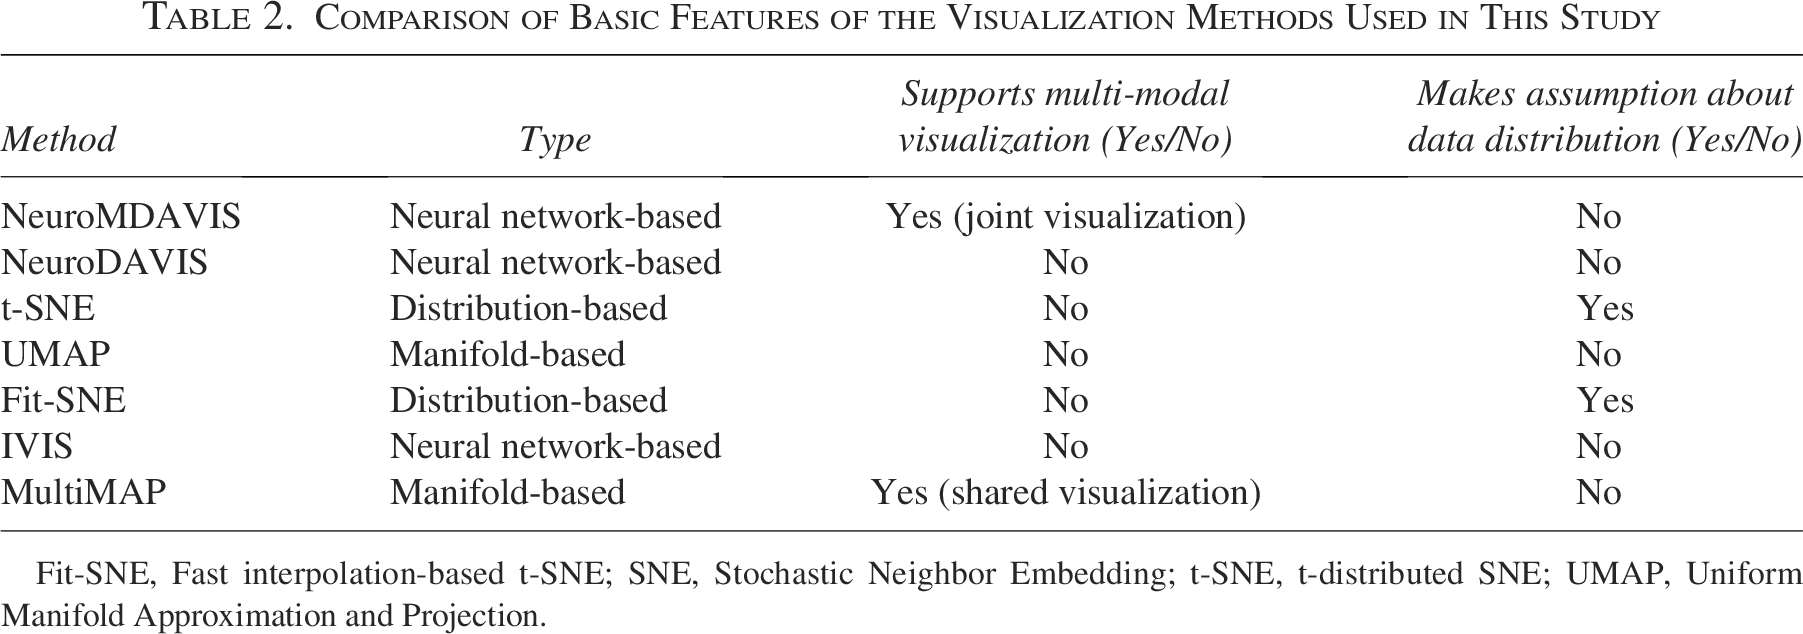
Fit-SNE, Fast interpolation-based t-SNE; SNE, Stochastic Neighbor Embedding; t-SNE, t-distributed SNE; UMAP, Uniform Manifold Approximation and Projection.
To evaluate the performance of NeuroMDAVIS with respect to multi-omics data visualization, we have used two multi-omics datasets, including two CITE-seq (joint profiling of RNA and surface protein measurements) and one multiome (paired RNA-seq and ATAC-seq) dataset. Since the existing visualization methods used for comparison do not support multi-modal visualization, for each dataset, we have concatenated the omics modalities available against the set of paired cells and used them as input to these methods for visualization. The following subsections describe the experiments carried out on these two datasets and their corresponding results.
Visualizing CITE-seq data
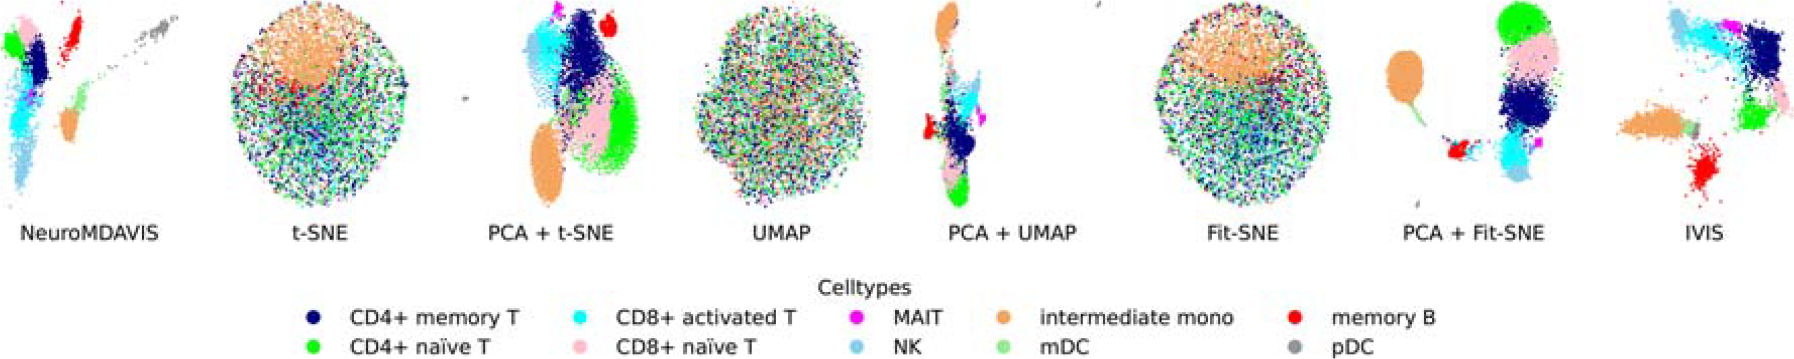
First, we have considered two CITE-seq datasets, viz., bmcite30k and kotliarov50k. These datasets have been downloaded from and preprocessed following (Maitra et al., 2023). CITE-Seq allows concurrent measurement of mRNA and cell surface proteins. In order to trace cell types, most of the existing visualization methods either use separate projections for ADTs and RNA molecules or project the protein expressions on the transcriptomic landscape. However, NeuroMDAVIS supports joint visualization of multiple modalities. As shown in Figure 2, for these two datasets, NeuroMDAVIS has been able to keep distinct cell types into distinct clusters, the clustering quality being qualitatively comparable only to IVIS. However, t-SNE, UMAP, and Fit-SNE have been unable to keep clusters well separated. We had initially apprehended that this might be due to the absence of a prior initialization step, like the usage of PCA, which sometimes serves as a good initialization for the state-of-the-art methods, such as t-SNE and UMAP (Chari and Pachter, 2023). Hence, we have carried out further experiments by using PCA as a prior initialization step for t-SNE, UMAP, and Fit-SNE, as shown in Figure 2. Though the results have improved quite a bit, NeuroMDAVIS and IVIS have still remained the best-performing models in terms of visualization.
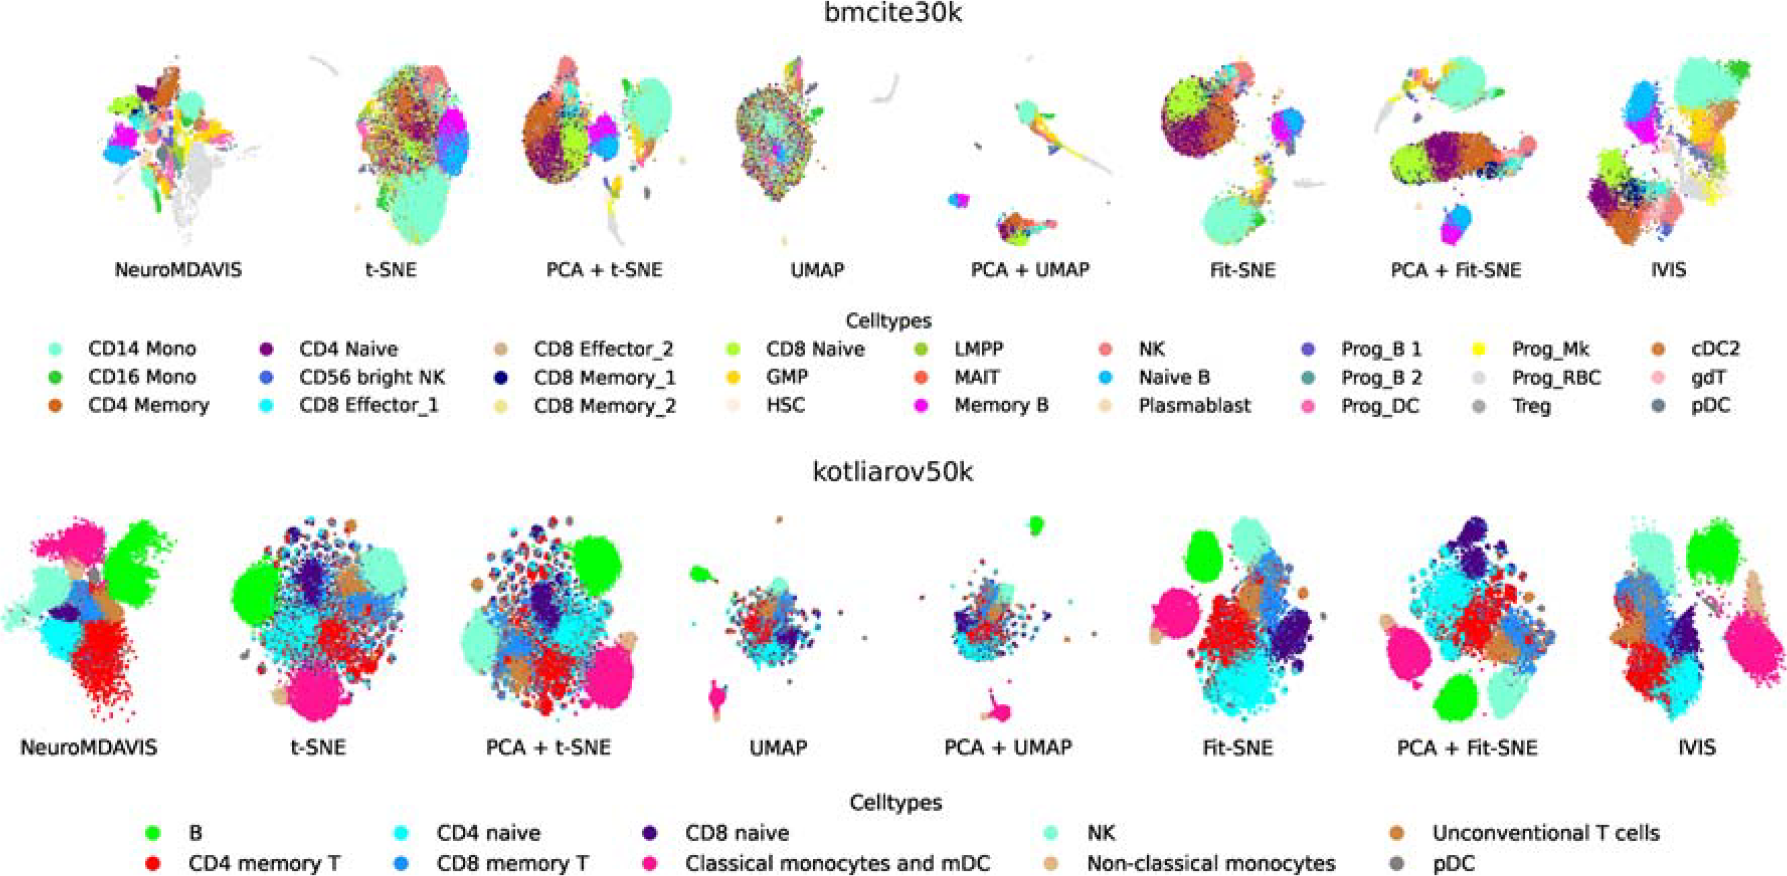
2-dimensional embeddings produced by NeuroMDAVIS, t-SNE, PCA + t-SNE, UMAP, PCA + UMAP, Fit-SNE, PCA + Fit-SNE, and IVIS for bmcite30k (first row), and kotliarov50k (Second row) datasets. Fit-SNE, Fast interpolation-based t-SNE; PCA, Principal Component Analysis; SNE, Stochastic Neighbor Embedding; t-SNE, t-distributed SNE; UMAP, Uniform Manifold Approximation and Projection.
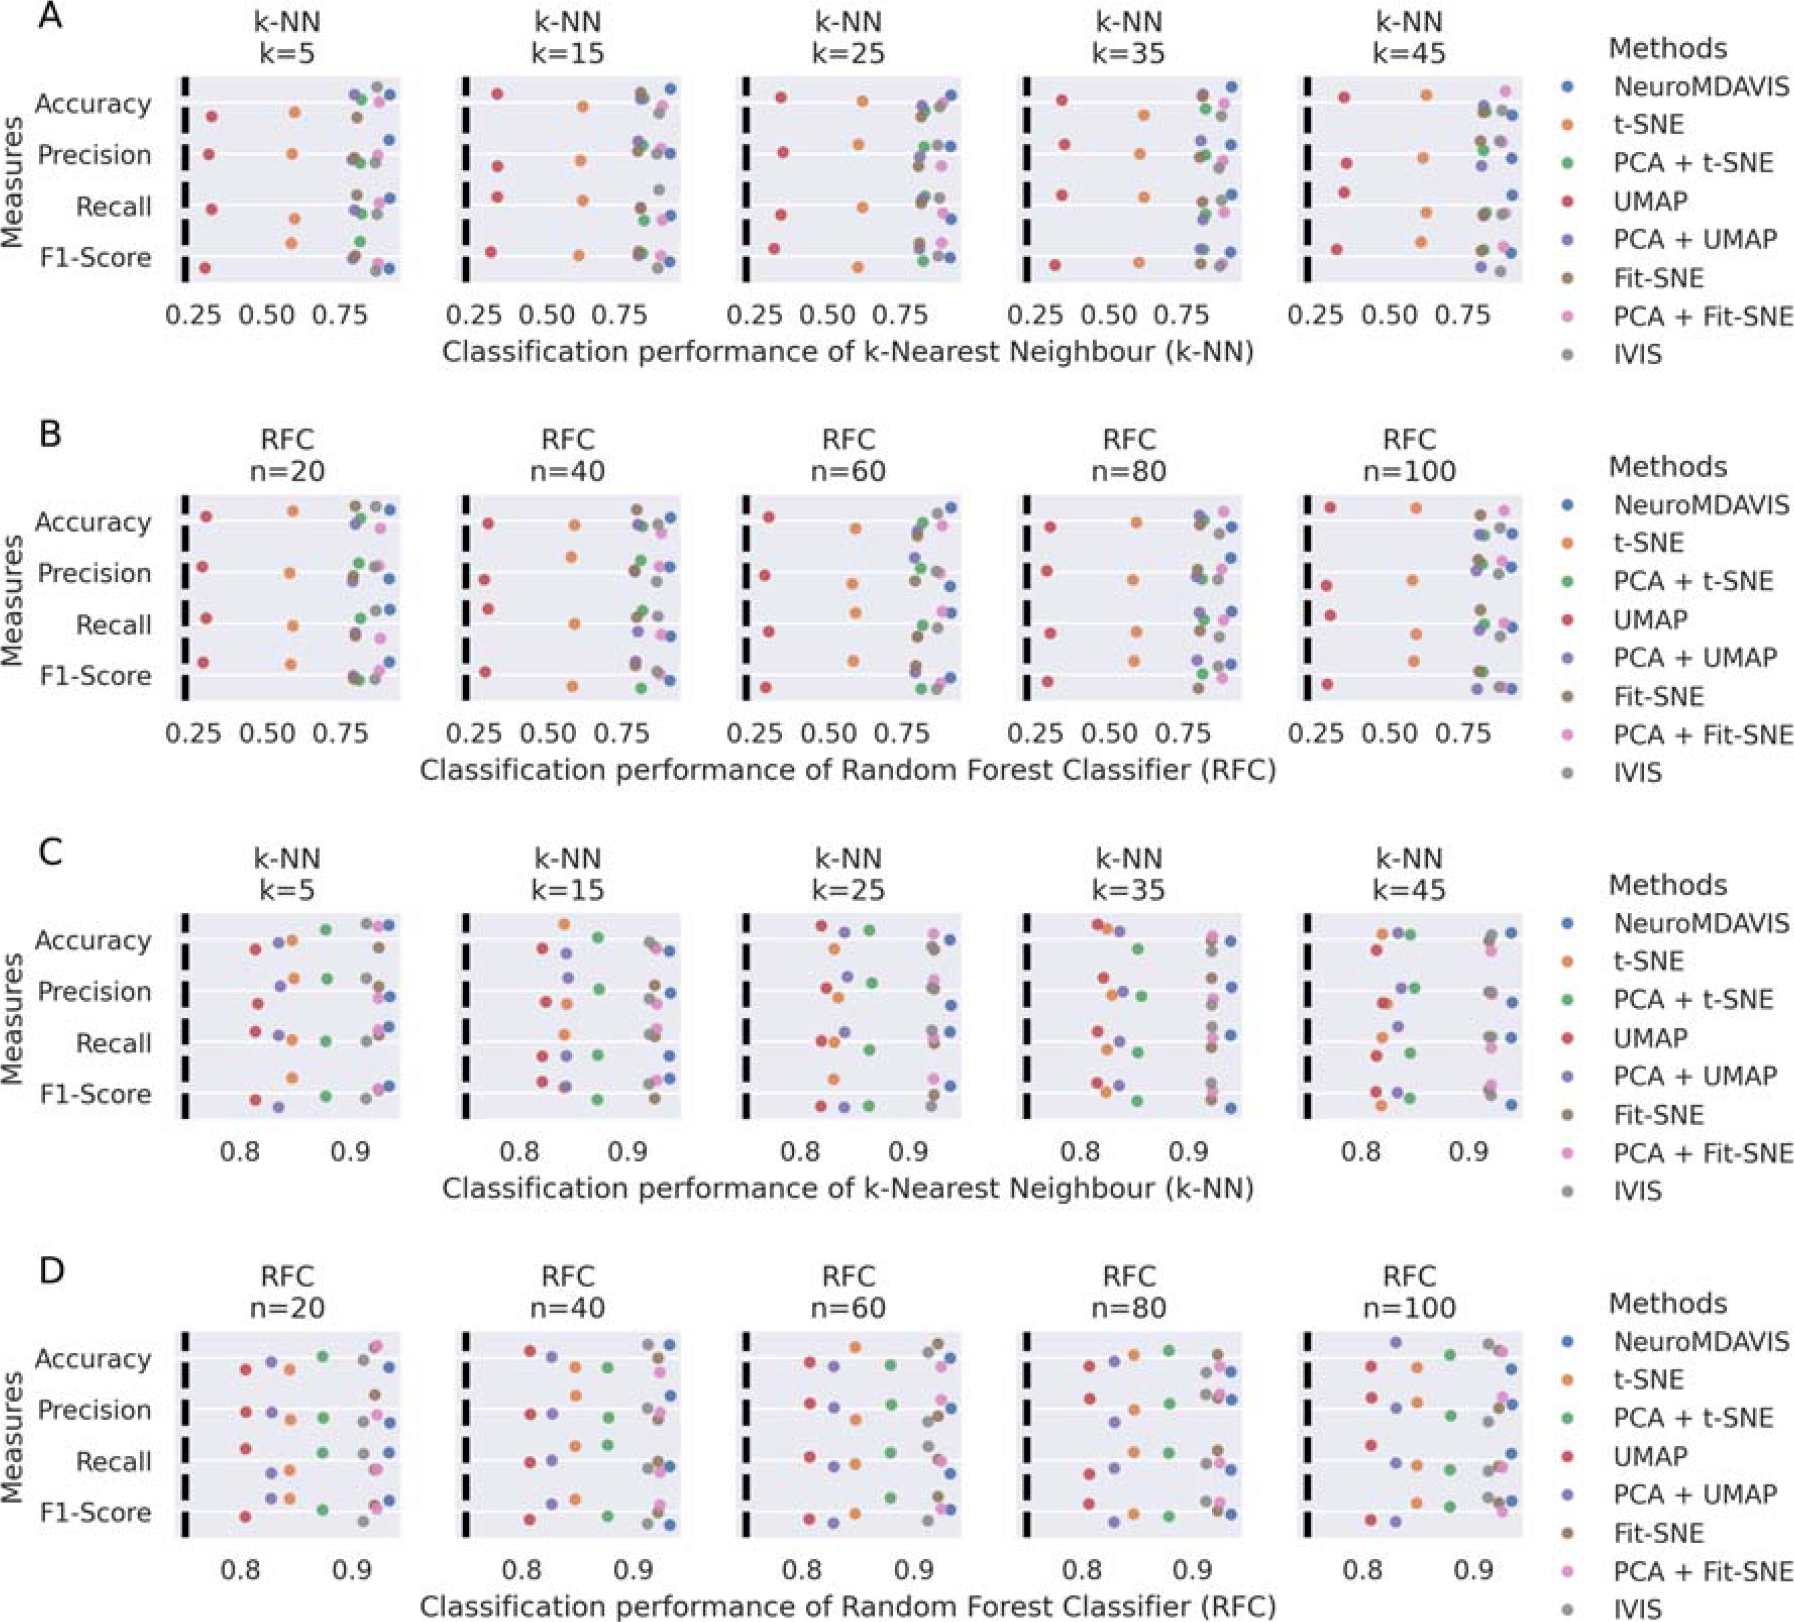
Thereafter, we have used k-NN and Random Forest classifiers to identify cell types based on the NeuroMDAVIS-generated projection, and compare results with those performed on projections generated by other existing methods. Training and test datasets have been prepared in an 80:20 ratio. The parameters k, representing the number of neighbours in k-NN, and n, being the number of estimators in Random Forest classification, have been varied between 5 and 45, and 20 and 100, respectively, to ensure consistency of results. As can be seen in Figure 3A–D, NeuroMDAVIS has outperformed all other methods with respect to Accuracy, Precision, Recall, and F1-score values for both the datasets, consistently over all values of k (for k-NN) and n (for Random Forest classifiers), on the
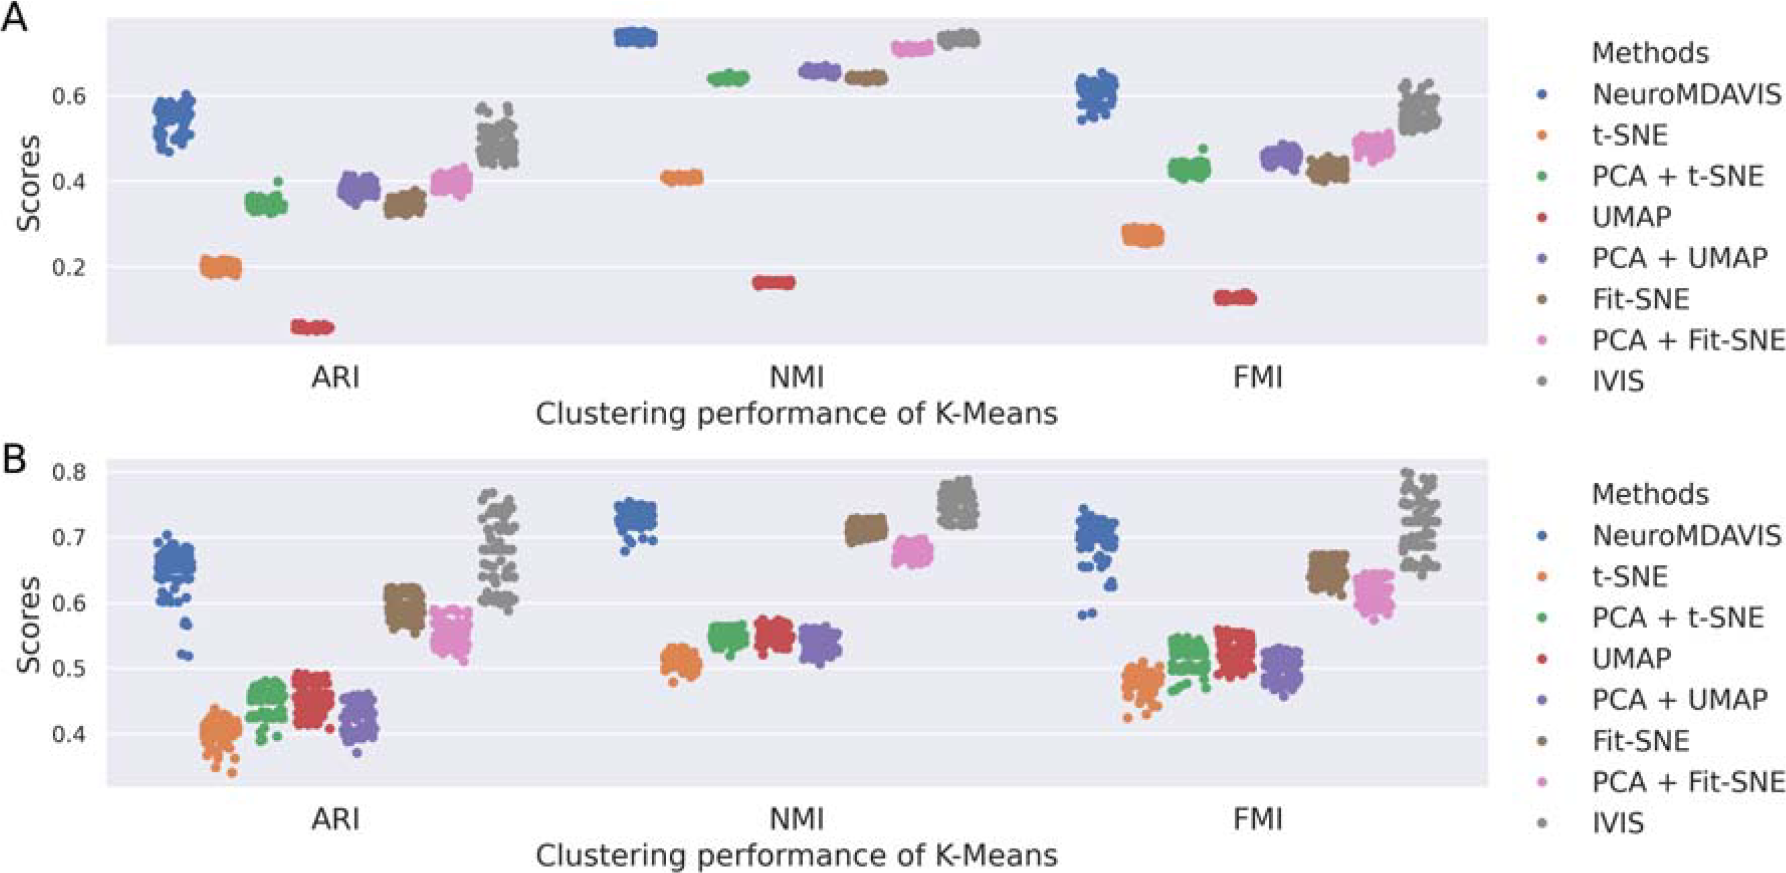
Further, k-means clustering on the embedding generated by NeuroMDAVIS, has shown highly competitive performance, if not better than the other existing methods, in terms of Adjusted Rand Index (ARI), Normalized Mutual Information (NMI), and Fowlkes–Mallows Index (FMI) scores. As depicted in Figure 4A,B, for bmcite30k dataset, NeuroMDAVIS has outperformed all the other methods, while for kotliarov50k dataset, the performance of NeuroMDAVIS has surpassed t-SNE, UMAP, and Fit-SNE by a high margin. In order to capture robustness, results from 100 distinct runs have been reported using different train-test partitions.
Clustering performance on low-dimensional embeddings generated using NeuroMDAVIS, t-SNE, PCA + t-SNE, UMAP, PCA + UMAP, Fit-SNE, PCA + Fit-SNE, and IVIS, with respect to ARI, NMI, and FMI scores of
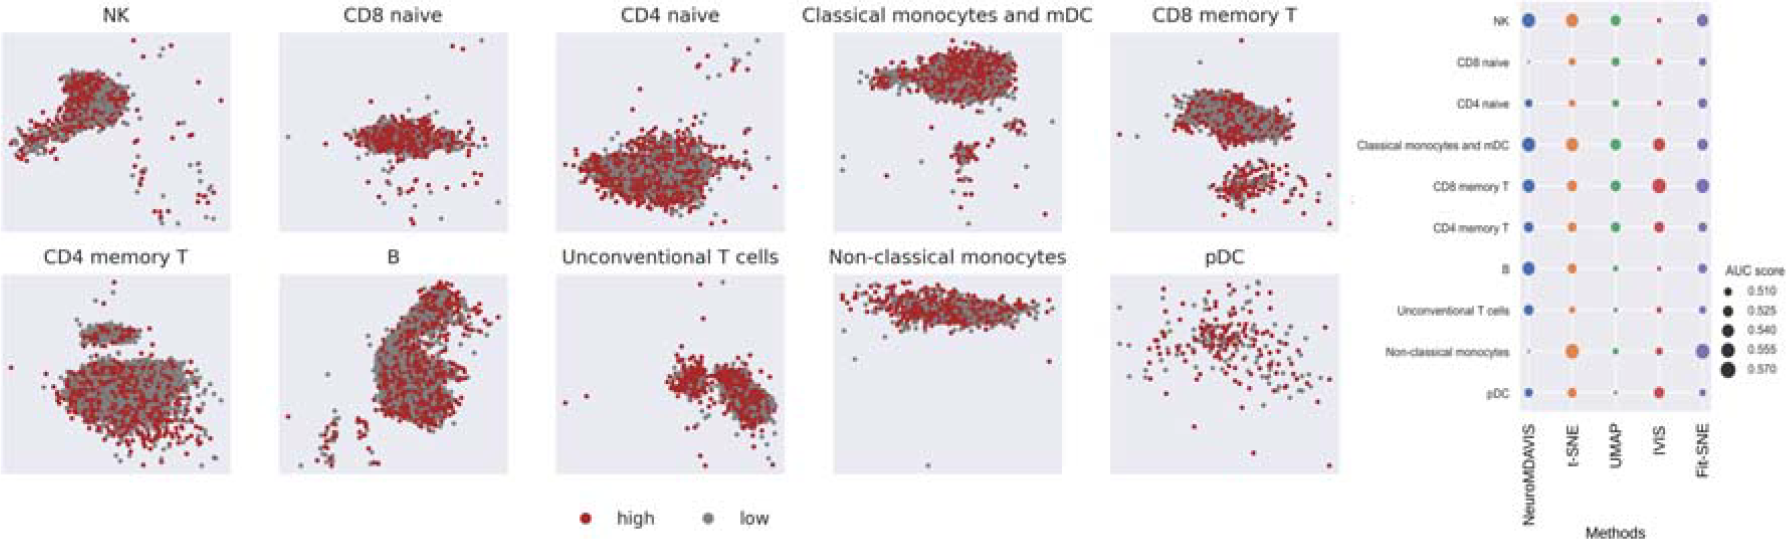
For further validation, we have performed a clinical classification on the kotliarov50k embedding generated by NeuroMDAVIS. The dataset kotliarov50k deals with single-cell CITE-seq data gathered from high and low-influenza vaccine responders. We have tried to explore whether the NeuroMDAVIS-generated projection is capable of classifying cells into low and high responder categories. For each unique cell cluster, we have performed a train-test split of 80:20 ratio. k-NN classifier with k = 45 has been used for this binary classification. Figure 5 (right) demonstrates that the Area-Under-the-Curve (AUC)-score obtained using NeuroMDAVIS on each of the cell types has been highly competitive with those obtained using the other state-of-the-art methods, viz., t-SNE, UMAP, IVIS, and Fit-SNE. It may be noted here that none of the methods could achieve beyond 58% AUC, which suggests that the cell type labels obtained for this dataset may not be optimal [Figure 5 (left)].
NeuroMDAVIS-produced sub-embeddings (based on cell types), colored by high/low influenza vaccine responder (left). Area-Under-the-Curve (AUC)-score for high/low influenza vaccine responder classification obtained using k-NN classifier (with
A commonly used method for assessing chromatin accessibility across the genome is the ATAC-seq. It may be mentioned here that one can learn about how chromatin packaging and other variables impact gene expression by using ATAC-seq to sequence open chromatin regions.
In this work, a multiome dataset pbmc10k, containing paired RNA-seq and ATAC-seq data, has been further used to demonstrate the effectiveness of NeuroMDAVIS for multi-omics data visualization. This pbmc10k dataset has been first preprocessed using MUON (Bredikhin et al., 2022), reduced to highly variable features only and then further processed to match cells in both the RNA and ATAC modalities, as done in (Maitra et al., 2023). NeuroMDAVIS has then been applied on the multi-omics data to generate a joint embedding of the paired assays. When compared to t-SNE, UMAP, and Fit-SNE, NeuroMDAVIS has produced better visualization of pbmc10k data, mapping each cell-type to a distinct cluster (Fig. 6). Prior application of PCA has improved the visualization for t-SNE, UMAP, and Fit-SNE, but still has some overlap among cell types. NeuroMDAVIS-generated embedding is only comparable to that produced by IVIS (Fig. 6).
2-dimensional embeddings produced by NeuroMDAVIS, t-SNE, PCA + t-SNE, UMAP, PCA + UMAP, Fit-SNE, PCA + Fit-SNE, and IVIS for pbmc10k dataset.
Additionally, to evaluate the quality of the embedding quantitatively, we have performed further downstream analysis, i.e., classification and clustering of cell-types on the NeuroMDAVIS-generated embedding. A similar train-test split has been used for classification in the case of CITE-seq data. Classification results on the held out test dataset, as shown in Figure 7A and B, demonstrate NeuroMDAVIS as the best performing model for DR and visualization across all measures like accuracy, precision, recall, and F1-score. On a similar note, k-means clustering on the NeuroMDAVIS projection has produced the highest ARI, FMI, and NMI scores compared to all other state-of-the-art methods, like t-SNE, PCA + t-SNE, UMAP, PCA + UMAP, Fit-SNE, PCA + Fit-SNE, and IVIS, as shown in Figure 7C.

In order to demonstrate effectiveness of joint-embedding from multi-omics dataset, we have compared that generated by NeuroMDAVIS with separate embeddings produced by NeuroDAVIS. We have further compared NeuroMDAVIS against another state-of-the-art dimensionality reduction and multi-omics integration method, viz., MultiMAP. MultiMAP, however, produces a shared visualization of multiple omics modalities, which projects different omics layers onto separate latent spaces while observing the combined effect of all modalities. In contrast, a joint visualization, as produced by NeuroMDAVIS, refers to generating a single and unified latent embedding by integrating multiple omics modalities.
Figure 8 illustrates the joint embedding generated by NeuroMDAVIS, and separate embeddings produced by NeuroDAVIS (a precursor of NeuroMDAVIS), followed by shared embeddings produced by MultiMAP on the bmcite30k (CITE-seq) and pbmc10k (Multiome) datasets. As discussed earlier, MultiMAP has generated separate embeddings for the RNA and protein modalities. NeuroMDAVIS-generated joint embedding, as observed by Figure 8, has resulted in better inter-cell cluster separation than both MultiMAP and NeuroDAVIS-generated RNA and protein-embeddings. In addition, the comparative performance of these three methods has been evaluated for the classification and clustering tasks. Classification performance on the NeuroMDAVIS-embedding, RNA, and protein-embedding generated by NeuroDAVIS and MultiMAP, has been assessed using metrics such as accuracy, precision, recall, and F1-score, while clustering performance on the same has been evaluated using ARI, NMI, and FMI). Figure 9 reflects NeuroMDAVIS-generated embeddings have performed better than their counterparts generated by NeuroDAVIS and MultiMAP, in all kinds of downstream tasks for both datasets.
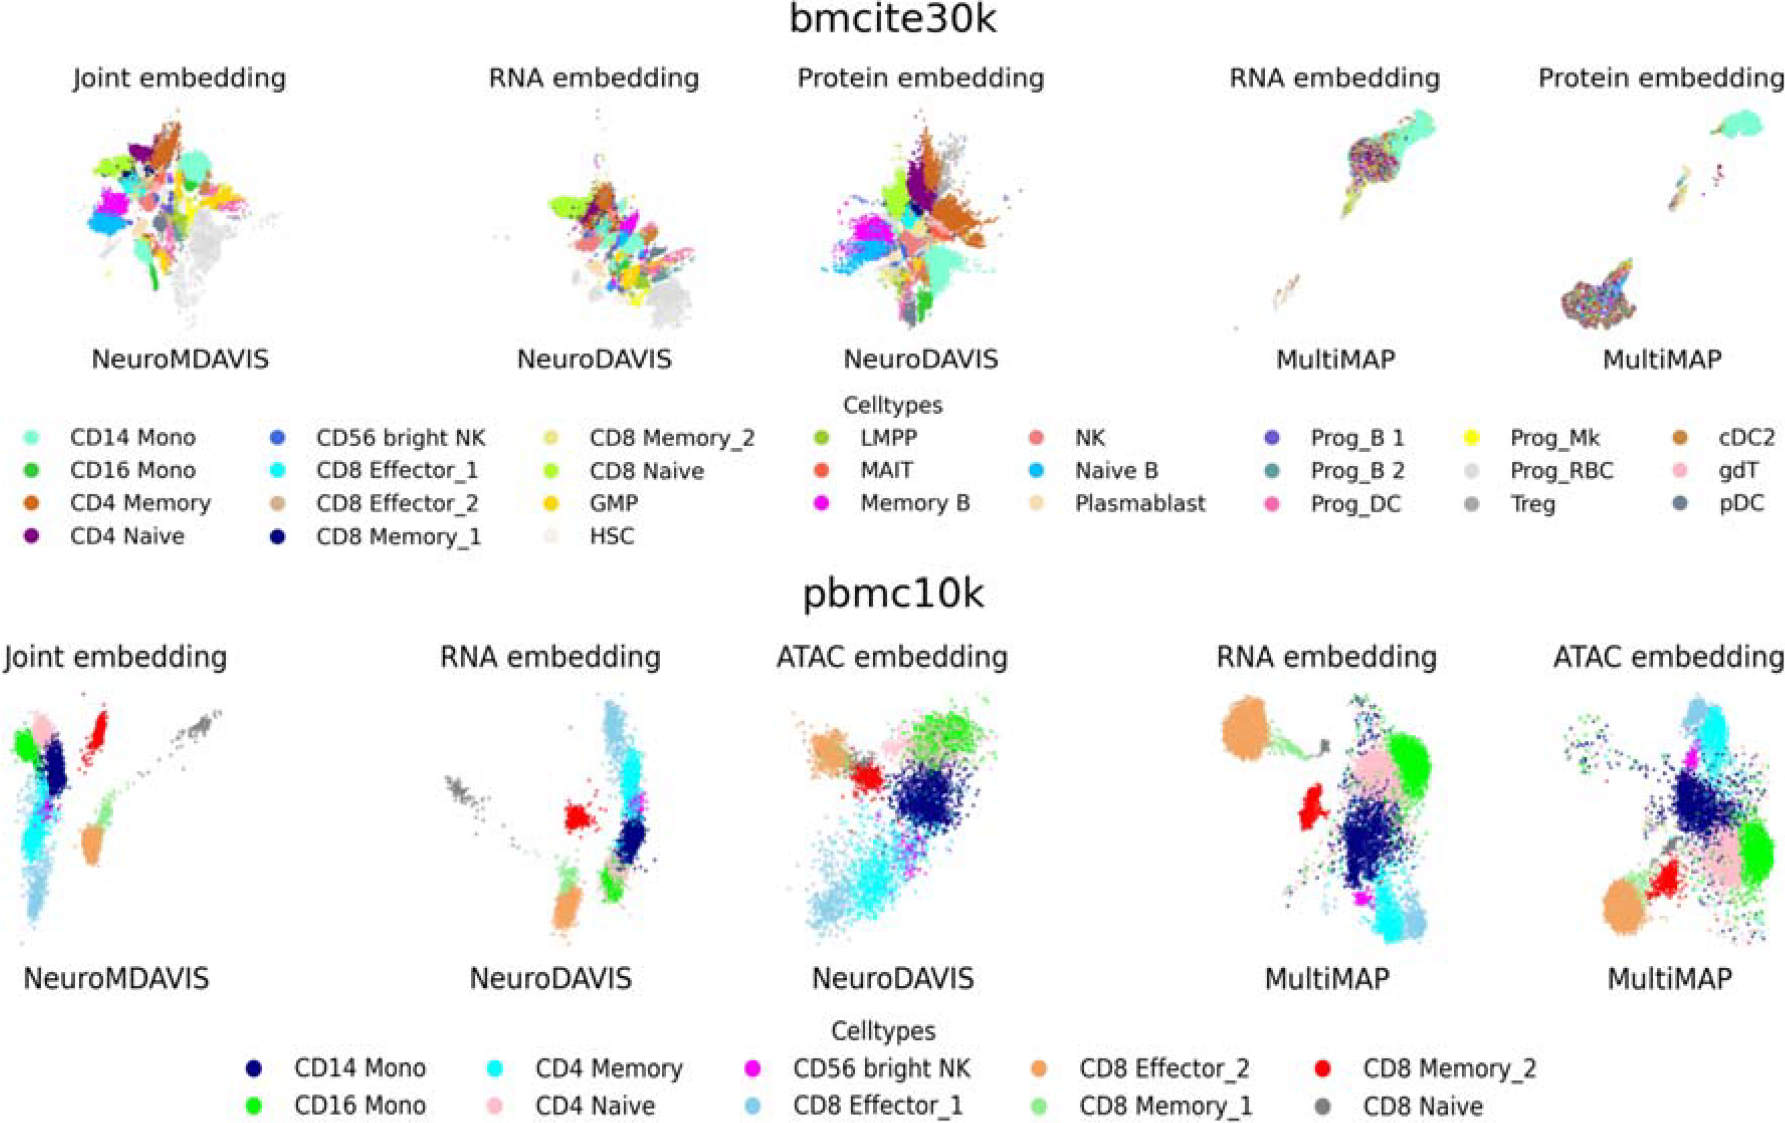
2-dimensional joint embedding produced by NeuroMDAVIS, separate embeddings produced by NeuroDAVIS, and shared embeddings produced by MultiMAP for bmcite30k (first row), and pbmc10k (Second row) datasets.
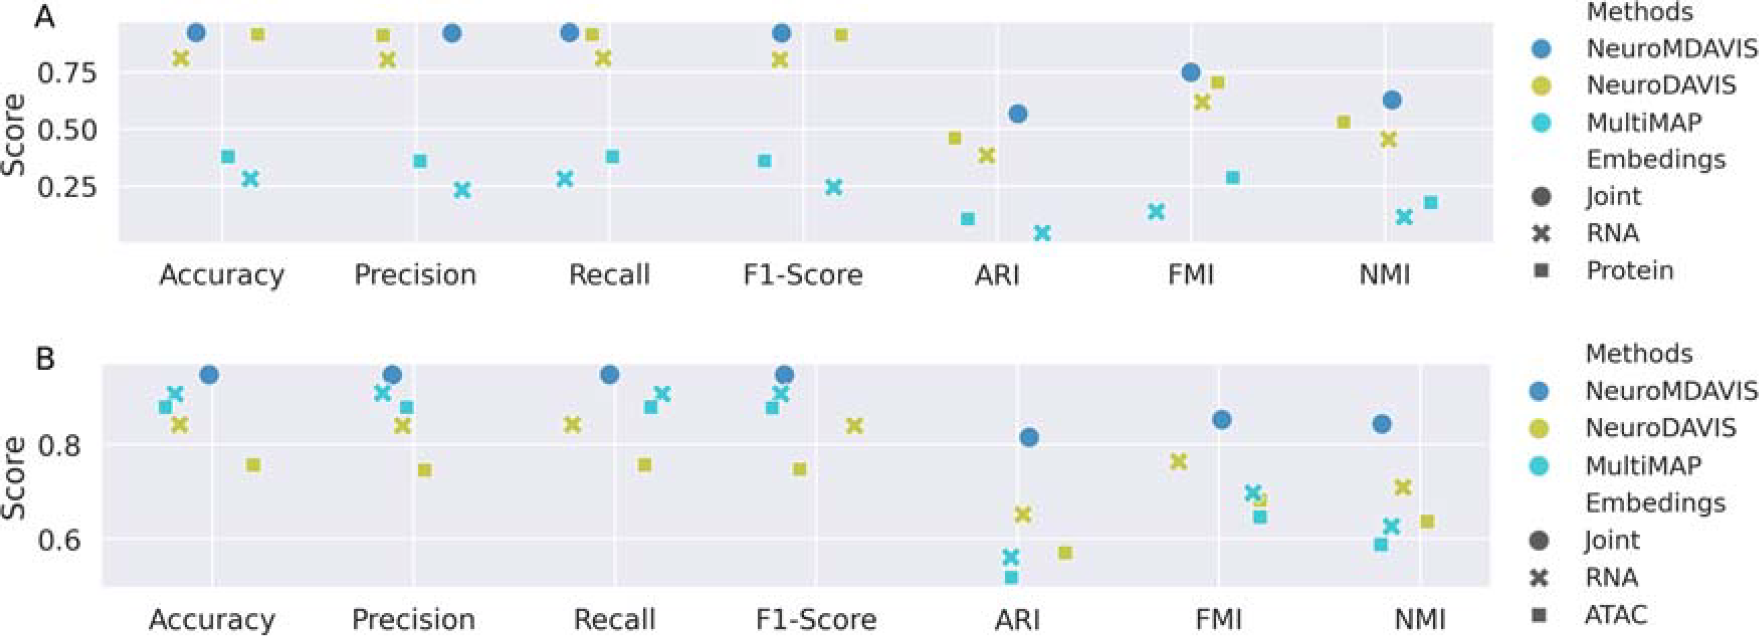
Classification and clustering performance on projections generated by NeuroMDAVIS, NeuroDAVIS, and MultiMAP, in terms of accuracy, precision, recall and F1-score, and ARI, NMI, and FMI using k-NN classifiers and k-means clustering, respectively, of
NeuroMDAVIS can be used as a pre-trained model to visualize data that are not present during the training process. In order to evaluate NeuroMDAVIS for its capability to visualize new observations not present during training, we have used both CITE-seq and multiome datasets. For each of these datasets, following a 60:40 split of training:test datasets, NeuroMDAVIS has been trained on the

For the multiome dataset, as depicted in Figure 10C, the major cell types, viz., T, NK and B, are clearly identifiable in both the training and test embeddings. All subtypes of T cells are also well separated. Thus, even when the entire data are not available at the time of training, NeuroMDAVIS supports visualization of newer observations added to an existing embedding at runtime.
Finally, classification and clustering performance have been compared between the train and test embeddings produced by NeuroMDAVIS. Based on accuracy, precision, recall, and F1-Score, classification performance is comparable for the multiome dataset (pbmc10k) and the CITE-seq datasets (bmcite30k and kotliarov50k), as shown in Figure 11. Similar results have been observed for clustering in terms of ARI, NMI, and FMI. The drop in performance for CITE-seq datasets is due to poor sample sizes in some of the clusters; for example, the ‘Classical monocytes and mDC’ and ‘Non-classical monocytes’ classes could not be identified properly in their test embeddings due to their smaller sample sizes, as shown in Figure 10B.
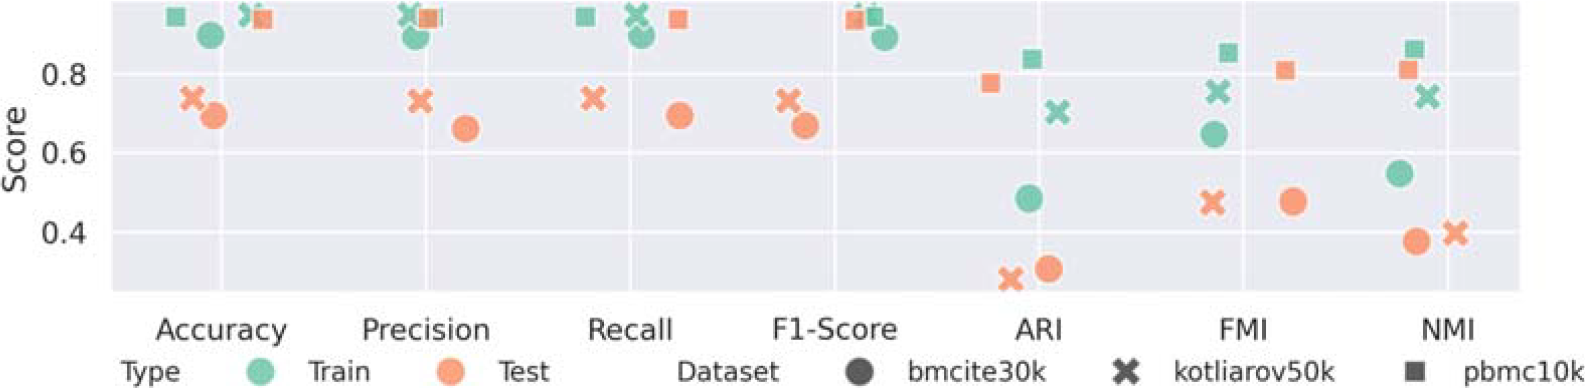
Classification and clustering performance on projections generated by NeuroMDAVIS over the train and test parts of bmcite30k, kotliarov50k, and pbmc10k datasets, in terms of accuracy, precision, recall, and F1-score, and ARI, NMI, and FMI using k-NN classifiers and k-means clustering, respectively.
NeuroMDAVIS, being a neural network model, involves several hyperparameters. In order to evaluate the robustness of NeuroMDAVIS, we have performed a sensitivity analysis on key hyperparameters. We have systematically varied the key hyperparameters around their original values. For each specific hyperparameter value, we have generated a latent embedding for a multi-omics dataset. The embedding qualities have then been quantitatively assessed by evaluating their performance in both classification and clustering tasks. Classification performance has been measured in terms of accuracy, precision, recall, and F1-score to identify the model’s ability to discriminate the classes, while clustering performance has been assessed using ARI, NMI, and FMI to evaluate how well the intrinsic data structure is preserved in the learned latent space.
Figure 12 indicates that the performance of NeuroMDAVIS has been robust to variations with respect to both batch size and number of hidden layer neurons. The figure also conveys that across all three datasets (bmcite30k, kotliarov50k, and pbmc10k), the classification and clustering metrics remain remarkably stable. For classification, k-NN and Random Forest models have consistently achieved high scores for Accuracy, Precision, Recall, and F1-Score, with minimal variance among different embeddings. On a similar note, k-Means clustering performance, as measured by ARI, FMI, and NMI, has shown little to no change across the various embeddings. This consistent performance suggests that the model’s ability to generate high-quality latent representations is not significantly affected by changes in batch size or number of neurons in the hidden layers, thereby demonstrating its robustness and stability.

Sensitivity analysis for the hyperparameters
In this work, we have developed a neural network model, called NeuroMDAVIS, for multi-omics data visualization. NeuroMDAVIS provides joint visualization combining all the omics modalities together, and is the first of its kind in this regard. The model is a generalization of NeuroDAVIS (Maitra et al., 2024), recently developed by the authors for the purpose of visualizing single data modality. NeuroMDAVIS enables visualization of multiple omics modalities as a joint embedding, which gives rise to a unified perspective depicting correlations and interactions among the modalities in the same space. The performance of NeuroMDAVIS has been demonstrated on CITE-seq and multiome datasets, and results have been compared with several state-of-the-art methods, such as t-SNE, UMAP, IVIS, Fit-SNE, and MultiMAP. Both NeuroDAVIS and NeuroMDAVIS are feed-forward neural network architectures that can be used to produce a latent 2-dimensional embedding from high-dimensional single-omics and multi-omics data, respectively. This latent embedding/projection captures significant data characteristics, which can be useful for various downstream tasks, including classification and clustering.
In the context of multi-omics data visualization, NeuroMDAVIS has been able to produce qualitatively excellent visualization compared to the other state-of-the-art methods. The latent embedding, when used for cell-type classification or clustering, has surpassed those obtained by most of the other methods. NeuroMDAVIS does not assume any prior data distribution, and thereby, is nonparametric. It stands out as one of its key strengths. Furthermore, to our knowledge, there has been no single method to this date, which supports joint visualization of multiple modalities together. In literature, there exist methods for visualizing one modality overlaid on the other(s) or simultaneously distinct embeddings for each modality. NeuroMDAVIS fits into this gap perfectly. Besides, NeuroMDAVIS does not need PCA for prior initialization, contrasting with some other existing methods. Moreover, unlike major existing visualization methods such as t-SNE and UMAP, both NeuroDAVIS and NeuroMDAVIS can be used as pretrained models to visualize streaming samples, which implies that they support iterative continuous integration and deployment. This attribute makes them highly suitable for large-scale projects such as Human Cell Atlas (HCA) or Human Tumor Atlas Network initiatives. Thus, NeuroDAVIS and NeuroMDAVIS together can be claimed to be the new state-of-the-art methods for omics data visualization.
NeuroMDAVIS requires an identity matrix of size equal to the number of samples as input, which may lead to high memory consumption. It is a polynomial-time algorithm. The sparse identity matrix makes the memory overhead manageable and can be further utilized to handle the issue of scalability in case of large datasets. In the present study, NeuroMDAVIS has been successfully applied to datasets of substantial sizes without encountering computational bottlenecks. It might be due to the usage of small batch sizes during model training, i.e., during any training epoch, only a mini-batch of samples is used instead of the entire training set. For extremely large-scale scenarios (e.g., > 100k cells), an additional optimization, such as block-wise computations or approximate strategies, may be incorporated to further improve scalability, which remains a scope for improvement in the future.
AUTHORS’ CONTRIBUTIONS
C.M.: Conceptualization, methodology, data curation, data analysis, formal analysis, implementation, investigation, code review, validation, writing—initial draft preparation. D.B.S.: Conceptualization, methodology, data curation, data analysis, formal analysis, investigation, code review, validation. V.D.: Conceptualization, methodology, data curation, data analysis, formal analysis, writing—review and editing. R.K.D.: Conceptualization, methodology, writing—review and editing, overall supervision.
Footnotes
ACKNOWLEDGMENT
R.K.D. acknowledges the Department of Biotechnology, Government of India, for partially supporting this research in the form of the grant (Sanction Order Number: BT/PR40176/BTIS/137/84/2023).
AUTHOR DISCLOSURE STATEMENT
V.D. works as a Lead Data Scientist at Novo Nordisk A/S, Søborg. He has received no funds for this work.
FUNDING INFORMATION
The computing system procured through the grant (Sanction Order Number: BT/PR40176/BTIS/137/84/2023) is funded by the Department of Biotechnology, Government of India, and has been used extensively in this work.
DATA AND CODE AVAILABILITY
The datasets used in this study can be downloaded from https://doi.org/10.5281/zenodo.10623932. Codes to reproduce the results can be found at ![]() .
.