
Abstract
Recent advances in gene network analysis have improved our understanding of complex disease mechanisms; however, interpreting estimated gene networks remains challenging. Existing methods for pathway enrichment analysis focus on gene sets and therefore fail to capture interaction-level information that is critical for understanding disease-related molecular interplays. Here, we propose a novel computational strategy for gene network enrichment analysis (GNEA) that evaluates pathway overrepresentation at the edge level, explicitly incorporating both network structure and the biological importance of hub genes. Thus, our strategy provides reliable biological results. We demonstrated the efficacy of our approach through Monte Carlo simulations of myeloid neoplasms and pan-cancer-related pathway-enriched gene network analysis. The proposed strategy was applied to immune disease pathway-enriched gene network analysis. Our results identify inflammatory bowel disease-related pathways enriched in both acute myeloid leukemia (AML)-aged and AML-young networks, and asthma-related pathways enriched in healthy-young networks. Our results suggested that “activation of CD40 and CD40LG” and “mutual activation between HLA-DPB1 and IL4R” are potential markers to uncover AML-related mechanisms. Overall, this study demonstrates that GNEA provides a powerful framework for uncovering biologically meaningful interaction-level insights into complex diseases.
INTRODUCTION
Gene network analyses provide a comprehensive understanding of the relationships among genes involved in disease mechanisms at the system level. The molecular mechanisms of diseases involve abnormalities in complex molecular networks rather than disorders in a single gene. Thus, heterogeneous gene networks have garnered considerable attention for understanding complex disease mechanisms. To infer gene regulatory networks, various computational approaches have been developed and used for gene network-based analyses, such as L1-type regularization and deep learning methods. Although several studies on computational network biology have been conducted to infer gene networks, the interpretation of the estimated large gene networks remains challenging. However, crucial clinical insights cannot be obtained without the interpretation of the estimated molecular interplays. Uncovering the biological meaning and function of the estimated network is critical for identifying biomarkers and related mechanisms involved in diseases.
Several studies have identified the biological significance of gene sets (Kim and Volsky, 2005; Huang et al., 2009). Huang et al. (2009) developed a computational strategy called gene enrichment analysis, which detects the gene sets that are differentially enriched under experimental conditions. Overrepresentation analysis (ORA) is a commonly used methodology for pathway analysis of gene sets (Draghici et al., 2003; da et al., 2009). ORA determines whether known biological functions are overrepresented in the gene set of interest, based on a hypergeometric test. The network-based gene set enrichment analysis, also known as the efficient network enrichment analysis test (NEAT) (Signorelli et al., 2016), measures the level of enrichment based on the association between genes in the gene set of interest and those in the functional set. Although several computational strategies for gene set enrichment analysis have been developed and applied to interpret experimental results, relatively little attention has been paid to the pathway analysis of gene networks.
In this study, we aimed to develop a novel strategy for gene network enrichment analysis (GNEA). The developed method measures the enrichment of a gene network for a specific functional pathway based on the overrepresentation of edges. In other words, we assessed the enrichment of a gene network by considering the number of edges that were overrepresented in the network of genes involved in a specific functional pathway. The developed method enabled us to perform GNEA based on comprehensive information about the gene network, that is, edge structure and genes belonging to the network, because the edge structure is determined by genes. Furthermore, hub genes linked to several genes have a major effect on the computation of the gene network enrichment score because hub genes have several edges. This implies that our method incorporates the knowledge of network biology that hub genes play key roles in biological processes. Thus, we can obtain biologically reliable results.
Through Monte Carlo simulations, we demonstrated the effectiveness of the proposed strategy in myeloid neoplasms and pan-cancer-related pathway-enriched gene network analysis. We applied our strategy to explore the enriched immune disease pathways for gene networks of “healthy-young,” “healthy-aged,” “acute myeloid leukemia (AML)-young,” and “AML-aged groups.” Our strategy revealed that the AML-aged and -young networks were enriched in the inflammatory bowel disease (IBD) pathway, whereas the asthma pathway was identified as the enriched pathway for the healthy-young network. As AML-specific molecular interplays, “suppression of interplay between HLA-DPB1 and IL4R” and “inhibition of interplay between JUN and HLA-DPB1” were identified. Furthermore, “disappearance of the interplay between RNASE3 and PRG2” was identified as a specific molecular characteristic of healthy-young individuals. We suggest that “activation of CD40 and CD40LG” and “mutual activation between HLA-DPB1 and IL4R and between JUN and HLA-DPB1” may be key markers to uncover molecular mechanisms underlying AML.
The remainder of this article is organized as follows: In the section on pathway analysis of gene sets, we introduce previous studies on gene set enrichment analysis. We proposed a novel computational strategy for GNEA in Section 3. In Section 4, we evaluate our method based on myeloid neoplasm and pan-cancer-related pathway-enriched gene network analysis. Finally, we describe the results of immune disease pathway-enriched gene network analysis. The conclusions are presented along with the discussion section.
METHODS
The gene network can be represented by a weighted graph
ORA
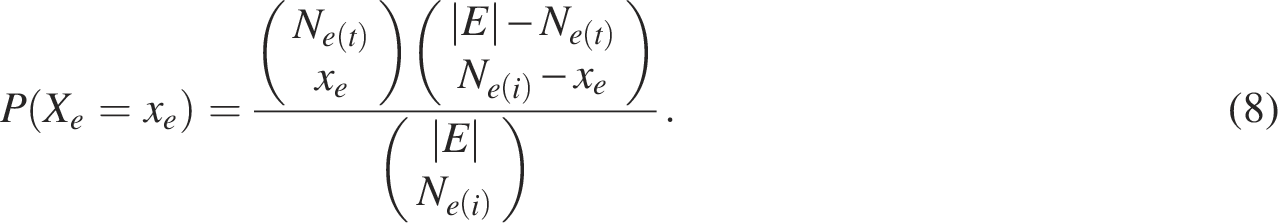
ORA is one of the most widely used methods for pathway analysis of gene sets. This method determines whether known biological functions are overrepresented in the gene set of interest (Boyle et al., 2004). ORA is based on a hypergeometric test that describes the discrete probability of x successes in
For the

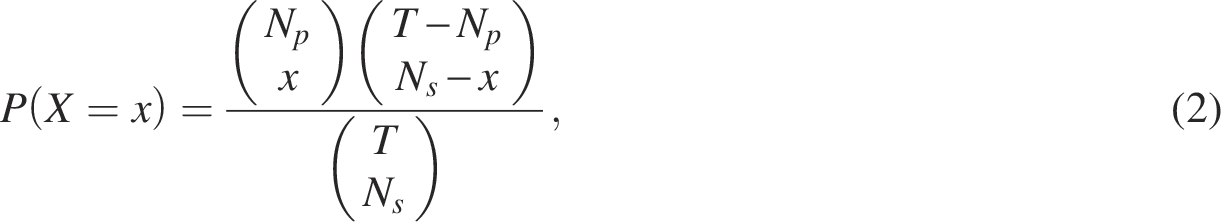
The observed overlap x can be viewed as a realization of a hypergeometric random variable, and the probability of observing an intersection of size x is given by
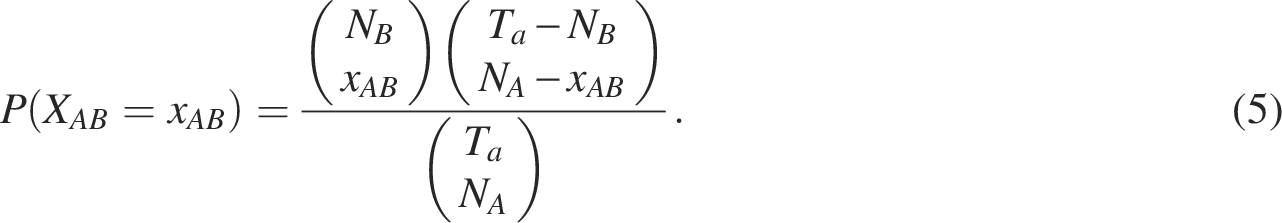
Signorelli et al. (2016) developed a computational strategy for gene set enrichment analysis based on gene networks called an efficient NEAT. The associations and/or dependencies between genes can be described by a network, that is, the relationship between gene sets is determined by the presence or absence of links connecting genes into two sets. NEAT performs enrichment analysis by evaluating the level of association between genes in the gene set of interest and those in the functional set. In network-based enrichment analysis, the situation in which the number of links between two gene sets is larger (or smaller) than expected by chance is considered as the enrichment between two gene sets. Thus, the presence of enrichment from gene set A (i.e.,

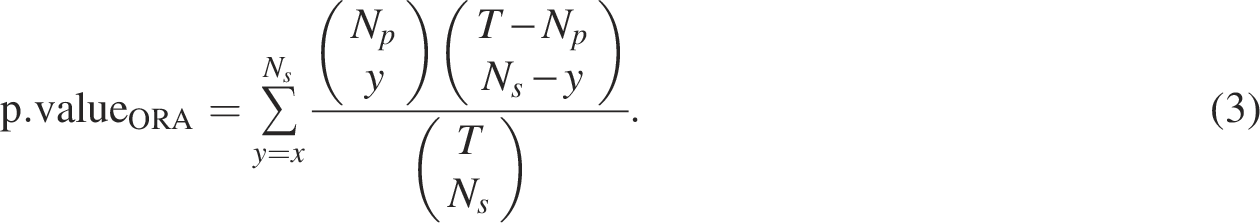
The significance of the enrichment is assessed using the following p-value:

The p-valueNEAT and p-valueORA are often adjusted for multiple comparisons.
The gene set enrichment analysis of ORA and NEAT can be extended to GNEA by considering a set of nodes (genes) in the network as the gene set of interest.
We developed a novel computational strategy called GNEA. The overall framework of our strategy is given as follows (see Fig. 1).
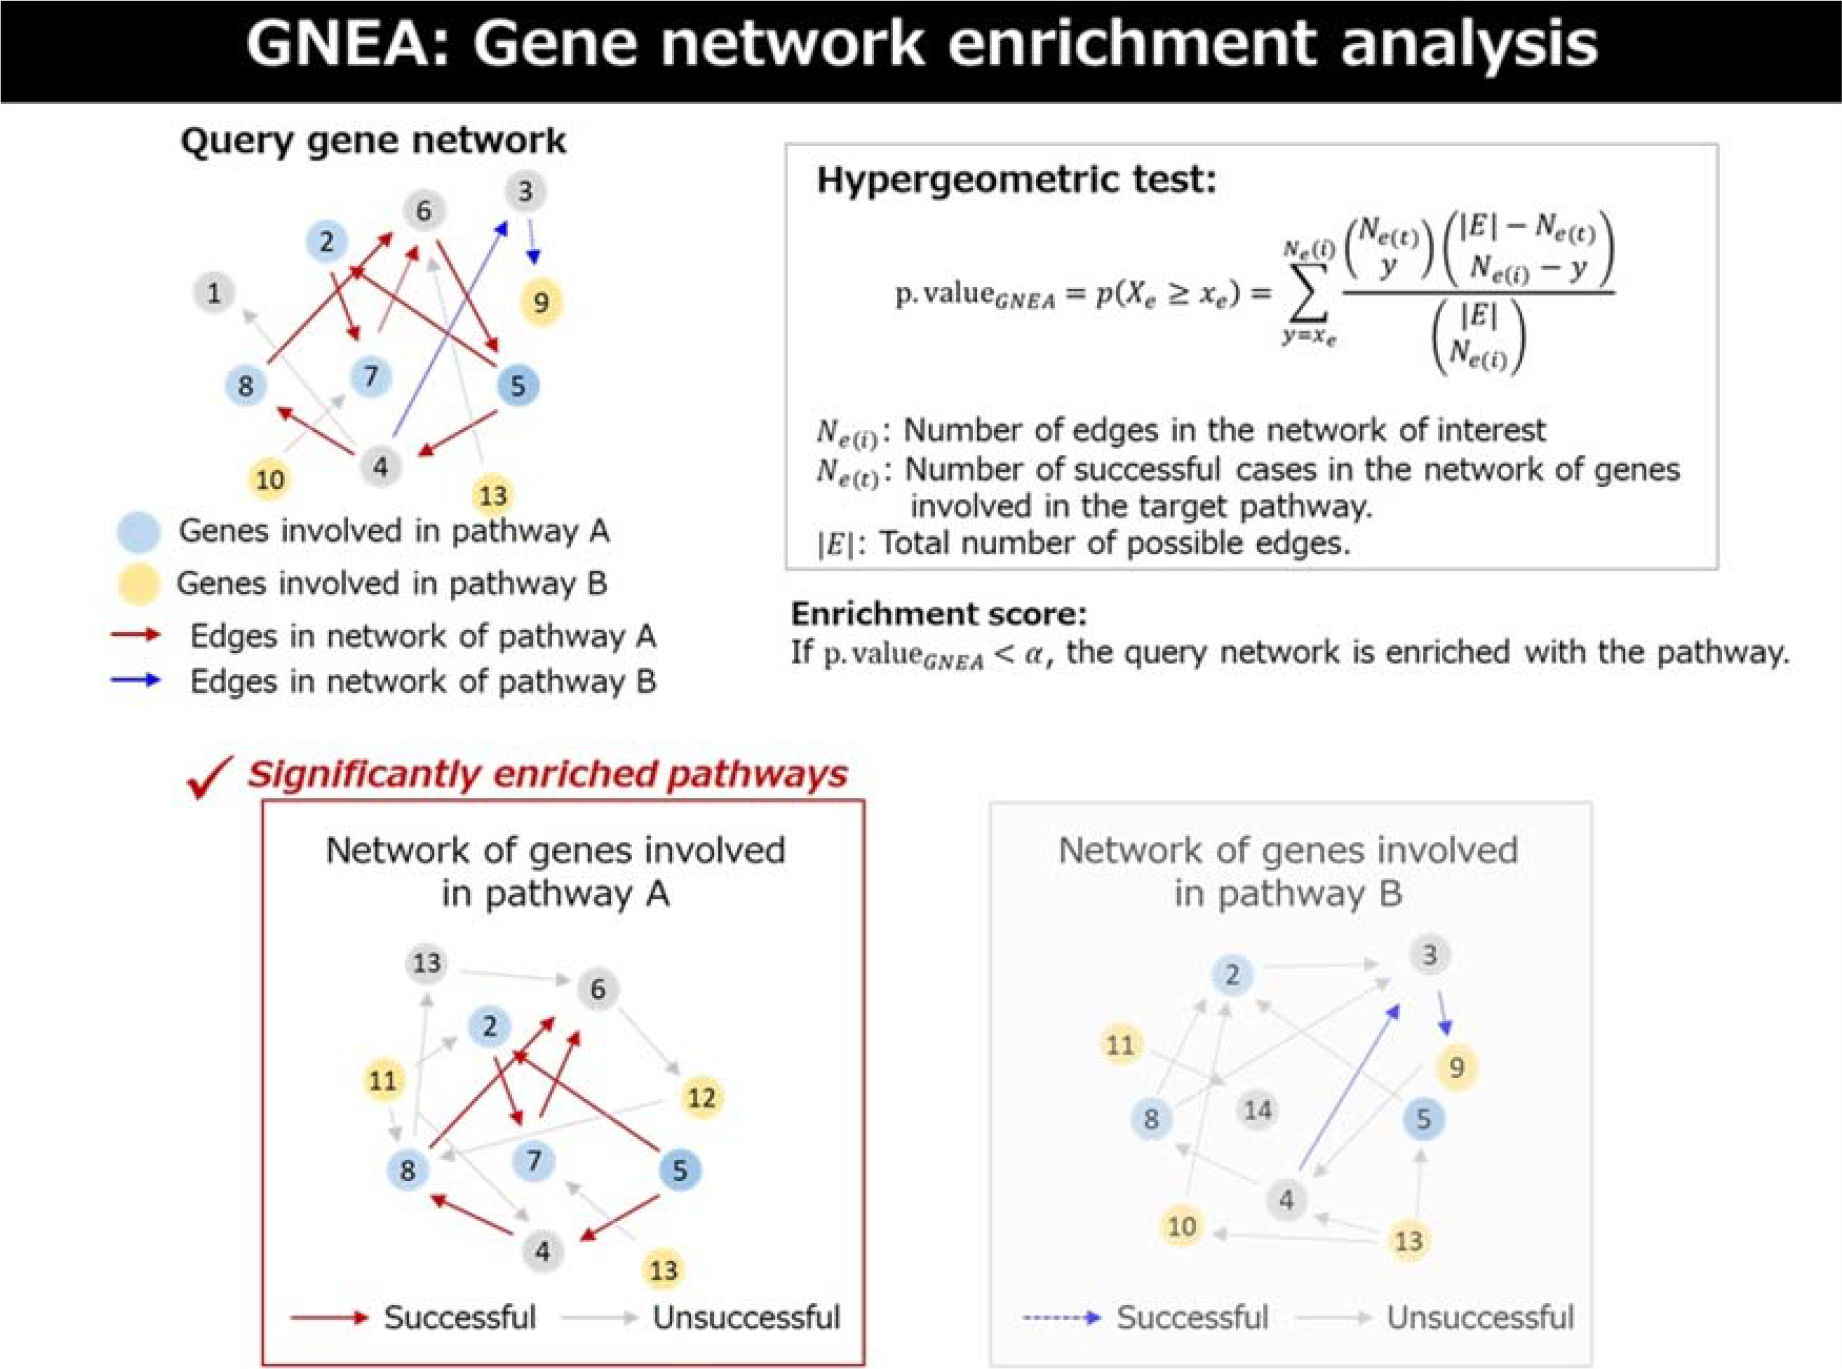
Overview of the gene behavior-based network enrichment analysis. Given a query gene network, edges are classified based on whether they overlap with the network formed by genes involved in a target pathway. That is, the edges in the query network that are also present in the network of genes associated with the target pathway are labeled as successful (e.g., red and blue edges corresponding to pathways A and B, respectively), while the remaining edges are labeled as unsuccessful. A hypergeometric test is then performed to assess whether the number of successful edges observed in the query network is greater than expected by chance, given the total number of possible edges. Pathways with statistically significant enrichment are identified as significantly enriched pathways.
The query network represents the gene network of interest to be tested for enrichment (i.e., subject of GNEA). It is constructed from the data under a specific biological condition (e.g., disease or age group), where nodes correspond to genes and edges represent inferred gene–gene interactions. The query network can be estimated using various approaches, including regression-based methods, correlation-based networks, or protein–protein interaction-derived networks.
Target network
The target network represents a reference gene network associated with a predefined biological pathway (i.e., pathway-related network). In our study, nodes of the target network correspond to genes involved in a specific pathway. The target network can also be obtained from curated pathway databases or estimated using network inference methods applied to pathway-restricted gene sets.
Association between query and target networks
The GNEA evaluates whether the query network contains a large number of edges that overlap with the target (pathway) network. Specifically, the overlap is defined as the set of edges that are present in both networks. The statistical significance of this overlap is assessed using a hypergeometric test, which evaluates whether the observed number of shared edges exceeds what would be expected by chance.
We assessed the enrichment of the gene network by considering the number of edges in the network of genes involved in specific functional pathways. This implies that enrichment is measured by the information of not only the edge structure but also the genes in a network because the edge structure is determined by genes. We then proposed a gene network enrichment test based on hypergeometric distribution to assess the significance of the number of overrepresented edges. That is, we marked the edges in the network of interest that belong to the network of genes involved in the target pathway as “successful” and the remaining ones as “unsuccessful.” In our strategy, edges are treated as independent units under the null hypothesis, analogous to the independence assumption of genes in conventional gene set enrichment analysis. This assumption is used to define a hypergeometric null model for assessing whether the observed overlap of edges exceeds random expectation, given the fixed network size and pathway-specific edge count.
We denote

The hypergeometric distribution gives the probability of observing exactly
We then assessed the significance of gene network enrichment based on the hypergeometric distribution as follows:

The p-valueGENA was adjusted for multiple comparisons using the false discovery rate q-value based on the Benjamini–Hochberg correction (Benjamini and Hochberg, 1995). This correction is applied to control the expected proportion of false positives arising from multiple testing, where each hypothesis corresponds to assessing whether a given pathway exhibits significant network enrichment.
Comprehensive information-based GNEA
Our method performs GNEA by jointly considering genes (nodes) and their interactions (edges). Since each edge represents a regulatory or functional relationship between a pair of genes, information at both the node and edge levels is explicitly incorporated into the enrichment analysis.
Biologically interpretable results
Hub genes linked with several genes have been recognized as crucial markers for understanding biological mechanisms because they play critical roles in gene regulation and biological processes. In our analysis, the hub genes have a significant effect on the enrichment score computation because the hub genes have several edges. That is, our method recognizes the hub genes that play a key role in biological processes as crucial factors in the GNEA. It implies that our strategy incorporates the knowledge of network biology into the GNEA and thus can provide biologically interpretable and reliable results.
MONTE CARLO SIMULATIONS
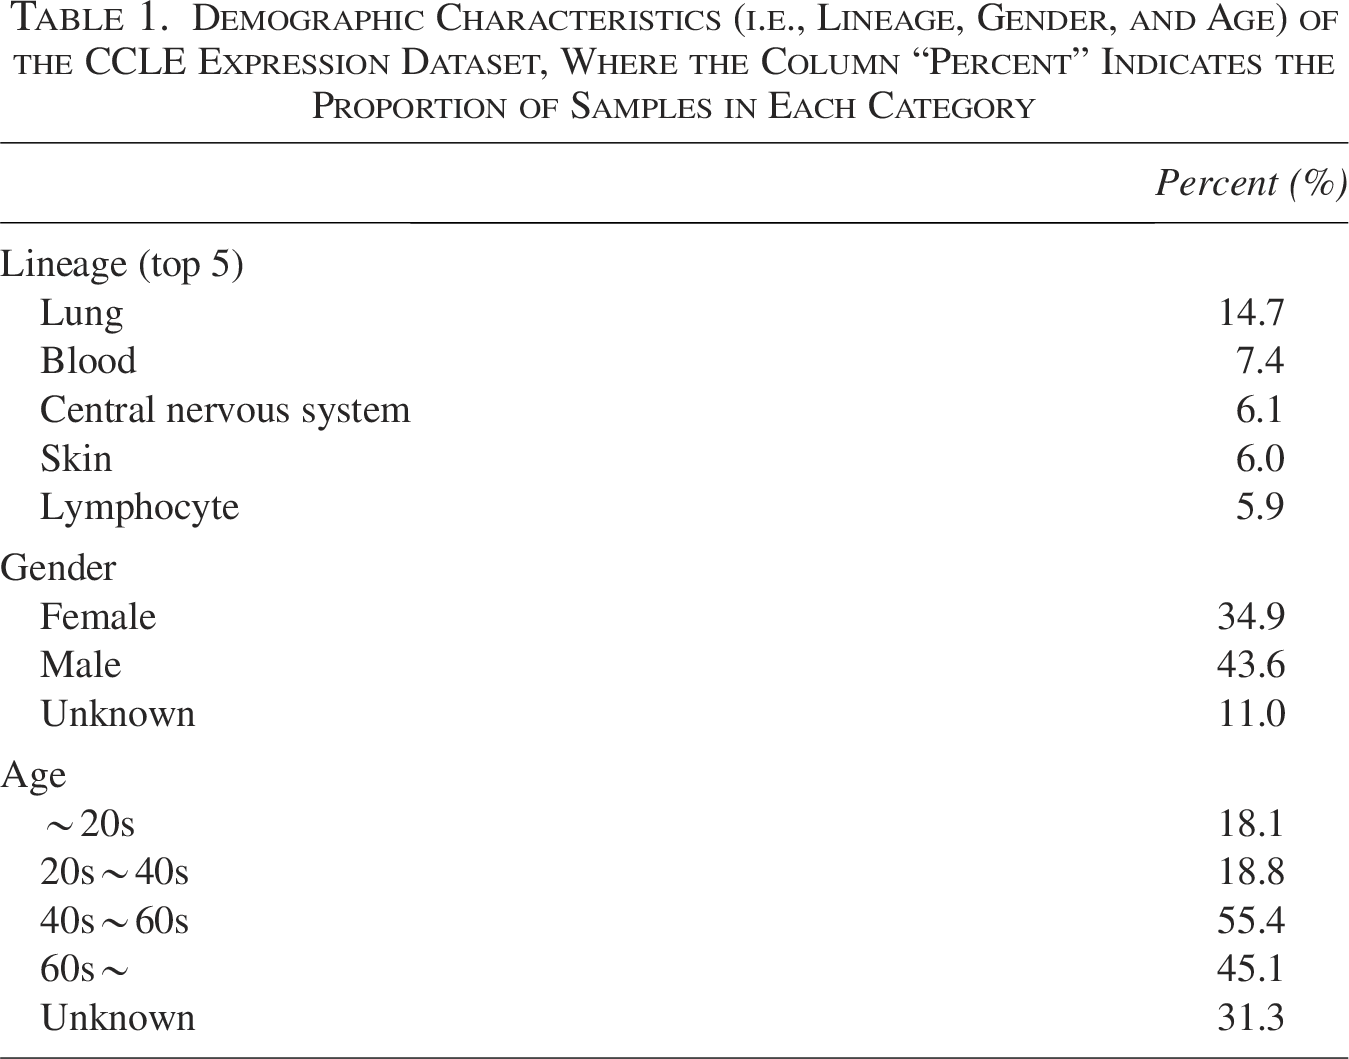
We illustrate the performance of the proposed strategy using Monte Carlo simulations. We used the publicly available CCLE expression dataset consisting of mRNA expression levels of 19,221 genes from 1406 cells from the DepMap database (https://depmap.org/portal/) to estimate gene networks. The CCLE expression dataset comprises 30 lineages, with lung cancer representing the largest proportion (over 14%), and most samples originating from individuals aged 40 years or older. Table 1 shows demographic information about the dataset.
Demographic Characteristics (i.e., Lineage, Gender, and Age) of the CCLE Expression Dataset, Where the Column “Percent” Indicates the Proportion of Samples in Each Category
Demographic Characteristics (i.e., Lineage, Gender, and Age) of the CCLE Expression Dataset, Where the Column “Percent” Indicates the Proportion of Samples in Each Category
In this study, the following linear regression model was used to describe the gene network:


We considered the following myeloid neoplasm-related pathways and correct related pathways as the target pathways: AML (hsa05221), hematopoietic cell lineage (HMT: hsa04640), chronic myeloid leukemia (CLM: hsa05220), myelodysplastic syndrome (MDS: H01481), and myelodysplastic/myeloproliferative neoplasms (H02410) from the Kyoto Encyclopedia of Genes and Genomes (KEGG) pathway database (https://www.genome.jp/kegg/pathway.html). Table 2 lists the myeloid neoplasm-related KEGG pathways, entries, and the number of genes involved in the pathways.
Myeloid Neoplasm-Related KEGG Pathways

Myeloid Neoplasm-Related KEGG Pathways
KEGG, Kyoto Encyclopedia of Genes and Genomes.
The proposed method was evaluated via GNEA using four target pathways (AML, HMT, CLM, and MDS). We extracted the genes involved in myeloid neoplasm-related KEGG pathways and belonging to the CCLE expression dataset (i.e., AML: 64, HMT: 87, CLM: 41, and MDS: 22), where the extracted 214 genes were named KEGG myeloid neoplasm genes.
We estimated the gene network between p genes comprising KEGG myeloid neoplasm genes, from which the
The target networks of the AML, HMT, CLM, and MDS pathways were estimated using 64, 87, 41, and 22 genes involved in the AML, HMT, CLM, and MDS pathways, respectively. For the query network (QR-“XXX”nwt) of the enrichment test, we estimated the gene network based on 90% (75%) of the randomly selected genes involved in a specific pathway and 10% (25%) of the genes not involved in the pathway, that is, we considered the noise rate as 10% and 25% for each query networks. That is, the query network of the AML-pathway enrichment gene network analysis (QR-“AML”nwt) was estimated by randomly selecting 58 (
The results of our strategy were compared with those of existing methods, namely NEAT, ORA, signaling pathway impact analysis (SPIA, Tarca et al., 2009), and Discriminative Random Walk with Restarts (DRaWR) (Blatti and Sinha, 2016). In the ORA, we considered two types of functional sets, that is, ORANW, genes belonging to the target pathway-enriched networks (target AML, HMT, CLM, and MDS pathway-enriched networks), and ORAGENE, genes involved in the target pathways (AML, HMT, CLM, and MDS pathways). We considered the total number of genes
Gene Network Enrichment Analysis Results for Myeloid Neoplasm-Related KEGG Pathways with 10% Error Rate
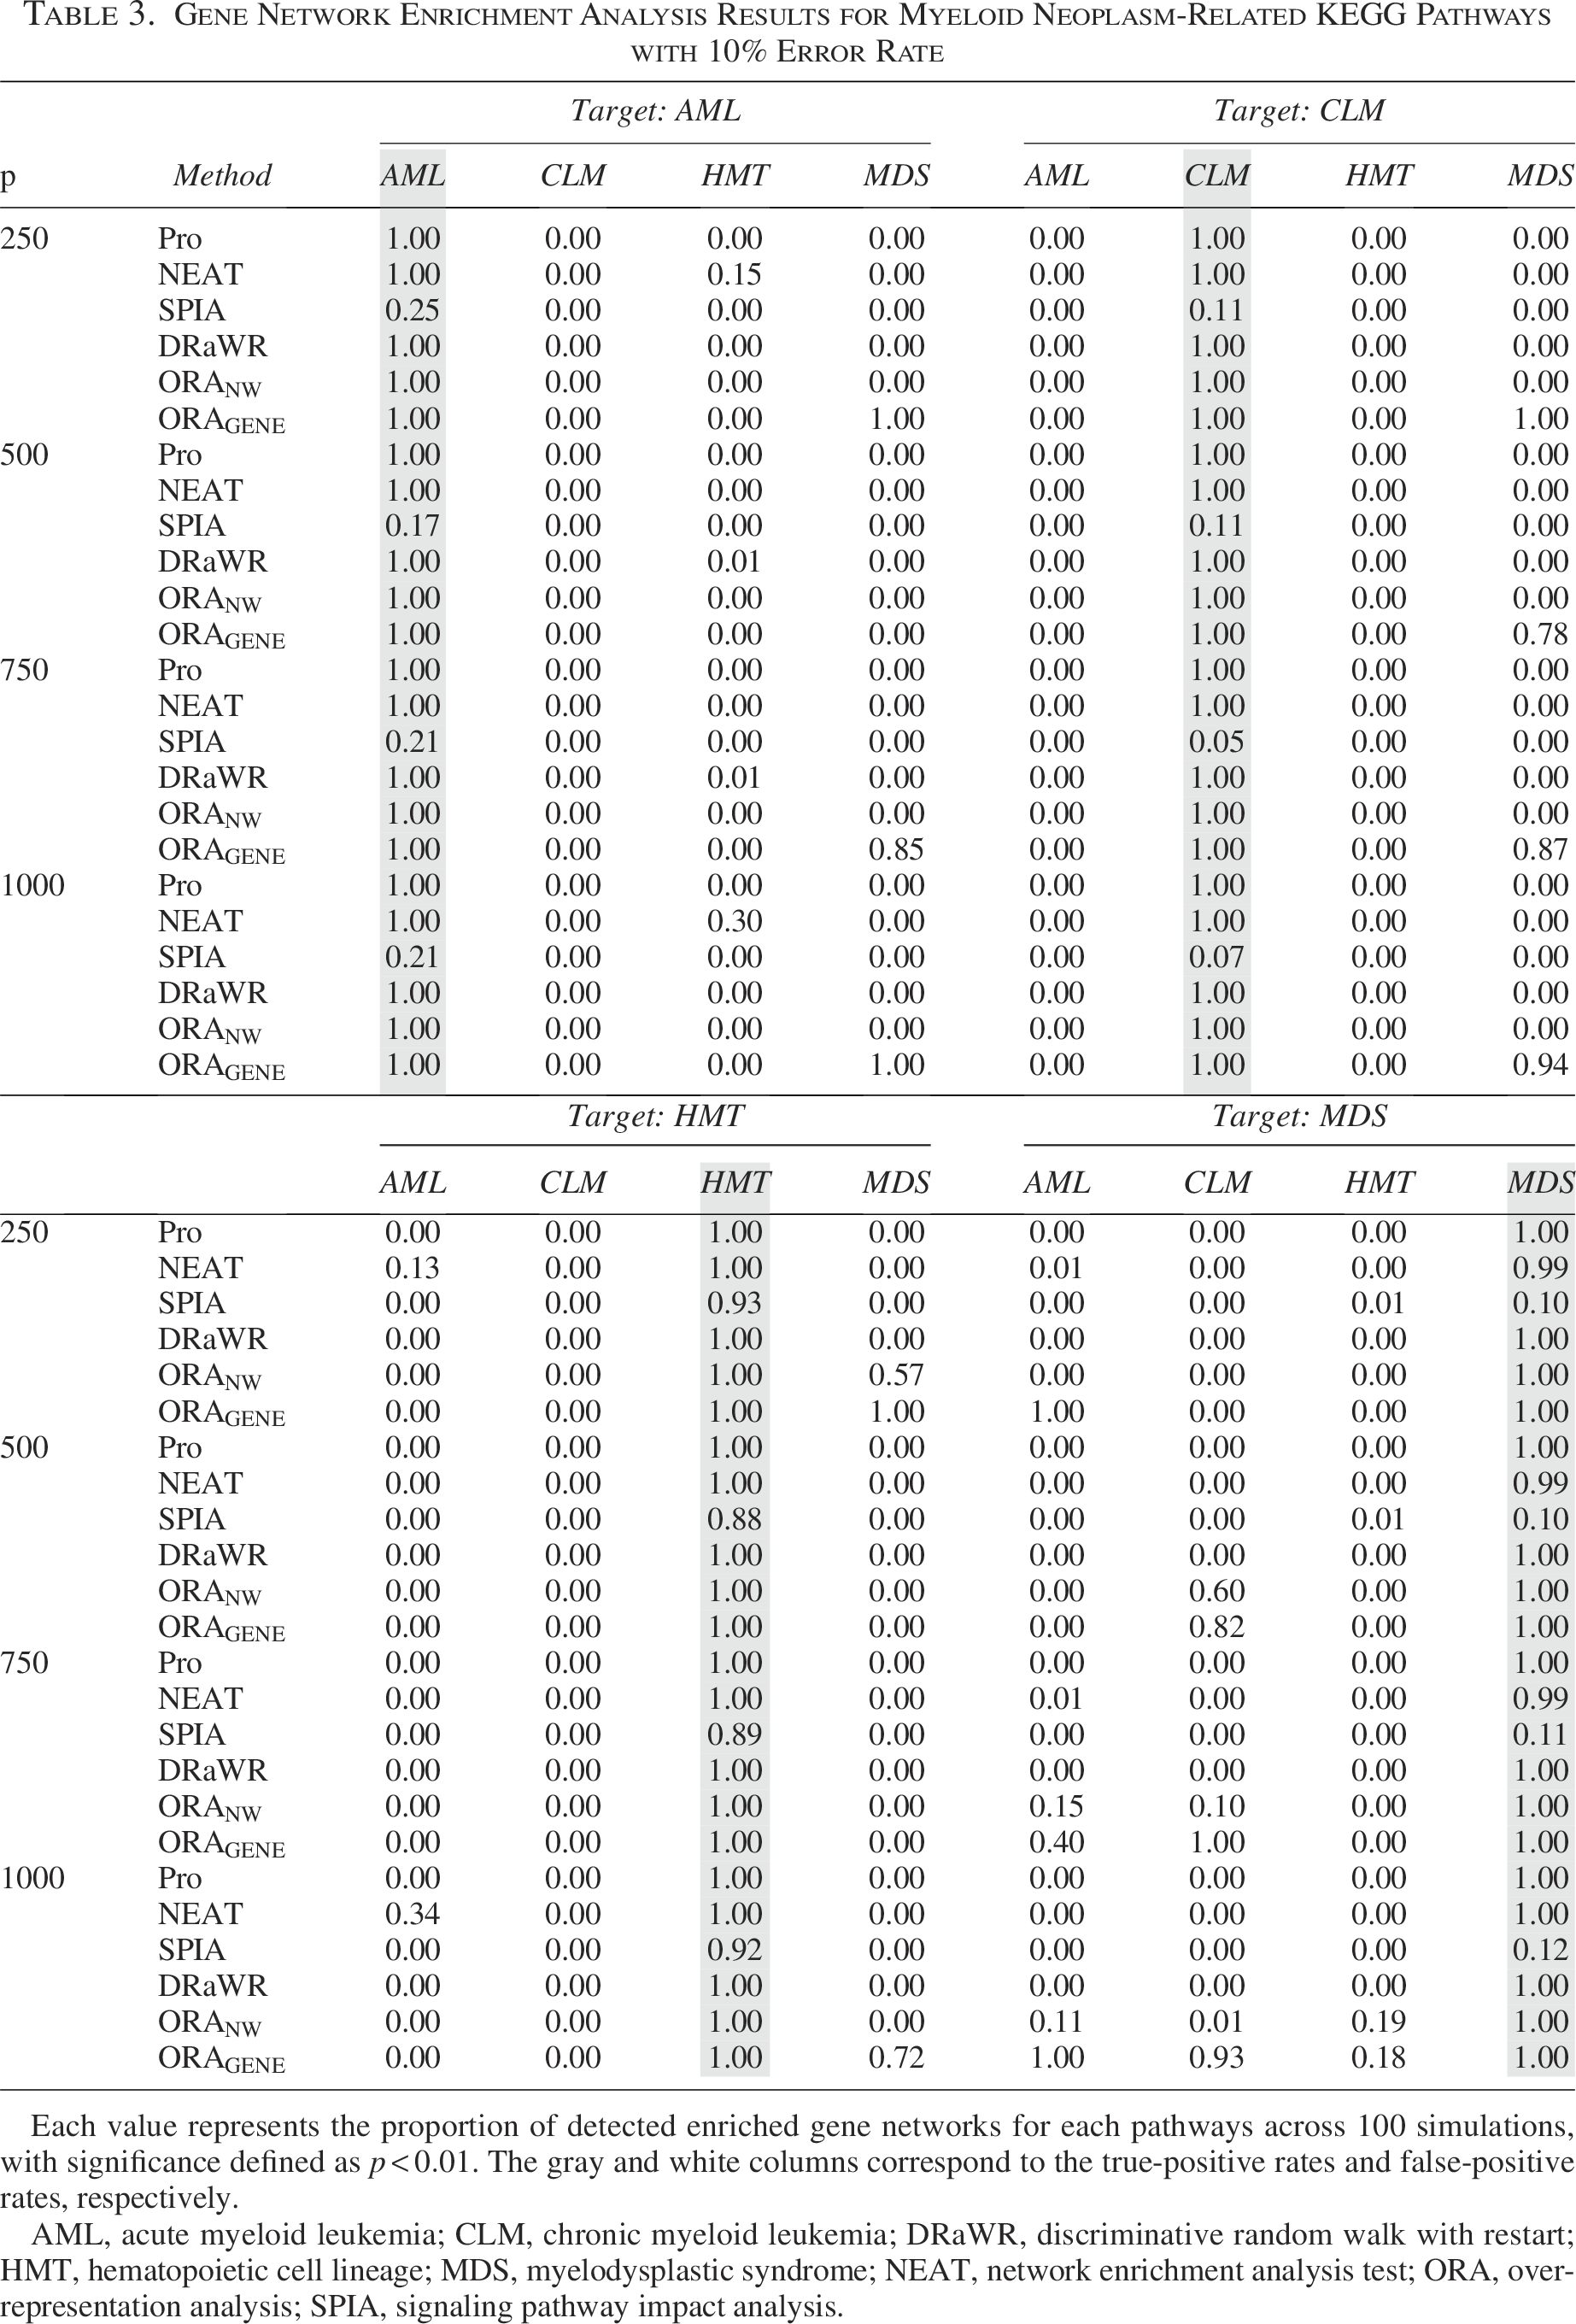
Each value represents the proportion of detected enriched gene networks for each pathways across 100 simulations, with significance defined as
AML, acute myeloid leukemia; CLM, chronic myeloid leukemia; DRaWR, discriminative random walk with restart; HMT, hematopoietic cell lineage; MDS, myelodysplastic syndrome; NEAT, network enrichment analysis test; ORA, overrepresentation analysis; SPIA, signaling pathway impact analysis.
Gene Network Enrichment Analysis Results for Myeloid Neoplasm-Related KEGG Pathways with 25% Error Rate
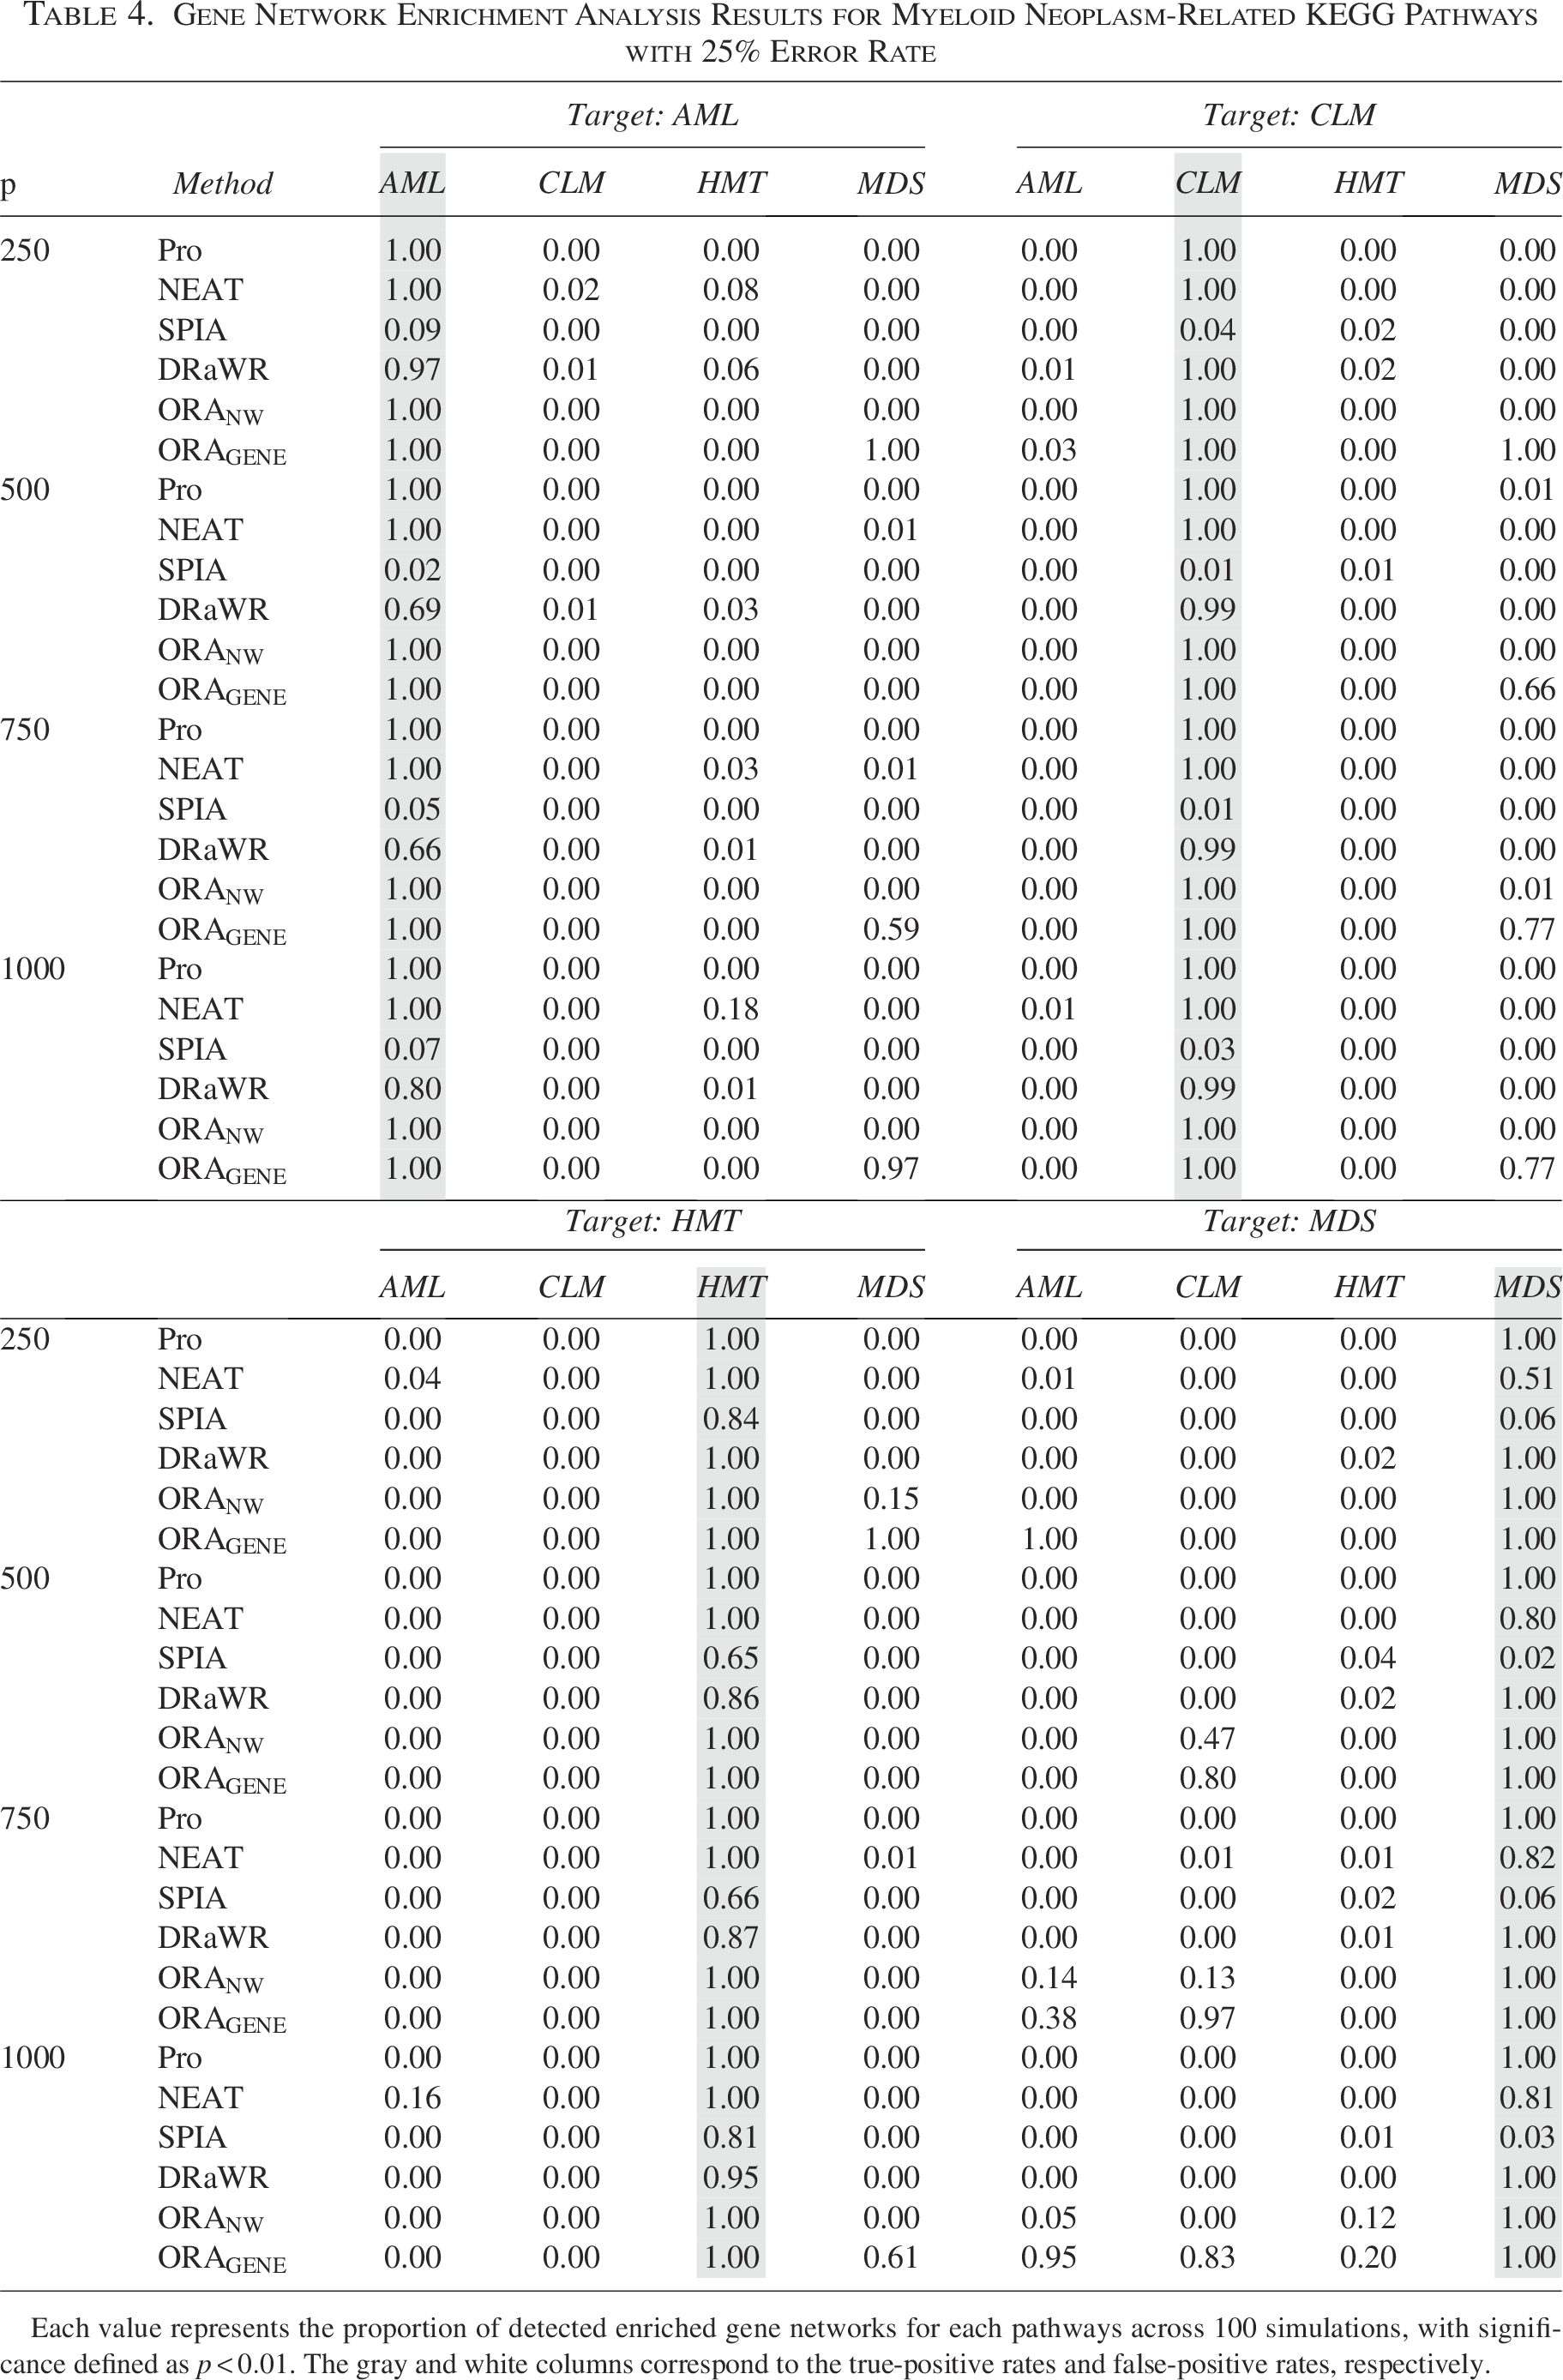
Each value represents the proportion of detected enriched gene networks for each pathways across 100 simulations, with significance defined as
We also evaluated our method for pan-cancer pathway-enriched gene network analysis based on pan-cancer-related pathways, that is, PPAR signaling pathway (hsa03320), calcium signaling pathway (hsa04020), MAPK signaling pathway (hsa04010), and focal adhesion (hsa04510) given as Table 5.
Pan-Cancer-Related KEGG Pathways
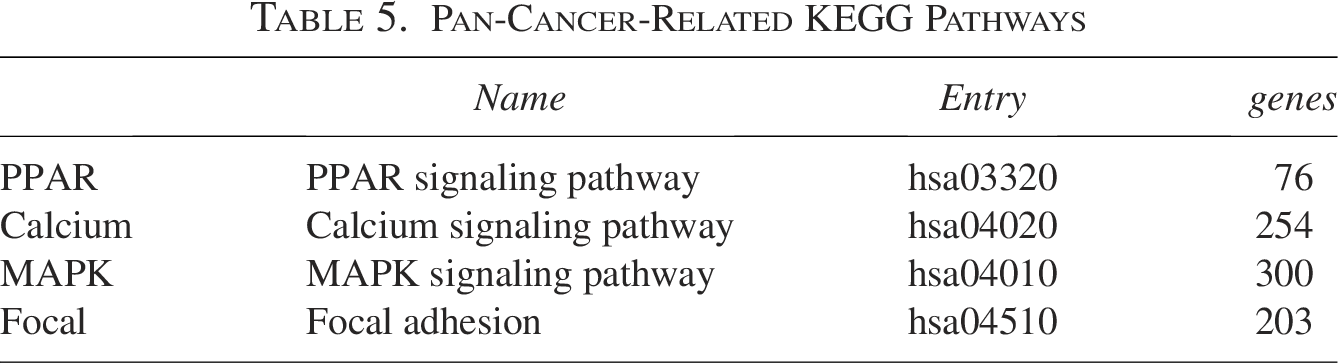
Pan-Cancer-Related KEGG Pathways
Similar to the myeloid neoplasm-related pathway-enriched gene network analysis, we first extracted genes involved in the pan-cancer-related KEGG pathways and belonging to the CCLE expression dataset (i.e., PPAR: 74, calcium: 228, MAPK: 253, and focal: 142), and we named the extracted 697 genes as KEGG pan-cancer genes. We estimated the gene network between p genes consisting of the 697 KEGG pan-cancer genes and the
Gene Network Enrichment Analysis Results for Pan-Cancer-Related KEGG Pathways
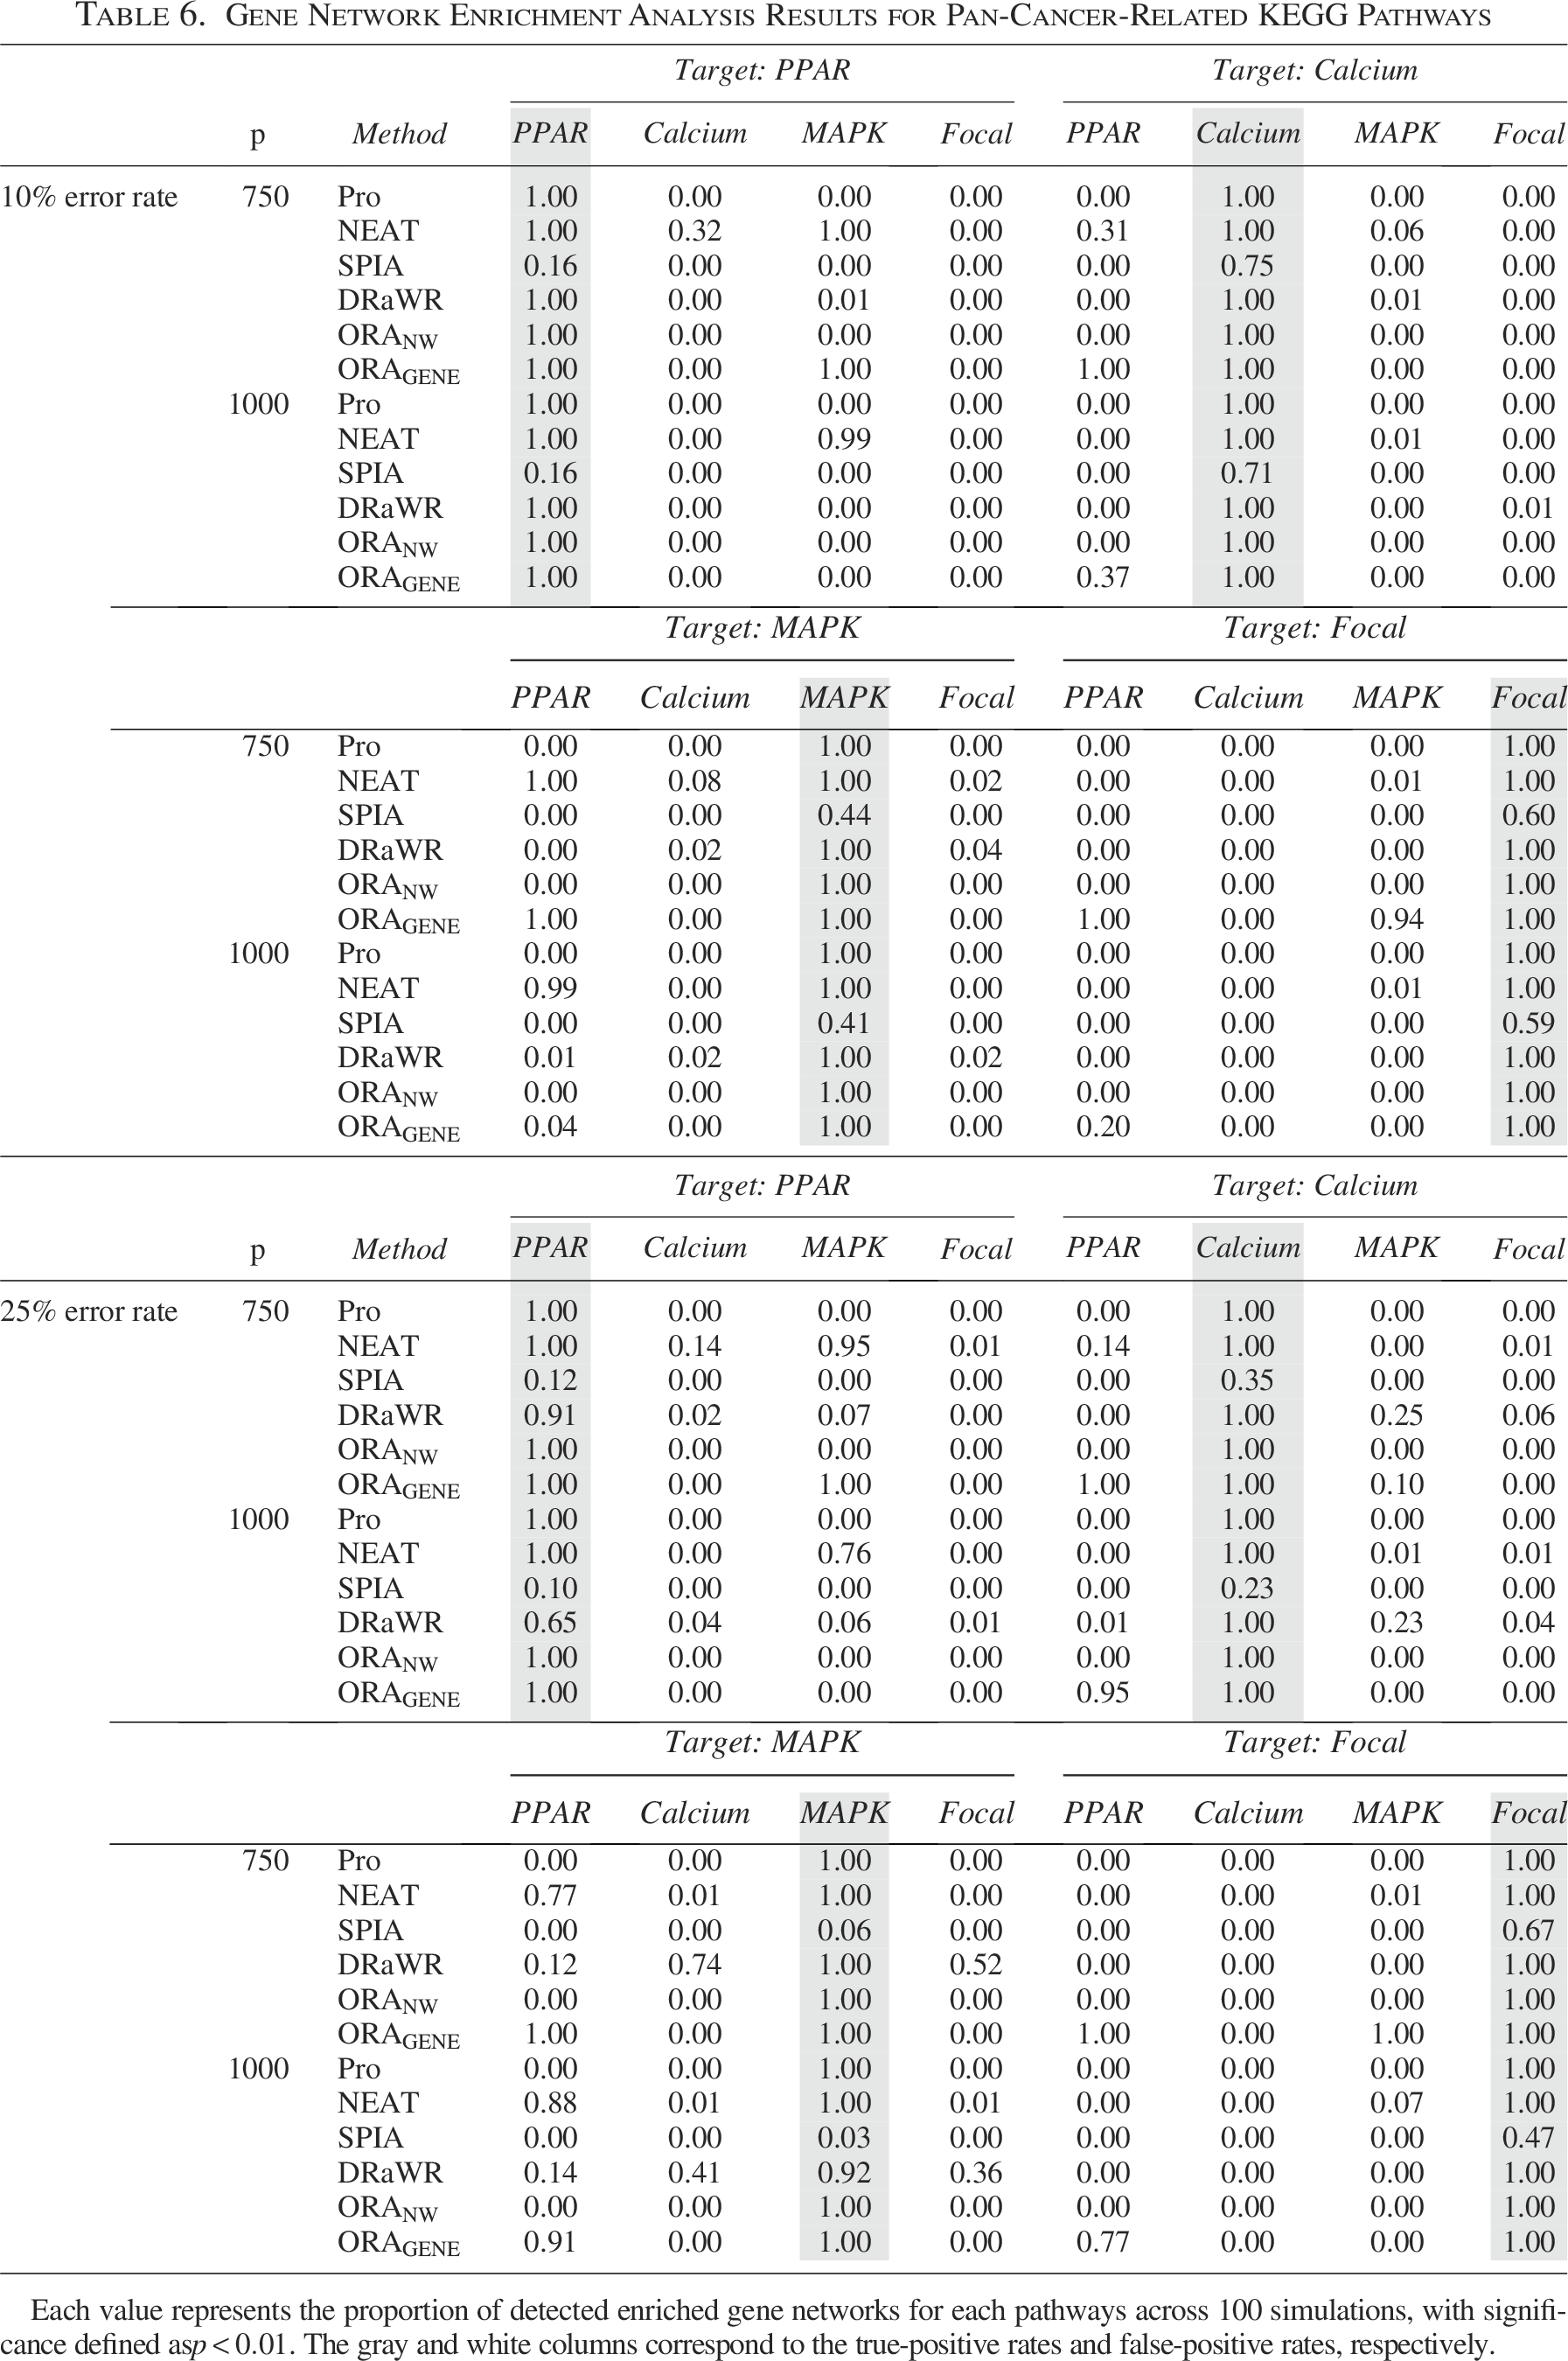
Each value represents the proportion of detected enriched gene networks for each pathways across 100 simulations, with significance defined as
These results demonstrated that our strategy provides stable performance across query networks with substantially different sizes and densities, ranging from sparse networks with fewer than 30 genes (i.e., myeloid neoplasm-related pathway analysis) to dense networks containing up to 300 genes (i.e., pan-cancer-related pathways). Moreover, consistent enrichment results were observed across target pathway-related networks of varying scales (250–1000 genes), indicating that the method is robust to variations in network density and degree structure and is not driven by highly connected hub genes.
We aimed to explore the enriched immune disease pathways for AML-specific gene networks. We estimated the gene networks in AML-aged and -young and healthy-aged and -young samples and identified the enriched immune disease pathways in each network. We used publicly available single-cell gene expression data from bone marrow donors (Triana et al., 2021). The dataset encompasses expression levels for 461 genes across 49,507 cell lines, sourced from “3 healthy-young and 3 healthy-aged bone marrow donors.” We also used “15 leukemic bone marrow donors” dataset, consisting of the expression levels for 458 genes in 31,586 cell lines, where the cell lines with a development stage of
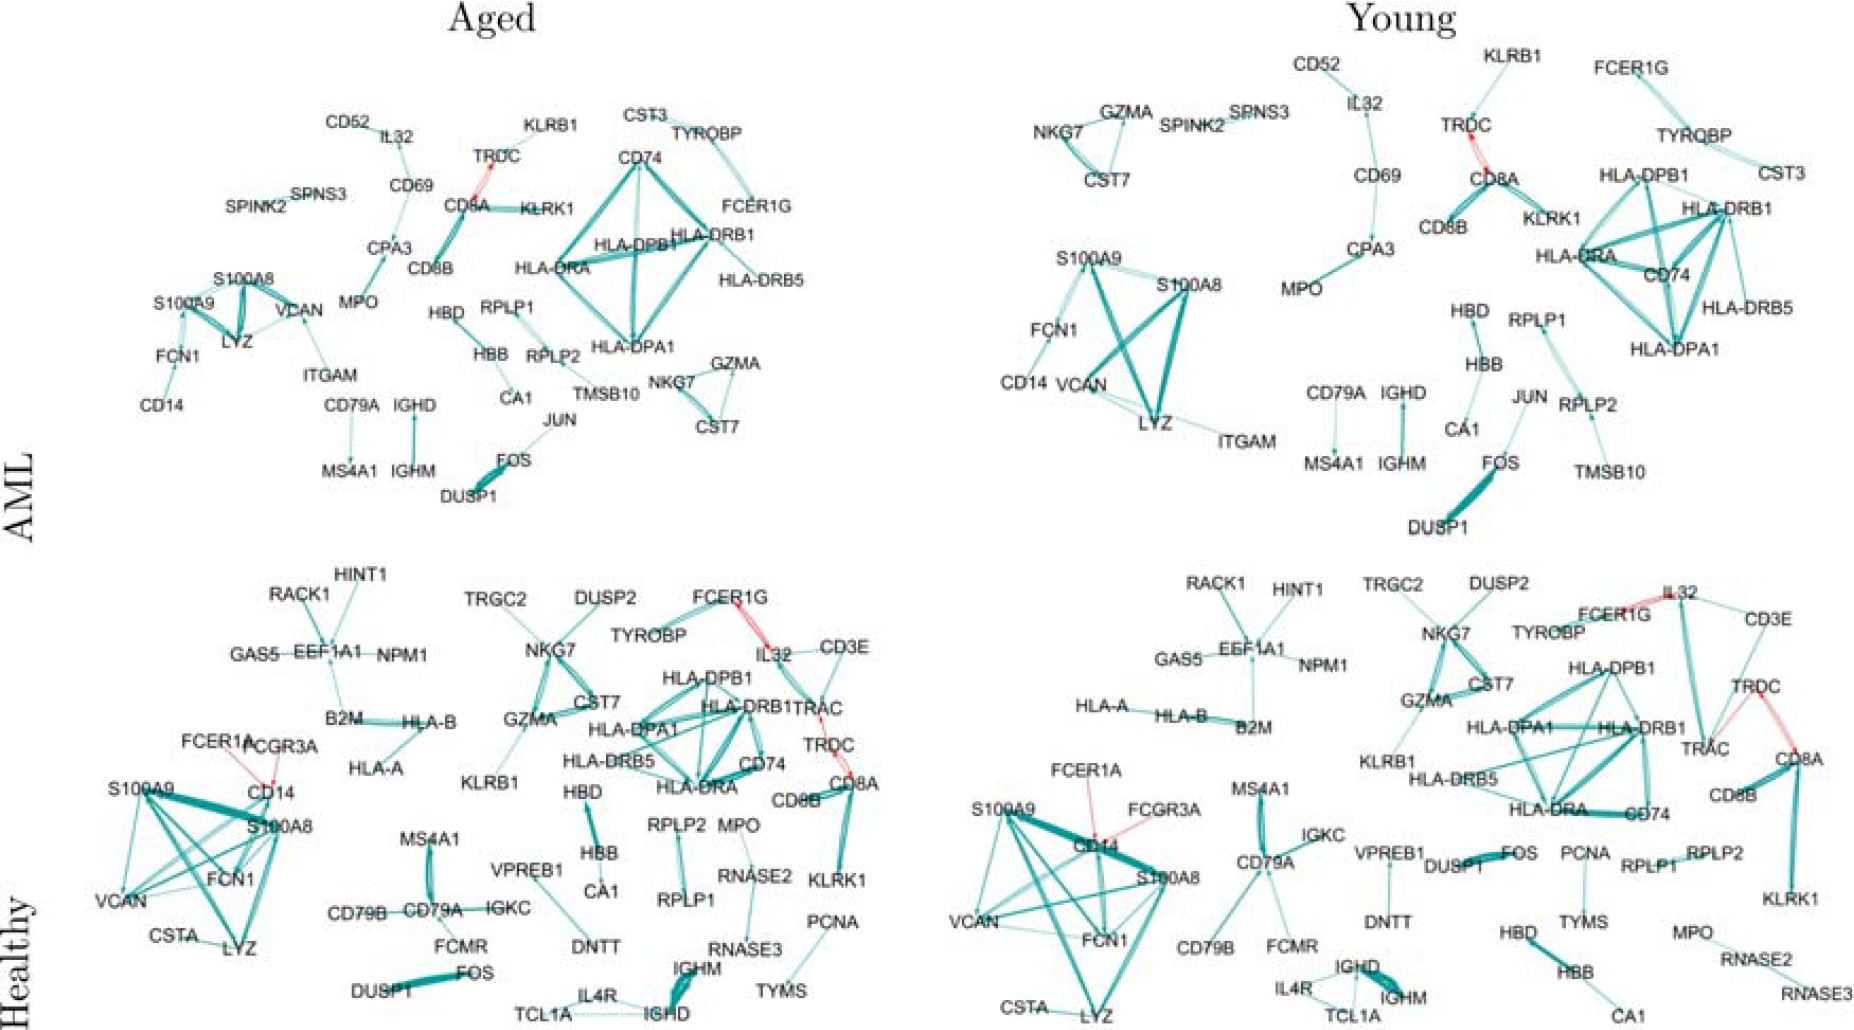
Query gene network of the “healthy-young,” “healthy-aged,” “AML-young,” and “AML-aged” groups. Directed arrows (
We then collected immune disease pathways from the KEGG pathway database, that is, the eight immune disease pathways were considered as target pathways of our GNEA (see Table 7). For the eight target immune disease pathways, we estimated the target networks between genes involving the pathways based on the expression levels of the “healthy-young,” “healthy-aged,” “AML-young,” and “AML-aged” groups, respectively. The enrichment analysis of the gene network for the “healthy-young” group was performed based on the degree of overlapped edges between the network of the “healthy-young” group and the networks of the genes involving eight target pathways estimated by the expression levels of the “healthy-young” group. For the “healthy-aged,” “AML-young,” and “AML-aged” gene networks, the enrichment analysis was also performed based on a process similar to that described for the “healthy-young” GNEA.
Immune Disease Pathways
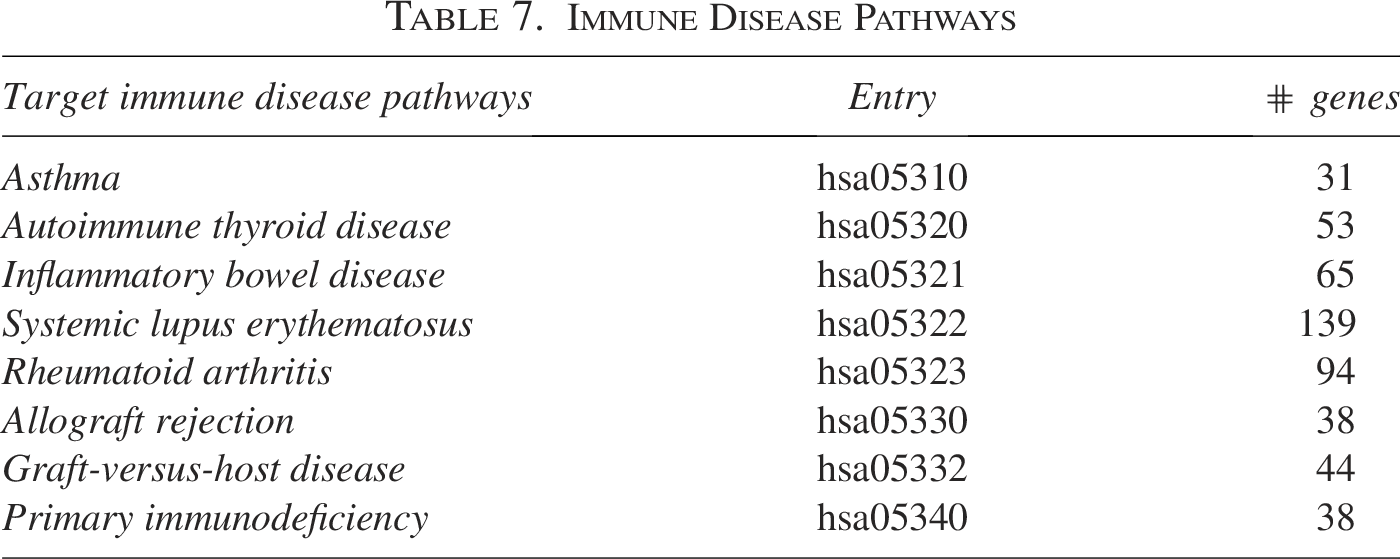
Table 8 shows the GNEA results (i.e., p-value of the target immune disease pathways for the gene networks of the “healthy-young,” “healthy-aged,” “AML-young,” and “AML-aged” groups). As shown in Table 8, the gene networks of AML-aged and -young groups were enriched in the IBD (hsa05321) pathway, whereas gene networks for the healthy groups were not enriched in this pathway. Gene networks in the healthy-young group were enriched in the asthma (hsa05310) pathways.
Enriched Immune Disease Pathway Results for Bone Marrow-Related Gene Networks, Where the Numbers Indicate p-Value of the Enrichment Analysis of the Gene Networks of AML-Aged/-Young and Healthy-Aged/-Young Samples for the Immune Disease Pathways
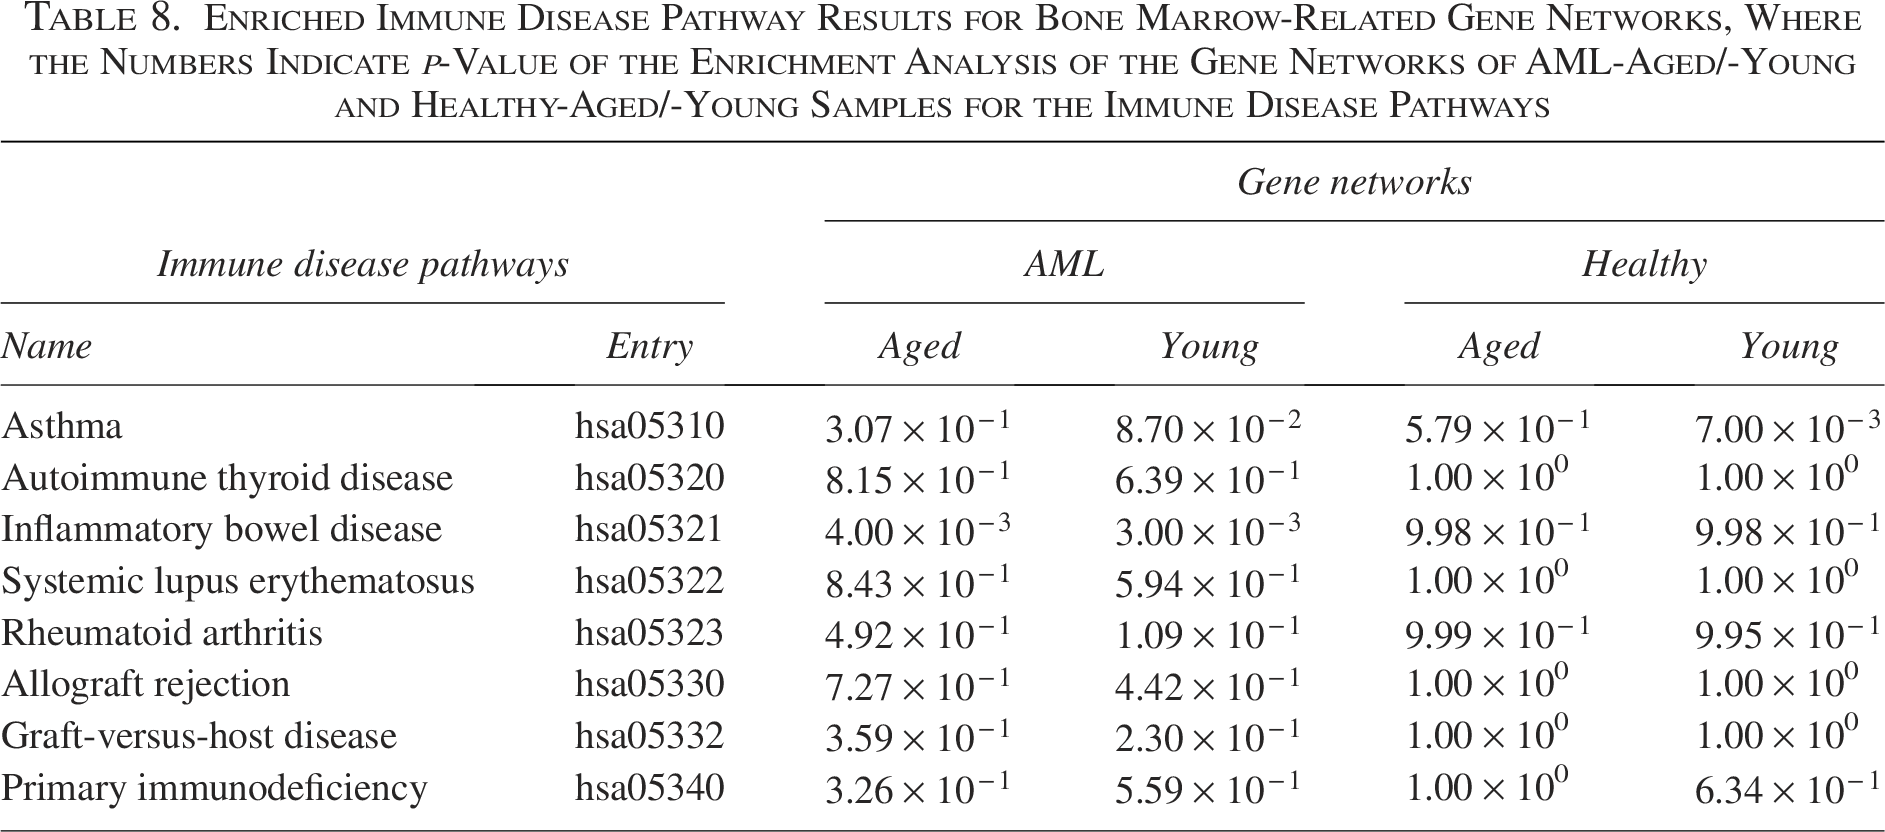
IBD is a chronic inflammatory disorder of the gastrointestinal tract, including Crohn’s disease and ulcerative colitis. Previous epidemiological and clinical studies have reported an increased risk of hematological malignancies, particularly AML, in patients with IBD (Askling et al., 2005). The enrichment of the IBD pathway in AML-aged and AML-young gene networks suggests that immune-mediated inflammatory processes associated with IBD may be reflected in AML-specific network structures.
Asthma: hsa05310
Asthma is a chronic inflammatory disease of the airways characterized by dysregulated immune responses and typically manifests early in life. The enrichment of the asthma pathway in the healthy-young gene network, but not in AML networks, may reflect age-dependent immune regulatory patterns that are preserved in healthy individuals and disrupted in disease conditions.
To identify the significantly enriched pathways (i.e., IBD and asthma), we extracted information regarding the molecular interplays of each group. That is, we extracted the overlapping edges between the gene networks of the four groups and the target gene networks of significantly enriched pathways (i.e., IBD and asthma). The networks comprising the extracted edges can be considered the molecular interplays involved in the enriched pathways (i.e., IBD and asthma). Table 9 lists the genes comprising the networks involved in the identified enriched pathways. These genes can be considered crucial markers for uncovering the biological meaning of IBD and asthma-enriched gene networks.
Genes and
of Edges in Enriched Pathway-Related Networks
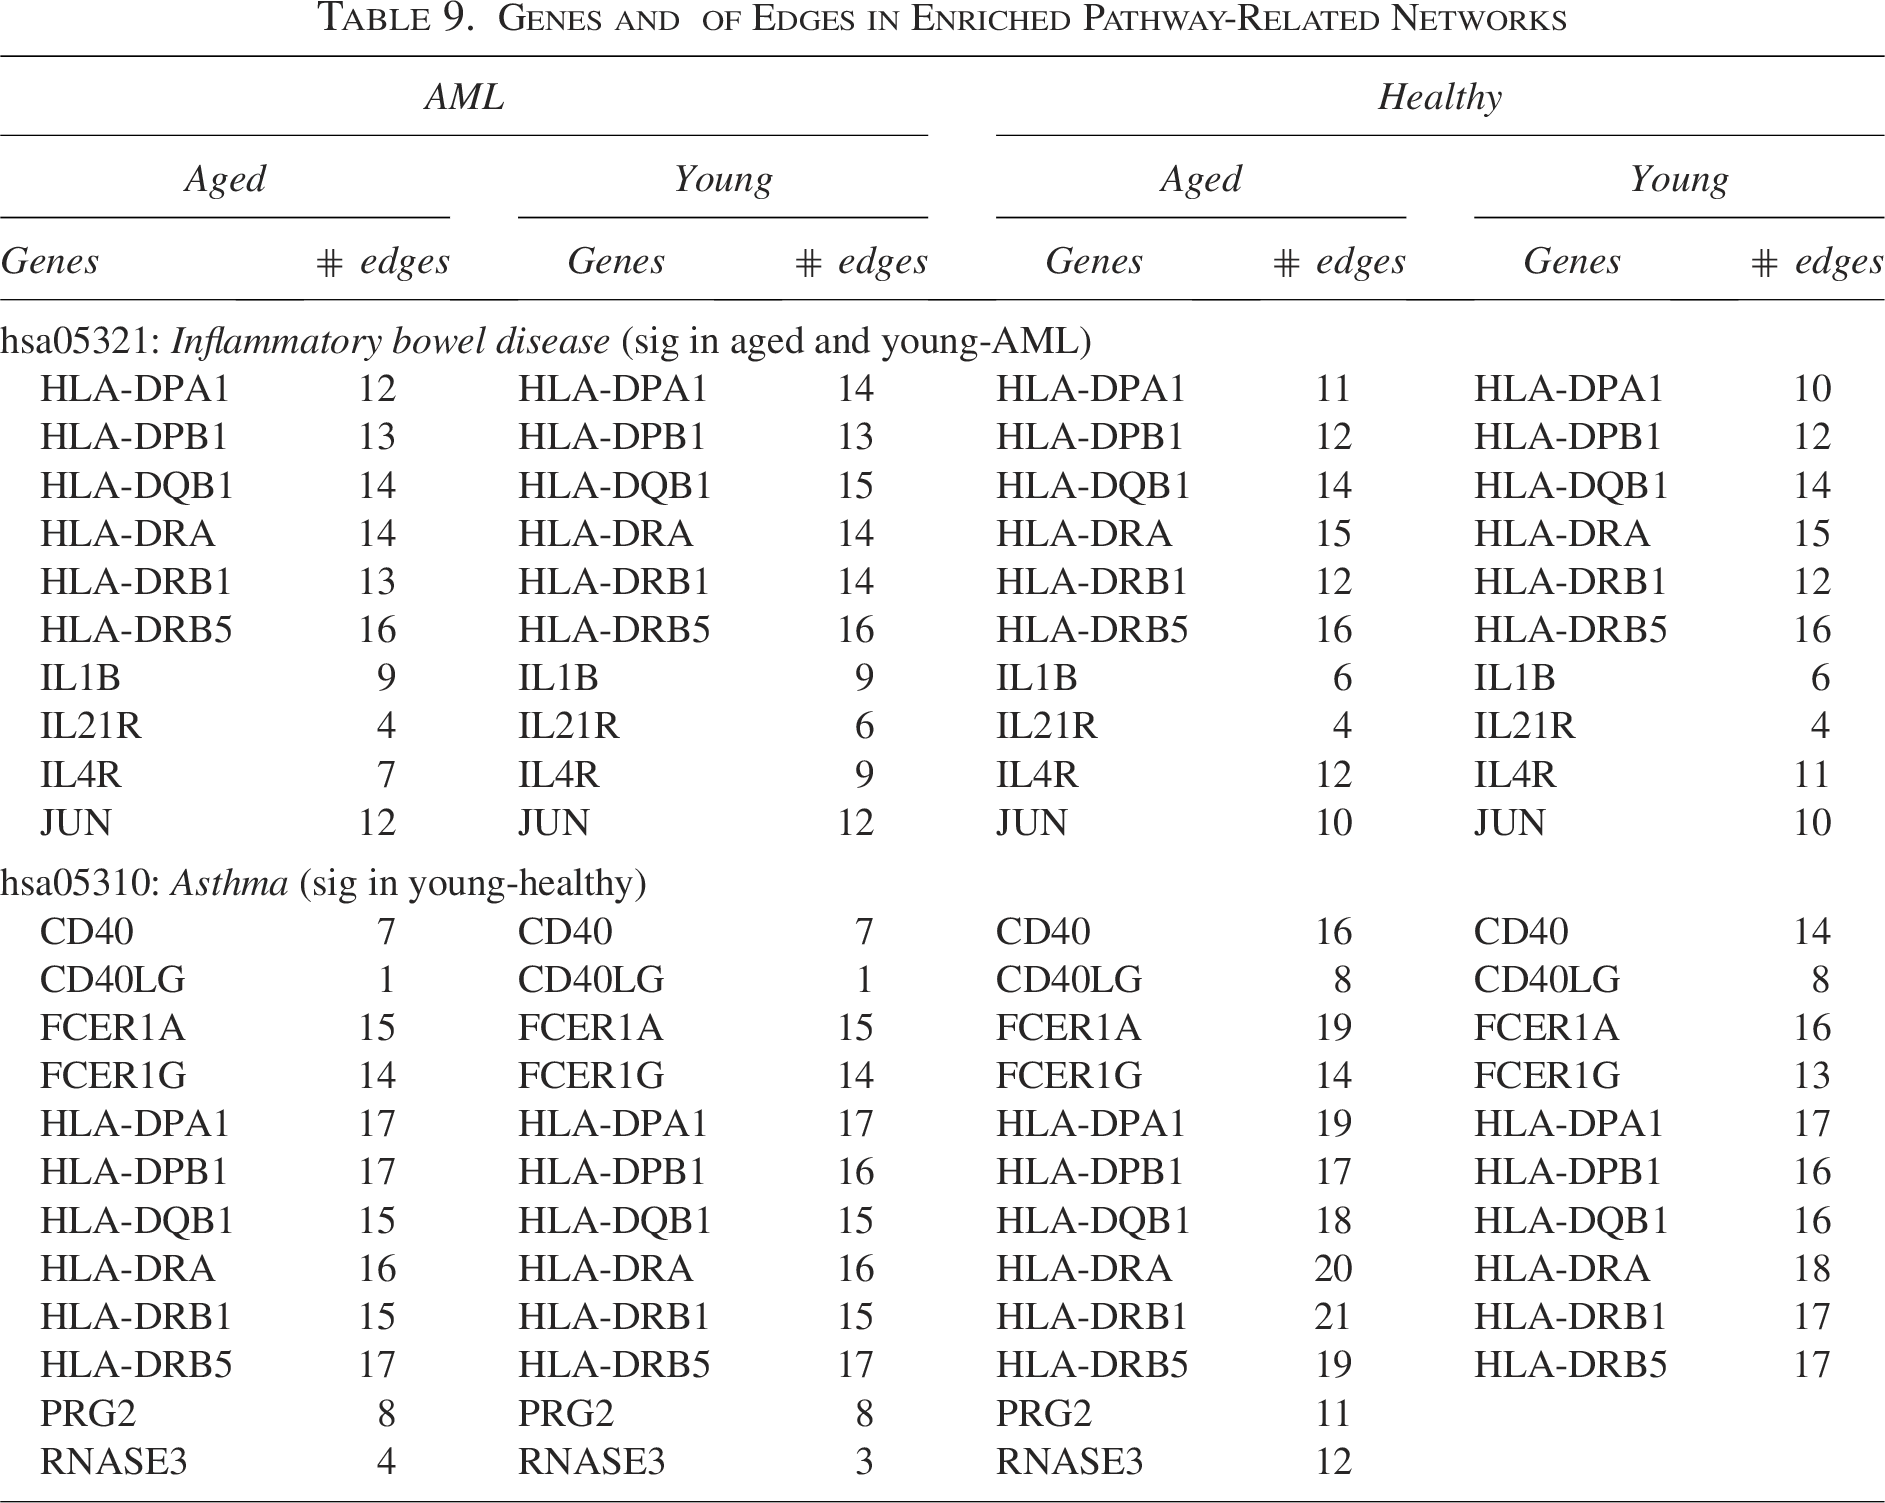
Genes and
The AML-aged and -young gene networks involved in the IBD pathway are dominated by HLA-D (i.e., HLA-DPA1, HLA-DPB1, HLA-DQB1, HLA-DRA, HLA-DRB1, and HLA-DRB5) and IL (IL1B, IL21R, and IL4R) genes, while CD40 (CD40 and CD40LG), FCER1 (FCER1A and FCER1G), and HLA-D genes dominate the healthy-young networks involved in the asthma pathway.
HLA class II molecules are primarily expressed on antigen-presenting cells and play a central role in immune recognition. (Nelde et al., 2023) reported that HLA class II-presented antigens are associated with leukemia stem and progenitor cells, and Cao et al. (2020) identified HLA-DP and HLA-DQ variants linked to increased AML risk. The enrichment of HLA class II genes in our analysis suggests a potential involvement of altered antigen presentation in AML-specific network structures.
CD40 genes: CD40 and CD40LG
CD40 and CD40LG mediate immune cell interactions and have been implicated in AML. Previous studies have shown that altered CD40 signaling affects immune recognition, prognosis, and therapeutic response in AML (Aldinucci et al., 2002; Hock et al., 2006; Feng and Chen, 2020; Li et al., 2023). Their enrichment in our results highlights the role of CD40-related immune interactions in AML-associated gene networks.
FCER1 genes: FCER1A and FCER1G
FCER1 genes are involved in immune signaling and have been associated with AML progression. FCER1G has been reported to be upregulated in AML, linked to poor prognosis, and identified as a hub gene in AML-related networks (Tan et al., 2020). The enrichment of FCER1-related genes supports their relevance in AML-specific immune network architectures.
IL genes: IL1B and IL21R
Grauers Wiktorin et al. (2021) demonstrated that interleukin-1 beta (IL-1
The identified markers provide strong evidence of being key markers of AML. Figure 3 shows the enriched gene networks for the IBD pathway. The mutual suppression between HLA-DPB1 and IL4R can be considered an AML-specific molecular interplay for IBD-enriched gene networks, whereas the genes activate each other in the gene networks of healthy groups (i.e., healthy-aged and -young groups). Furthermore, the mutual inhibition between JUN and HLA-DPB1 is also an AML-specific molecular interplay that disappears in gene networks of healthy groups.
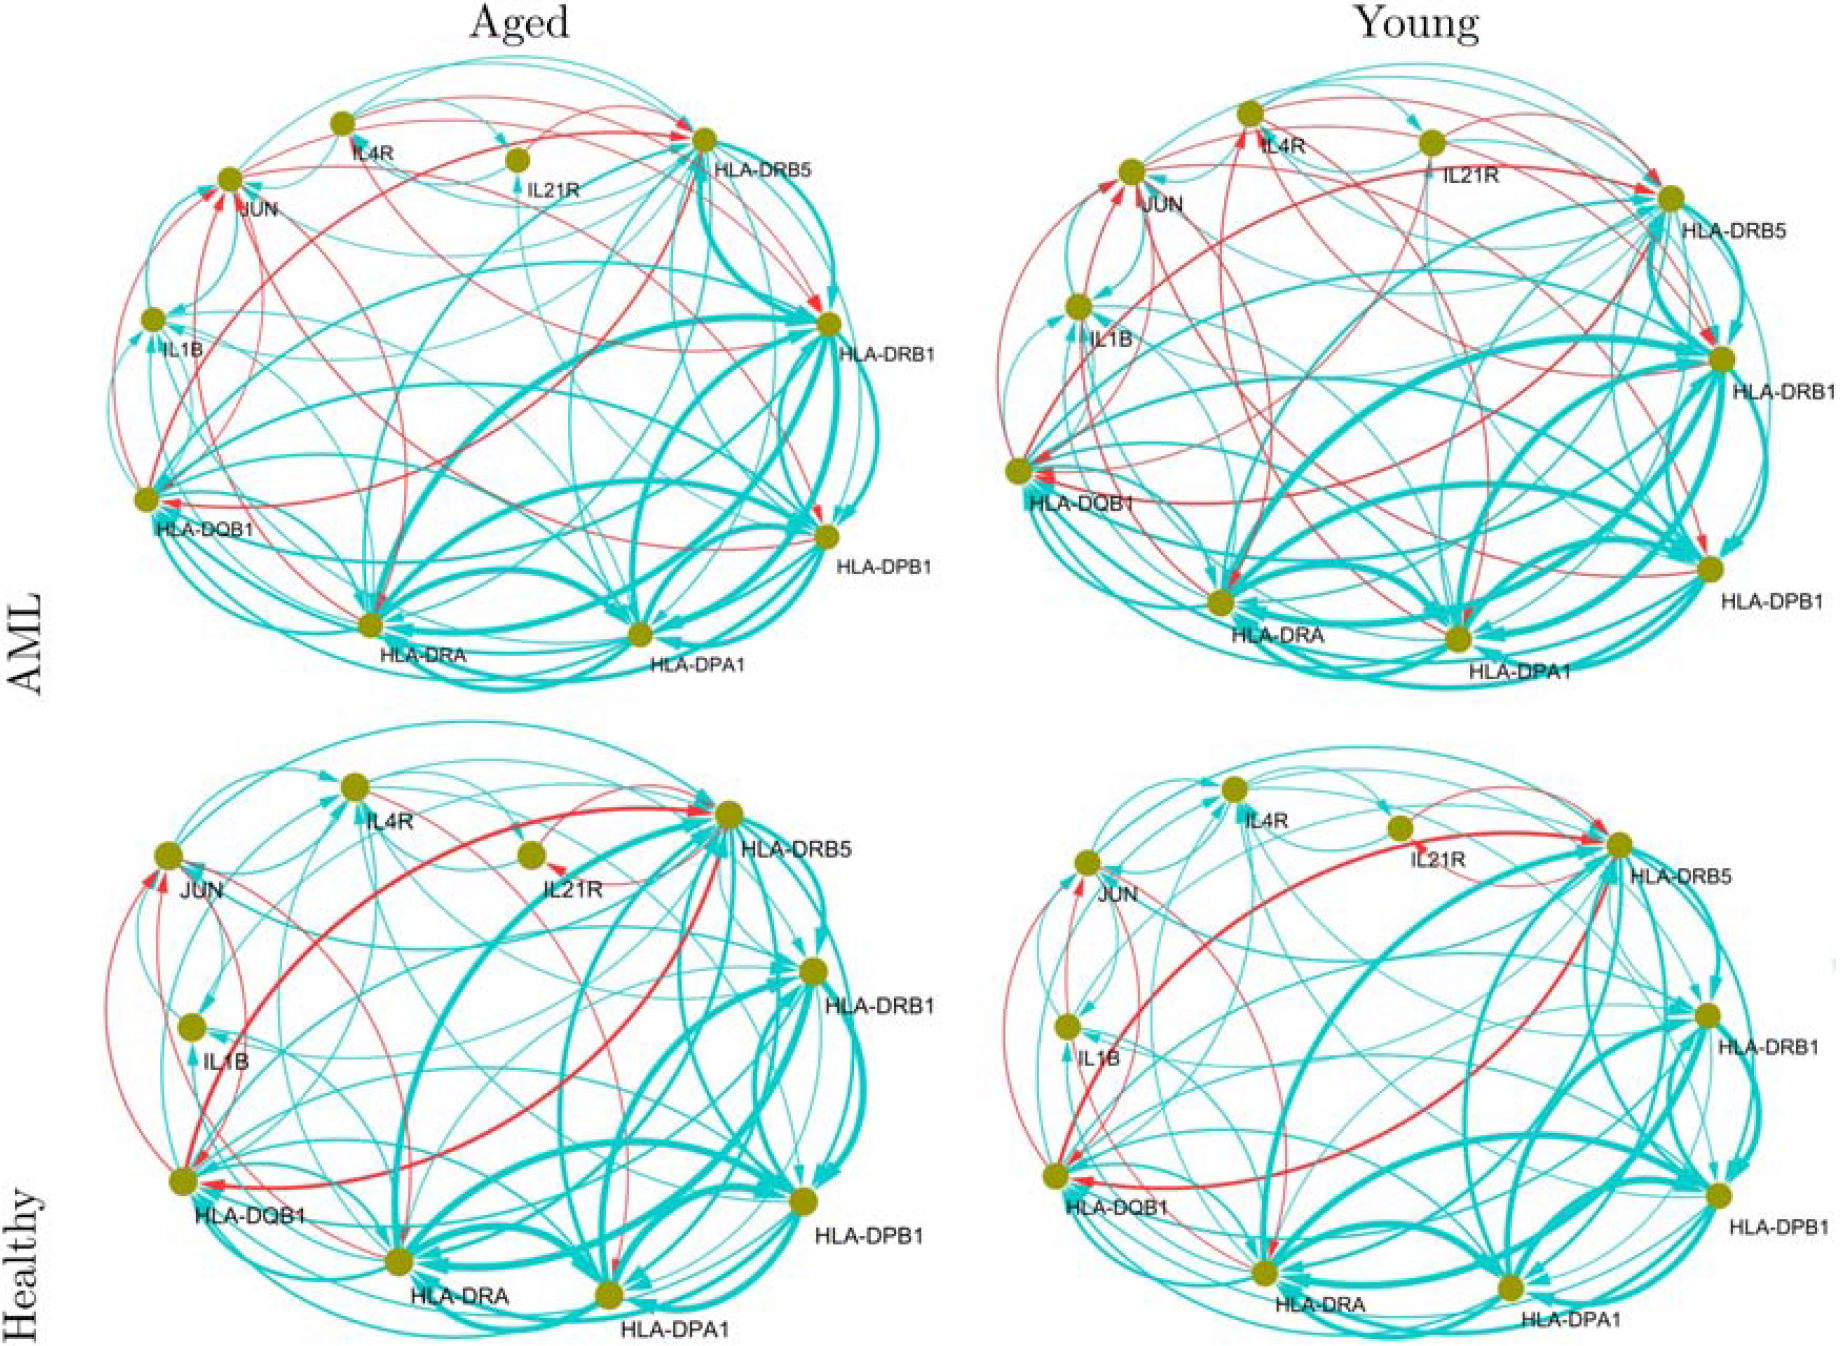
Inflammatory bowel disease (hsa05321) pathway-enriched gene networks. Directed arrows (
We show the asthma-enriched gene networks for “healthy-young,” “healthy-aged,” “AML-young,” and “AML-aged” groups in Figure 4. CD40 showed higher activity in the networks of the healthy-aged and -young groups than in those of AML groups. The disappearance of the interplay between PRG2 and RNASE3 is considered characteristic of a healthy-young network enriched in the asthma pathway. The interplay between RNASE3 and PRG2 was observed in the networks of AML-aged and -young and healthy-aged groups. However, their interplay disappeared in the networks of the healthy-young group. That is, the disappearance of the interplay between RNASE3 and PRG2 can be considered a specific molecular characteristic of healthy-young individuals. The hubness of CD40LG is also considered a health-specific characteristic, whereas CD40LG inhibits only HLA-DPA1 in the gene networks for the AML-aged and -young groups. Given the density of the networks in Figures 2 and 3, all edges and their corresponding edge weights are provided in the Supplementary Data for completeness.
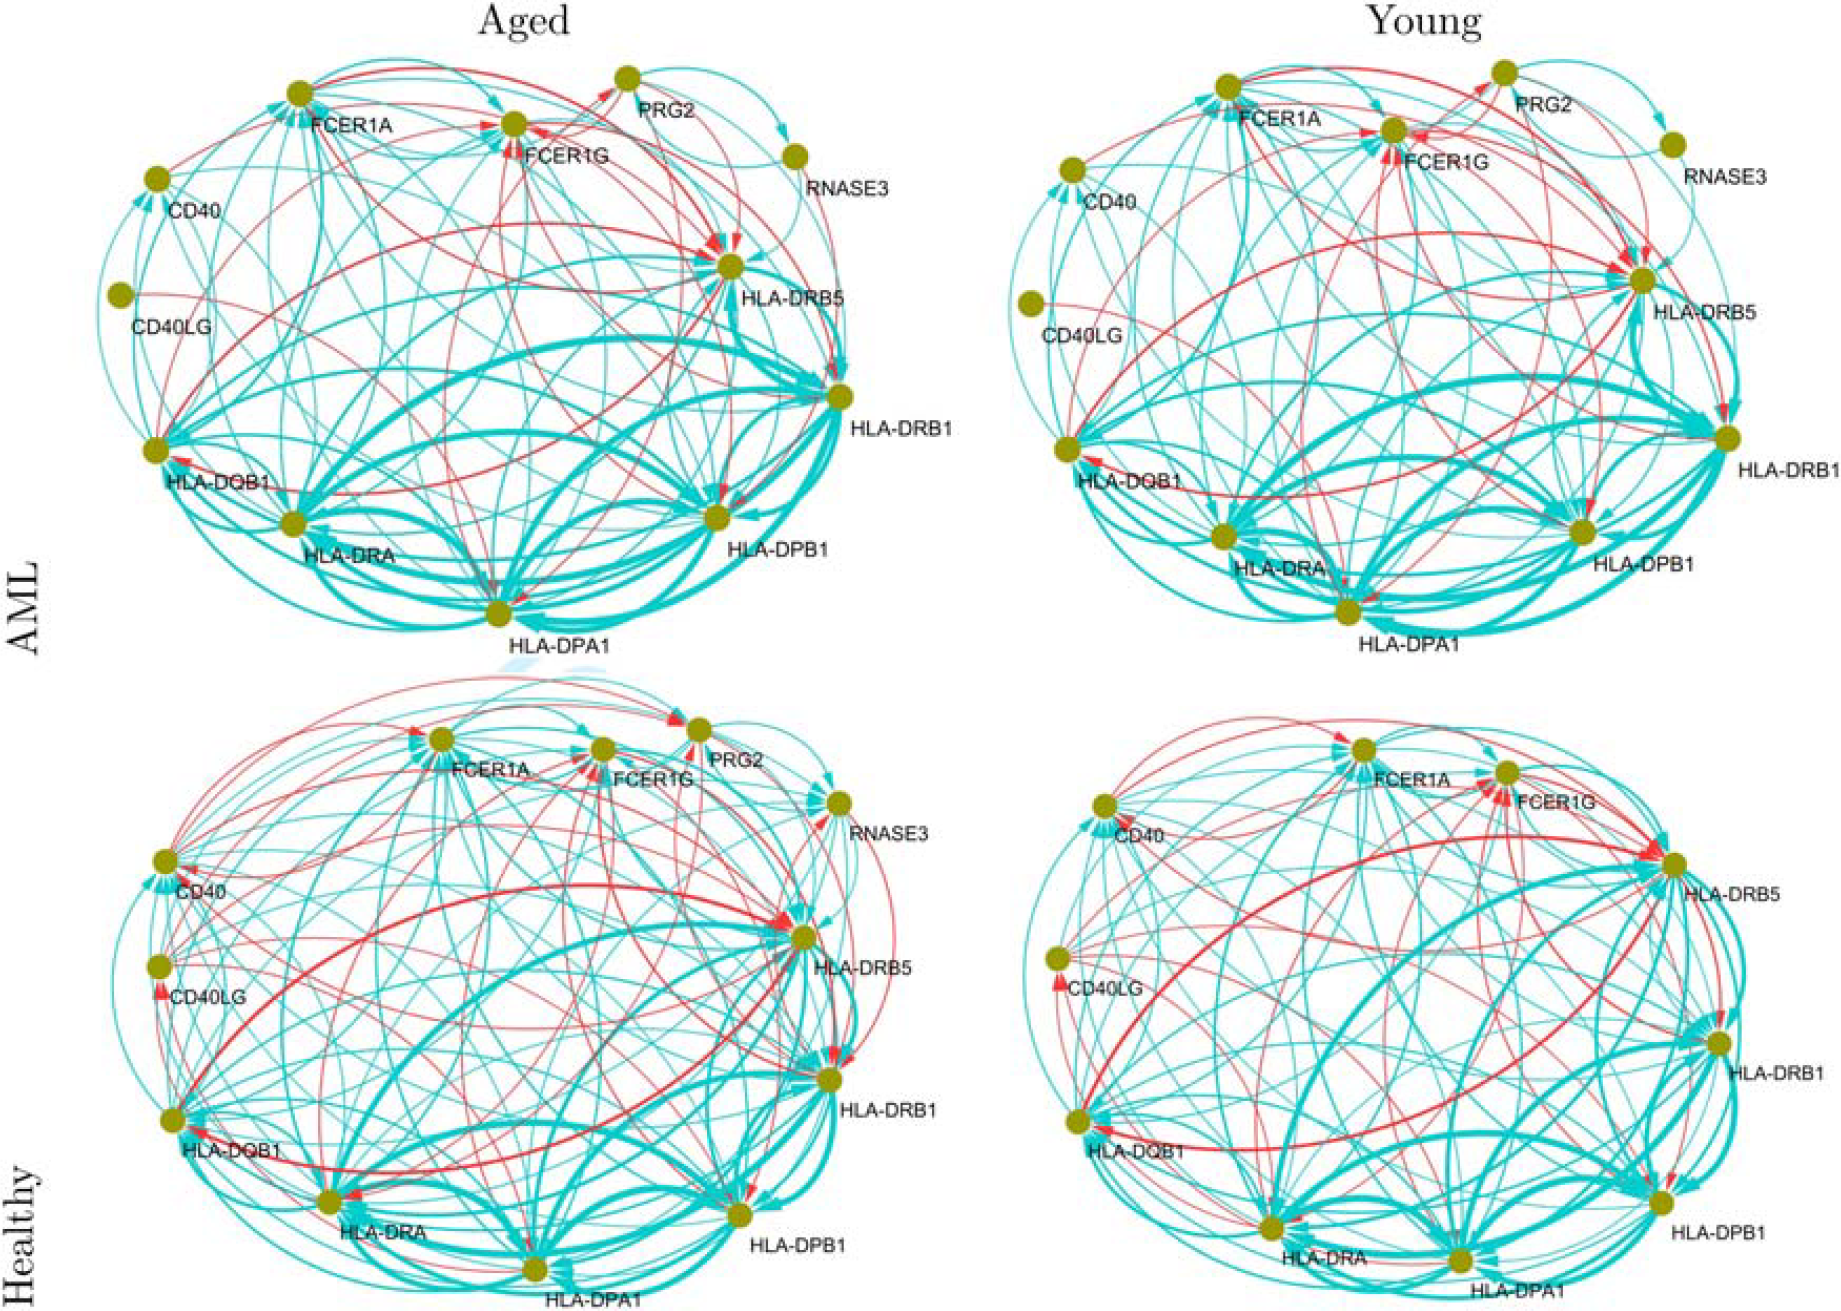
Asthma (hsa05310) pathway-enriched gene networks. Directed arrows (
Our results of the IBD pathway-enriched gene network analysis suggest that controlling the activation of CD40 and CD40LG and mutual activation between HLA-DPB1 and IL4R and between JUN and HLA-DPB1 may provide crucial clinical clues to reveal AML-related mechanisms.
To demonstrate the statistical validity of the observed pathway enrichment results, we performed permutation testing at the network level. For each of the AML-young, AML-aged, healthy-young, and healthy-aged gene networks, permutation networks were generated by randomly selecting edges while preserving the total number of edges in the original network. For each group, 200 permutation networks were constructed. We then applied our strategy to each permutation network across the eight immune disease pathways. Permutation-based p-values were computed for each network–pathway combination, and the average p-values across the 200 permutations were summarized. Notably, none of the immune disease pathways showed significant enrichment in the permutation networks, with the averaged permutation p-values for all four networks across the eight immune disease pathways equal to one. This result indicates that the significant pathway enrichments observed in the original AML gene networks are unlikely to arise from random network structures with matched edge density, providing statistical validation of the pathway enrichment analysis and suggesting that the results reflect disease-relevant network organization.
Our study aimed to uncover enriched functional pathways of gene networks for interpretable gene network analysis. We developed a novel computational methodology for GNEA. In other words, our method measures the enrichment of a gene network based on the overrepresentation of edges in the gene network of interest and the network of genes involved in the functional pathway. In our analysis, similar edge structures between the gene network of interest and the functional network indicated that the gene network of interest was enriched in specific functional pathways. To illustrate the efficiency of the proposed strategy, we performed Monte Carlo simulations based on myeloid neoplasms and pan-cancer-related pathway-enriched gene network analyses. The simulation results indicated that our strategy provides outstanding performance for GNEA.
We applied the proposed method to explore the enriched immune disease pathways in AML-specific gene networks. For the AML-aged and -young and healthy-aged and -young groups, we estimated each gene network and then applied our method to reveal the enriched immune disease pathways of the estimated networks. Our results demonstrate that the AML-aged and -young networks were enriched in the IBD pathway, whereas the healthy-young network was enriched in the asthma pathway. The results of the IBD pathway-enriched gene network analysis revealed the “suppression of the interplay between HLA-DPB1 and IL4R” and “inhibition of the interplay between JUN and HLA-DPB1” as AML-specific molecular interplays. In the asthma pathway-enriched gene network analysis, the disappearance of the interplay between RNASE3 and PRG2 was identified as a specific molecular characteristic of healthy-young individuals. Furthermore, hubness of CD40LG was identified as a health-specific characteristic. Our results, combined with a review of the literature, suggest that activation of CD40 and CD40LG and mutual activation between HLA-DPB1 and IL4R and between JUN and HLA-DPB1 may provide crucial insights into understanding AML-related mechanisms.
In the current study, we described our strategy for gene network estimated by a regression framework with elastic net. However, our strategy can be applied to networks constructed using a wide range of approaches, including correlation-based networks, regression-based gene regulatory networks (e.g., elastic net, lasso), protein–protein interaction-derived networks, or other externally defined prior networks. Importantly, the accuracy of network estimation is a critical issue for downstream enrichment analysis, as uncertainty or instability in inferred network may affect enrichment results. While the proposed framework treats the estimated network as an input object, it can be combined with upstream procedures such as bootstrap-based network estimation or stability selection to improve network reliability and assess robustness across network realizations.
Although our strategy demonstrated consistently effective performance across gene networks of various scales, incorporating degree-preserving randomization as an explicit normalization strategy will be explored to further mitigate potential biases arising from network density and degree heterogeneity, thereby enhancing the robustness of the proposed framework across diverse network structures. Thus, we consider incorporating degree-preserving randomization into our strategy as one of future work of the current study.
A potential limitation of our strategy is that larger networks tend to exhibit a higher number of overlapping edges with pathway-specific networks simply due to their increased size, which may confound the results of GNEA. In the proposed method, this issue is partially alleviated by evaluating enrichment relative to a hypergeometric null model that explicitly conditions on the total number of edges in both the query network and the pathway-specific network. As a result, statistical significance reflects whether the observed overlap exceeds random expectation given the network sizes, rather than being driven by absolute edge counts. Nevertheless, future work may further refine the null model by incorporating matched network size or permutation-based strategies to more explicitly account for variability in network scale across different conditions.
AUTHORS’ CONTRIBUTIONS
H.P. developed the method, performed the analysis, and drafted the article. S.M. supervised the work. All authors have read and approved the final version of the article.
DATA AVAILABILITY STATEMENT
The datasets used in the Application section are from the CELL×GENE database (https://cellxgene.cziscience.com/collections/93eebe82-d8c3-41bc-a906-63b5b5f24a9d). The code and dataset used in our study are available on GitHub (https://github.com/HeewonGitHub/GNEA_JCB).
Footnotes
ACKNOWLEDGMENT
This research used the computational resources of the Supercomputer System, Human Genome Center, Institute of Medical Science, University of Tokyo.
AUTHOR DISCLOSURE STATEMENT
The authors declare they have no conflicting financial interests.
FUNDING INFORMATION
This work was supported by the Sungshin Women’s University Research Grant of 2024 (Grant Recipient: Heewon Park). This research was also supported by AMED under grant numbers 23tk0124003h0001, 24tk0124003h0002, and 25tk0124003h0003, and JSPS KAKENHI grant number JP24H00009.