
Abstract
A fundamental assumption in phylogenetics and phylogenomics is that a single, global evolutionary model can adequately characterize the substitution processes operating across all sites in a molecular sequence alignment. However, this assumption is frequently violated in practice due to heterogeneity in evolutionary processes, leading to local model mis-specification and potential bias in downstream inference. While a variety of statistical and machine learning-based approaches have been developed to address this issue, these methods often rely on restrictive model assumptions or are designed for narrowly scoped applications, limiting their generalizability across diverse datasets and evolutionary contexts. Here, we present REVEAL (“REsampling and Visual EvALuation”), a general-purpose statistical framework for detecting and localizing model mis-specification in biomolecular sequence data. REVEAL operates without introducing additional assumptions beyond those inherent to standard global model-based analyses. It employs sequence-aware statistical resampling to construct a local support matrix along the sequence alignment, facilitating the identification of site-level model violations. Through extensive simulation experiments, we demonstrate that REVEAL achieves robust control of both type I and type II errors, with precision of
Keywords
INTRODUCTION
Statistical phylogenetic methods typically rely on parametric evolutionary models to reconstruct and analyze evolutionary histories. These models are designed to account for the complex evolutionary processes that shape genetic data over time. For instance, maximum likelihood estimation methods require a model of sequence evolution to describe changes in biomolecular sequences over time. However, a given parametric model can fail to adequately describe underlying evolutionary processes and bias statistical estimation—an outcome referred to as a model violation. Model violations generally fall into two categories: “global” and “local” model violations.
Global model violations occur when the evolutionary model fails to adequately represent evolutionary processes that apply to all sites in the locus or loci under study. For example, substitution model violations can occur in traditional phylogenetic analyses, and computational methods have been proposed to detect and address these model violations (Shepherd and Klaere, 2019; Burgstaller-Muehlbacher et al., 2023).
Local model violations occur when a given evolutionary model may be suitable for some sites and/or regions in a biomolecular sequence dataset but not for other sites/regions. Complex evolutionary processes such as recombination, region-specific selection pressures, incomplete lineage sorting (ILS), and horizontal gene transfer can lead to deviations from the global modeling assumption that all sites under study evolved in an independent and identically distributed (i.i.d.) manner (Felsenstein, 1985). Local model violations can manifest as various types of heterogeneity within sequences, including evolutionary rate heterogeneity across sites and lineages (Jayaswal et al., 2014), base frequency heterogeneity, and local topological heterogeneity across sites. Many studies have utilized parametric model-based methods to examine biomolecular sequence patterns associated with specific evolutionary processes. For example, local genealogical variation due to genetic drift and ILS (Dutheil et al., 2009), recombination and recombination hotspots (Hobolth et al., 2007), and the complex interplay between substitution, recombination, and gene conversion (Gao and Liu, 2021) have been investigated in genetic and genomic sequence data. In parallel, machine learning-based methods have emerged as powerful alternatives to explicitly parametric models. For example, supervised machine learning and deep neural networks have been used to identify genomic regions that evolved via introgression (Ray et al., 2024), map recombination breakpoints and recombination hotspots (Adrion et al., 2020; Li et al., 2022), and detect genomic signatures of selective sweeps (Zhao et al., 2023). While parametric model-based and machine learning-based methods can be effective in certain contexts, they are typically designed for specific evolutionary processes that require a priori modeling assumptions, are specialized to particular biomolecular sequence analysis tasks, and often require labeled training data, which may not always be available or accurately annotated.
In this study, we aim to detect local model violations without making any assumptions about sequence evolution (beyond those made in a global model-based analysis) or imposing restrictions on the types of local model violations. The problem formulation under study and our algorithmic solution for the problem point to an automated, data-driven alternative to the traditional approach of formulating a priori modeling assumptions for specific biomolecular sequence analysis tasks and then performing iterative model refinement.
METHODS
A primary contribution of this study is a new general-purpose statistical method for detecting and mapping local model mis-specification during biomolecular sequence analysis. A key requirement is that the new method requires no additional modeling assumptions beyond those used for global data analysis (i.e., the traditional simplifying assumption that a single “global” statistical model adequately captures the underlying processes that generated all parts of the input dataset). Stated another way, the new method does not utilize any additional parametric models for subsets of the dataset or the entire dataset (beyond the single model used for global inference and learning over the entire dataset).
We now define the computational problem under study. The input consists of a multiple sequence alignment (MSA) A with N aligned sequences and K sites, a global model
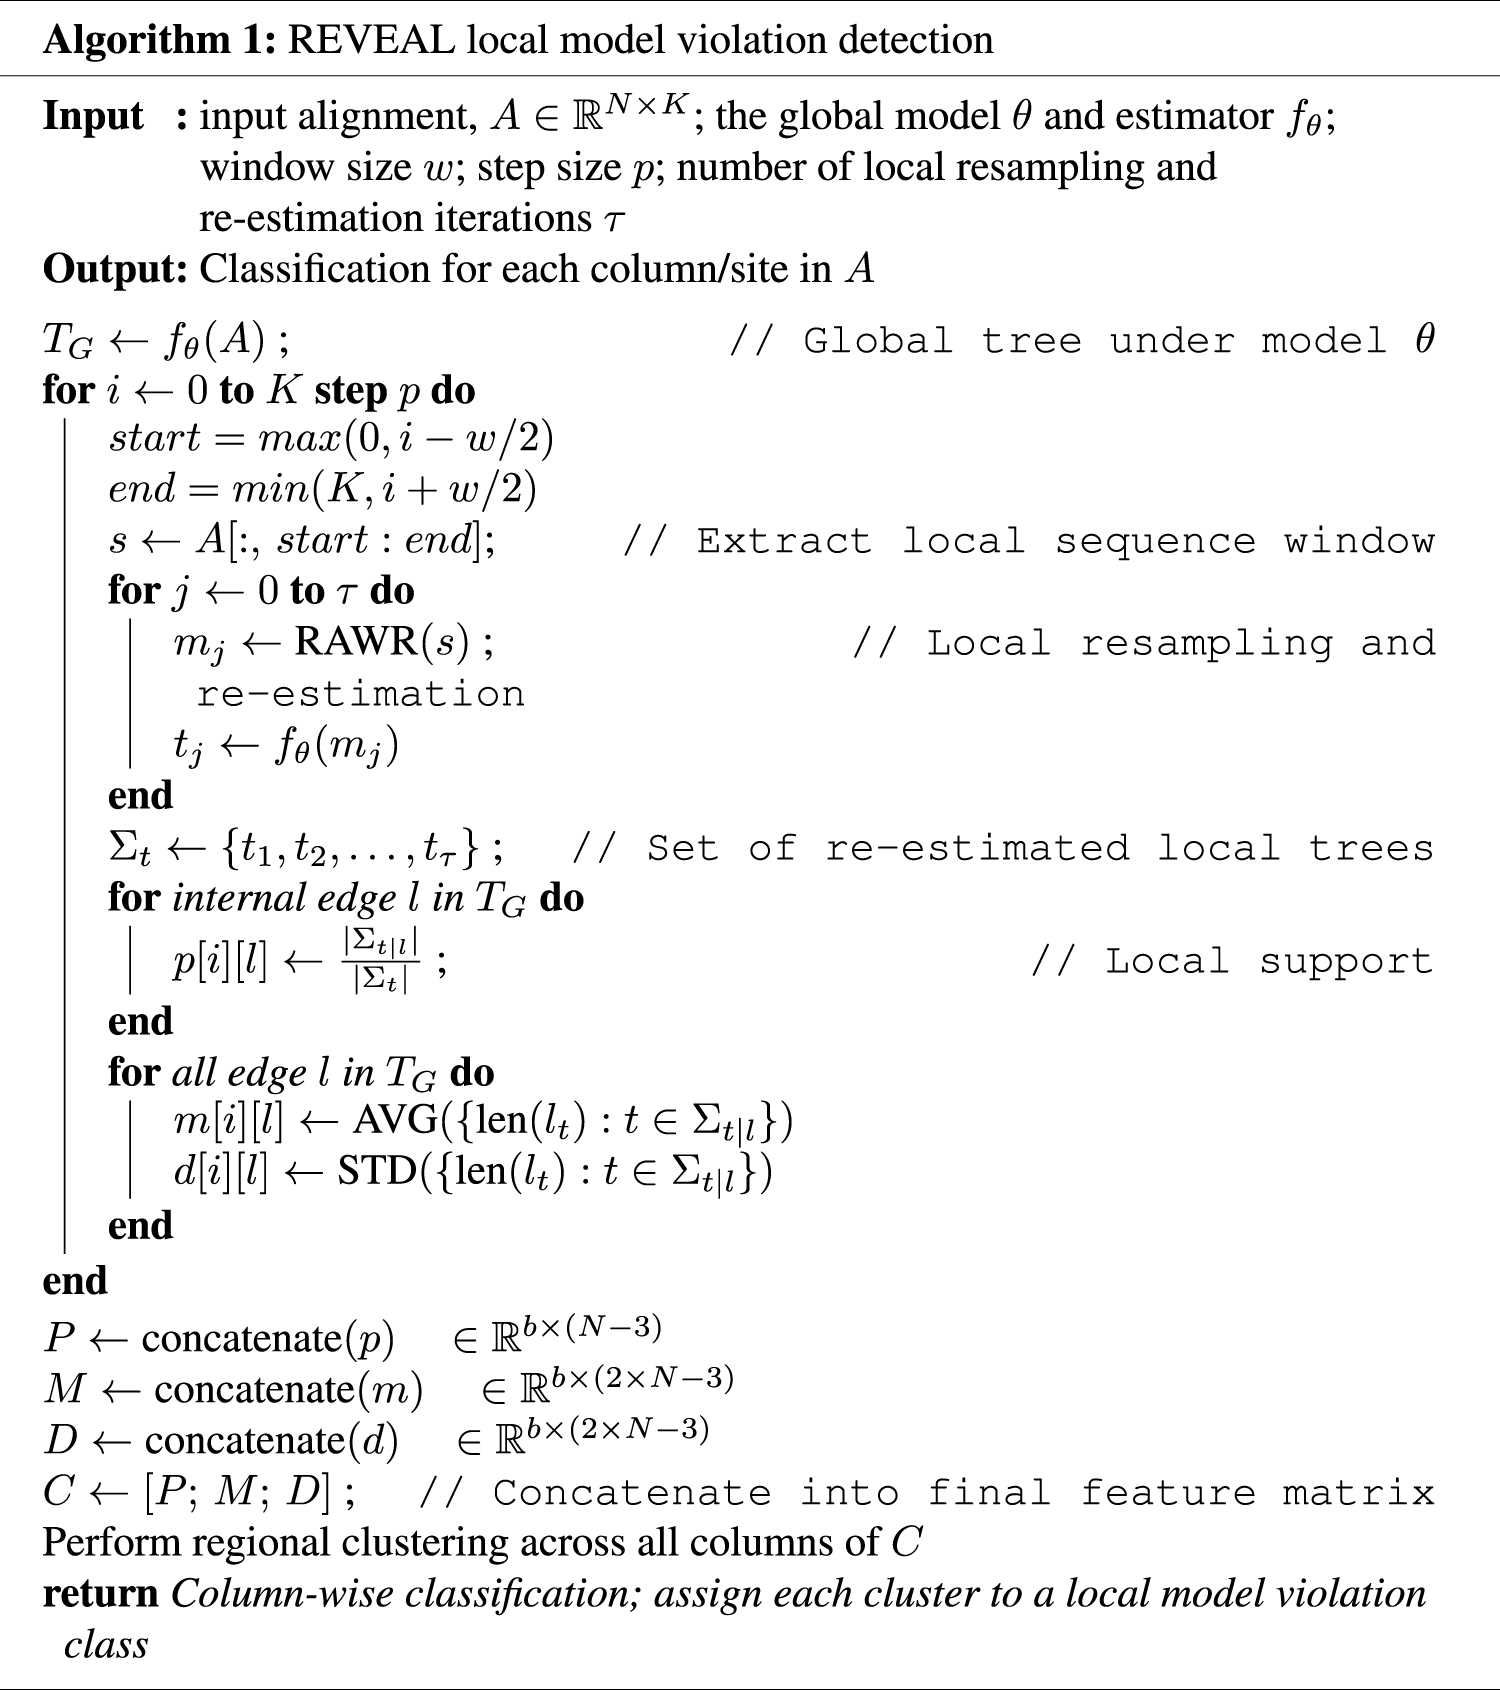
To address this problem, we introduce REVEAL—a “REsampling and Visual EvALuation” framework to detect and map local model violations during biomolecular sequence analysis. REVEAL consists of a three-stage computational pipeline. A schematic overview of the workflow is shown in Figure 1, and the corresponding pseudocode for local model violation detection is provided in Algorithm 1. The pseudocode for RAWR-based local resampling is provided in Algorithm 2 in the Supplementary Data. In stage one, local resampling is performed on the input MSA A to generate a set of local replicates. Each local replicate is then re-estimated using the model-based method
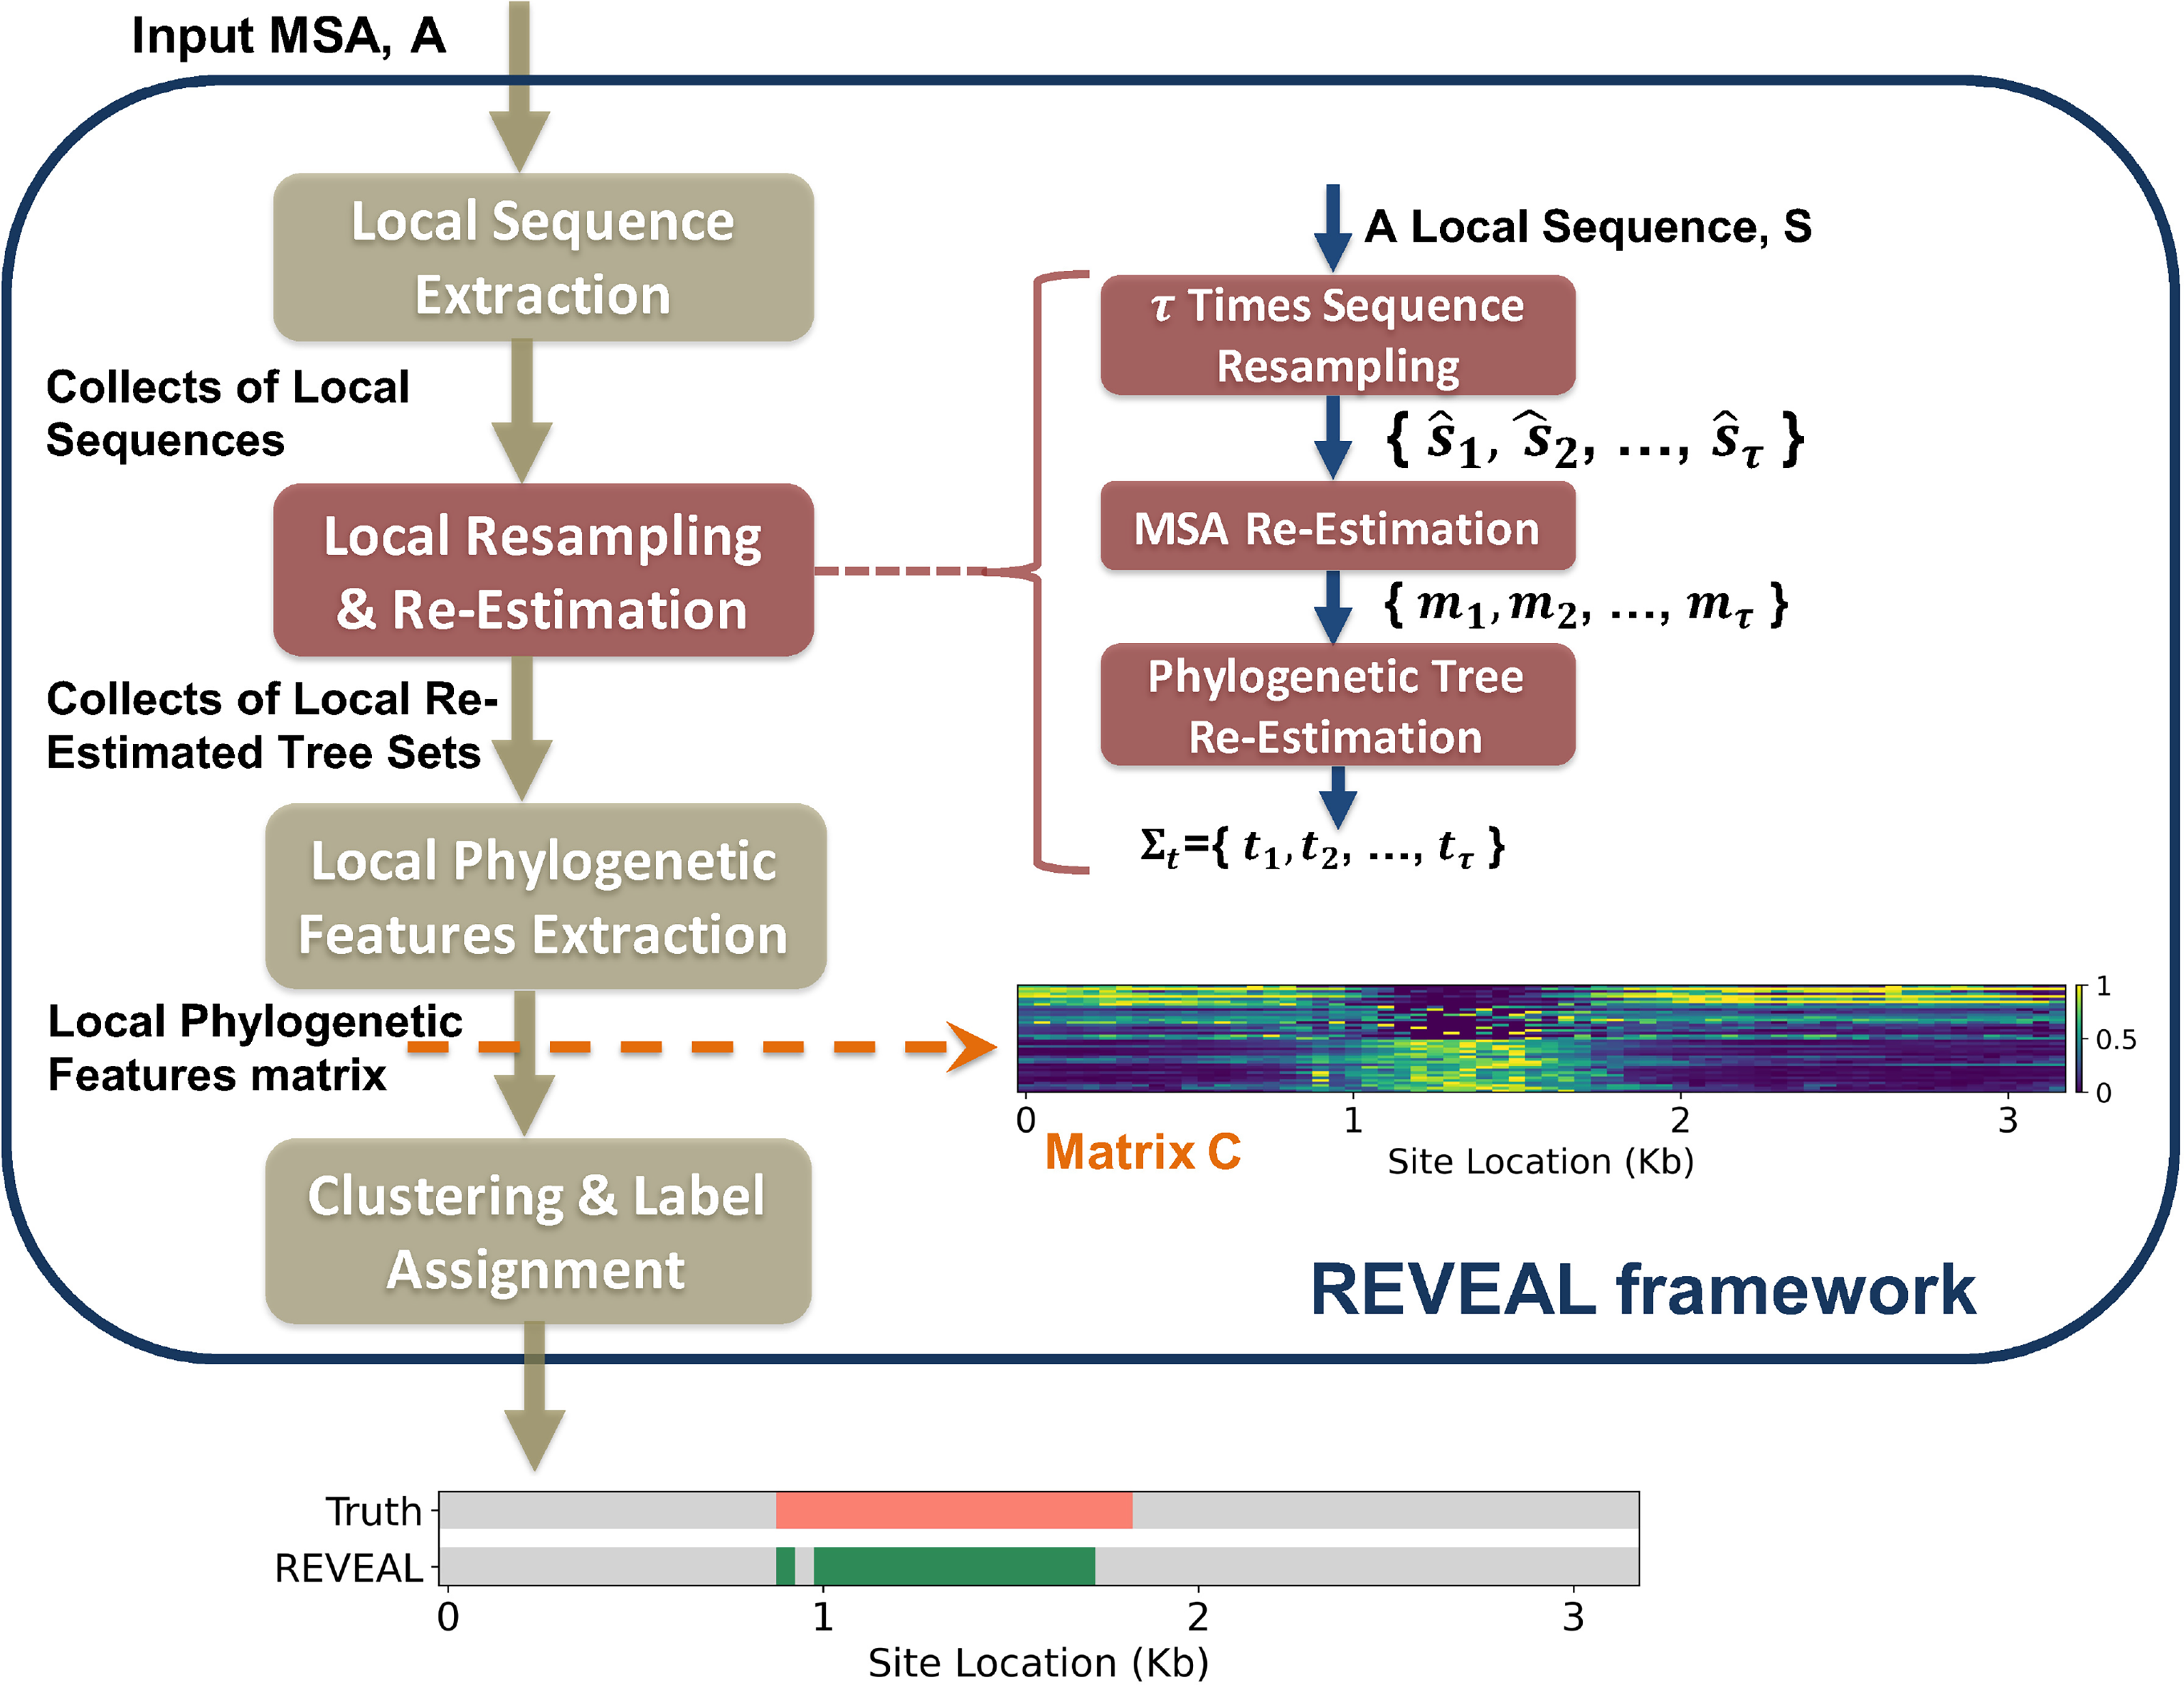
Illustrated overview of REVEAL, a “REsampling and Visual EvALuation” framework for global-model-agnostic and local-model-free mapping of local model violations during biomolecular sequence analysis. REVEAL consists of a computational pipeline with three stages.
REVEAL stage 1: local resampling and re-estimation
The inputs to REVEAL consist of a MSA A, where each of the N rows represents an aligned sequence corresponding to a specific taxon, and each of the K columns represents a site, as well as the global model
A sliding-window approach is used to perform local resampling and re-estimation. We define a local window
Local resampling and re-estimation consist of performing
The non-parametric sequence resampling method used in this study is RAWR (Wang et al., 2021). RAWR is a sequence-aware statistical resampling technique that avoids the simplifying assumption of i.i.d. input data—unlike standard bootstrap resampling and other widely used non-parametric resampling techniques. Here, we briefly recap the RAWR resampling procedure [cf. Algorithm 1 in Wang et al. (2021)], and detailed pseudocode is provided in Algorithm 2 in the Supplementary Appendix. RAWR resampling takes the form of a random walk conducted on the input MSA A, resulting in a resampled RAWR replicate: (1) to begin, a starting site and walk direction are chosen uniformly at random, (2) sites are resampled as the walk proceeds along the initial walk direction, with walk reversals occurring with certainty at the first and last site of A and with probability
REVEAL stage 2: calculating local support values and their 2-D image matrix representation
The second stage of REVEAL calculates local support values to assess repeatability of local tree re-estimation. The local support values quantify phylogenetic agreement/disagreement between the local phylogenetic trees and the global phylogenetic tree
REVEAL utilizes three different classes of local support values. The first class is the topological branch support
The local support values are calculated within each window as part of REVEAL’s sliding-window analysis. Let
REVEAL stage 3: mapping higher-level regions with local model variation in the lower-level 2-D support value matrix
The final step of the REVEAL framework applies clustering analysis to the 2-D image representation of the concatenated local support value matrix C. As a preprocessing step before clustering, values in the matrix C are normalized to the unit interval.
The goal is to classify each site in the input MSA, where each class corresponds to one of z different site models. In our study, we focus on
Simulation study
Simulation conditions
To evaluate the performance of the REVEAL framework, we consider a variety of evolutionary processes that can cause local model violations during biomolecular sequence analysis and utilize model-based simulations for performance benchmarking purposes. In our simulations, sequences evolve under a mixture model consisting of a background model
The first type of variable region model builds upon the traditional MSC model but exhibits greater evolutionary divergence than the background model. We denote this variable-divergence variable region model as
The second type of variable region model is the multi-species coalescent with recombination (MSCwR) model, which extends the traditional multi-species coalescent (MSC) model by incorporating recombination events, and we denote this model as model
The third type of variable region model follows the multispecies network coalescent with recombination (MNSCwR) model, which incorporates both recombination and reticulation events. The reticulations capture non-tree-like evolutionary processes such as introgression, hybridization, and horizontal gene transfer. These processes often create discordant patterns from the background evolutionary model, resulting in local model violations. We denote this variable region model as model
The last type of variable region model is the natural selection model, denoted as model
In this study, we construct the mixture model comprising one background model and either one or two variable region models. When a single variable region model is included, we examine four distinct types, each under a separate simulation model condition named after the corresponding variable region model: model conditions H, R, I, and S correspond to mixture models where the single variable region model consists of
Simulation procedures
Loci and sites evolving in the background region are simulated under the MSC model. First, random birth-death model trees with a tree height of 1.0 coalescent units and
To simulate local coalescent histories and gene trees under the variable region model
To simulate local coalescent histories and gene trees under the variable region model
For the variable region model
The variable region model
For the background model
Sequence regions evolving under variable region models are denoted V, and those evolving under the background model are denoted as B. In our simulation procedure, regions V are randomly positioned within simulated sequences. For mixture models with a single variable region model, the total root sequence length L is set to 2000; for those with two variable region models, L is set to 4000. For all simulation conditions other than H.3, the root sequence length of a variable region V, denoted by
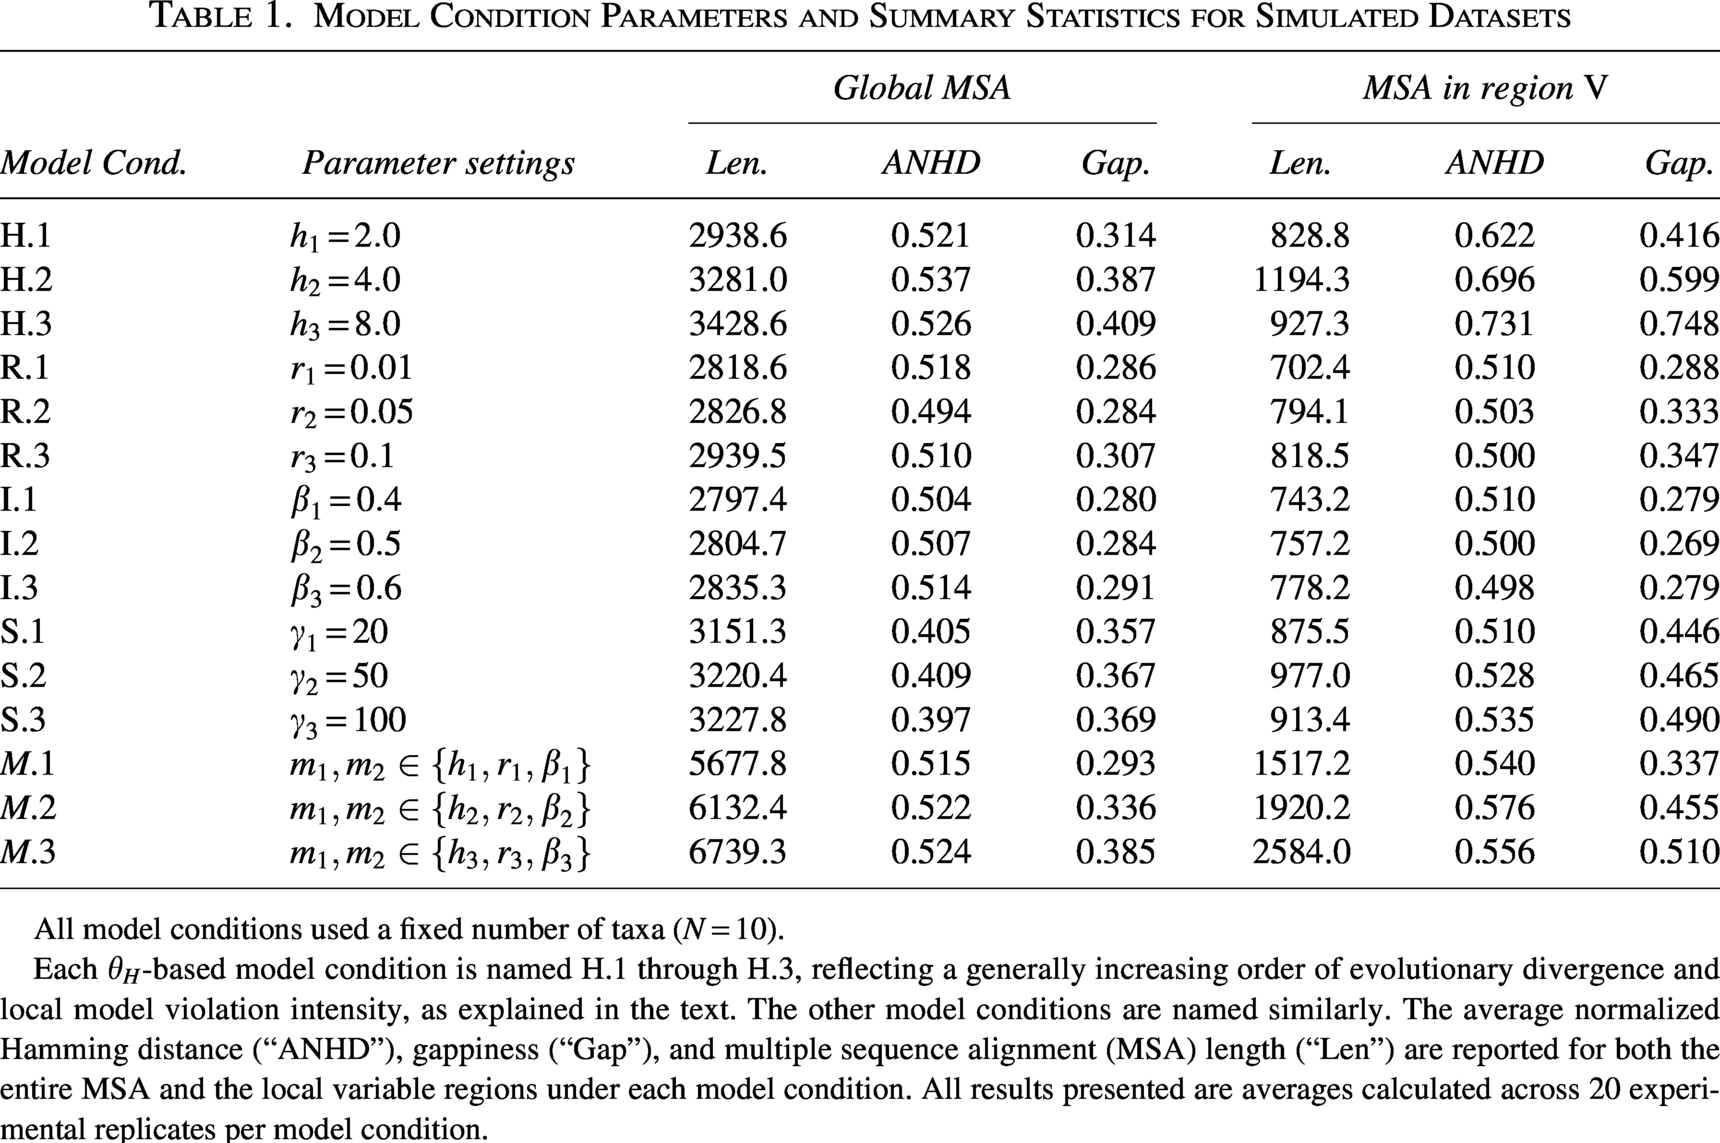
For each model condition, the simulation and experimental procedures are repeated to obtain 20 independent replicates. Model condition parameters and summary statistics for the simulated datasets are presented in Table 1. Model parameters for the background model
Model Condition Parameters and Summary Statistics for Simulated Datasets
Model Condition Parameters and Summary Statistics for Simulated Datasets
All model conditions used a fixed number of taxa (
Each
To further evaluate the robustness of the REVEAL framework, we also investigated the impact of additional experimental factors: (i) root sequence length L, (ii) the number of taxa N, and (iii) the gap–length distribution of the sequence insertion/deletion model. All three are known to play a role in the statistical and computational difficulty of phylogenetic reconstruction and analysis (Liu et al., 2012; Warnow, 2012; Mirarab et al., 2014). In each experimental setup, all other parameters were set to their default values, allowing us to isolate the effects of individual variables and assess the specific impact of the variable of interest on detection performance. Table 2 presents summary statistics for the simulated datasets with increased numbers of taxa (
Summary Statistics for Additional Simulations with Varying Numbers of Taxa
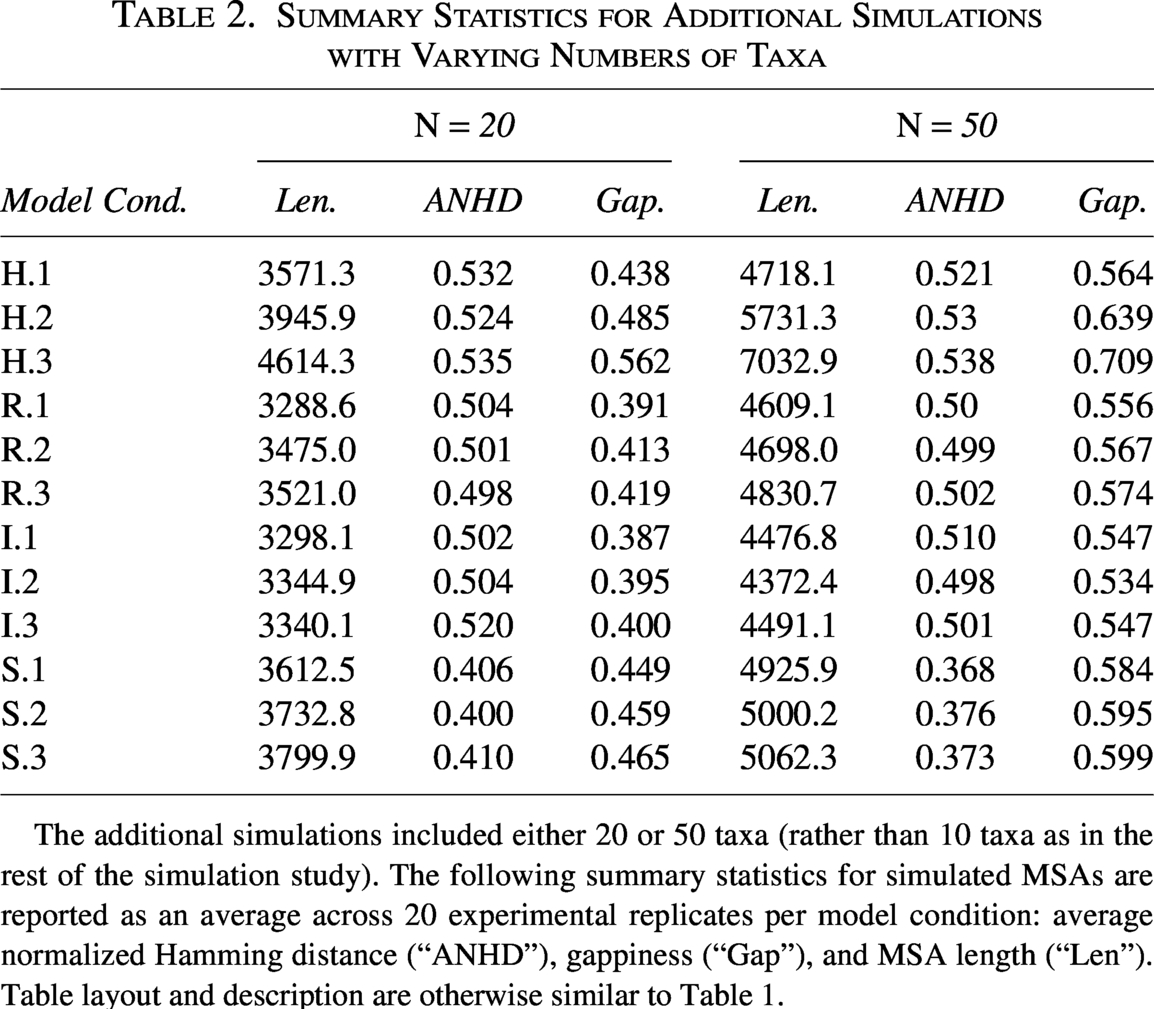
The additional simulations included either 20 or 50 taxa (rather than 10 taxa as in the rest of the simulation study). The following summary statistics for simulated MSAs are reported as an average across 20 experimental replicates per model condition: average normalized Hamming distance (“ANHD”), gappiness (“Gap”), and MSA length (“Len”). Table layout and description are otherwise similar to Table 1.
REVEAL’s performance was assessed in terms of both type I and type II errors using precision and recall. To construct the confusion matrix for calculating precision and recall, we compared REVEAL’s site class prediction against the ground truth. The confusion matrix consists of four elements. True positives (TP) consist of sites within true variable regions V that are correctly identified. False positives (FP) consist of sites within true background regions B that are incorrectly classified as part of V. True negatives (TN) consist of sites within true background regions B that are correctly identified. False negatives (FN) consist of sites within the true variable regions V that are mistakenly classified as part of B. Precision is then calculated as
Computational runtime and peak memory usage were also reported for REVEAL. All experiments were conducted on the MSU Institute for Cyber-Enabled Research High-Performance Computing Center (HPCC). We utilized HPCC computing nodes equipped with Intel Xeon Gold 6148 CPUs running at 2.40 GHz and featuring between 5 and 10 GiB of memory.
Empirical study
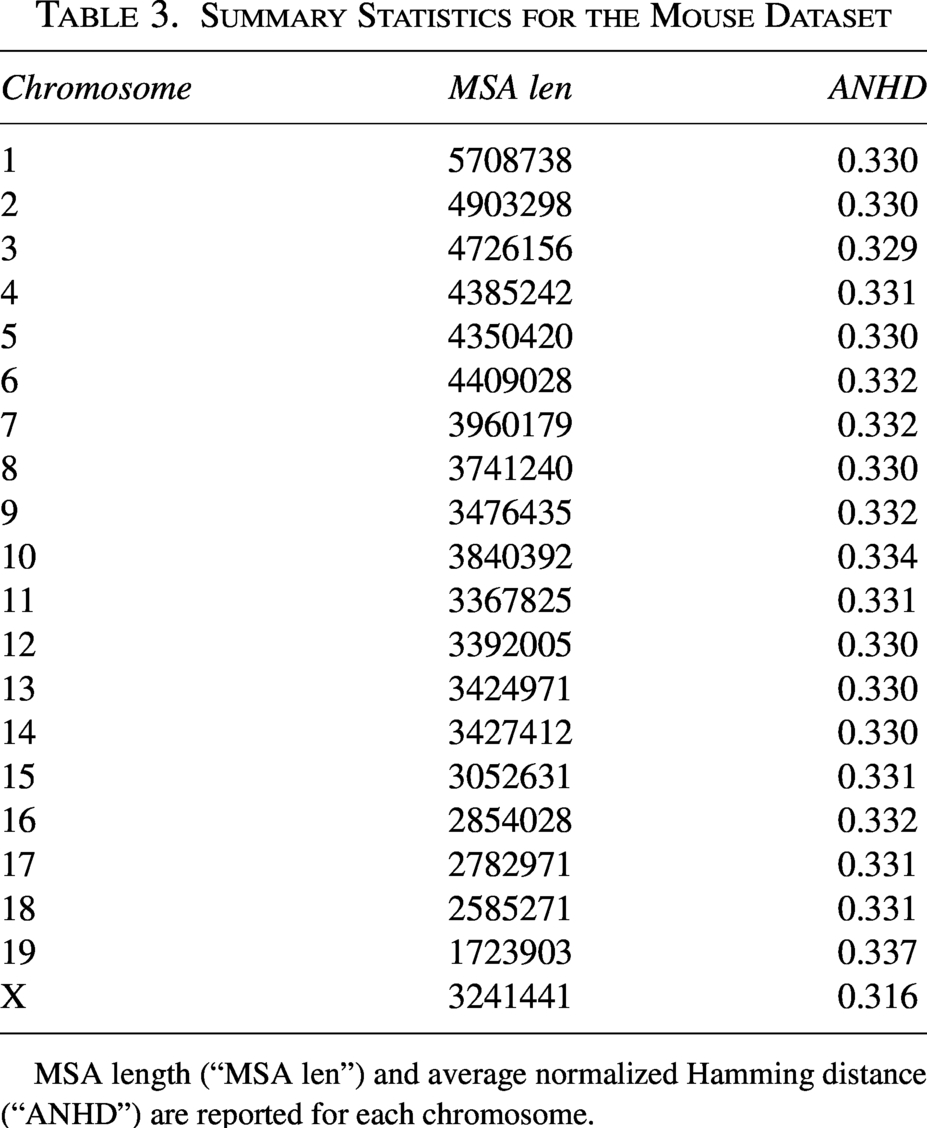
We also performed REVEAL analyses of two empirical datasets. The first dataset consists of genomic sequence data for wild-derived strains of house mouse (Mus musculus) and M. spretus. The clade is an emerging model of adaptive interspecific introgression (Liu et al., 2015), and genomic maps of adaptive introgression have been reported in past studies (Liu et al., 2015). We downloaded whole genome sequences and genome-wide SNP data for classical and wild-derived mouse strains from the Mouse Genomes Project, where the house mouse genome version GRCm39 served as the reference genome. We used bcftools to filter out non-biallelic variants and retain only those with a missing genotype call rate of less than
Summary Statistics for the Mouse Dataset
Summary Statistics for the Mouse Dataset
MSA length (“MSA len”) and average normalized Hamming distance (“ANHD”) are reported for each chromosome.
The second dataset is derived from Fontaine et al. (2015)’s study of adaptive introgression in mosquitoes. The dataset consists of a whole genome sequence (WGS) alignment from Fontaine et al. (2015). Six members of the Anopheles gambiae species complex (AGC) are sequenced at high depth: Anopheles gambiae, A. coluzzii, A. arabiensis, A. quadriannulatus, A. merus and A. melas, as well as a reference genome for A. gambiae PEST. The WGS alignment was further filtered to remove columns with missing data, gaps, and fixed sites. Summary statistics for the resulting genomic SNP alignments are presented in Table 4.
Summary Statistics for the Mosquito Dataset
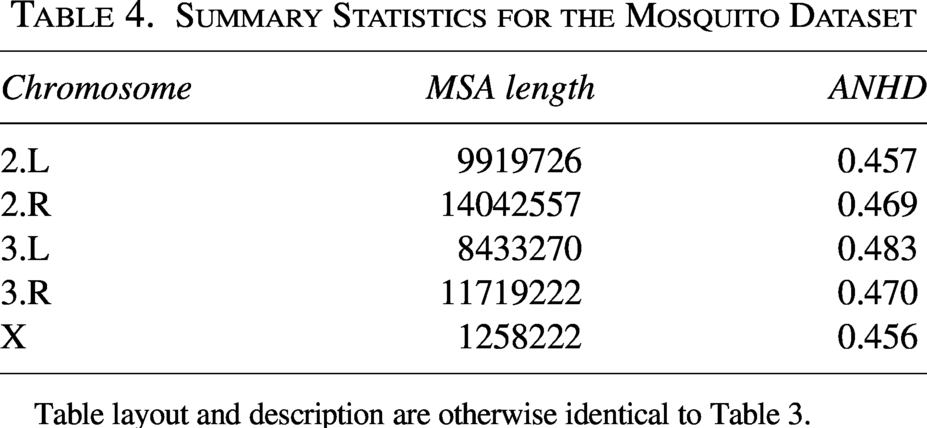
Table layout and description are otherwise identical to Table 3.
Simulation study
REVEAL’s performance on simulation conditions with different types of local model violations
Figure 2 shows precision and recall of REVEAL’s site-level classification across all model conditions with a single variable region model, using default settings for REVEAL’s method parameters. Each model condition includes a local region that evolved under an evolutionary process that is un-modeled during estimation/re-estimation (i.e., a local model mis-specification): either variable gene tree height (or elevated local mutation rate, equivalently), genetic recombination, non-tree-like evolution in the form of introgression, or natural selection. REVEAL’s overall performance is high across the model conditions, with some minor variability. These results highlight the robustness and effectiveness of the framework under various evolutionary processes that can cause local model violations. Precision consistently ranges between 0.9 and 1.0, with recall maintaining values above 0.9. Across all model conditions, neither precision nor recall exhibits a strong or consistent monotonic trend as each variable region’s model parameter value increases. Both remain relatively stable, with only mild parameter-dependent fluctuations. In particular, under model conditions H and S, we observe small changes in precision and recall as parameters h and
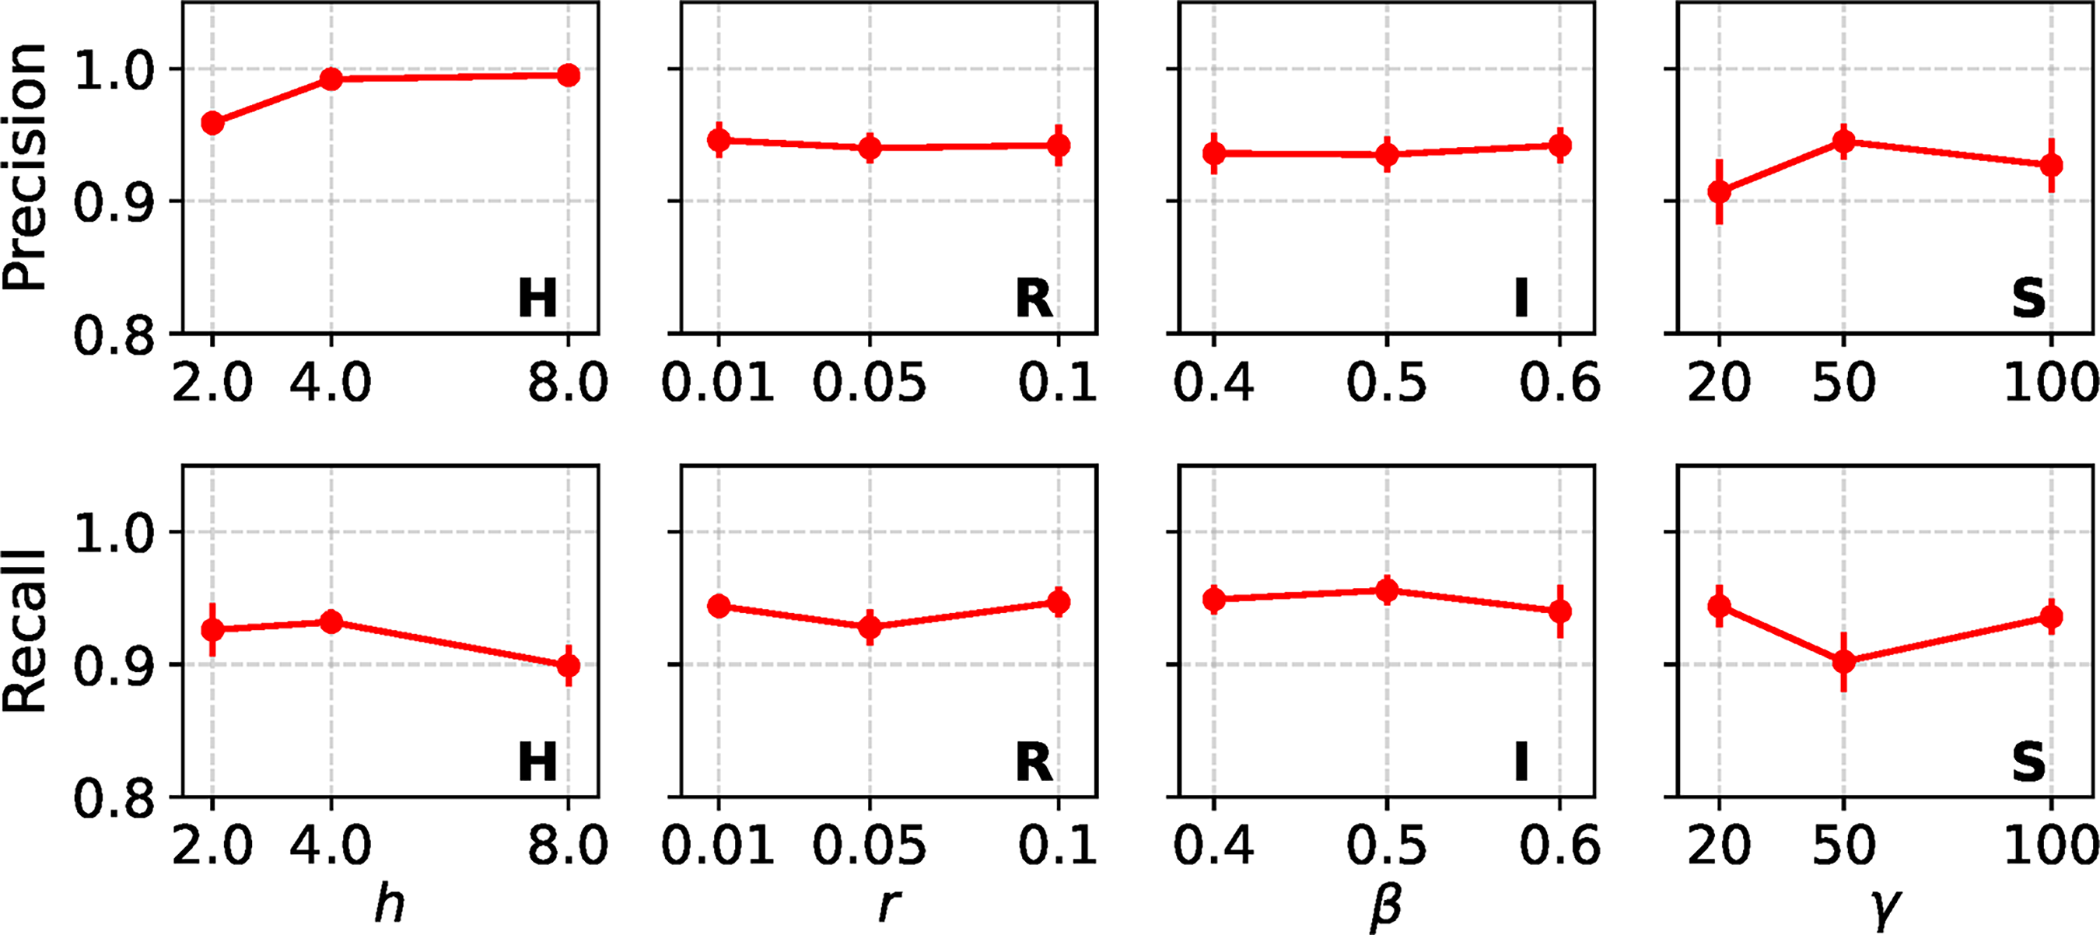
Estimation performance of REVEAL across model conditions with a single variable region model. REVEAL was run with default settings for its method parameters. Mean and standard error of precision and recall for REVEAL estimation are shown for each model condition across 20 experimental replicates per model condition.
We also present precision and recall results of the REVEAL framework for model conditions with two-variable region models in Figure 3. Precision remains consistently high across all model conditions—exceeding 0.9 —and shows a slight increase with greater evolutionary divergence within the variable region models. While recall drops below 0.8 for model condition M.1, it improves as evolutionary divergence increases, reaching values above 0.85 for model conditions M.2 and M.3. This trend highlights REVEAL’s ability to recover detection performance as sequence variability grows. Despite the added complexity of detecting and mapping two variable region models, REVEAL continues to demonstrate reliable detection performance, maintaining high precision and recall.
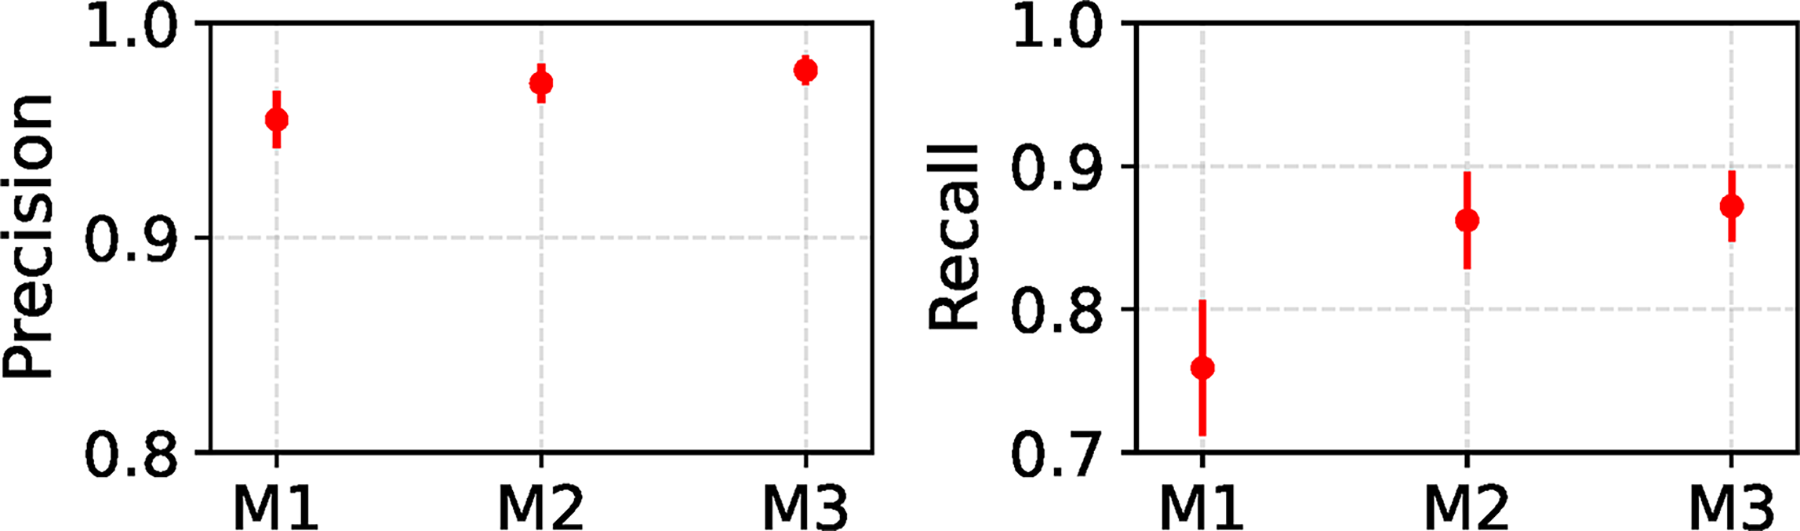
Type I and type II error of REVEAL on model conditions with two-variable region models. REVEAL was run using default settings for its method parameters. Mean and standard error of REVEAL’s precision and recall are reported across 20 experimental replicates for each model condition. Whereas each simulation experiment with a single variable region in Figure 2 varies a single experimental factor (i.e., a simulation model parameter) and explores its impact on REVEAL’s performance ceteris paribus, the two variable region simulations are inherently heterogeneous and preclude a similar comparison. This difference is emphasized by presenting results for the M1/M2/M3 model conditions along the horizontal axis in a discrete manner without any line connections.
In Figure 4, we compare the estimation performance of REVEAL across different values of
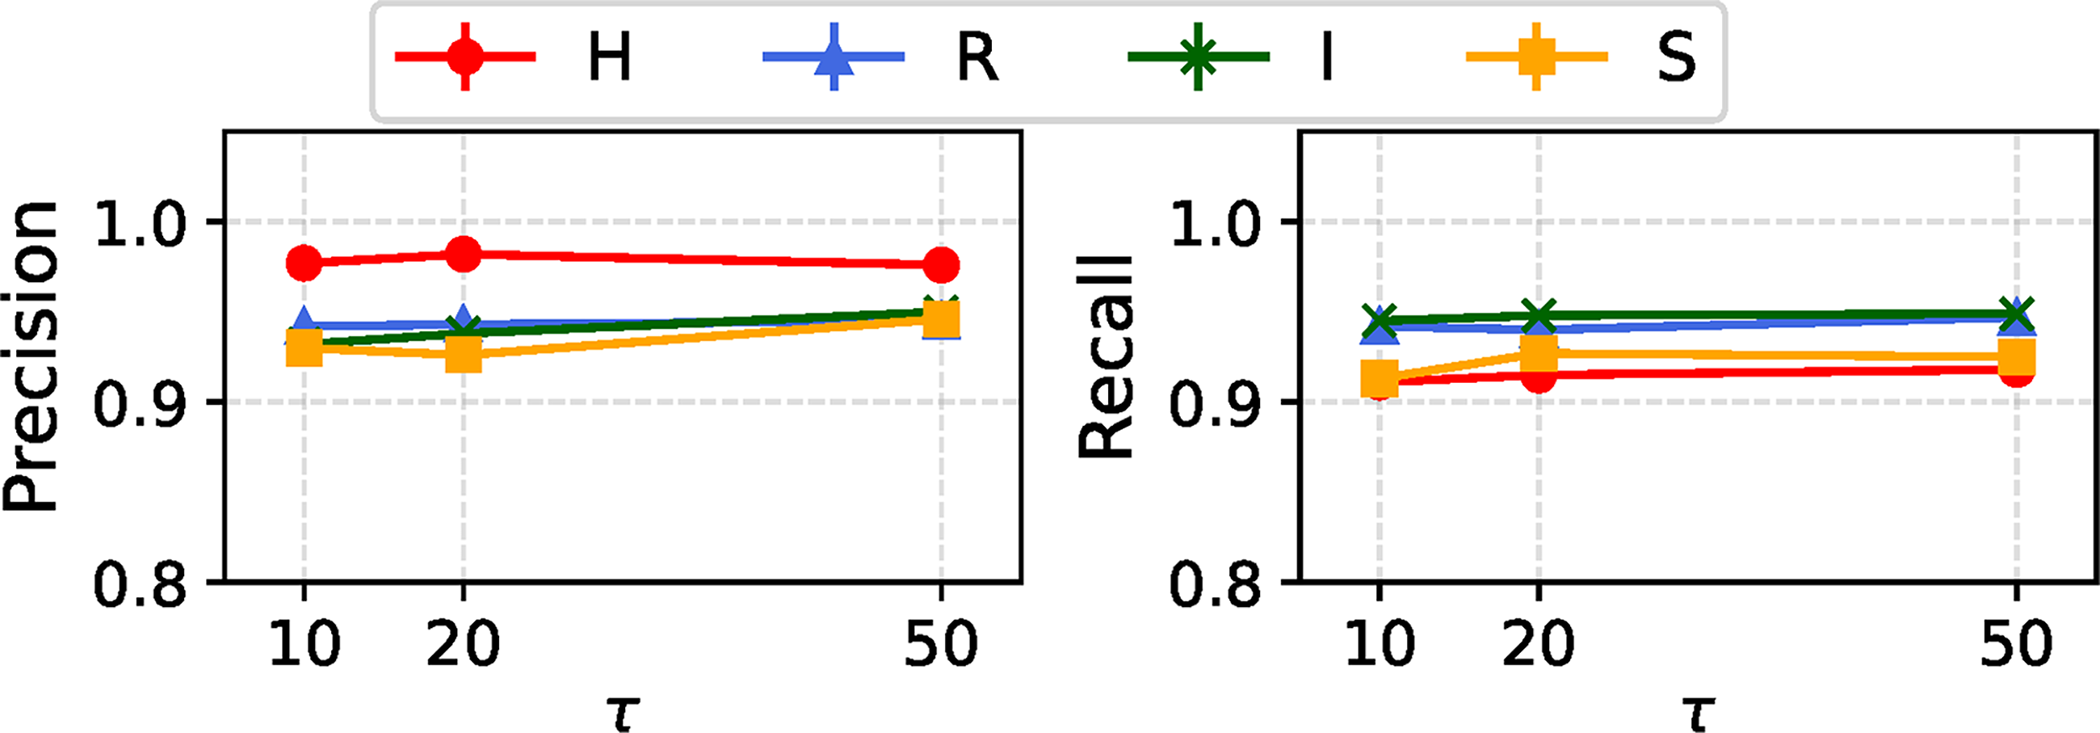
Estimation performance of the REVEAL across model condition types with a single variable region, under varying values of
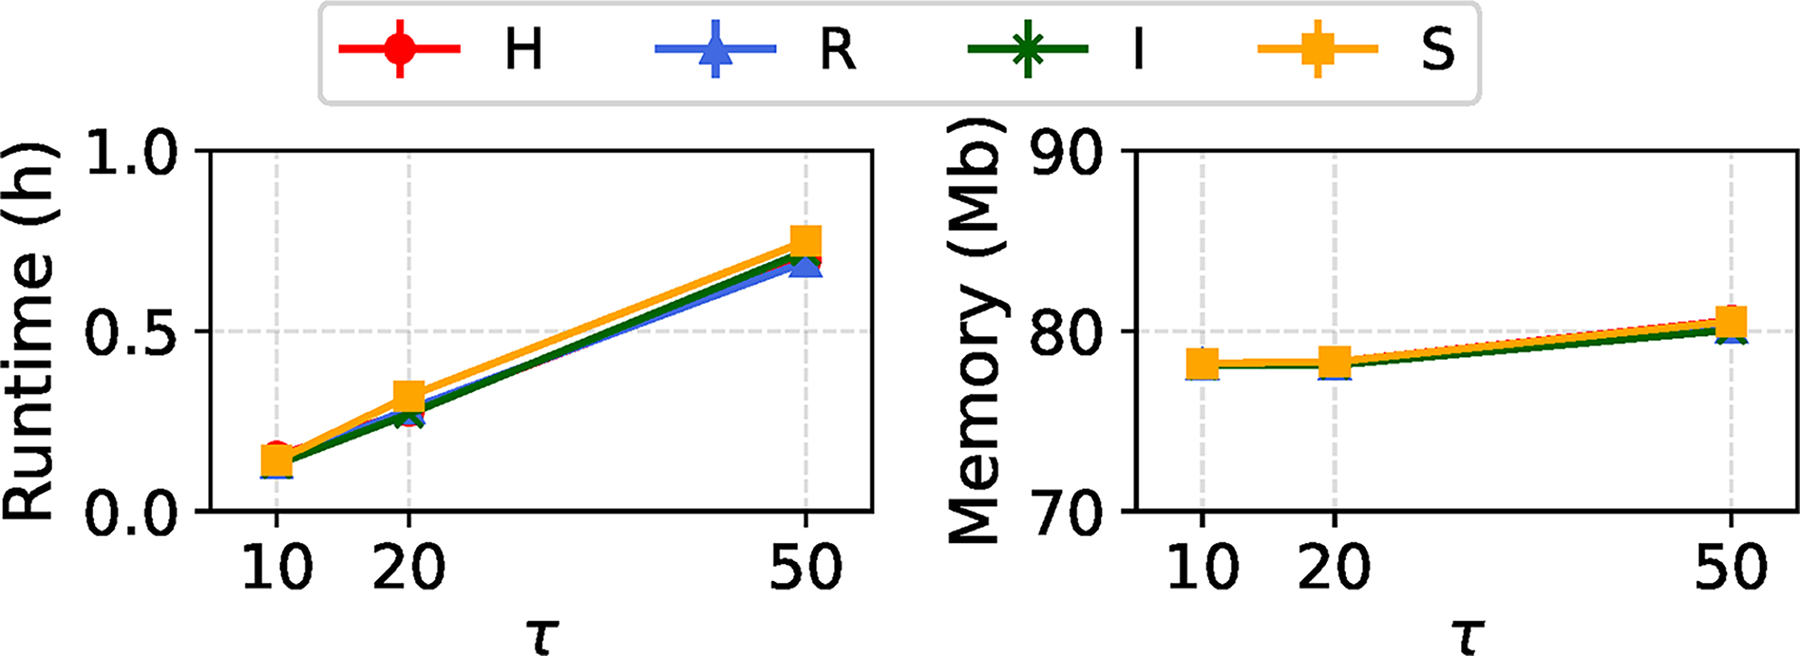
Runtime and memory usage of REVEAL across model conditions with a single variable region model, under varying value of
In the Supplementary Data, we also investigate how the performance of the REVEAL framework is influenced by two additional parameters: the step size p and the window length w. We further performed ablation experiments to assess the influence of an alternative option for the local support value matrix on the performance of the REVEAL framework.
REVEAL’s precision and recall are shown on simulation conditions with root sequence lengths of 2000 and 4000 in Figure 6. In the latter case, the mean length of the local variable region
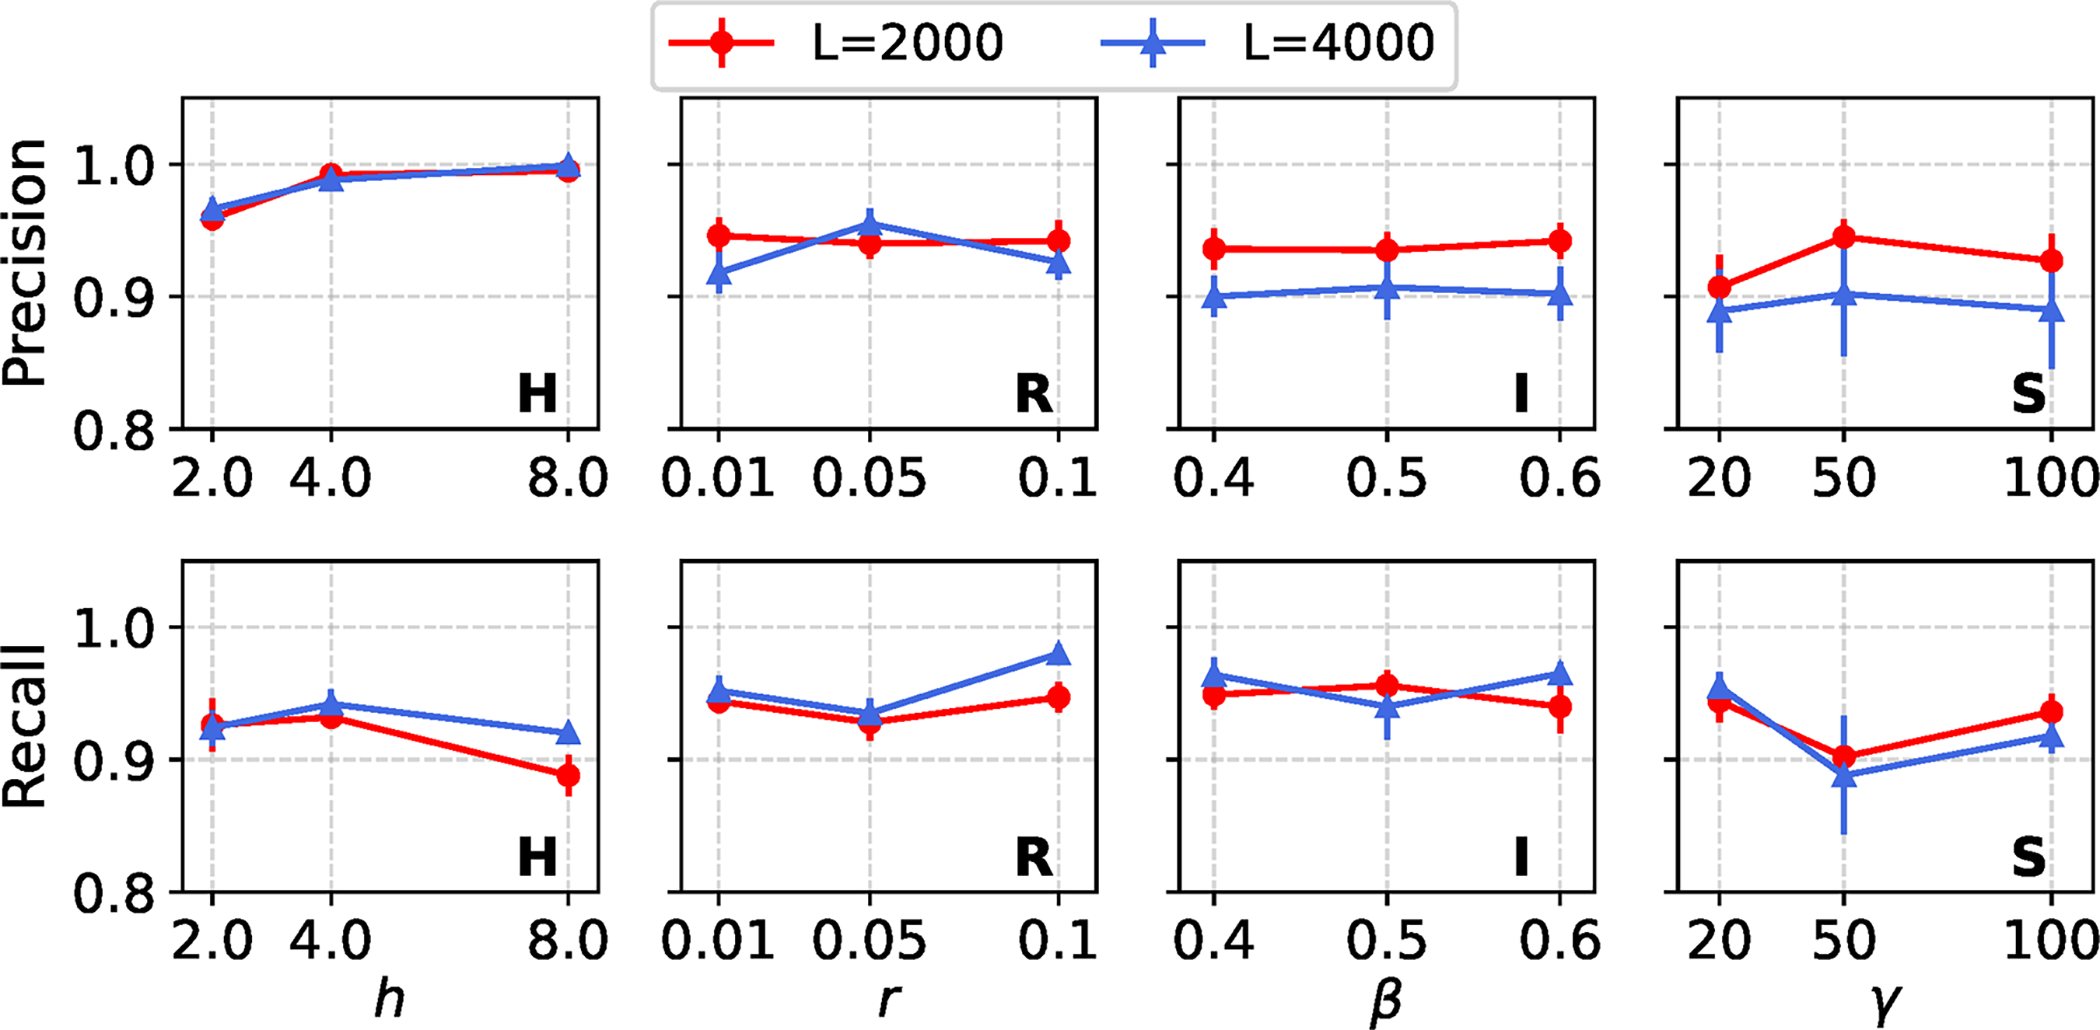
Estimation performance of the REVEAL across model conditions with a single variable region, under varying root sequence lengths
In Figure 7, we evaluate the impact of varying the number of taxa (
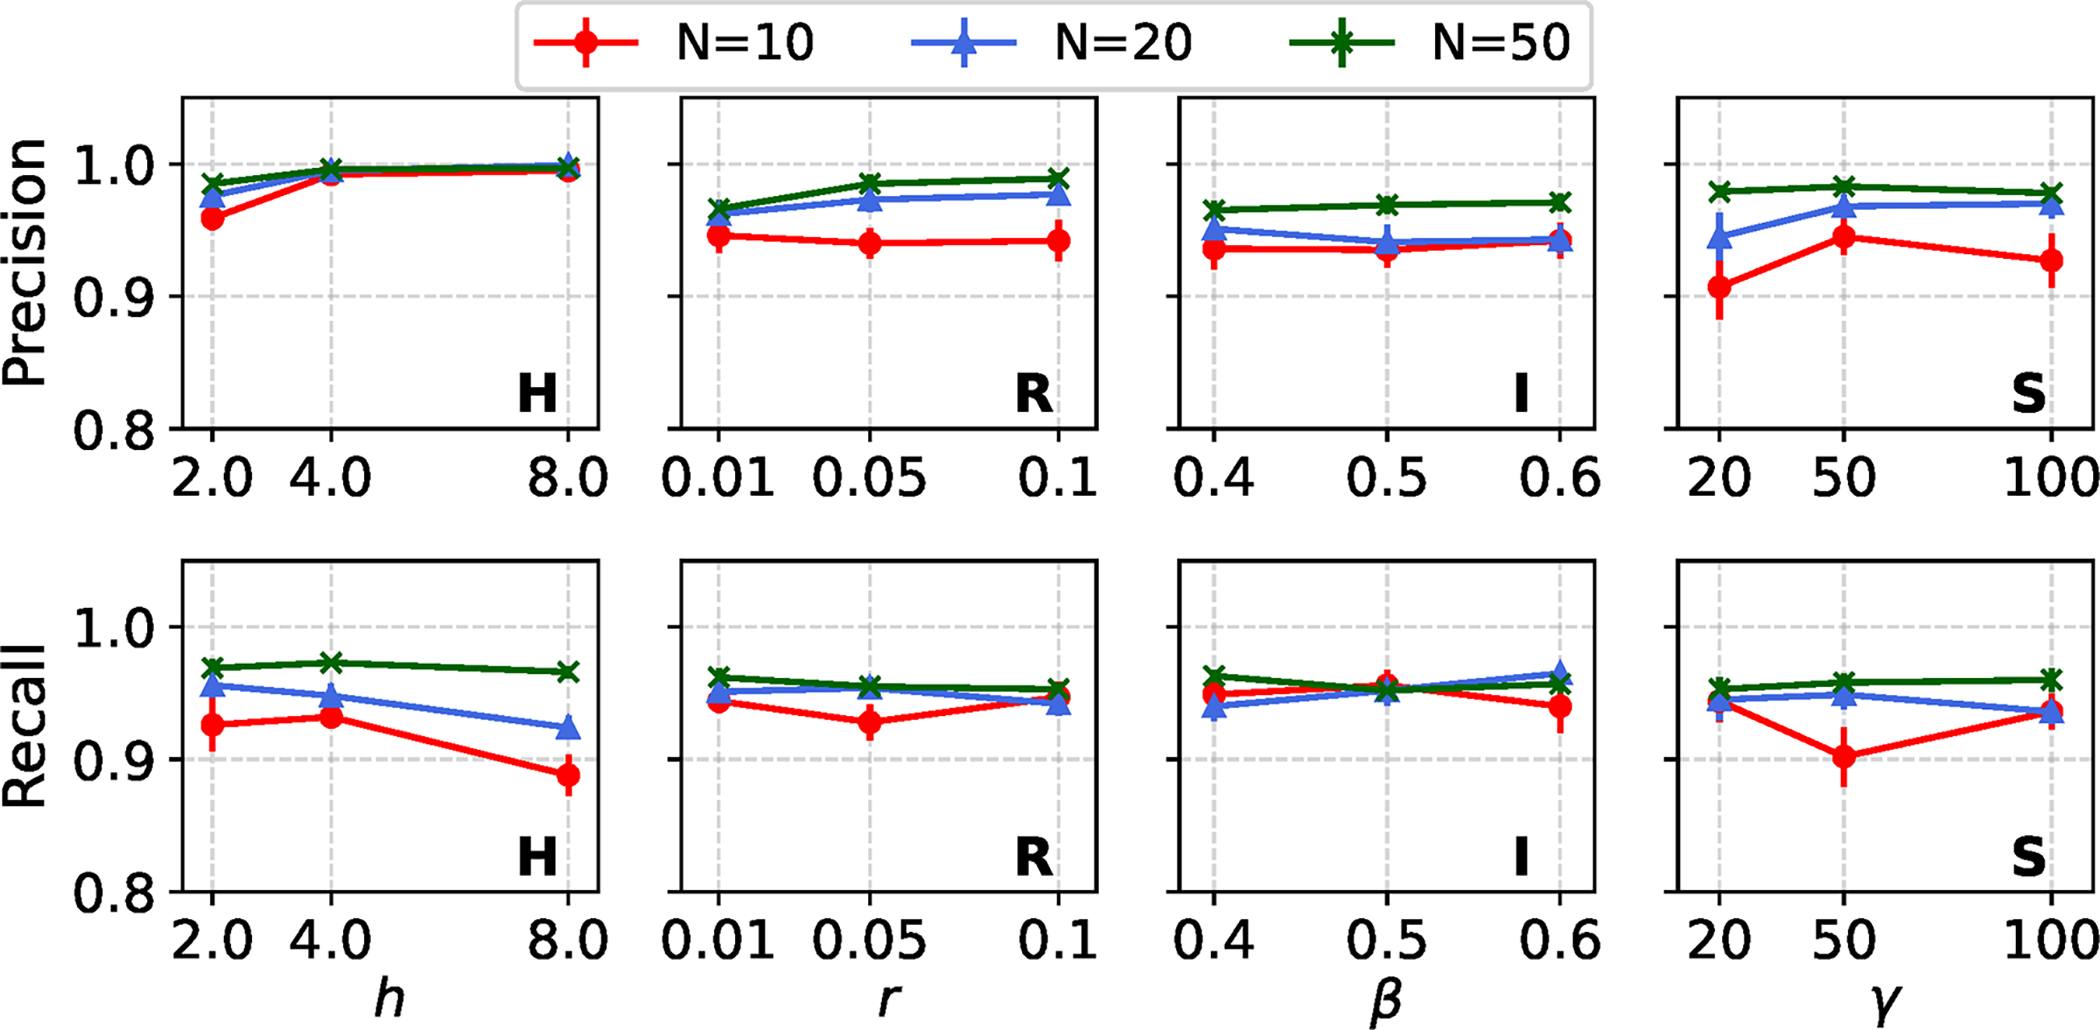
Estimation performance of REVEAL across model conditions with a single variable region, under varying numbers of taxa
In Figure 8, we evaluate the impact of increasing the number of taxa (N) on the computational requirements of the REVEAL framework. The observed trend suggests that runtime increases approximately exponentially with the number of taxa. Specifically, runtime increases from under 0.5 hours at
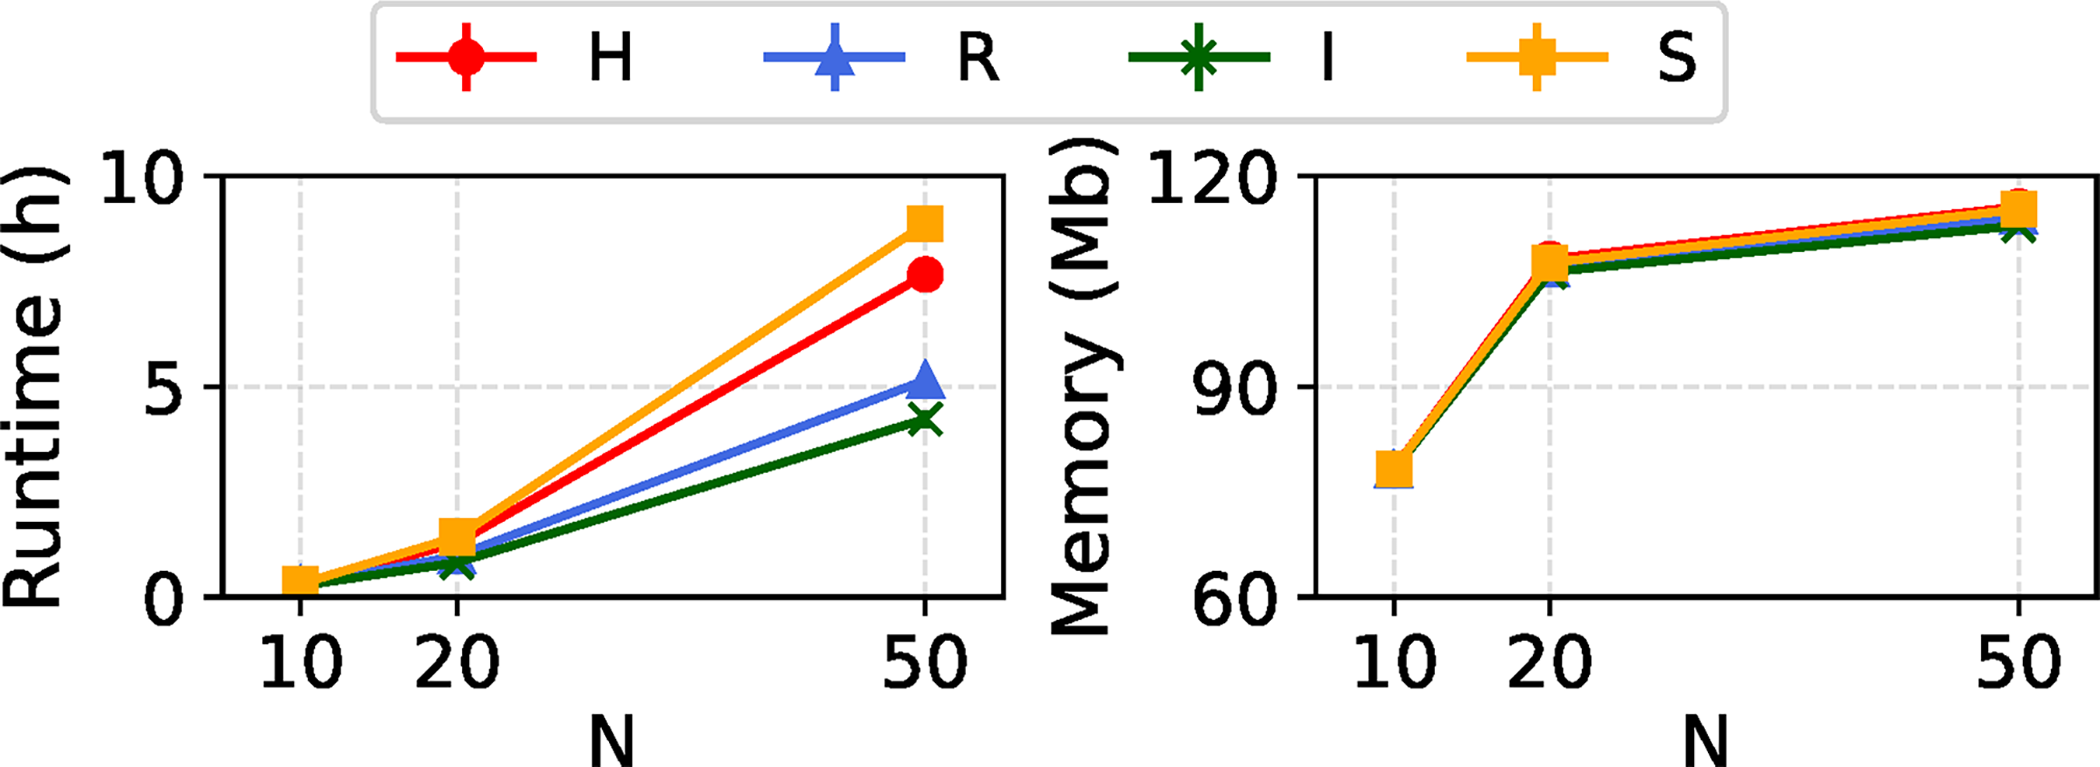
Runtime and memory usage of REVEAL across model conditions with a single variable region model and varying numbers of taxa N. All REVEAL parameters were set to default values. For each model condition type, mean and standard error of runtime and peak memory usage are reported across all model conditions of that type and 20 experimental replicates per model condition.
In our default simulation setup, evolutionary sequences were generated with indel events, using a medium gap–length distribution as described in Liu et al. (2012), and an indel rate of 0.02. In Figure 9, we examine how variations in gap–length distributions for indel events influence the detection performance of the REVEAL framework. Specifically, we compare detection performance on datasets simulated under the short, medium, and long gap–length distributions as characterized by Liu et al. (2012). Since model condition S did not use INDELible to simulate sequences with customized indel events, in contrast to model conditions H, R, and I, our comparison is limited to the latter three. Overall, our results indicate that REVEAL achieves robust precision and recall across all three examined gap–length indel scenarios, with only slight performance variations. Notably, for model conditions R and I, datasets simulated with the long gap–length distributions show a modest improvement in precision, ranging from 2% to 4%.
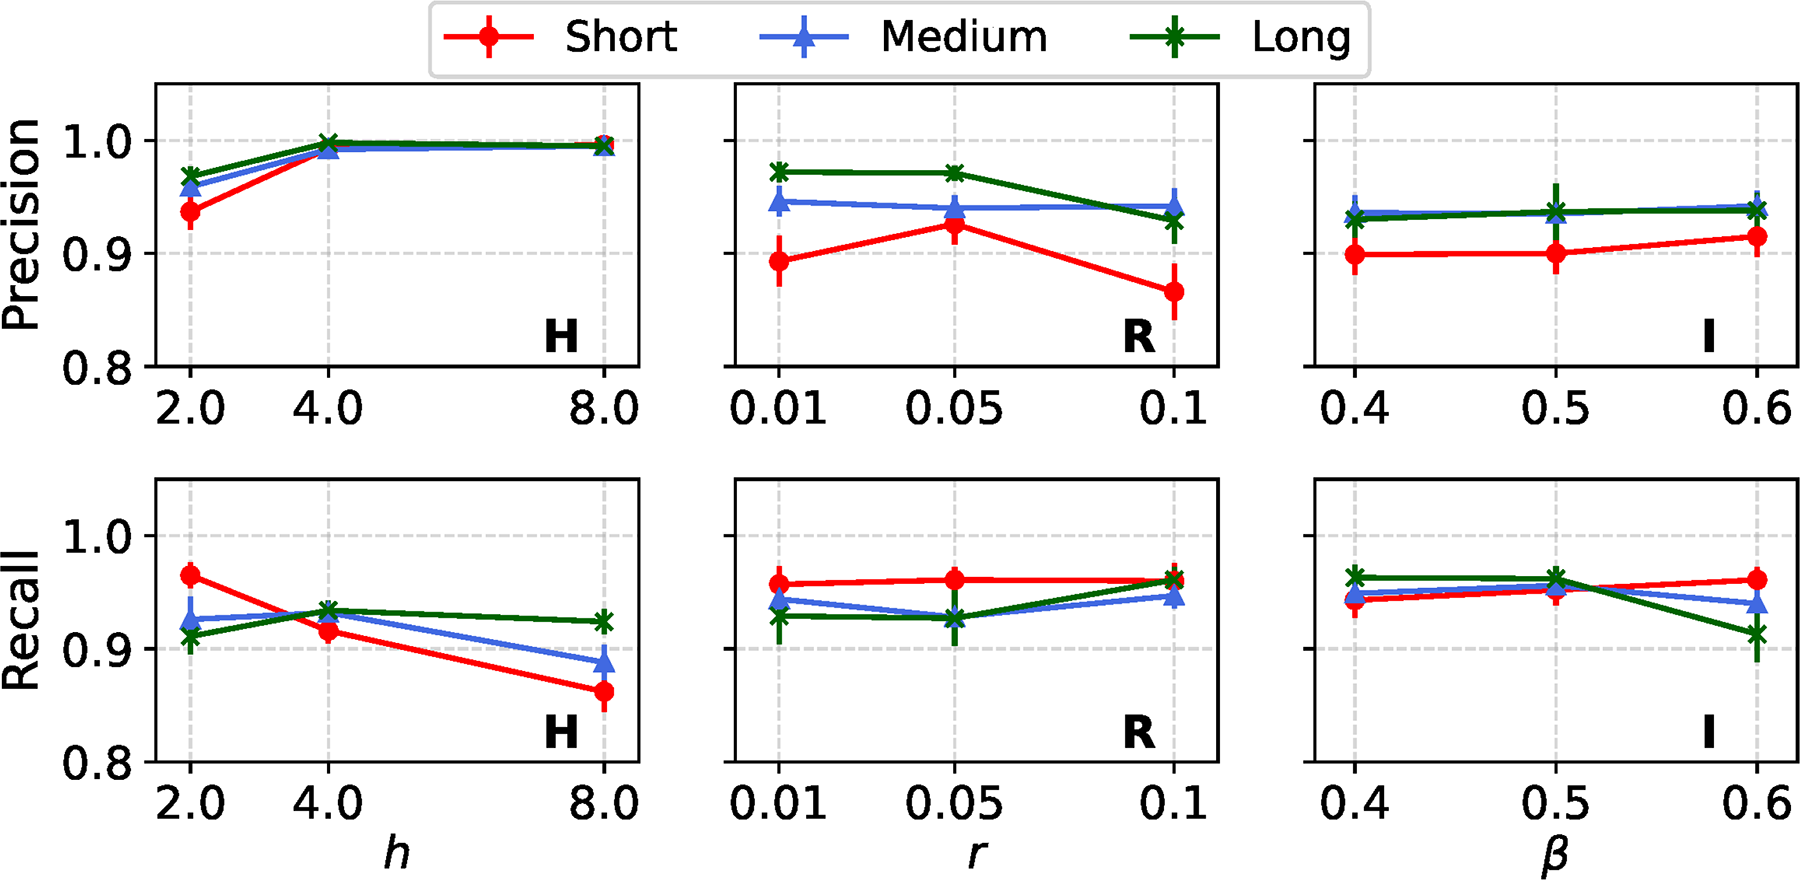
Estimation performance of REVEAL across model conditions with a single variable region, for different gap–length distributions. The layout and axis settings are identical to those in Figure 2.
In contrast, recall values are stable and remain relatively unaffected by changes in gap–length distribution across all model conditions. The robustness in recall, coupled with the incremental improvement in precision under longer gap distributions, highlights REVEAL’s consistent performance in local variable region detection and genomic sequence analysis.
Figure 10 presents the results for REVEAL’s analysis of the mouse dataset. The local support value matrix C produced by the REVEAL analysis is shown. As a point of comparison, the figure also includes a visualization of introgression patterns identified by PhyloNet-HMM [adapted from Liu et al. (2015)], a statistical method specifically designed for mapping introgression patterns in genomes. PhyloNet-HMM performs inference and learning under a bespoke model that combines a multi-species coalescent model, a finite-sites substitution model, and a hidden Markov model. In the local phylogenetic matrix C of the REVEAL framework, we observe a marked decrease in local support values in and around the PhyloNet-HMM-inferred introgression regions, as compared to the neighboring regions. We present the completed local phylogenetic matrix C for all mouse chromosomes in the Supplementary Data.

A comparison of introgression patterns identified by the PhyloNet-HMM method in Liu et al. (2015) and the REVEAL’s local support value matrix C.
Figure 11 shows the local support value matrix C generated by REVEAL for chromosome 2 L of the mosquito dataset, accompanying the 2La inversion region (approximately
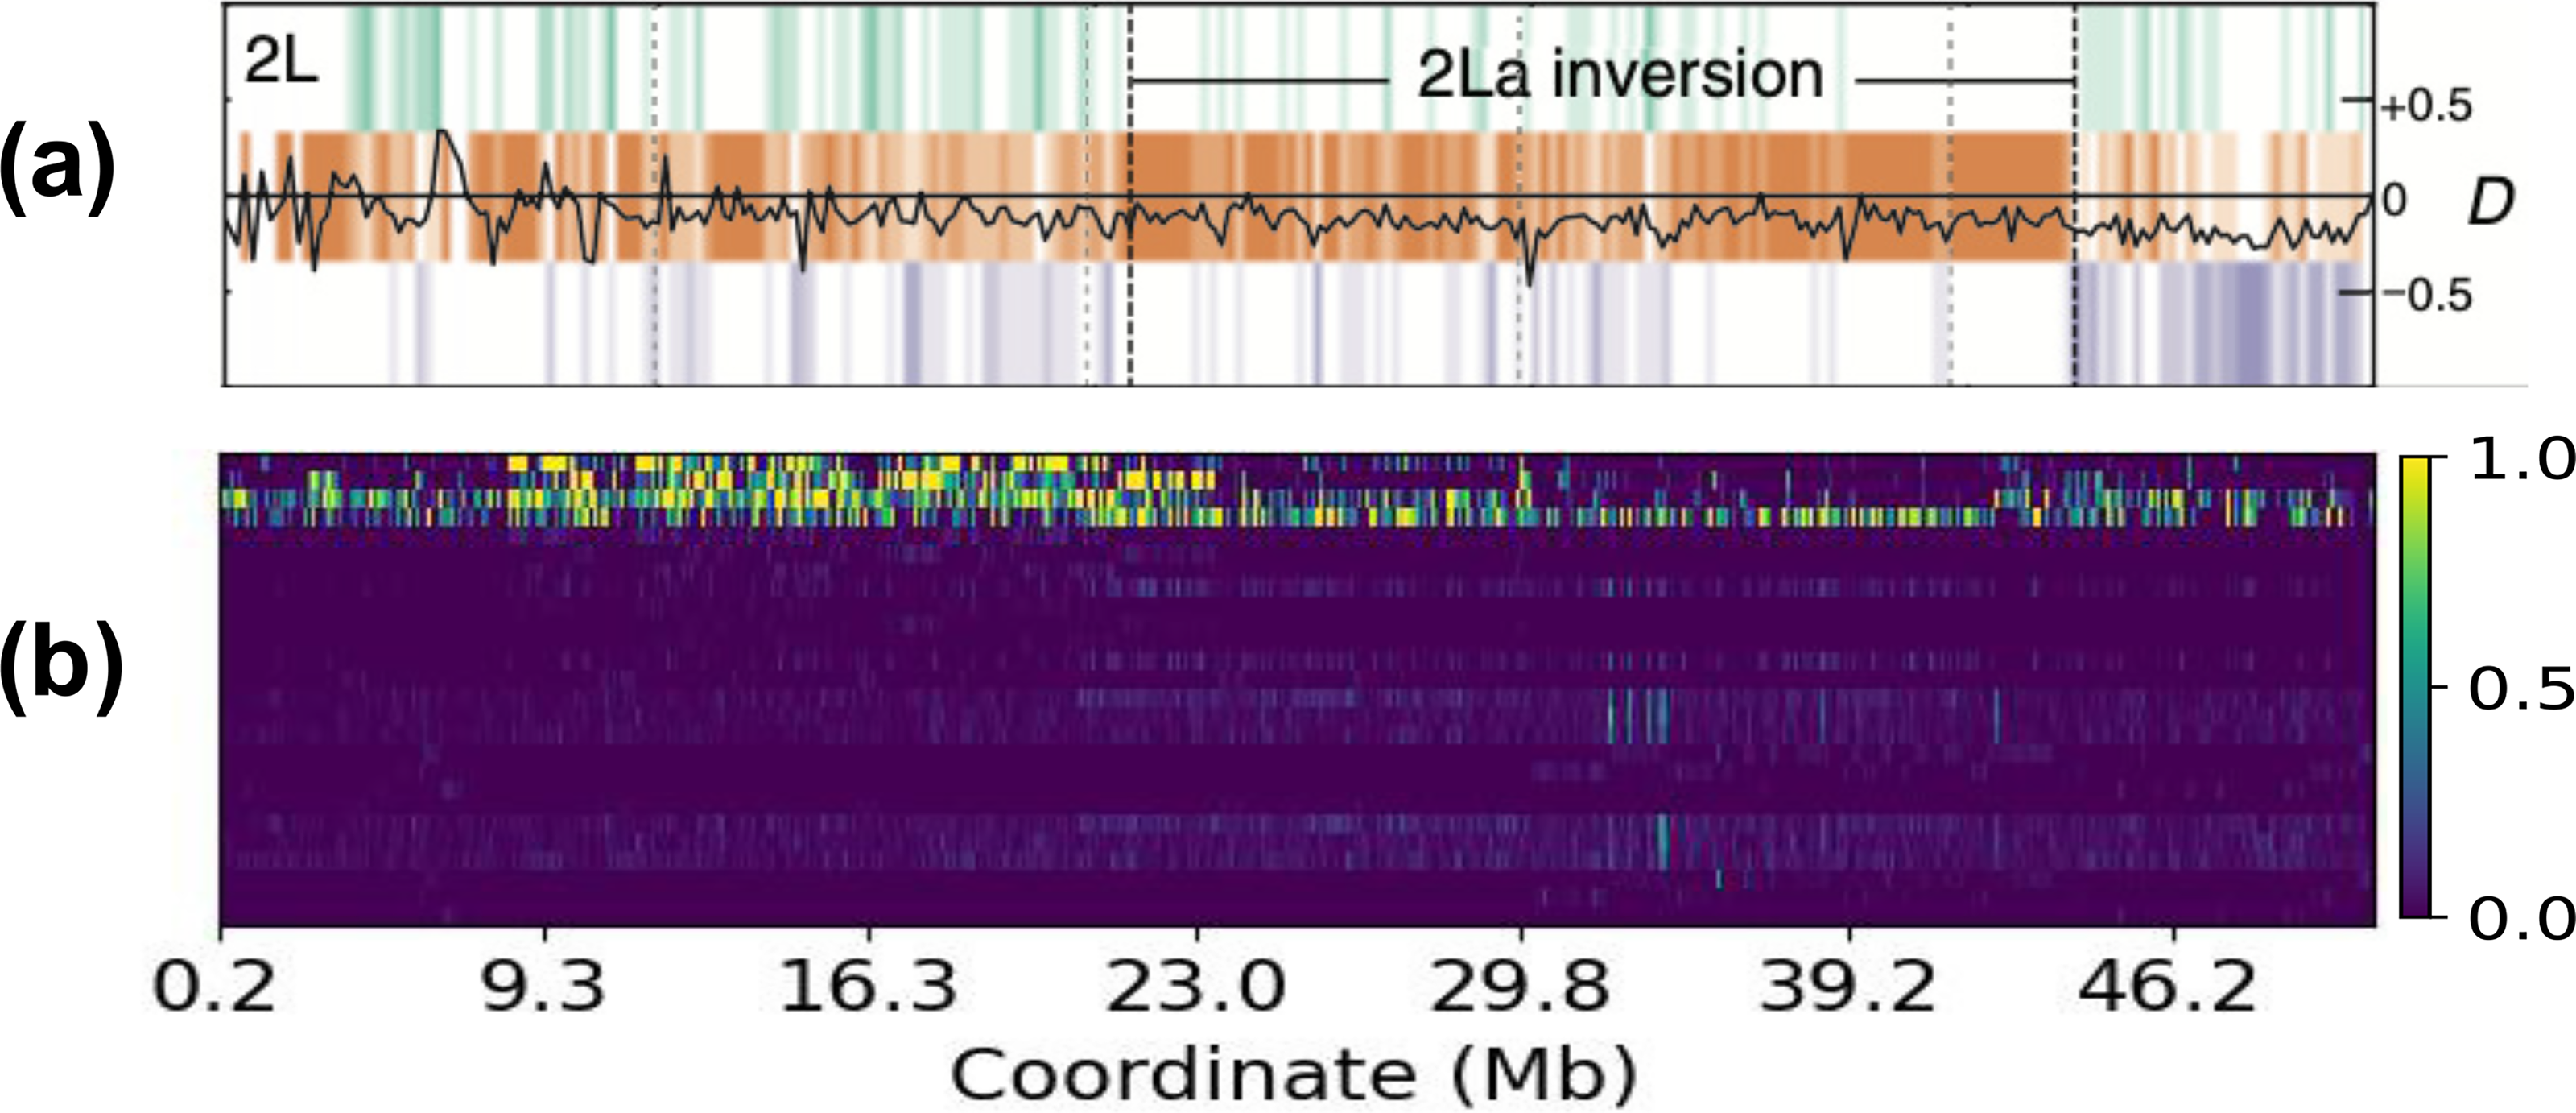
REVEAL analysis of chromosome 2 L in the mosquito dataset. Panel
A key advantage of the REVEAL framework is that it operates without imposing any assumptions or restrictions on the evolutionary processes that cause model violations in genomic sequences. Unlike traditional approaches that are designed to detect one specific evolutionary process, it can detect a diverse range of local model violations without being constrained by predefined evolutionary models. Furthermore, it does not depend on supervised learning techniques and does not require manually labeled data, making it a more flexible and scalable solution for local model violation detection.
The simulation study validates the robustness and effectiveness of the REVEAL framework across a range of simulation and experimental conditions. REVEAL successfully detected local model violations caused by divergence heterogeneity, recombination, introgression, and natural selection. Even in more complex cases with multiple locally variable regions, REVEAL’s precision remained consistently above 0.9, although recall experienced a slight decline. Notably, as the intensity of local model violations increases—whether through more extreme deviations in local evolutionary parameters or through longer local model violation regions—both detection accuracy and site-level mapping performance improve. Moreover, REVEAL demonstrates enhanced performance when the input MSA contains a greater number of taxa or exhibits increased gappiness, likely due to the richer phylogenetic signal and alignment structure that these conditions provide. Collectively, these findings underscore REVEAL’s robustness and adaptability across a wide range of evolutionary scenarios, highlighting its ability to generalize effectively without relying on prior knowledge of the underlying local model violations.
We fully acknowledge that a fully parametric model-based analysis is expected to outperform a model-agnostic method like REVEAL, under specific assumptions including: (1) the correct model or a very accurate model can be assumed to be available a priori, and (2) one or a few closely-related sequence analysis tasks is/are under study. However, these assumptions are quite strong and constraining. If the assumed local model(s) are incorrect or inadequate, then model mis-specification can impair detection and mapping of local model variation. If different tasks are performed on a dataset in a study, then purpose-built models and model-based methods must be developed and applied for each task.
Rather, REVEAL points to a different and practical alternative. Instead of requiring strong a priori modeling assumptions, REVEAL provides an automated, data-driven, global-model-agnostic, and local-model-free approach to detect and pinpoint local model variation as part of a biomolecular sequence analysis. The results of a REVEAL analysis can then (1) inform practitioners that the original global analysis is insufficient and requires modeling improvement and (2) precisely map regions in the dataset that require locally variable models, resulting in improved model-based sequence analysis.
CONCLUSIONS
In this study, we introduce REVEAL, a general-purpose framework for detecting and mapping local model violations during biomolecular sequence analysis. Unlike existing approaches, REVEAL is readily adapted to different biomolecular sequence analysis tasks and requires no additional modeling assumptions beyond those required for traditional global sequence analysis. Our simulation experiments validate the robustness and effectiveness of REVEAL across various evolutionary scenarios and causes of local model violations. Furthermore, we apply REVEAL to two empirical datasets and identify widespread local model violation regions across chromosomes. These results corroborate findings in past empirical studies that were inferred using parametric model-based algorithms for narrowly specialized inference and learning tasks.
While this study provides an initial proof of concept, future research promises to unlock further algorithmic advances. For example, we anticipate that REVEAL’s algorithmic formulation will generalize to other biomolecular sequence analysis tasks such as genome rearrangement mapping and structural variant analysis. Additional future experimentation is needed in this regard.
AUTHORS’ CONTRIBUTIONS
M.G.: Methodology, software, validation, formal analysis, investigation, data curation, writing—original draft, writing—review and editing, visualization. K.J.L.: Conceptualization, supervision, project administration, funding acquisition, methodology, investigation, writing—original draft, writing—review and editing.
Footnotes
ACKNOWLEDGMENT
The authors would like to thank the anonymous reviewers for their constructive feedback. This publication is an extended version of an article that appeared in the proceedings of the 22nd RECOMB-CG conference. Computational experiments and analyses were performed on the MSU High Performance Computing Center.
AUTHOR DISCLOSURE STATEMENT
The authors declare no potential conflicts of interest with respect to the research, authorship, and publication of this article.
FUNDING INFORMATION
This work has been supported by the NSF (DBI-2144121, DBI-2214038, and CCF-1714417 to K.J.L.).
Supplemental Material
References
Supplementary Material
Please find the following supplemental material available below.
For Open Access articles published under a Creative Commons License, all supplemental material carries the same license as the article it is associated with.
For non-Open Access articles published, all supplemental material carries a non-exclusive license, and permission requests for re-use of supplemental material or any part of supplemental material shall be sent directly to the copyright owner as specified in the copyright notice associated with the article.