
Abstract
Understanding comorbidity between human diseases is essential for uncovering shared pathophysiological mechanisms and improving diagnostic and therapeutic strategies. Although prior studies have investigated genetic and network-based disease associations, they often overlook the fragmented nature of disease modules within the human interactome. To address this limitation, we introduce Fragmented Disease Subgraphs with Component-Level Attention for Comorbidity Prediction (FDS-CAP), a novel graph-based deep learning framework. FDS-CAP first embeds fragmented disease subgraphs using Subgraph Neural Networks (SUBGNN) with component-level attention, then applies a variational comorbidity predictor built upon a Variational Graph Auto-Encoder that is used to predict comorbid disease associations within the Human Disease Network. SUBGNN encodes disease subgraphs by propagating information at the connected component level across three property-aware channels—capturing positional, neighborhood, and structural roles—and integrates a component-level attention mechanism that weighs each connected component based on its significance to the overall subgraph representation. A core contribution of our method is the attention-based aggregation of connected component embeddings, enabling more accurate and expressive disease representations that reflect the biological complexity in fragmented disease subgraphs for improved comorbidity prediction. FDS-CAP achieves state-of-the-art performance for comorbidity prediction on a benchmark dataset, with an AUROC of 0.966. We further illustrate its biological interpretability through a single representative case study on glioma, showing that attention-weighted subgraph components capture meaningful patterns associated with disease mechanisms.
Keywords
INTRODUCTION
Comorbidity, defined as the co-occurrence of two or more diseases in an individual, is a growing challenge in modern health care, specifically among aging populations. In the United States, approximately 79% of adults aged 60 and older live with multiple chronic conditions (National Council on Aging, 2024), which complicates clinical management, increases health care costs, and worsens patient outcomes. Understanding the molecular mechanisms underlying comorbid diseases is therefore crucial to advancing disease diagnosis and treatment. Recent advances in high-throughput molecular profiling have enabled researchers to investigate disease relationships from a systems biology perspective. One widely used approach involves the construction of Human Disease Networks (HDNs), where diseases are represented as nodes and edges capture shared molecular or phenotypic features (Hidalgo et al., 2009; Barabási et al., 2011), including gene expression profiles (Yang et al., 2016), symptom co-occurrence (Zhou et al., 2014), and health care cost patterns (Ma et al., 2020). Among these, gene-centric HDNs, which connect diseases based on shared or functionally related genes (Goh et al., 2007), provide a biologically grounded framework for mapping disease-associated genes onto the human interactome, thereby facilitating the exploration of molecular mechanisms underlying disease associations. Within the interactome, diseases are often conceptualized as modules of interacting proteins that collectively represent the molecular footprint of a pathological condition (Barabási et al., 2011; Menche et al., 2015). Network-based methods have leveraged this conceptual perspective of disease module modeling to identify disease modules (Ghiassian et al., 2015), infer novel disease-gene associations (Wu et al., 2008), and study disease similarity and comorbidity based on topological proximity or structural coherence (Menche et al., 2015; Akram and Liao, 2019; Ni et al., 2020; Qin and Liao, 2025). However, a key limitation of many network-based approaches for disease comorbidity analysis is the implicit assumption that genes associated with each disease form a dense, contiguous module within the human interactome. While Menche et al. (2015) acknowledged that disease modules may be fragmented across multiple components due to the incompleteness of current molecular interaction data, their method relies on partial connectivity and module overlap, which may limit its ability to fully capture the complexity of dispersed disease mechanisms relevant to disease comorbidity. Accordingly, we analyze a curated human interactome and benchmark disease-gene association dataset constructed by Menche et al. (2015) and subsequently used in comorbidity prediction models, including Weighted Geometric Embedding (WGE) (Akram and Liao, 2019) and Biologically Supervised Embedding (BSE) (Qin and Liao, 2025). This analysis reveals pervasive fragmentation within each disease subgraph, as mapping disease-associated genes onto the interactome typically yields a subgraph with multiple connected components rather than a single cohesive disease module. As shown in Figure 1, 27.1% of disease subgraphs contain more than 50 connected components (CCs), and notably, in over 92% of cases, fewer than half of the disease-associated genes reside in the largest connected component (LCC) of each subgraph. Moreover, most connected components within disease subgraphs are small and structurally isolated, reflecting the biological diversity of disease mechanisms. These observations underscore a critical modeling limitation, wherein existing approaches often overlook or oversimplify the fragmented nature of disease subgraphs, potentially missing meaningful biological signals encoded within the topology of their connected components. We posit that each connected component within a disease subgraph may hold distinct topological and functional significance, reflecting the inherent complexity and dispersed nature of disease-related perturbations. Therefore, to represent such a fragmented disease subgraph accurately, modeling methods must account for intra-subgraph diversity by incorporating variations in positional context, neighborhood relationships, and the connectivity of its connected components within the interactome, while also considering the distinct contribution of each connected component to the overall disease subgraph representation that supports accurate comorbidity prediction. To address these modeling challenges, we propose FDS-CAP, a novel two-stage graph-based deep learning framework for modeling Fragmented Disease Subgraphs with Component-level Attention for comorbidity Prediction (Fig. 2). The first stage models fragmented disease subgraphs using Subgraph Neural Networks (SUBGNN) with a component-level attention mechanism to generate topologically informative disease embeddings (Alsentzer et al., 2020). The second stage, based on a Variational Graph Auto-Encoder (VGAE) (Kipf and Welling, 2016), leverages these embeddings to predict comorbid associations between diseases. Our main contributions are as follows:
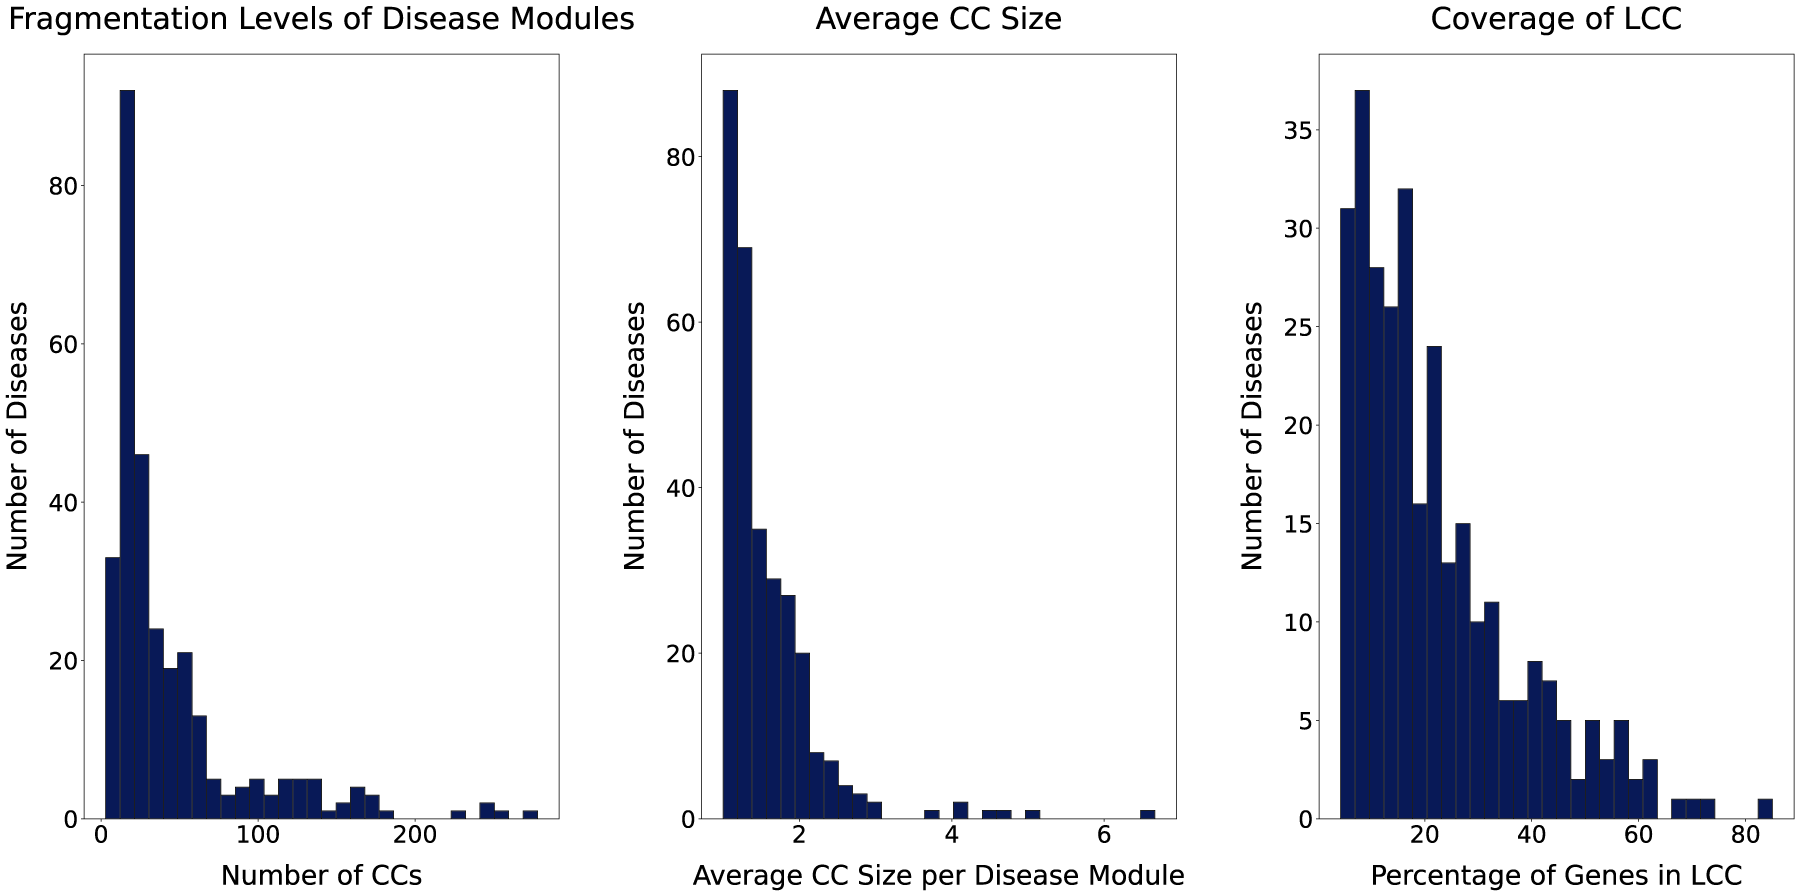
Fragmentation characteristics of disease modules. Each panel summarizes fragmentation features of 299 disease modules projected onto the human interactome. The left panel illustrates the number of connected components (CCs) per module, capturing overall fragmentation. The middle panel reports the average size of connected components within each module. Lower values indicate more severe fragmentation into smaller components, while higher values suggest that modules, though potentially fragmented, retain larger substructures. The right panel depicts the proportion of genes in the largest connected component (LCC) of each module, reflecting the degree of internal cohesion.
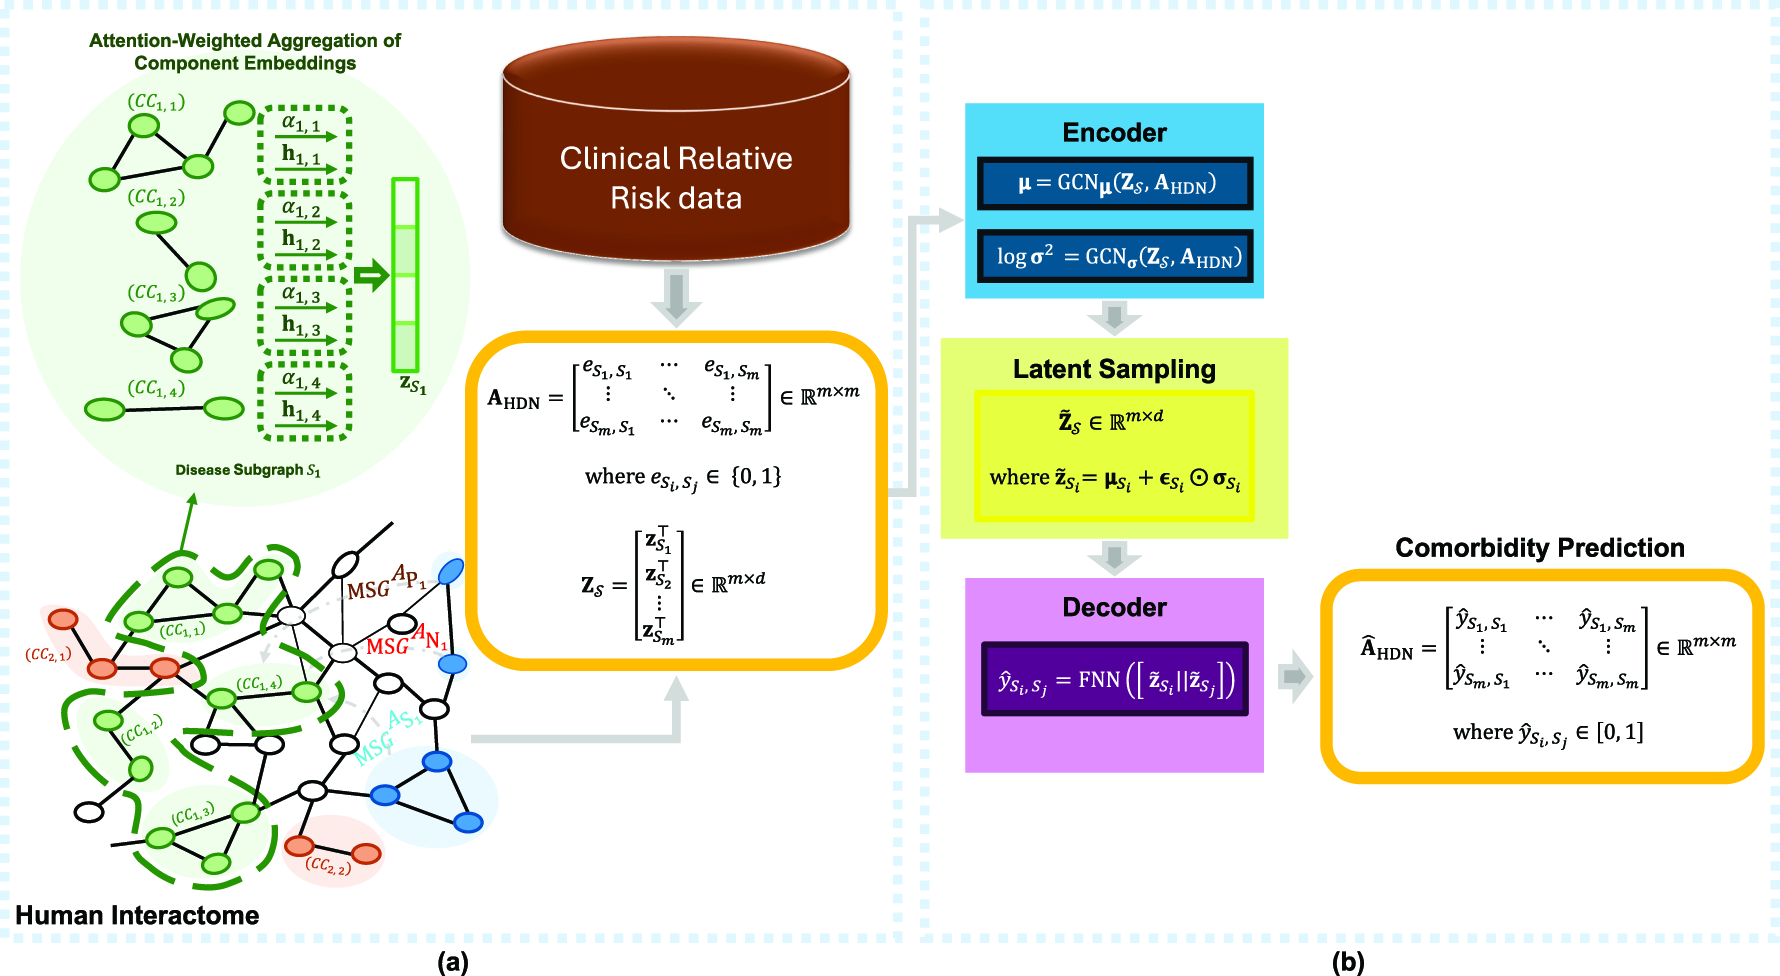
Overview of the FDS-CAP framework.
We model fragmented disease subgraphs in the human interactome and adopt multi-channel message passing to capture positional, neighborhood, and structural features of this fragmentation.
We introduce a component-level attention mechanism that operates over the connected components within each fragmented disease subgraph, capturing their individual relevance and weighting their contributions to the overall disease subgraph representation.
We apply VGAE to predict disease comorbidities by modeling latent structure in the HDN.
We validate the model’s effectiveness through comorbidity prediction experiments and assess its biological interpretability using a single illustrative glioma case study.
Recent advances in disease similarity prediction have followed two prominent methodological directions: geometric embedding and graph-based deep learning methods. On one hand, geometric embedding approaches aim to project the human interactome into low-dimensional spaces that preserve structural relationships between genes in the interactome. WGE uses Multidimensional Scaling (Shepard, 1980) to embed the human interactome into a low-dimensional geometric space and generate embeddings of genes associated with each disease for comorbidity prediction (Akram and Liao, 2019). Building on this direction, BSE selects biologically informative dimensions of embeddings for disease-associated genes from the interactome’s geometric embedding space to enhance comorbidity prediction performance (Qin and Liao, 2025). On the other hand, graph-based deep learning methods have been applied to model biological relationships among genes and identify disease similarities. Li et al. (2021) combined two gene-related resources, including the human gene network and the Gene Ontology (GO) hierarchy, to learn embeddings of disease-related genes that preserve both first- and second-order proximities using the Large-scale Information Network Embedding (Tang et al., 2015). Similarly, Chen et al. (2022) introduced CoGO, a contrastive learning framework that also integrates the human gene network and GO hierarchy. CoGO utilizes Graph Convolutional Networks (GCNs) and Relational GCNs to embed genes and their annotated GO terms into a shared embedding space, which is then leveraged to infer disease similarities.
Although geometric embedding methods do not explicitly assume that disease subgraphs are fully connected, they collapse each disease into a single vector obtained by aggregating embeddings of its associated genes, thereby ignoring the topological diversity induced by the fragmentation within a disease subgraph, wherein its associated genes form multiple components distributed across the interactome. This limitation is evidenced by our analysis of the same benchmark interactome and disease-gene associations used by WGE and BSE, which shows that most disease subgraphs decompose into many scattered connected components spanning distinct interactome regions. By collapsing this fragmented, multicomponent organization into a single cohesive module, geometric embedding approaches tend to overlook biologically meaningful signals encoded in component-level topology and, as a result, may fail to fully capture the complex and distributed nature of disease-related perturbations in the interactome.
MATERIALS AND METHODS
Materials
Human interactome
The human interactome is constructed as a large-scale protein–protein interactions (PPIs) network that encompasses a variety of experimentally validated molecular interactions (Menche et al., 2015). This network integrates regulatory interactions inferred from transcription factor binding to regulatory elements; literature-curated protein interactions primarily derived from low-throughput experimental studies; and binary interactions obtained from high-throughput yeast two-hybrid experiments and curated literature sources. It also includes metabolic enzyme-coupled interactions, protein complexes, kinase–substrate pairs, and signaling interactions. The union of these diverse sources yields a comprehensive network of 13,460 protein-coding genes, connected by 141,296 unique interactions between their protein products. We model the human interactome as an undirected graph
Statistics of the Human Interactome and the Human Disease Networks

Statistics of the Human Interactome and the Human Disease Networks
Largest connected component.
Human disease network.
Relative risk.
To investigate disease comorbidity from both clinical and biological perspectives, we construct HDN that integrates patient-level disease co-occurrence data with molecular data (Fig. 2a). In this network, each node represents a disease, and edges indicate statistically significant comorbid associations between diseases. These associations are quantified using the Relative Risk (RR), defined as the ratio between the observed co-occurrence of two diseases and the expected occurrence under the assumption of independence. An RR value greater than a specified threshold indicates that two diseases co-occur more frequently than would be expected by chance, and an edge is assigned between them in the HDN. The RR values are computed using a large-scale Medicare dataset comprising the disease history of approximately 30 million individuals aged 65 and older (Menche et al., 2015). From this dataset, 10,743 disease pairs were identified, of which 8,874 and 6,269 satisfy
Methods
We present FDS-CAP, a novel two-stage graph-based deep learning framework for predicting disease comorbidity from fragmented disease subgraphs within the human interactome. In the first stage, SUBGNN is employed to generate disease subgraph representations by capturing the fragmentation of disease subgraphs into multiple connected components and incorporating component-level attention to weigh the relative importance of each connected component within the subgraphs. In the second stage, VGAE is used to model latent relationships between diseases in the HDN and infer their comorbid associations. Each stage is described in detail below.
Disease subgraph representation
Let
Overview of Six Topological Properties Used in SUBGNN to Learn Representation of the Disease Subgraph
Within the Human Interactome Graph

Overview of Six Topological Properties Used in SUBGNN to Learn Representation of the Disease Subgraph
For each channel, SUBGNN randomly samples a set of anchor patches
While all connected components 
The final disease subgraph embedding 
Although the attention mechanism is learned jointly as part of the SUBGNN-based disease representation objective, it is not directly constrained by component-level supervision, i.e., there are no labels specifying which connected components should receive higher weights. Nevertheless, its relevance is supported by two complementary lines of evidence. From a predictive perspective, disease embeddings aggregated using component-level attention yield substantially improved comorbidity prediction performance compared with state-of-the-art geometric embedding methods such as WGE and BSE under identical data and evaluation settings (Tables 3 and 4), suggesting that the attention mechanism prioritizes the most informative connected components for disease representation and thereby improves downstream comorbidity prediction. From a biological interpretability perspective, the glioma case study in Section 5.2 shows that connected components assigned higher attention weights tend to be more biologically informative and are enriched for genes with known or emerging relevance to glioma biology, such as GSDMC, CDKN2B-AS1, RTEL1, and IDH1. Together, these findings indicate that the learned attention weights highlight biologically meaningful substructures within fragmented disease subgraphs.
Comparison of Average Model Performance Between the Proposed FDS-CAP and State-of-the-Art Models under the RR Threshold = 0 Setting

Weighted geometric embedding.
Biologically supervised embedding.
Standard deviation.
Area under the receiver operating characteristic curve.
Average precision.
Bold values indicate the best (highest) performance among the compared models for each evaluation metric.
The learned disease embeddings produced by SUBGNN in the first stage of our framework are represented by a matrix
We model each disease latent variable
The decoder of the predictor is implemented as a feedforward neural network (FNN) that takes the concatenation of sampled latent embeddings of a disease pair, 
Experimental setup
We conduct comorbidity prediction experiments using benchmark datasets that integrate disease-gene associations, molecular interaction data, and clinically observed disease relationships. To contextualize disease modules within a coherent molecular framework, each disease is embedded as a subgraph within the LCC of the human interactome graph
Computational complexity and runtime analysis
The first stage uses SUBGNN to encode each disease subgraph by performing message passing over its connected components and a fixed number of randomly sampled anchor patches. As a result, runtime scales approximately linearly with the number of disease subgraphs and their sizes. Following prior SUBGNN work, anchor–subgraph similarities can be precomputed, which reduces both memory usage and runtime. With this precomputation, training SUBGNN on our interactome requires 24 s per epoch on a single RTX 4070 GPU (12 GB VRAM). In our implementation, SUBGNN is executed once to generate fixed embeddings for all disease subgraphs, which are then fed into the second-stage predictor. The variational comorbidity predictor operates on the HDN at the disease level; therefore, its computational cost depends on the number of diseases and comorbidity links rather than the interactome size. On the same RTX 4070 GPU, full 10-fold cross-validation takes 160 s for RR threshold = 0 and 127 s for RR threshold = 1, including training, validation, and testing.
Evaluation metrics and comparison
We evaluate the performance of FDS-CAP for comorbidity prediction using standard binary classification metrics, including area under the receiver operating characteristic curve (AUROC), accuracy, F1-score, and average precision (AP).
We compare FDS-CAP against WGE and BSE, two state-of-the-art geometric embedding methods evaluated on the same gene-centric human interactome, disease-gene associations, and comorbid disease pairs used in this study. Both methods first obtain gene embeddings by projecting the human interactome into a low-dimensional geometric space and then construct disease embeddings by aggregating the embeddings of disease-associated genes. However, these methods do not explicitly model the fragmentation of disease subgraphs into multiple connected components. Instead, they treat disease-associated genes as belonging to a single cohesive module and thus ignore component-level topology. WGE and BSE are therefore the most directly comparable methods for isolating the impact of component-level modeling addressed by FDS-CAP. To ensure consistency in evaluation, we reproduce BSE using the official code released by the authors and evaluate it on the same 10-fold cross-validation splits used in FDS-CAP. For WGE, we report the results published in the original study.
RESULTS
Performance analysis on comorbidity prediction
The averaged performance of FDS-CAP across 10 test folds on the comorbidity prediction task using RR thresholds of 0 and 1 is summarized in Tables 3 and 4. While RR threshold = 1 restricts the HDN to stronger, clinically confident disease comorbid associations, RR threshold = 0 includes a broader set of comorbid pairs, leading to increased edge density in the HDN. This enhanced connectivity supports richer information propagation between diseases in the HDN, enabling the comorbidity predictor to better capture latent comorbid relationships. Therefore, under the RR threshold = 0 setting, FDS-CAP achieves its highest performance, reflecting its ability to exploit richer network structure and capture complex comorbidity patterns. Although performance decreases slightly under the more stringent RR threshold = 1 setting due to reduced connectivity, the model still demonstrates strong and robust predictive performance across all evaluation metrics. Figures 3 and 4 present the receiver operating characteristic (ROC) and precision-recall curves, along with their corresponding AUROC and area under the precision-recall curve values, illustrating the model’s consistent performance across test folds under both RR threshold settings.
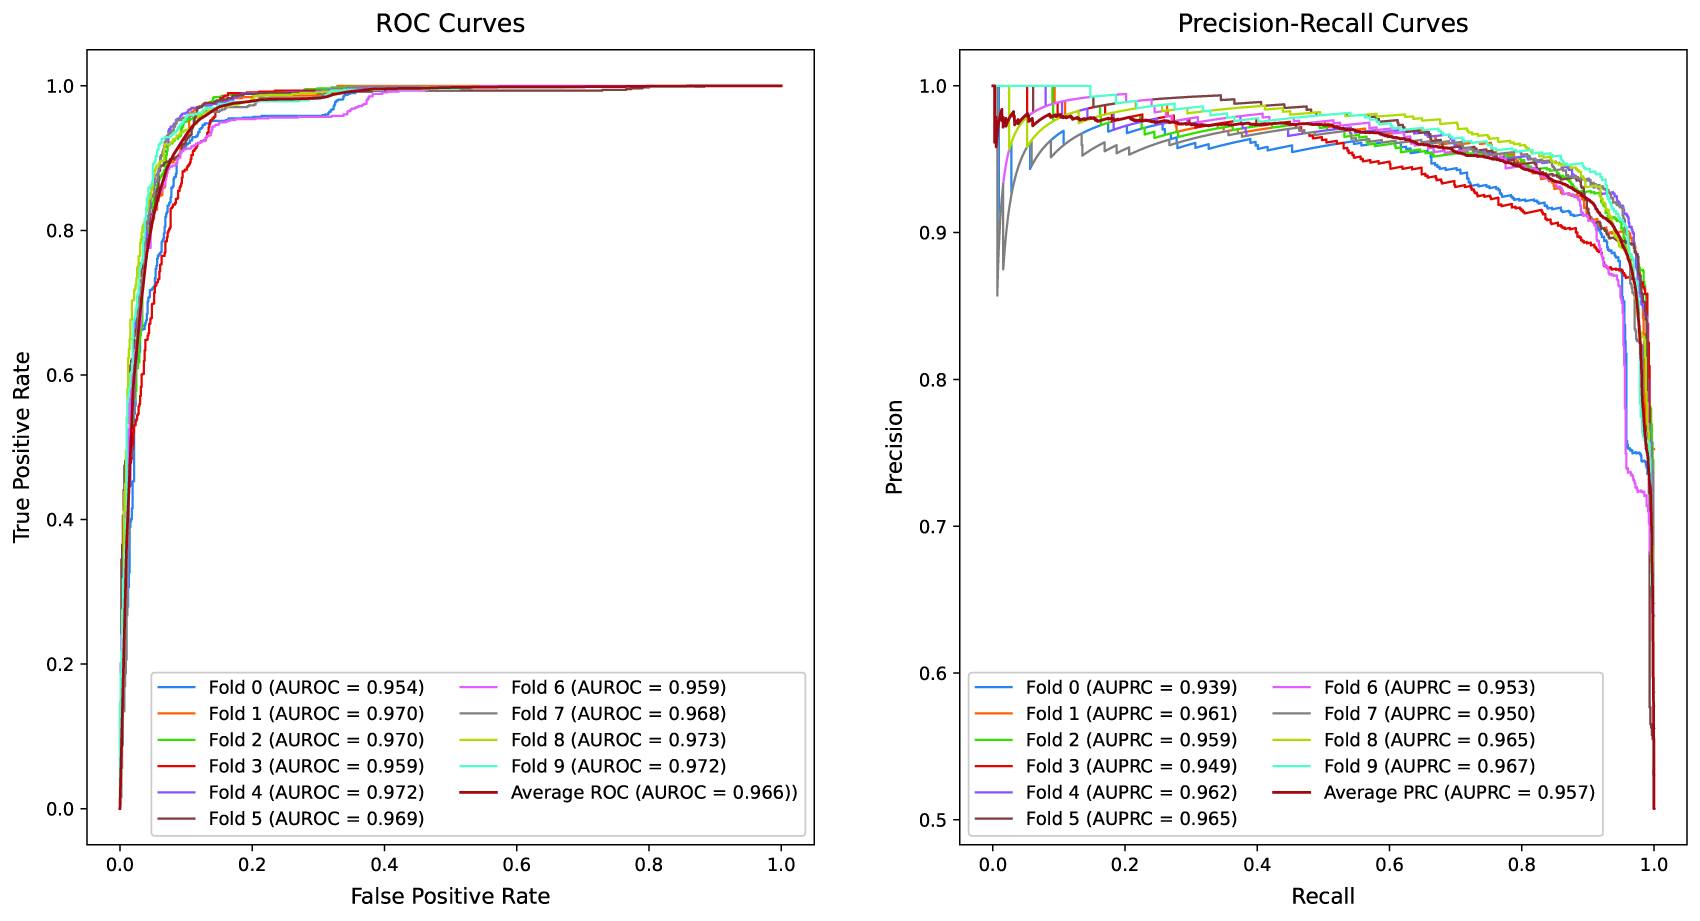
Receiver Operating Characteristic (ROC) and Precision-Recall (PR) curves of the FDS-CAP model under the Relative Risk (RR) threshold = 0 setting. Each curve represents the test performance of an individual fold from 10-fold cross-validation. The left panel depicts ROC curves with the Area Under the ROC Curve (AUROC) values, along with the average performance across all folds. The right panel presents PR curves with the Area Under the PR Curve (AUPRC) values, along with the average performance.
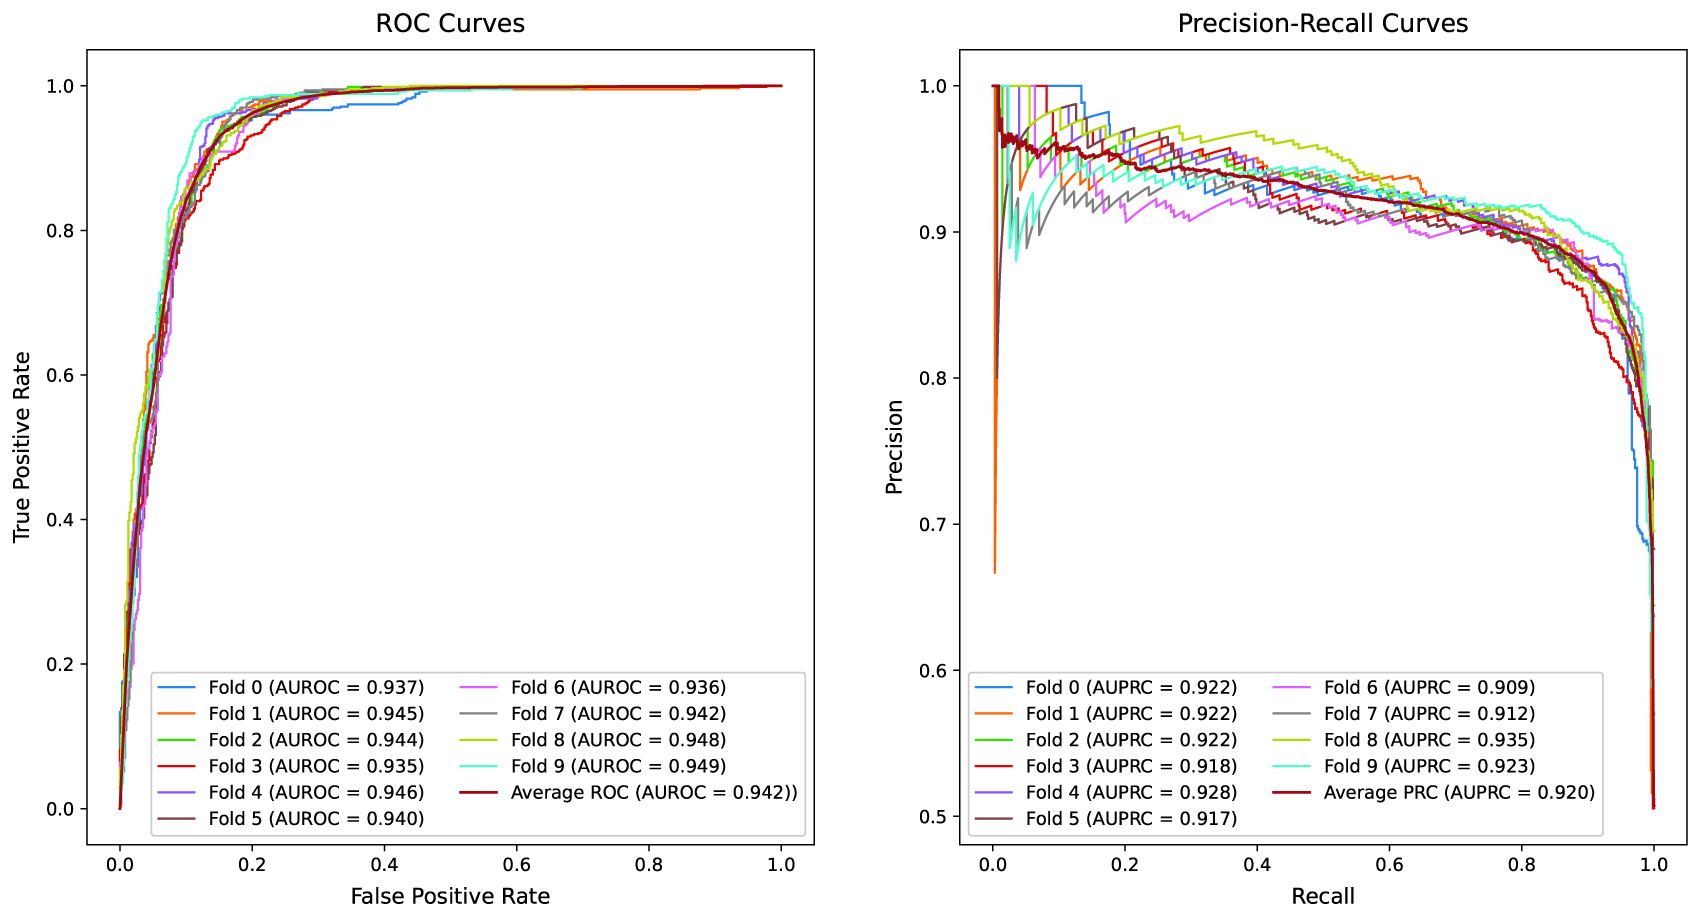
Receiver Operating Characteristic (ROC) and Precision-Recall (PR) curves of the FDS-CAP model under the Relative Risk (RR) threshold = 1 setting. Each curve represents the test performance of an individual fold from 10-fold cross-validation. The left panel depicts ROC curves with the Area Under the ROC Curve (AUROC) values, along with the average performance across all folds. The right panel presents PR curves with the Area Under the PR Curve (AUPRC) values, along with the average performance.
In the comparative evaluation, FDS-CAP consistently outperforms state-of-the-art geometric embedding methods for comorbidity prediction across all core metrics. Under the RR threshold = 0 setting (Table 3), FDS-CAP achieves an AUROC of 0.966 and an AP of 0.957, corresponding to relative improvements of 11.8% in AUROC (relative to the average performance of WGE and BSE) and 27.0% in AP relative to BSE. Accuracy and F1-score also increase by 6.4% and 6.2%, respectively, relative to the average performance of WGE and BSE. Under the stricter RR threshold = 1 setting (Table 4), FDS-CAP maintains strong predictive performance, achieving an AUROC of 0.942 and an AP of 0.920. These results represent relative gains of 18.1% in AUROC (relative to the average performance of WGE and BSE) and 20.5% in AP relative to BSE. Accuracy and F1-score improve significantly, by 16.0% and 16.3%, respectively, relative to the average performance of WGE and BSE.
Comparison of Average Model Performance Between the Proposed FDS-CAP and State-of-the-Art Models under the RR Threshold = 1 Setting
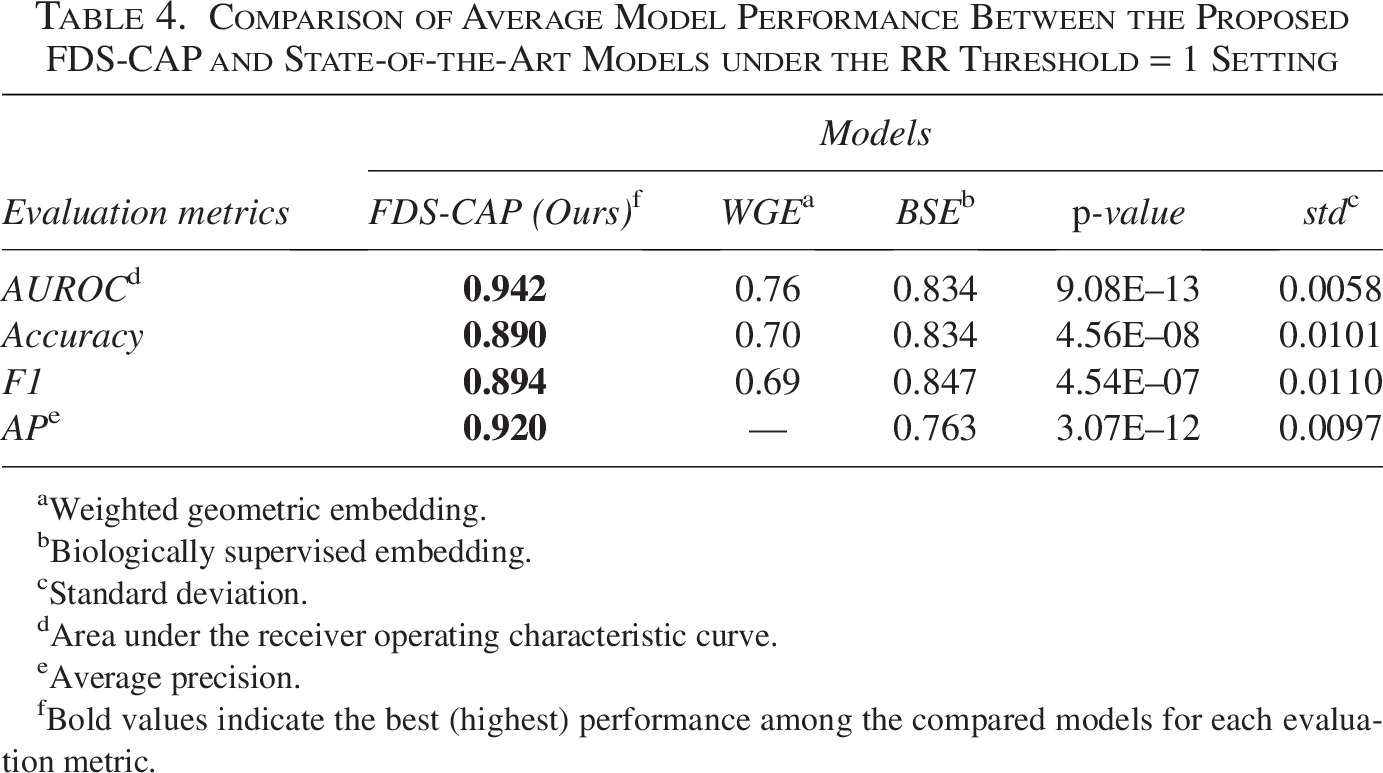
Weighted geometric embedding.
Biologically supervised embedding.
Standard deviation.
Area under the receiver operating characteristic curve.
Average precision.
Bold values indicate the best (highest) performance among the compared models for each evaluation metric.
In Section 5.1, we evaluate FDS-CAP on comorbidity associations among all 299 diseases and show consistent gains in comorbidity prediction performance. To assess the biological interpretability of FDS-CAP, we present a single representative case study demonstrating that component-level attention over topology-aware connected component embeddings within a fragmented disease subgraph can reveal biologically meaningful substructures. Specifically, we focus on glioma, a group of tumors that arise from glial cells in the brain and spinal cord (National Cancer Institute, 2011), and analyze the ten connected components receiving the highest attention weights in the glioma subgraph embedding. Figure 5 displays these connected components, including representative genes such as GSDMC, CDKN2B-AS1, IDH1, and ERBB2, along with their corresponding attention weights.
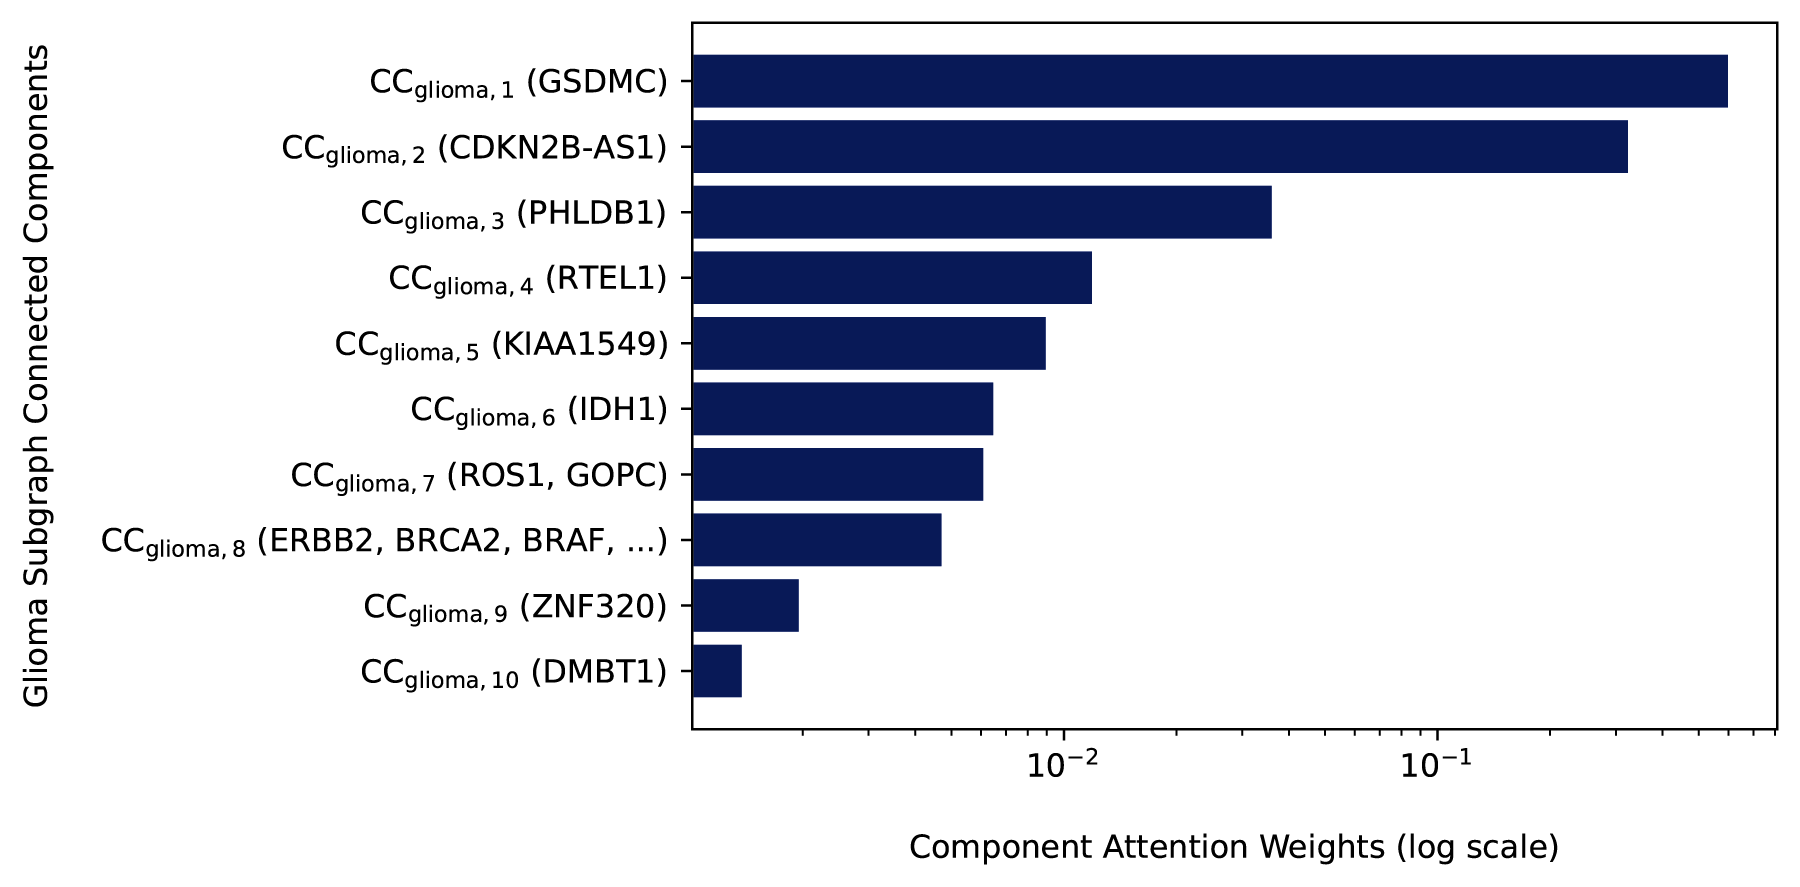
Top 10 connected components from the glioma subgraph
The highest-weighted connected component contains the gene GSDMC (Gasdermin C). Although GSDMC has not been widely recognized in canonical glioma signaling pathways, recent findings suggest that it may play a critical regulatory role via pyroptosis. In particular, a study has shown that under hypoxic conditions, programmed death-ligand 1 (PD-L1) and phosphorylated STAT3 can transcriptionally activate GSDMC, leading to a shift in tumor cell death from apoptosis to pyroptosis (Hou et al., 2020). This regulatory switch has implications for tumor progression, immune evasion, and therapeutic resistance, which are all central challenges in glioma. As a result, the model’s prioritization of GSDMC supports its potential as a noncanonical but functionally significant contributor to glioma biology. The second-highest weighted connected component includes CDKN2B-AS1, a long noncoding RNA that regulates cell cycle progression and senescence through multiple cell cycle-related pathways (Rathi et al., 2020). In the context of glioma, CDKN2B-AS1 is upregulated and promotes tumor cell proliferation and invasion by regulating the miR-199a-5p/DDR1 axis (Lu et al., 2022). Collectively, these findings show that FDS-CAP highlights biologically meaningful substructures by prioritizing the connected components that are most informative within the glioma subgraph and are not typically emphasized by canonical glioma enrichment analyses.
Several moderately weighted connected components also include genes with established relevance to glioma. For instance, high expression of RTEL1 is associated with telomere elongation and poor prognosis in glioma patients, especially in patients with wild-type telomerase reverse transcriptase. RTEL1 promotes tumorigenesis by increasing glioma cell proliferation, migration, and invasion through activation of the ROS-mediated JNK/ELK1 signaling cascade (Wang et al., 2024). Similarly, IDH1 is a well-characterized glioma driver that disrupts cellular metabolism and induces widespread epigenetic alterations (Ward et al., 2010; Turcan et al., 2012).
Finally, while the lower-weighted connected components among the top 10 contain broadly oncogenic genes such as ERBB2, BRCA2, and BRAF, their limited contributions to the glioma subgraph representation suggest that the model effectively distinguishes glioma-specific mechanisms from more ubiquitous cancer signals. This distinction is critical for accurate comorbidity prediction and disease-specific subgraph characterization. In summary, the glioma case study underscores FDS-CAP’s potential to uncover biologically significant, non-canonical signals from fragmented disease subgraphs via component-level attention over topology-aware representations of their connected components.
In this study, we introduce FDS-CAP, a novel graph-based deep learning framework that addresses the challenge of modeling fragmented disease subgraphs for comorbidity prediction. FDS-CAP treats each disease subgraph as a collection of connected components and applies component-level representation learning via SUBGNN. The framework incorporates multiple property-aware channels—position, neighborhood, and structure—to capture the topological characteristics of each connected component, while prioritizing those with higher biological relevance to generate informative disease embeddings. These embeddings are then passed to the variational comorbidity predictor, which leverages the HDN to infer latent disease relationships and predict comorbid associations among them. Our approach achieves strong predictive performance, outperforming existing methods, particularly in settings that preserve network complexity and biological nuance. While FDS-CAP effectively integrates component-level attention across multiple channels, the relative contribution of each channel to the overall weighting of connected component embeddings remains an open question. In future work, we aim to disentangle and assess the individual impact of each channel on the attention weights and the resulting disease embeddings. Such analysis may offer deeper biological interpretability and help reveal which topological features are most informative for learning these embeddings and, consequently, the disease comorbidity prediction.
CODE AND DATA AVAILABILITY
The source code and data required to reproduce the comorbidity prediction experiments are publicly available at https://github.com/Ashwag-ta/FDS_CAP.
Footnotes
AUTHOR DISCLOSURE STATEMENT
No interests to disclose.
FUNDING INFORMATION
No funding was received for this article.
Supplemental Material
References
Supplementary Material
Please find the following supplemental material available below.
For Open Access articles published under a Creative Commons License, all supplemental material carries the same license as the article it is associated with.
For non-Open Access articles published, all supplemental material carries a non-exclusive license, and permission requests for re-use of supplemental material or any part of supplemental material shall be sent directly to the copyright owner as specified in the copyright notice associated with the article.