
Abstract
PHRED scores are confidence values associated with each basecall generated by sequencers. The score is defined as a monotonic function of the probability that the basecall is incorrect. The calibration of PHRED scores has previously been examined by evaluating errors made in reading known sequences. We investigated the calibration of the Illumina MiSeq instrument PHRED model using data from a large dataset. We also derive calibration methods for the PHRED scores in datasets similar to those produced by the Global Hepatitis Outbreak and Surveillance Technology (GHOST). The GHOST protocol uses a short amplicon, resulting in many positions having two base calls, one coming from each of the paired reads. A maximum likelihood model of redundant base calls that match each other was used to estimate corrected probabilities of the PHRED scores. The PHRED scores showed only small absolute deviations from their target values. These differences are statistically significant deviations (
INTRODUCTION
Viral hepatitis represents a significant public health challenge. In 2017, the National Academies of Science, Engineering, and Medicine released a strategy for the elimination of hepatitis B and C viruses (HBV, HCV) from the United States. Associated recommendations included working with states to improve viral hepatitis screening and information collection (Buckley and Strom, 2017).
The Global Hepatitis Outbreak and Surveillance Technology (GHOST) system is a program of the Centers for Disease Control and Prevention (CDC) to address the enhanced hepatitis screening recommendation. GHOST is an epidemiological decision support and molecular data collection system. The system clusters related cases, allowing the source tracing of hepatitis outbreaks. It also highlights unusual situations useful for epidemiological investigations, such as superinfections of HCV, which are transient phenomena that are only regularly observable in high-risk environments such as injection drug use. GHOST uses a deep-amplicon-based sequencing protocol that targets a region of the HCV genome called hypervariable region 1 (HVR1; Longmire et al., 2017). The sequencing protocol is intended to sample the structure of the intra-host HCV population found in a sample. To do so, we have developed an error-correction and filtering pipeline that uses a 2 × 300 bp sequencing kit on an amplicon with a design length of 264. Therefore, many bases of each molecule are sequenced twice, once in the first read and once in the second read.
As part of each cycle, the sequencing machine estimates a confidence value known as the PHRED score, which is output along with the base call. Originally developed for Sanger Sequencing, the PHRED score is defined in Equation 1 where p is the estimated probability that a base was called incorrectly (Ewing and Green, 1998) (Ewing et al., 1998).

For such a binary confidence value to be calibrated, the events that are assigned a probability of 30% should have a long-run error frequency of 30% (Dawid, 1982). The most direct method of evaluating the calibration of the PHRED scores involves measuring substitution errors made in a known sequence. This has been used by Schirmer et al. (2015) to measure the calibration of sequencing amplicons on the MiSeq instrument. These experiments are useful in characterizing the MiSeq instrument, but they rely on a known ground truth of the sequences. Such experiments are not commonly performed because they do not produce other information. Examination of the overlap of paired end sequences has been used to evaluate the overall usefulness of quality scores by Eren et al. (2013). Their article developed an error filtering method based on overlapping reads matching across the entire overlap length. However, they did not investigate the quality scores themselves, instead examining how quality score-based read filtering methods changed the fraction of reads that merged using their criteria. Zhang et al. (2017) developed a method for estimating the PHRED values from raw data generated during HiSeq operation. Their method used runs of phiX174 sequences as known sequences. Illumina MiSeq uses PhiX174 to increase the complexity of the sequences on the chip to improve cluster detection in the raw image data captured from the flow cell. Errors were identified using a short-read alignment to the phiX174 genome. They compared base calls with the known phiX174 sequence, detected errors, and subsequently evaluated their new scoring method with the Illumina HiSeq built-in method. The Zhang et al. method used several features from the raw data used by the on-instrument base calling process, which is not available in our datasets, as we only receive the base calling results.
As GHOST reads purposefully overlap, every sample sequenced by the GHOST protocol provides a natural indirect experiment in the calibration of the PHRED scores. Analyzing the intentional overlap of paired reads allows for the isolation of sequencing errors from errors incurred during library construction. This is a significant advantage over existing methods that conflate the two error sources. GHOST is accepting sequences from multiple MiSeq instruments and has accumulated many runs using the overlapping protocol. These datasets provide an opportunity to measure the distributions of many features of the performance of the Illumina MiSeq instrument under varying conditions.
As an automated system making important public health recommendations, GHOST must be able to determine the quality of the data that motivates these recommendations. The authors have published two articles describing the specifics of sequencing quality monitoring Longmire et al. (2017) and Sims et al. (2018). At multiple points along the quality control pipeline, a sample can be rejected, and a suggestion is returned to the user on what likely caused the rejection and how to improve the sequencing quality. The reads are subjected to steps such as verifying sequence identifiers, verifying the expected primers, merging reads, checking for open reading frames, and a genotyping step, which rejects samples that cannot be assigned clearly to a subtype.
In this study, we intend to assess how accurate the MiSeq’s internal error model, its calibration, and its usefulness for discrimination of sequencing errors using observations of overlapped paired-end reads. A maximum likelihood (ML) method of estimating the long-run error rate of sequencing errors indexed by machine-assigned PHRED scores is developed. We find that the PHRED scores are not calibrated, but the size of the error is small in most cases. However, the MiSeq error model does not separate sequencing errors from adjacent correct base calls, even though the assigned PHRED scores reflect the long-term error rate of the base call.
Data
Sequence data used in our analyses were deposited in the NCBI Short Read Archive (SRA) under BioProject accession PRJNA580030 during 2019–2023 by the GHOST Team, Division of Viral Hepatitis, CDC. These data were generated using blood samples positive for HCV RNA tested by the GHOST team during 2016–2019 while operating the GHOST system. Blood specimens submitted by various GHOST system users (e.g., state health departments) were sequenced to generate HVR1 gene sequencing data using the Illumina MiSeq sequencing platform and the standard GHOST HVR1 sequencing protocol (Longmire et al., 2017).
Data cleaning
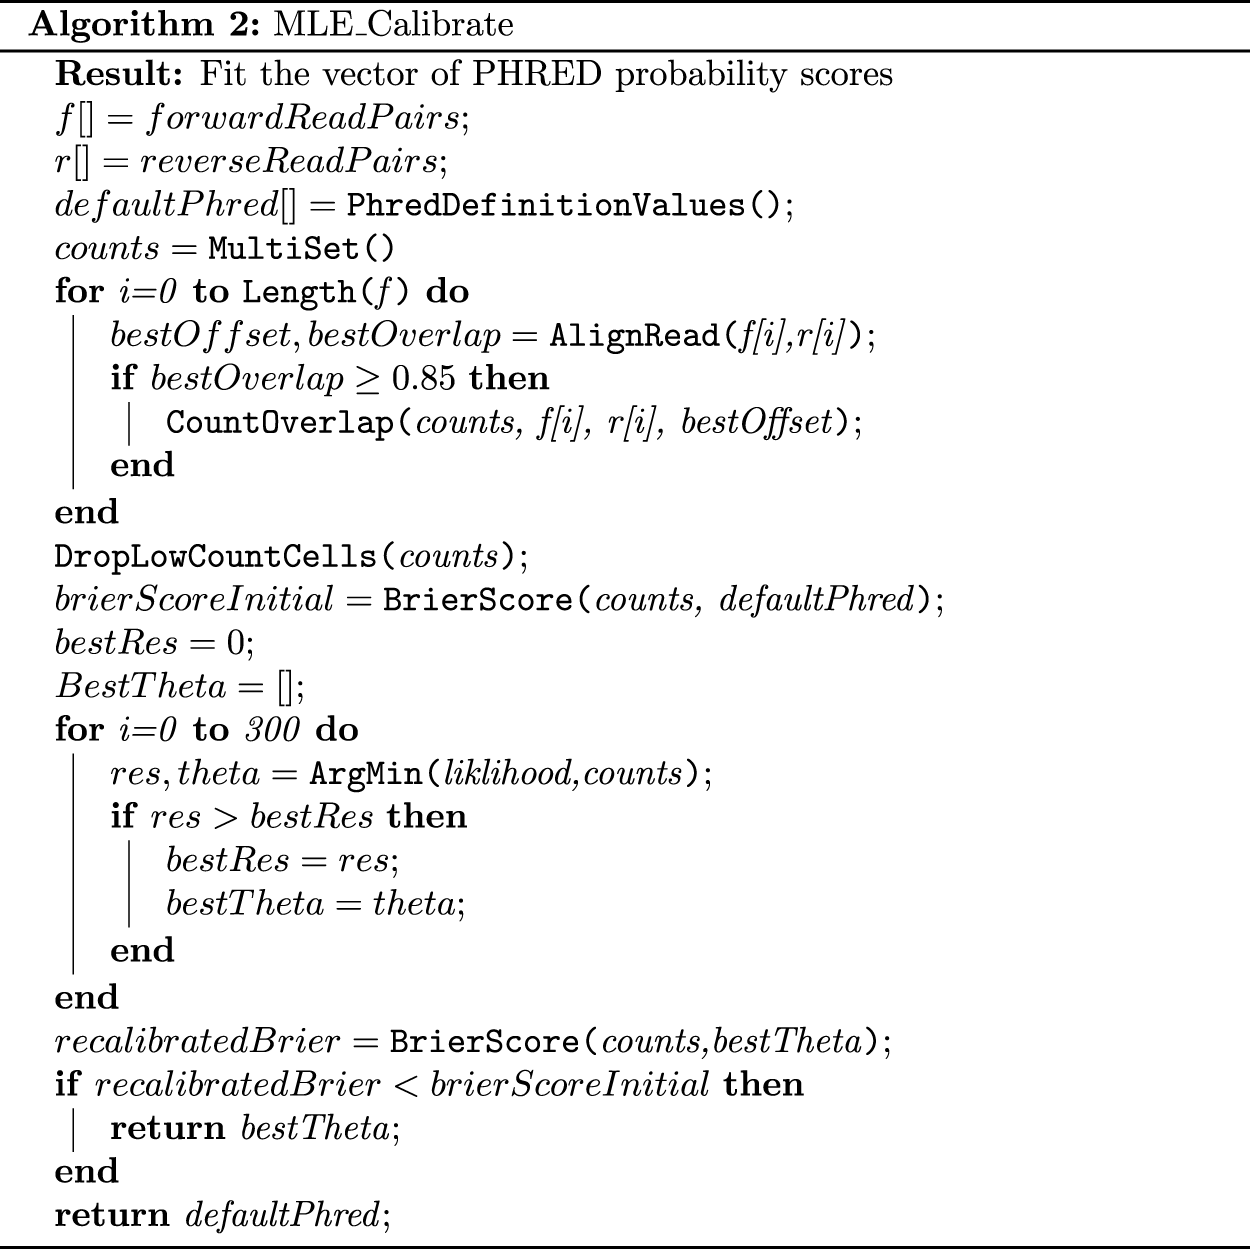
The reads were filtered by discarding pairs where either read was shorter than 200 bp, contained ambiguous bases, or did not have the expected amplification primer sequences. The paired reads were then aligned to each other with a simple alignment as outlined in Algorithm 1. The minimum overlap length accepted was 10 bp to avoid misassemblies. Read pairs that did not have at least 85% matching base pairs in the overlapping region were discarded. Runs that did not have at least 10,000 reads assembled were discarded.
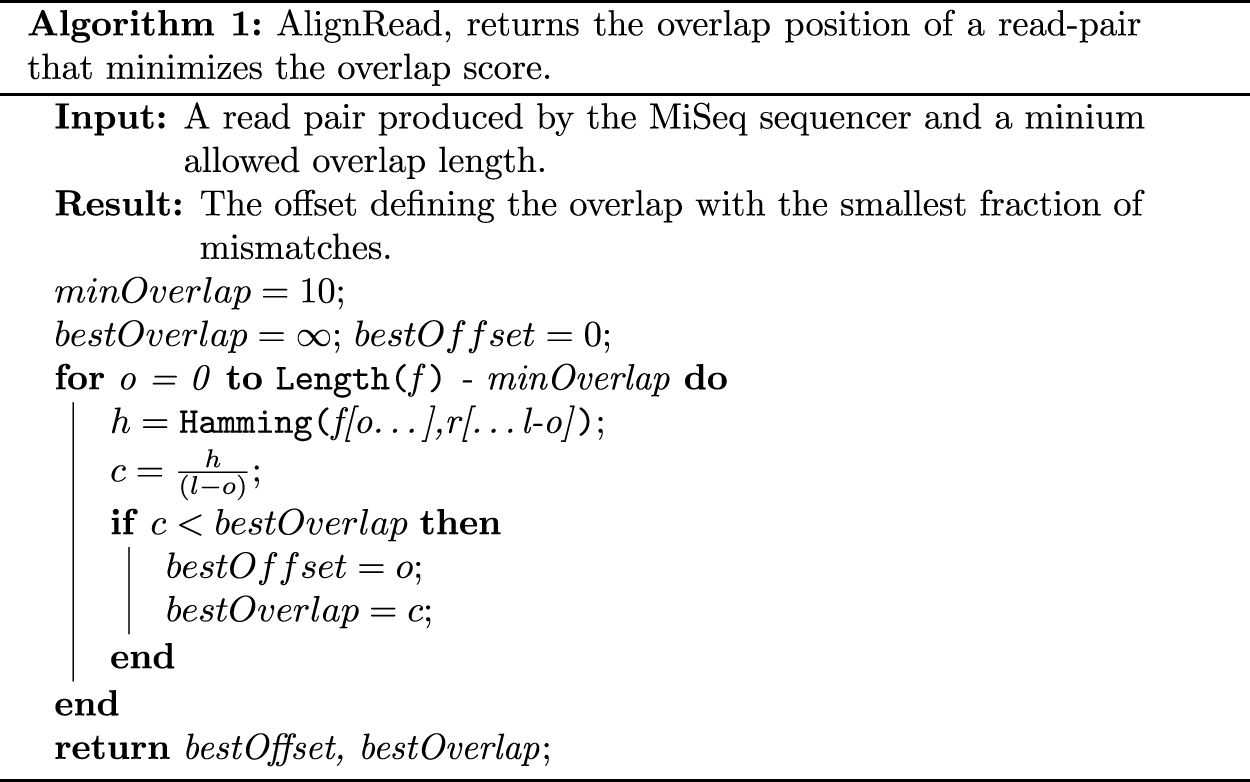
We ignore indel errors in our alignment of the paired reads, as the MiSeq instrument’s technology produces these only rarely. These filtering steps parallel the error correction and filtering methods used in the GHOST pipeline (Longmire et al., 2017).
Forecast of match from PHRED scores
A probability of base calls matching can be derived given PHRED scores of two overlapping reads, as in Edgar and Flyvbjerg (2015):

PHRED scores serve as indicators of the error rates associated with base calls in DNA sequencing. These scores allow for the calculation of matching probabilities, as described in Equation 2. Consequently, they can also be used to assess the likelihood of overlapping base calls matching. To evaluate the quality of such probabilistic binary forecasts, classification loss functions like the Brier score can be employed (Brier, 1950).

REL is the difference between the forecast in the bin and the observed probability in that bin. It represents the error added by the miscalibration of the forecasting method itself. RES measures how well the forecast method matches events with different probabilities to bins. This is the reduction of the Brier score value by using the forecast over just using the average error of all events. UNC is related to the overall predictability of events. It is the Brier score for the baseline if the long-term frequency of the events is used rather than the forecasting method under study (Murphy, 1973).
Examining the magnitude of the three components can give an impression of the source of error in a forecast. In the case where


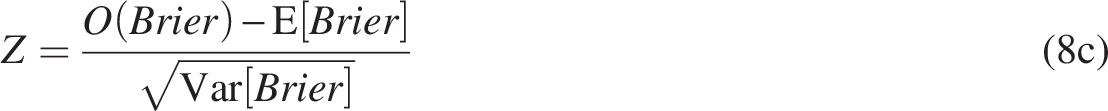
Spiegelhalter (1986) developed a z-statistic for the Brier score (Eq. 8)). This statistic is used to detect miscalibration of a particular forecasting method.


The Poisson binomial distribution is a discrete probability distribution of the number of independent Bernoulli trials when the probability of success at each trial varies (Wang, 1993). The Poisson binomial distribution is used to estimate the expected number of matches predicted by the PHRED scores of a particular database of reads using equation 9 (Edgar and Flyvbjerg, 2015).

The method of ML was used to estimate the true value of the PHRED score probabilities. Each pair of PHRED scores observed was assumed to follow an independent binomial distribution, with the probability of success being

The behavior of this estimator was investigated by attempting to recover the known ground truth of the simulated data.
The average of the estimates and their 95% confidence intervals were plotted for all datasets.
Generation of simulated data
To assess the performance of the methods developed in this article, we created a mock data tool. The tool uses real datasets as input and creates mock datasets, taking every
Plotting and analysis
All plots and analyses were generated using Python 2.7, Matplotlib (Hunter, 2007), SciPy 0.19.0, NumPy 1.13.3, Pandas 0.20.2 (McKinney et al., 2010), and Seaborn 0.7.1 (Waskom et al., 2017).
RESULTS
Statistics of MiSeq instrument sequencing
We examined 91 MiSeq instrument runs produced by 17 different MiSeq instruments that contain
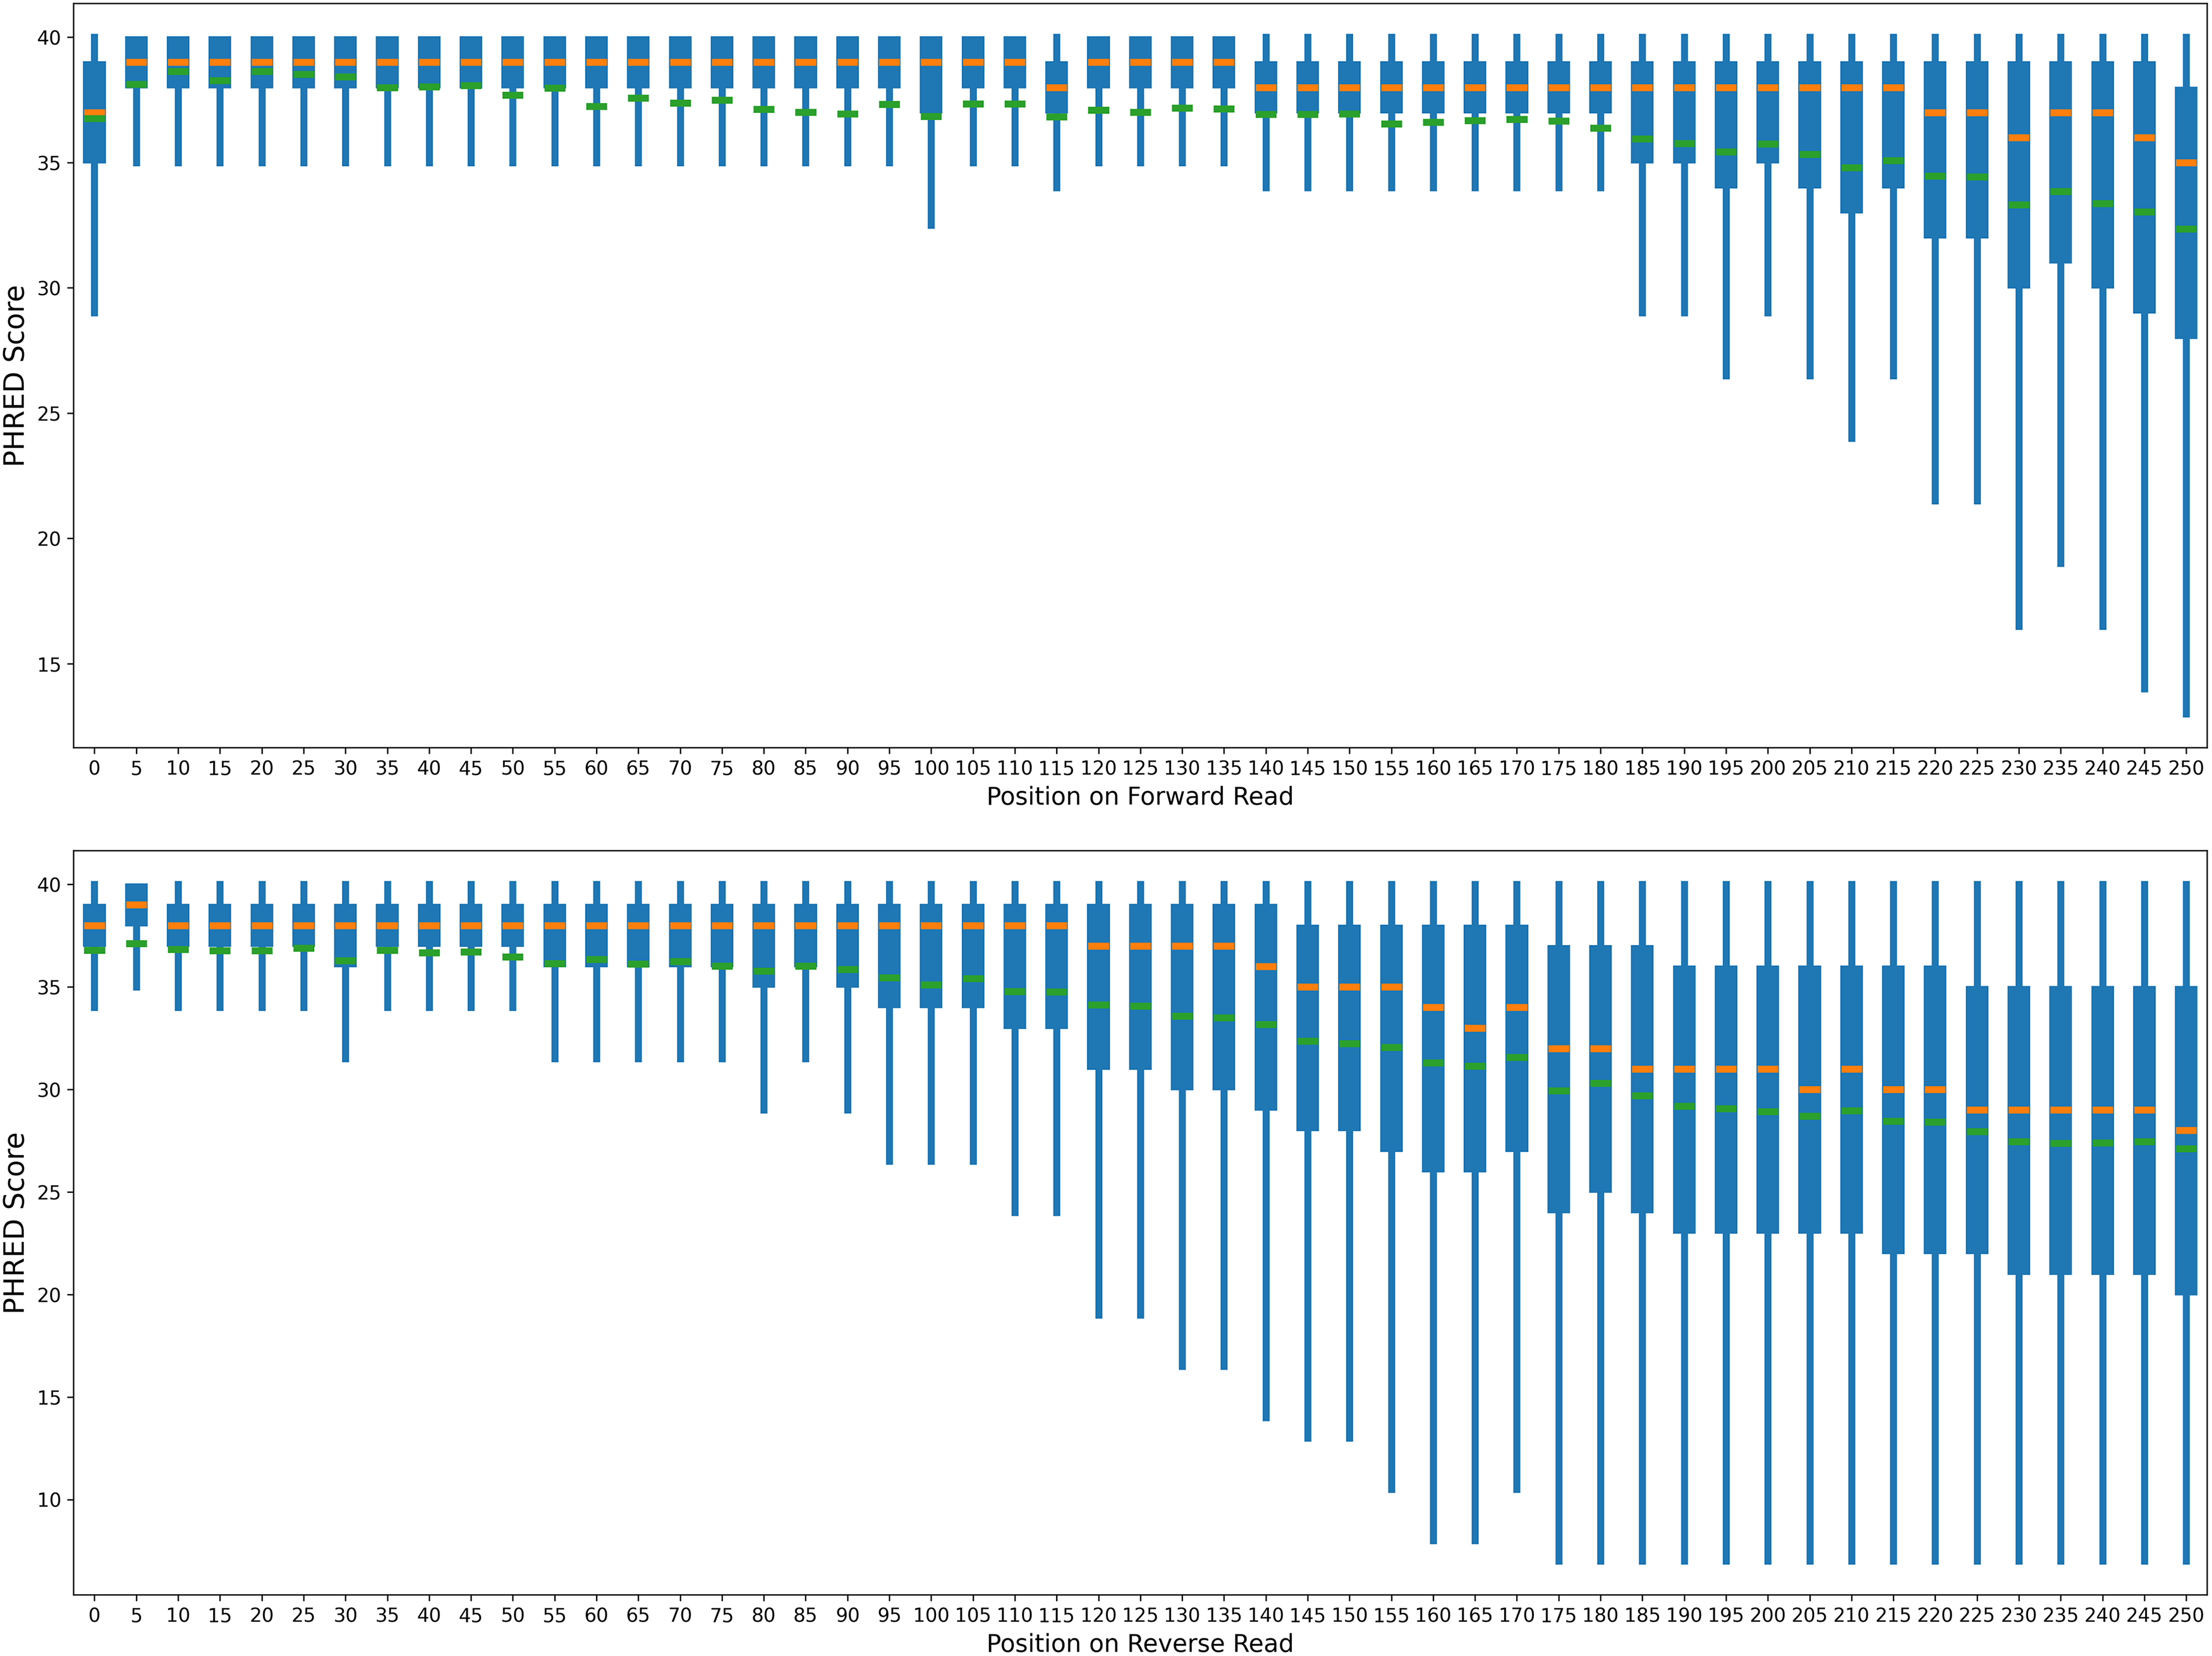
Quality score distribution by position. Orange bars are the median PHRED score, and green bars are the mean score.
Filter Statistics
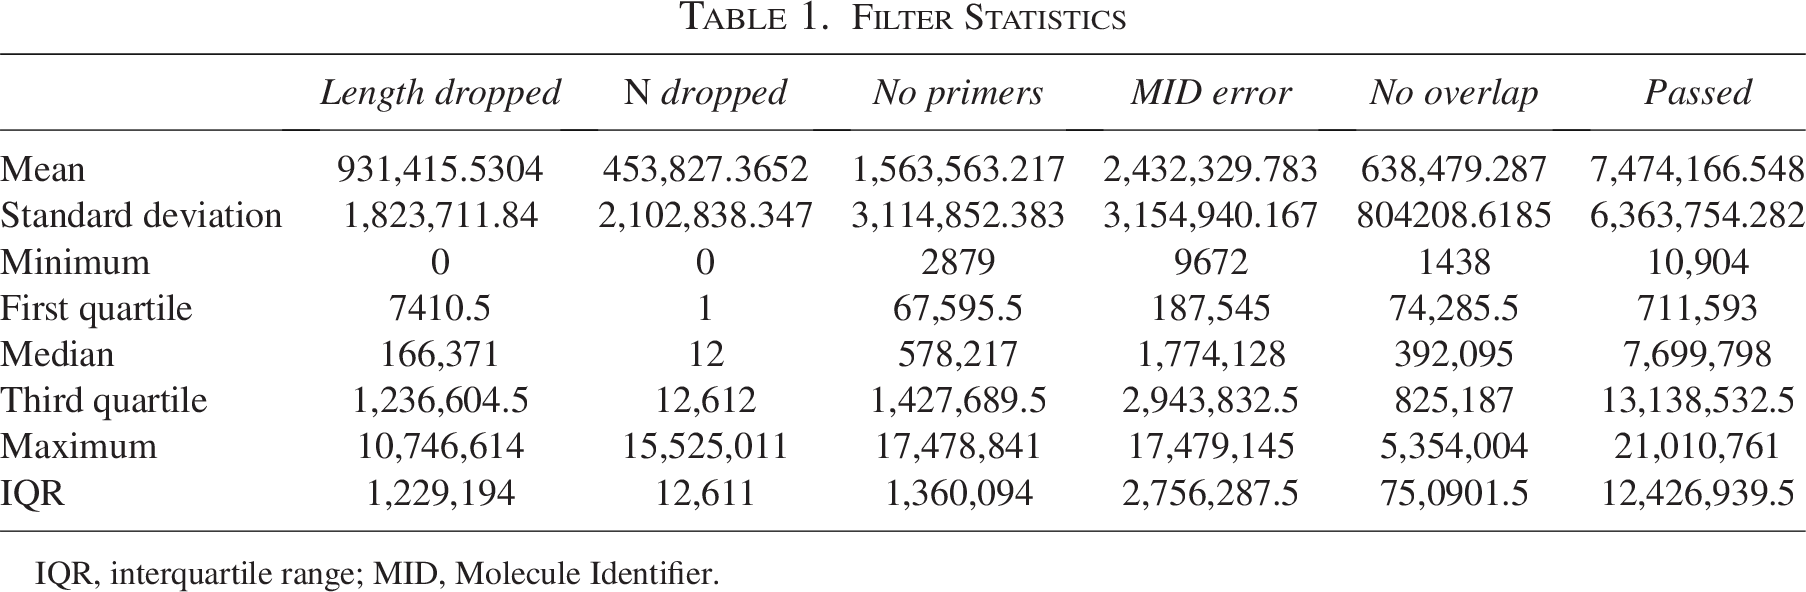
IQR, interquartile range; MID, Molecule Identifier.
The total proportions of matching base calls varied significantly by run, indicating different average qualities of each run. In general,
PHRED scores were found not to be calibrated
Difference between measured probability of matching (
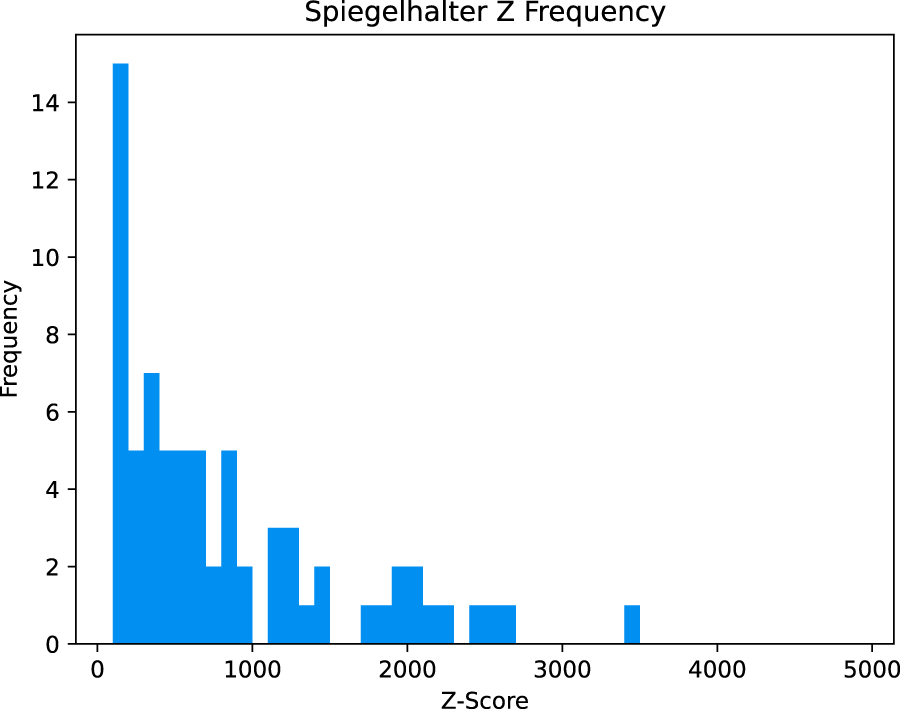
Histogram of Spiegelhalter’s z-score across all datasets.
The Brier score decomposition showed the amount of improvement in the predictive accuracy of matching by using the PHRED scores. In all but two cases examined, the uncorrected quality scores are useful with
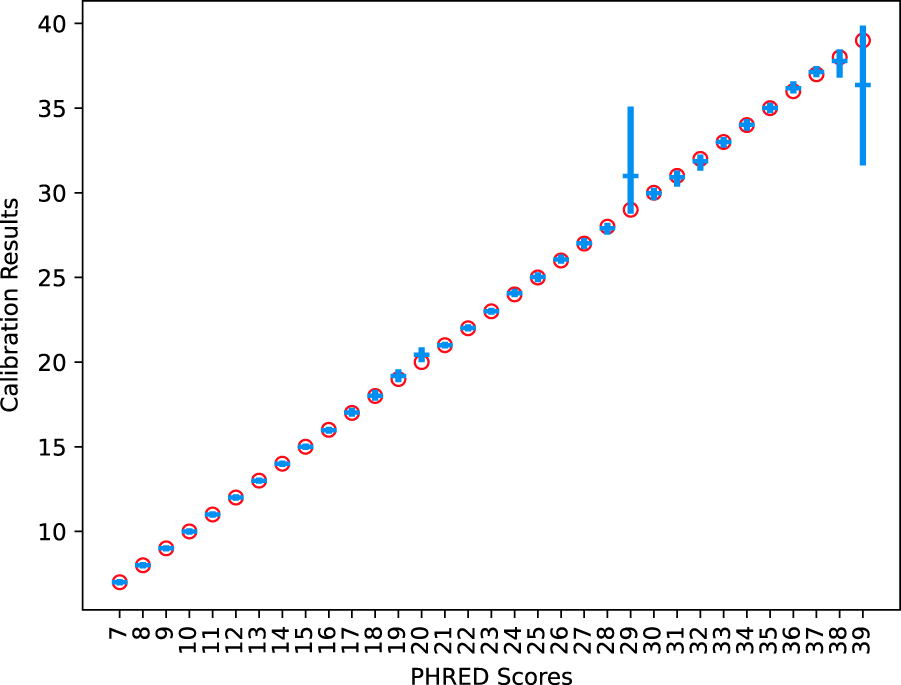
The described ML estimator was able to recover the ground truth of the simulated data with reasonable accuracy (Fig. 4). The 95% confidence intervals of each PHRED value were found to contain the true known value. Regression of real data showed several points of miscalibration in the MiSeq instrument’s PHRED estimation (see Fig. 5). Brier scores improved by an average of
Average regressed values of simulated perfectly calibrated data with 95% confidence intervals. The red circles are the correct values defined for the PHRED score.
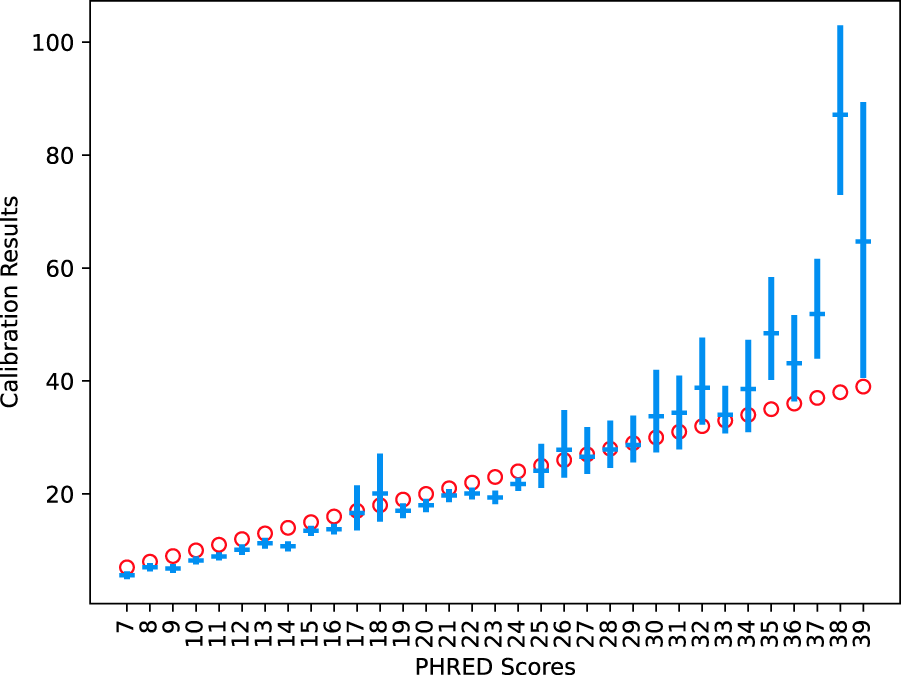
Average regressed values of data with 95% confidence intervals. The red circles are the correct values defined for each PHRED score.
We find that the PHRED scores produced are not calibrated, but the absolute size of the error is small. Our MLE calibration method successfully corrected the error as much as possible using the features examined. To improve calibration further, additional features such as per-nucleotide biases or raw intensities would need to be utilized. However, the MLE model does not always improve the calibration, but this can be detected by examining the change in the Brier score achieved.
Although quality scores are accurate to their definition, their resolution (RES) scores are small relative to the total Brier score. The quality scores assigned are relatively accurate in predicting the error rate of the base calls. The base call procedure cannot separate correct calls from substitution errors. It tends to assign substitution errors of similar quality to the surrounding correct base calls. Given the low substitution rate of the MiSeq instrument, this is a relatively calibrated methodology, but it means that the PHRED scores are uninformative of sequencing errors.
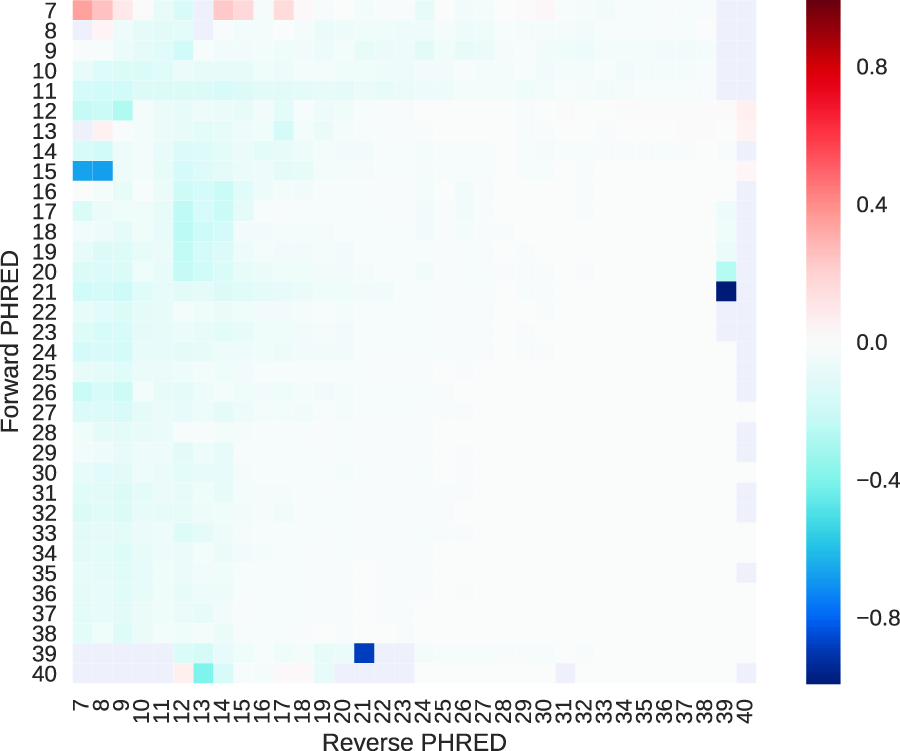
The MiSeq instruments use two different light colors with four filters to perform base calling. Base calls generated by the same laser channel are significantly more likely to be substituted for each other than base calls generated by different channels. We note that in
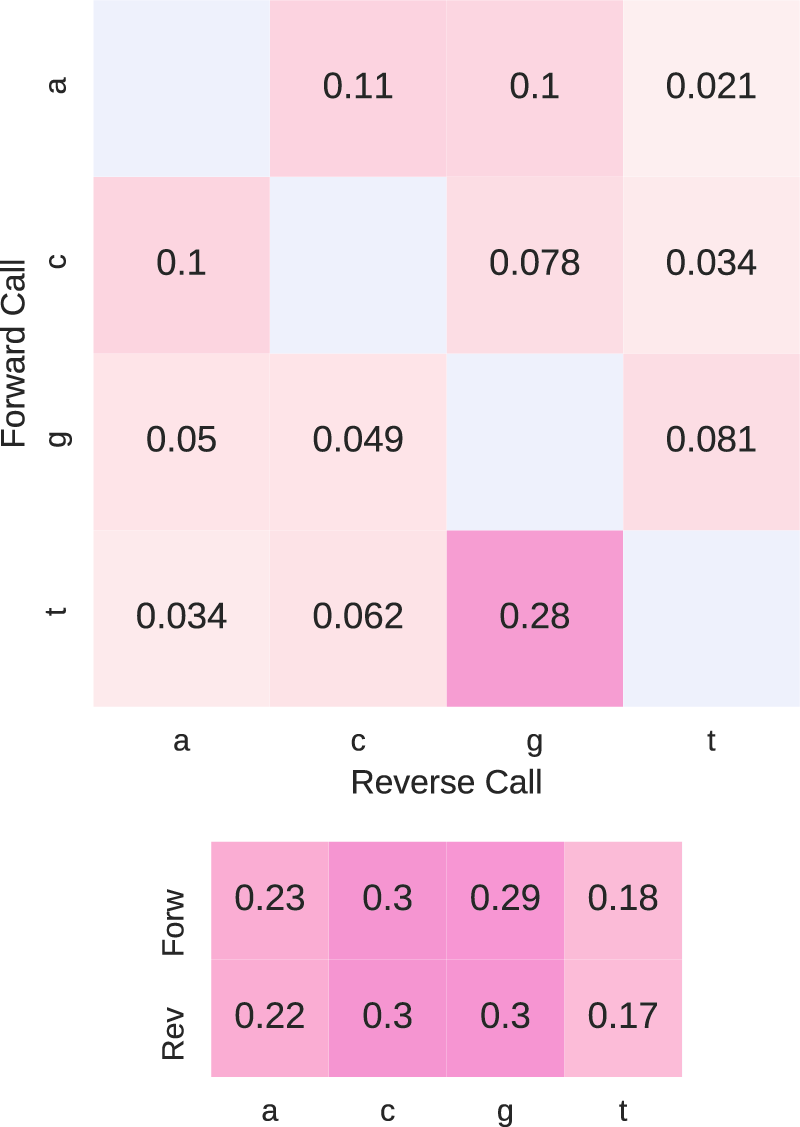
The large matrix is the proportion of each mismatched paired base calls. The smaller matrix is the nucleotide composition of each read. The high GC content of the nucleotide composition is similar to that reported by Powdrill et al. (2011) for hepatitis C virus.
Most of the findings reported in this article were foreshadowed by Schirmer et al. (2015), Eren et al. (2013), and Zhang et al., (2017). Eren et al. (2013) addressed quality scores’ effects on downstream analysis and not the quality scores themselves. They found that even reads with consistently high-quality scores contained many mismatched base calls in their overlap. Schirmer et al. (2015) and Zhang et al. (2017) analyzed the quality scores directly. No direct comparison was made between our method and the method of Zhang et al. because it uses raw instrument intensities, which are not provided to the GHOST system. Schermer et al. use mock communities of known sequences to measure errors, as our dataset does not contain known sequences, we also did not do a direct comparison to this method. These methods could not separate errors in library preparation from sequencing errors. The greatest strength of our analysis is its ability to separate these two sources of error, leading to subtly different results. We found greater agreement between the measured PHRED scores and their true values than those found by Schirmer et al. (2015). Contrary to their results, we found that the high-quality scores seemed to underestimate the true quality of the base calls. We attribute the errors they measured to library preparation. We agree with both Schirmer et al. (2015) and Eren et al. (2013) that PHRED scores are of limited value in identifying substitution errors.
The MLE model is capable of removing the majority of calibration errors from quality scores. In two runs, the prediction error was increased by the MLE estimator. We believe that this is due to the optimization function getting stuck in a local maximum of the likelihood function.
Recalculating the Brier scores with the newly calibrated values produced an average relative improvement of
As part of the current quality control process, the CASPER method is used to merge the overlapping paired reads (Kwon et al., 2014). By collecting statistics during this step, the calibration of PHRED scores can be included with only minimal extra processing time of less than a second per sample. A new haplotyping method using calibrated PHRED scores is being developed to be published at a later date. The accuracy of PHRED score calibration is important to improve the calling of rare variants, to which GHOST clustering is very sensitive. Currently, GHOST employs a simple method of excluding low-reliability haplotype calls; haplotypes observed fewer than 10 times are excluded. Using the calibrated PHRED scores, we can reach more deeply into the low-frequency tail of haplotypes to include rarer haplotypes in our analysis.
We also intend to further develop the methods presented in this article to provide additional quality monitoring of the sequencing of GHOST submissions (Sims et al., 2018). The new quality monitoring will include new quality control thresholds and suggestions for the laboratory process. GHOST currently requires a variant to be seen 10 times or more in a dataset to be used in clustering.
PHRED scores are generally accurate on the basis of their ability to predict matching. Although the Spiegelhalter z-statistic showed that the scores were not calibrated
AUTHORS’ CONTRIBUTIONS
S.S.: Conceptualization, methodology, software, formal analysis, data curation, writing—original draft, and visualization. Y.K.: Writing—review and editing, project administration, and supervision. A.Z.: Writing—review and editing, project administration, and supervision.
DISCLAIMER
The findings and conclusions in this article are those of the authors and do not necessarily represent the official position of the U.S. CDC.
AVAILABILITY OF DATA AND MATERIALS
The data used in our analyses are deposited in and can be downloaded from the NCBI SRA under BioProject accession PRJNA580030.
Footnotes
ACKNOWLEDGMENTS
The authors are deeply indebted to all members of the GHOST team who contributed to this project and to members of the GHOST Project laboratories for providing data. The authors thank Eldin Talundzic (Center for Global Health Office of the Director, CDC) for editing suggestions. The authors are also very grateful to the NCHHSTP Informatics Office for their constant help with the GHOST portal website. The authors are also very grateful to the CDC’s ITSO DSO office for their indispensable help with the information technology infrastructure of the GHOST analysis platform.
AUTHOR DISCLOSURE STATEMENT
The authors declare that they have no competing interests.
FUNDING INFORMATION
The work was partially supported by the Advanced Molecular Detection program (Office of Infectious Diseases, Centers for Disease Control and Prevention). The GHOST project is also the recipient of the “2015 CDC Surveillance Strategy Innovation Project Award” from the CDC Health Information Innovation Consortium (CHIIC, Office of Public Health Scientific Services). NCHHSTP Informatics Office provided funding and technical resources in support of the GHOST Web User Interface and the middle-tier processes that interface with Amazon’s AWS and the GHOST computational platform.