
Abstract
Principal component analysis (PCA) is one of the most frequently used dimensionality reduction methods for high-dimensional datasets, especially single-cell RNA sequencing (scRNA-seq). Despite its popularity, PCA faces challenges, particularly related to its performance degrading as the dataset size increases. Additionally, PCA is sensitive to outliers and assumes linearity. Random projection (RP) methods have emerged as a promising alternative to address several of PCA’s limitations. In this study, we conduct a systematic and comprehensive evaluation of PCA and RP methods, including singular value decomposition (SVD) and randomized SVD approaches, against multiple RP methods including sparse random projection, Gaussian random projection, and we introduce a Matching Sparsity Random Projection algorithm that adaptively calibrates projection matrix density according to input data sparsity patterns, emphasizing both computational scalability and effectiveness in downstream analytical tasks. We evaluated these methods on multiple publicly available scRNA-seq datasets that include both labeled and unlabeled scenarios. Clustering performance is assessed using Hierarchical Clustering and Spherical K-Means algorithms, with labeled datasets evaluated through Hungarian algorithm accuracy and Mutual Information metrics. For unlabeled datasets, we used the Dunn Index and Gap Statistic to quantify cluster separation quality. Across both dataset types, the Within-Cluster Sum of Squares metric is used to assess variability. Moreover, locality preservation is examined, with RP methods, including our adaptive sparsity approach, outperforming PCA in several of the evaluated metrics. Our experimental results show that RP methods not only deliver substantial computational speed improvements over PCA but also rival, and in some cases, exceed PCA in preserving data variability and clustering quality. Through this comprehensive methodological comparison, our work provides critical guidance for selecting appropriate dimensionality reduction strategies that effectively balance computational demands, scalability requirements, and analytical quality in downstream analyses.
Keywords
BACKGROUND AND MOTIVATION
Single-cell RNA-seq (scRNA-seq) has transformed genomics research by providing gene expression profiling at the individual cellular level. This technology excels in revealing heterogeneity across cell populations within biological samples, offering critical perspectives on developmental processes, pathological mechanisms, and immunological responses (Tang et al., 2009; Saliba et al., 2014). Despite its advancements, scRNA-seq datasets, in particular their characteristic count matrices, exhibit inherent high-dimensionality and sparsity, creating substantial obstacles for computational analysis and biological interpretation (Andrews and Hemberg, 2018).
Dimensionality reduction represents an essential step in scRNA-seq analysis that projects high-dimensional data into a lower-dimensional latent space while preserving critical biological information. Nonlinear and distance-preserving approaches such as t-distributed stochastic neighbor embedding (tSNE) (Van der Maaten and Hinton, 2008) and Uniform Manifold Approximation and Projection (UMAP) (McInnes et al., 2018) emphasize maintaining local cellular relationships (i.e., inter-cell similarities), whereas alternative methodologies prioritize variance preservation and capture; principal component analysis (PCA) stands as one of the most extensively utilized approaches for this objective (Jolliffe and Cadima, 2016). PCA accomplishes dimensionality reduction through the identification of linear variable combinations (i.e., principal components) that maximize data variance retention. The method has demonstrated effectiveness across numerous scRNA-seq applications, including data visualization, cellular clustering, and developmental trajectory analysis (Van den Berge et al., 2020; Horning et al., 2018; Moussa and Măndoiu, 2021a).
Despite its extensive adoption, PCA has constraints when applied to large-scale, complex scRNA-seq datasets. PCA fundamentally assumes linear variable relationships and encounters difficulties capturing nonlinear patterns characteristic of biological systems, such as logistic (cell) population growths or gene regulatory switches, or other (Hinton and Salakhutdinov, 2006). Moreover, PCA demonstrates sensitivity to outliers and noise, both prevalent in scRNA-seq data due to variability and sparsity (Hubert et al., 2005; Zappia et al., 2017). Furthermore, PCA implementations typically demand intensive computational resources for large-scale datasets (Tian et al., 2019).
RP methods have gained recognition as viable alternatives to address these challenges. Based on the Johnson–Lindenstrauss lemma (Freksen, 2021), RP techniques achieve dimensionality reduction through data projection onto lower-dimensional subspaces using random matrices while striving to approximately maintain pairwise distance relationships (Bingham and Mannila, 2001). Although RP techniques have demonstrated success across machine learning and signal processing domains, their utilization in scRNA-seq analysis is only starting to gain attention.
Some studies have explored RP methods in computational biology with a focus on their use in visualization and deep learning applications; for example, (Tasoulis et al., 2018a) developed visualization techniques using ensemble-based multiple random projections combined with nearest neighbor search for 2D visualization of scRNA-seq data, as well as using RP for supervised learning tasks in (Tasoulis et al., 2018b), and more recently proposed using RP as a data augmentation strategy to boost neural network performance on high-dimensional data (Anagnostou et al., 2026). In (Vrahatis et al., 2019), a hybrid visualization method was proposed that combines random projections with geodesic distances and tSNE specifically for 2D visualization purposes. These approaches primarily focus on visualization tasks, training augmentation, or multistage deep learning pipelines and showcase the strength of RP techniques and their computational efficiency for handling large-scale complex datasets (Wan et al., 2020).
Here, we tackle another facet of RP’s strengths by evaluating RP as a dimensionality reduction method that rivals PCA approaches and delivers performance and processing time enhancements for downstream scRNA-seq unsupervised analysis tasks. Some existing studies in scRNA-seq have predominantly concentrated on comparing PCA with nonlinear dimensionality reduction methods, including tSNE and UMAP (Kobak and Berens, 2019; Becht et al., 2018). While PCA has undergone extensive benchmarking evaluation (Tsuyuzaki et al., 2020), these studies did not include RP methods, revealing a significant gap for exploring RP’s potential benefits in scRNA-seq data analysis. Notably, Xiang et al. conducted a comprehensive benchmarking study comparing 10 dimensionality reduction methods for scRNA-seq data, including PCA, ICA, ZIFA, GrandPix, tSNE, UMAP, DCA, scvis, VAE, and SIMLR, but did not include any random projection methods (Xiang et al., 2021). Comprehensive systematic benchmarking studies comparing PCA and RP methods remain absent from the literature.
Our work addresses these gaps by systematically comparing multiple RP variants (sparse random projection [SRP], Gaussian random projection [GRP], and our proposed Matching Sparsity approach) against PCA methods specifically for downstream clustering analysis across varying component dimensions. We focus on these methods since this is a meaningful benchmark evaluating two linear approaches and not nonlinear methods such as tSNE and UMAP. Our evaluation study can shed light not only on the time or computing complexity of implementations of PCA and RP-derived methods but also on their suitability for downstream analyses in scRNA-seq analysis workflows, which is the motivation for this work.
APPROACH
In this study, we systematically benchmark multiple PCA algorithms, including standard (or full) PCA and randomized SVD-based PCA, evaluated against several distinct RP methodologies including SRP and GRP extending the study from (Abdelnaby and Moussa, 2026). We also introduce a Matching Sparsity Random Projection approach that dynamically adapts projection matrix density to correspond with input data sparsity characteristics. We evaluate their computational efficiency and effectiveness in downstream analysis tasks using both labeled (i.e., with known ground truth of cell populations’ annotation) and unlabeled scRNA-seq datasets. By providing a comprehensive evaluation of PCA and RP methods, our work aims to:
Benchmark the practical time complexity of PCA methods (full SVD and randomized SVD) and RP methods (Sparse, Gaussian, and Matching Sparsity) to determine their scalability on increasingly large scRNA-seq datasets. Investigate the effectiveness of each method in downstream analysis, specifically clustering. Evaluate the effect of using various numbers of components on downstream analysis results. Evaluate each method’s ability to preserve data structure or locality as well as variability.
Clustering performance is evaluated using Hierarchical Clustering and Spherical K-Means algorithms. For labeled datasets, we measure clustering accuracy using the Hungarian algorithm and Mutual Information. For unlabeled datasets, we use the Dunn Index and Gap Statistic to assess cluster separation. We also examine the preservation of data variability using the WCSS metric.
Our findings (see sections 4 and 5) demonstrate that RP methods not only offer significant computational speed-ups over PCA but also rival and, in some cases, surpass PCA in preserving latent structure, enhancing clustering performance. This study expands the toolbox of dimensionality reduction techniques available for scRNA-seq data analysis and underscores the importance of method selection and evaluation in the face of growing data complexity.
As previously described, we evaluated two types of PCA: full SVD and randomized SVD, and two common RP techniques were explored: SRP and GRP. SRP uses sparse random matrices, leading to faster computations and reduced memory usage (Li et al., 2006). GRP employs dense random matrices with entries drawn from a Gaussian distribution, providing theoretical guarantees on distance preservation. All methods were applied across varying target component sizes. For the commonly targeted range (a few, e.g., 5–25 components), we varied our tests in steps of 1; for the less explored range (25–1000), we varied our tests in steps of 25. We evaluated the practical implementation, computational efficiency, and clustering performance of these methods using labeled and unlabeled scRNA-seq datasets as described in Section 3.3. Below, we give a summary of PCA and RP definitions when applied to scRNA-seq data:
PCA
Standard PCA
Standard PCA computes the principal components using the full SVD of the count matrix. Let
Randomized PCA
Randomized SVD-based PCA approximates the principal components efficiently by using randomization to reduce dimensionality, followed by computing the SVD. This method leverages a random Gaussian matrix
Random projection
RP methods reduce the dimensionality of data by projecting it onto a random lower-dimensional subspace and are thought to be computationally efficient while claiming to preserve the structure of high-dimensional data. The two RP methods evaluated are:
Sparse RP
Sparse RP uses a sparse random matrix
Gaussian RP
Gaussian RP uses a dense random matrix
Matching sparsity random projections
While the traditional RP methods use fixed sparsity parameters, we propose an approach that adapts the projection matrix sparsity to match the input data characteristics. The
Sparsity measurement
The sparsity of a matrix can be quantified through various measures. The most common approach is the
Matching sparsity random projections implementation
We first compute the density of the input matrix


Our study is set to explore these properties, strengths, and weaknesses of each of the five described methods in a practical scRNA-seq data setting.
Datasets
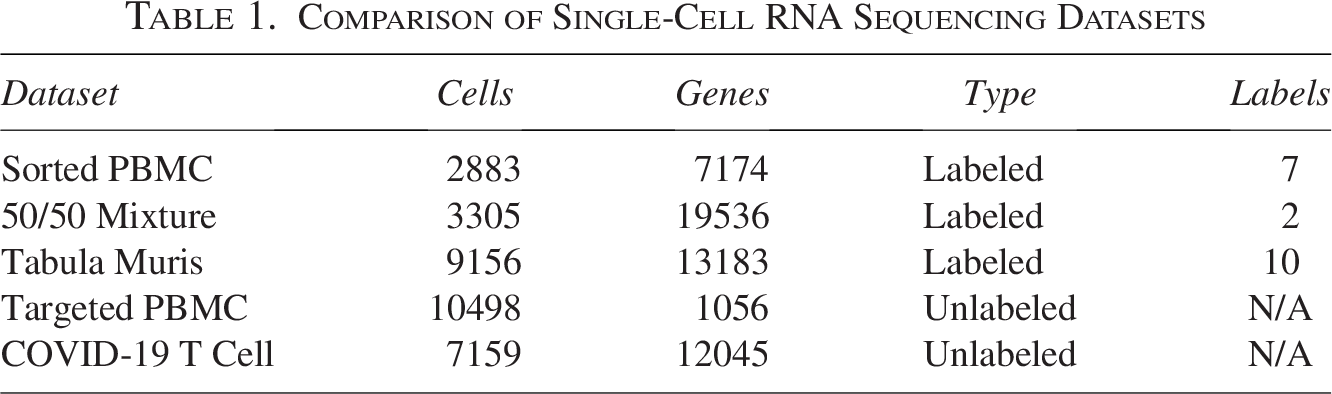
Five publicly available scRNA-seq datasets (see Table 1) were used to evaluate the effectiveness of the dimensionality reduction methods. These include:
Sorted PBMC Dataset (from Moussa and Măndoiu, 2021a): This dataset includes 2882 cells and 7174 genes and serves as a labeled set with 7 annotated distinct cell populations, providing a baseline for clustering methods.
The
As described in Section 2, clustering performance is evaluated using two clustering methods to evaluate PCA and RP robustness when controlling for the effect of the clustering algorithm:
To test the accuracy and effectiveness or quality of the clustering analysis as one of the main downstream analyses for scRNA-seq data, we measured the following metrics:


We also examine the preservation of data variability using the Within-Cluster Sum of Squares (WCSS) defined as:

To further assess our newly proposed Matching Sparsity in relevance to how well random projection methods preserve pairwise relationships within biologically meaningful cell populations, we performed a within-cluster distance distortion analysis. Consistent with the clustering evaluation, the cosine distance was also used for the distortion analysis. For each dataset, cells were first partitioned into relevant groups following ground-truth annotations (for labeled datasets) or hierarchical clustering (for unlabeled datasets). We then evaluated the cosine-based distortion metric independently within each cluster. For each pair of cells

Dimensionality reduction for downstream analysis
We examined two aspects of the dimensionality reduction properties of the examined methods: first, how they are used for visualizing the data, and second, and more importantly, how well cells cluster in the reduced low-dimensional space:
Visualization
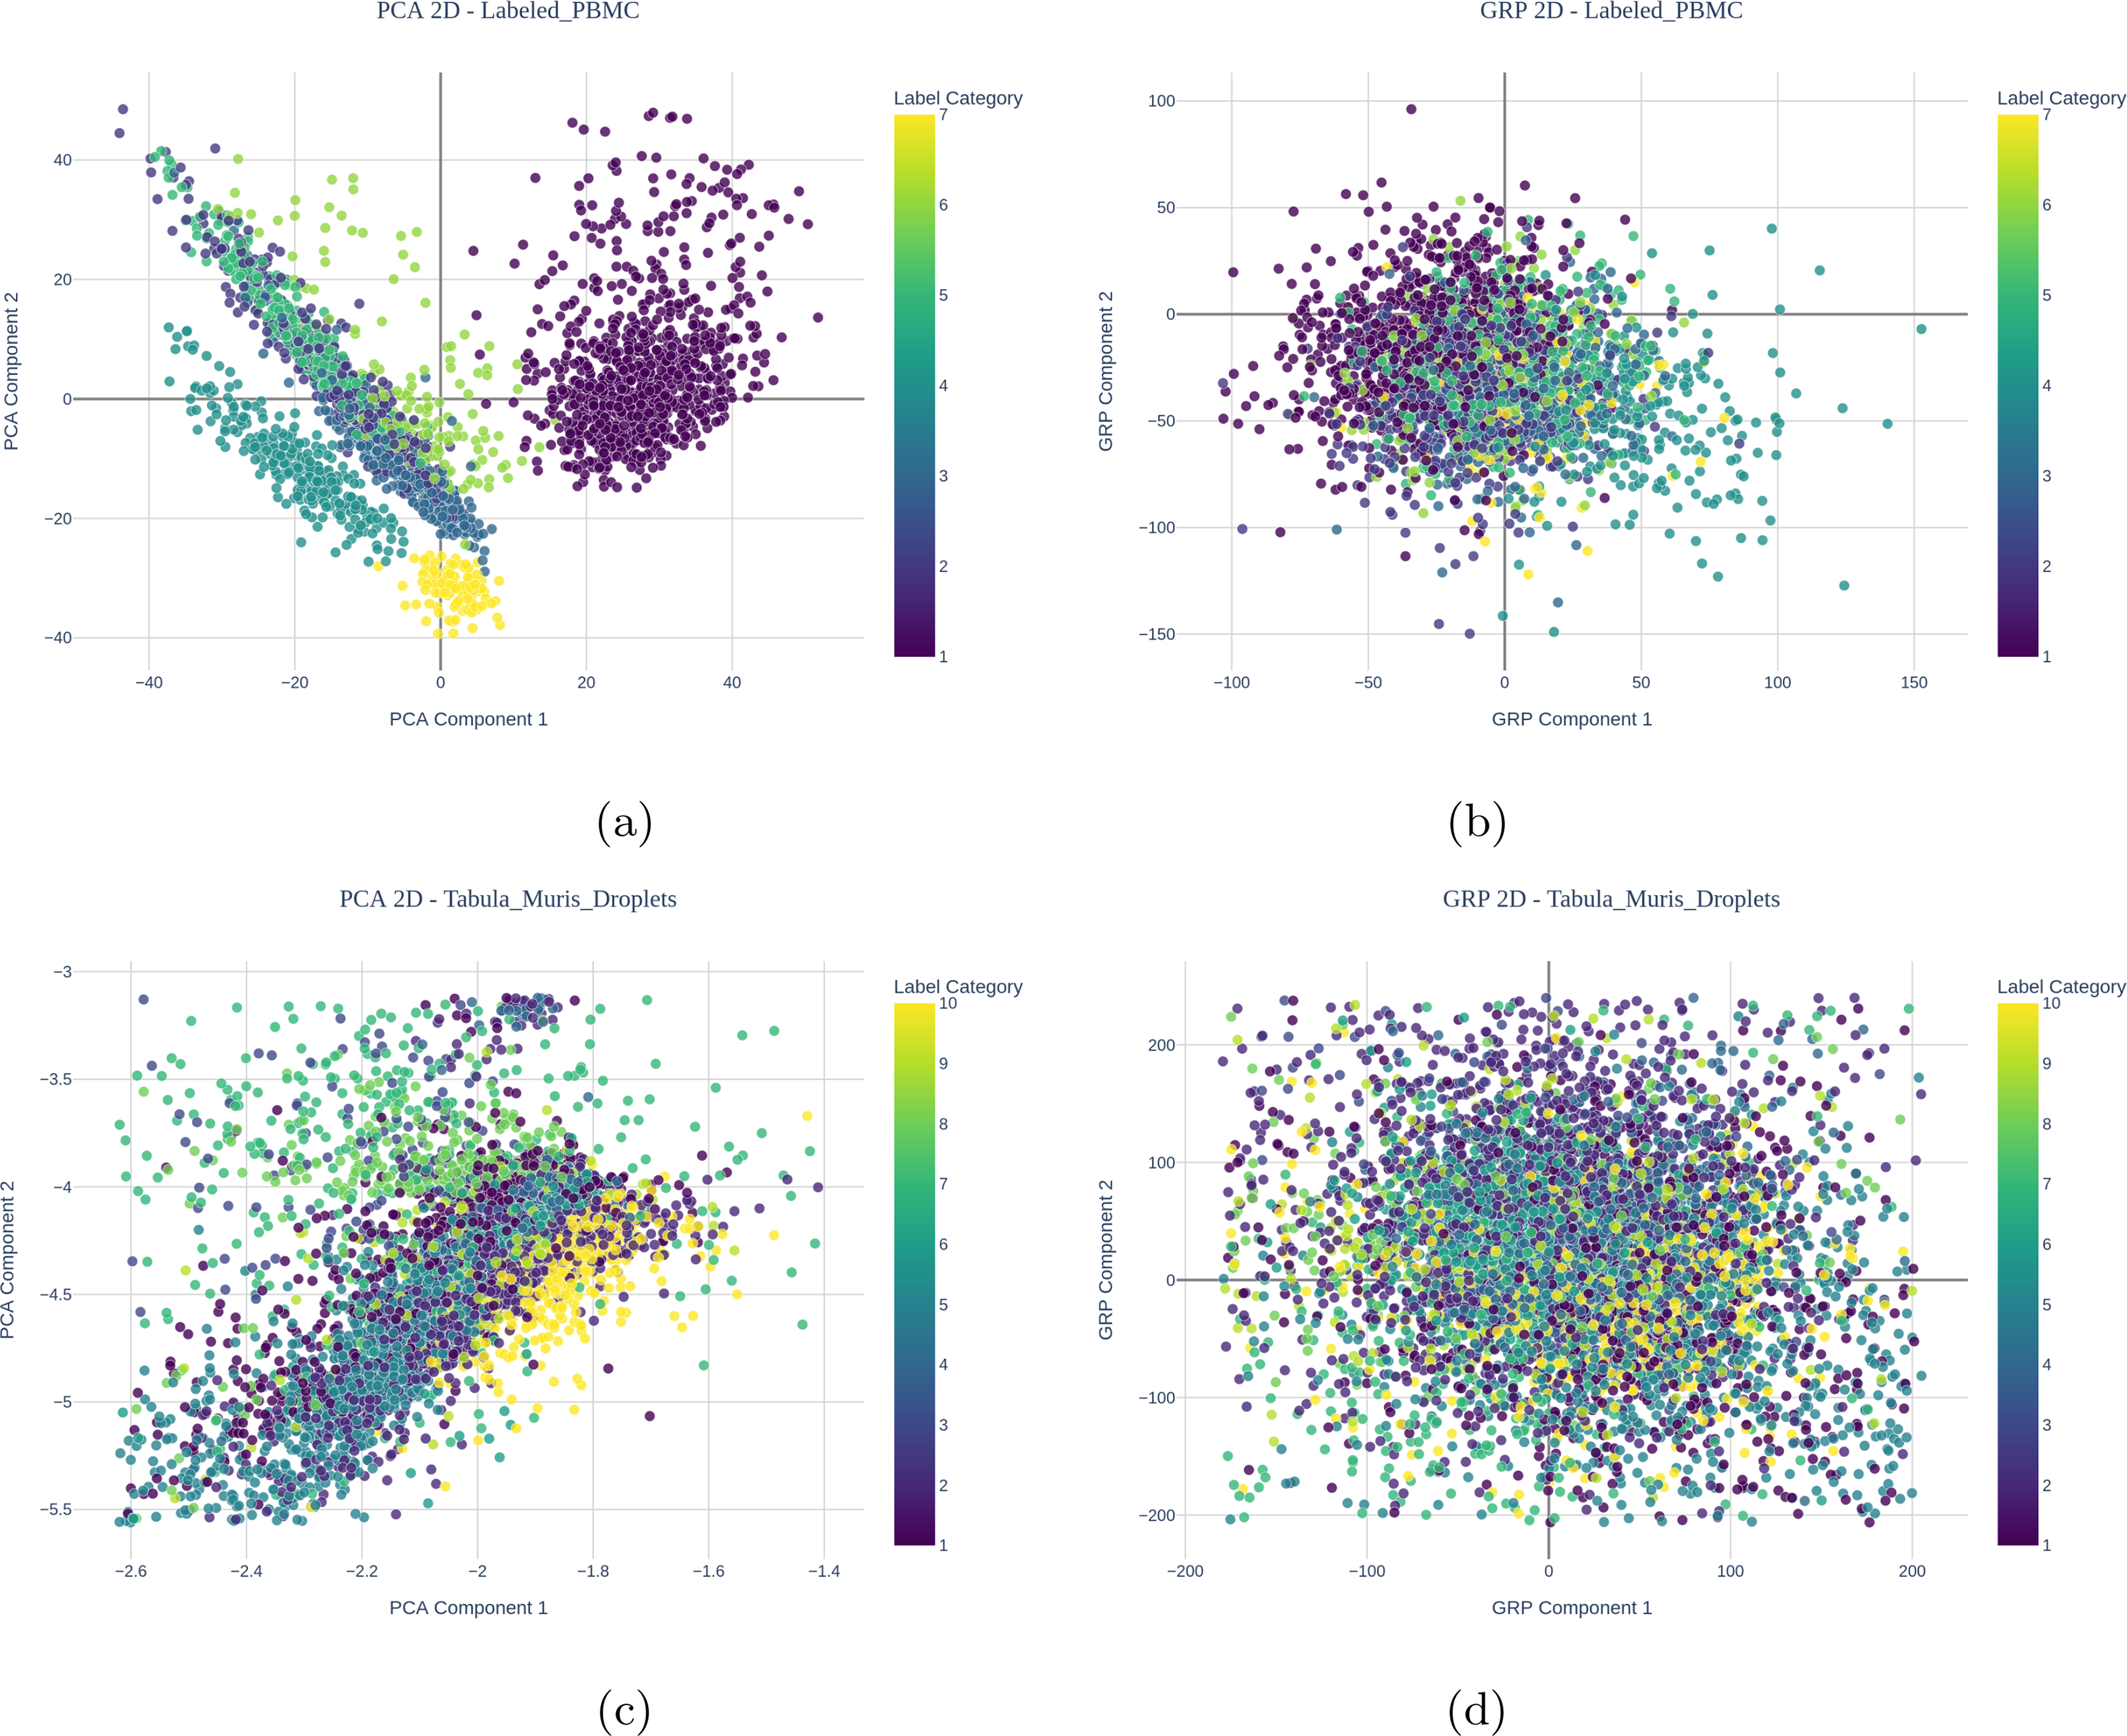
Figure 1 visualizes the sorted PBMC dataset using PCA and GRP using only the first two components each. Although both methods show overlap in the projections, GRP provides less clear visualization compared with PCA when using only two components directly for visualization. This is expected since with PCA, the first few components capture more of the data’s latent properties, such as variability, than later components, while latent properties are captured over all RP embeddings/components, and hence a distinction between the earlier and later components is less meaningful for RP methods.
Visualization for labeled PBMCs
We used clustering effectiveness as a means of evaluating how well the reduced, low-dimensional latent space produced from different methods is suited for use in downstream analyses. Figures 2 and 3 show the results for the labeled sets, displaying Accuracy and Mutual Information, respectively, for all labeled sets and all methods over a varying number of components.
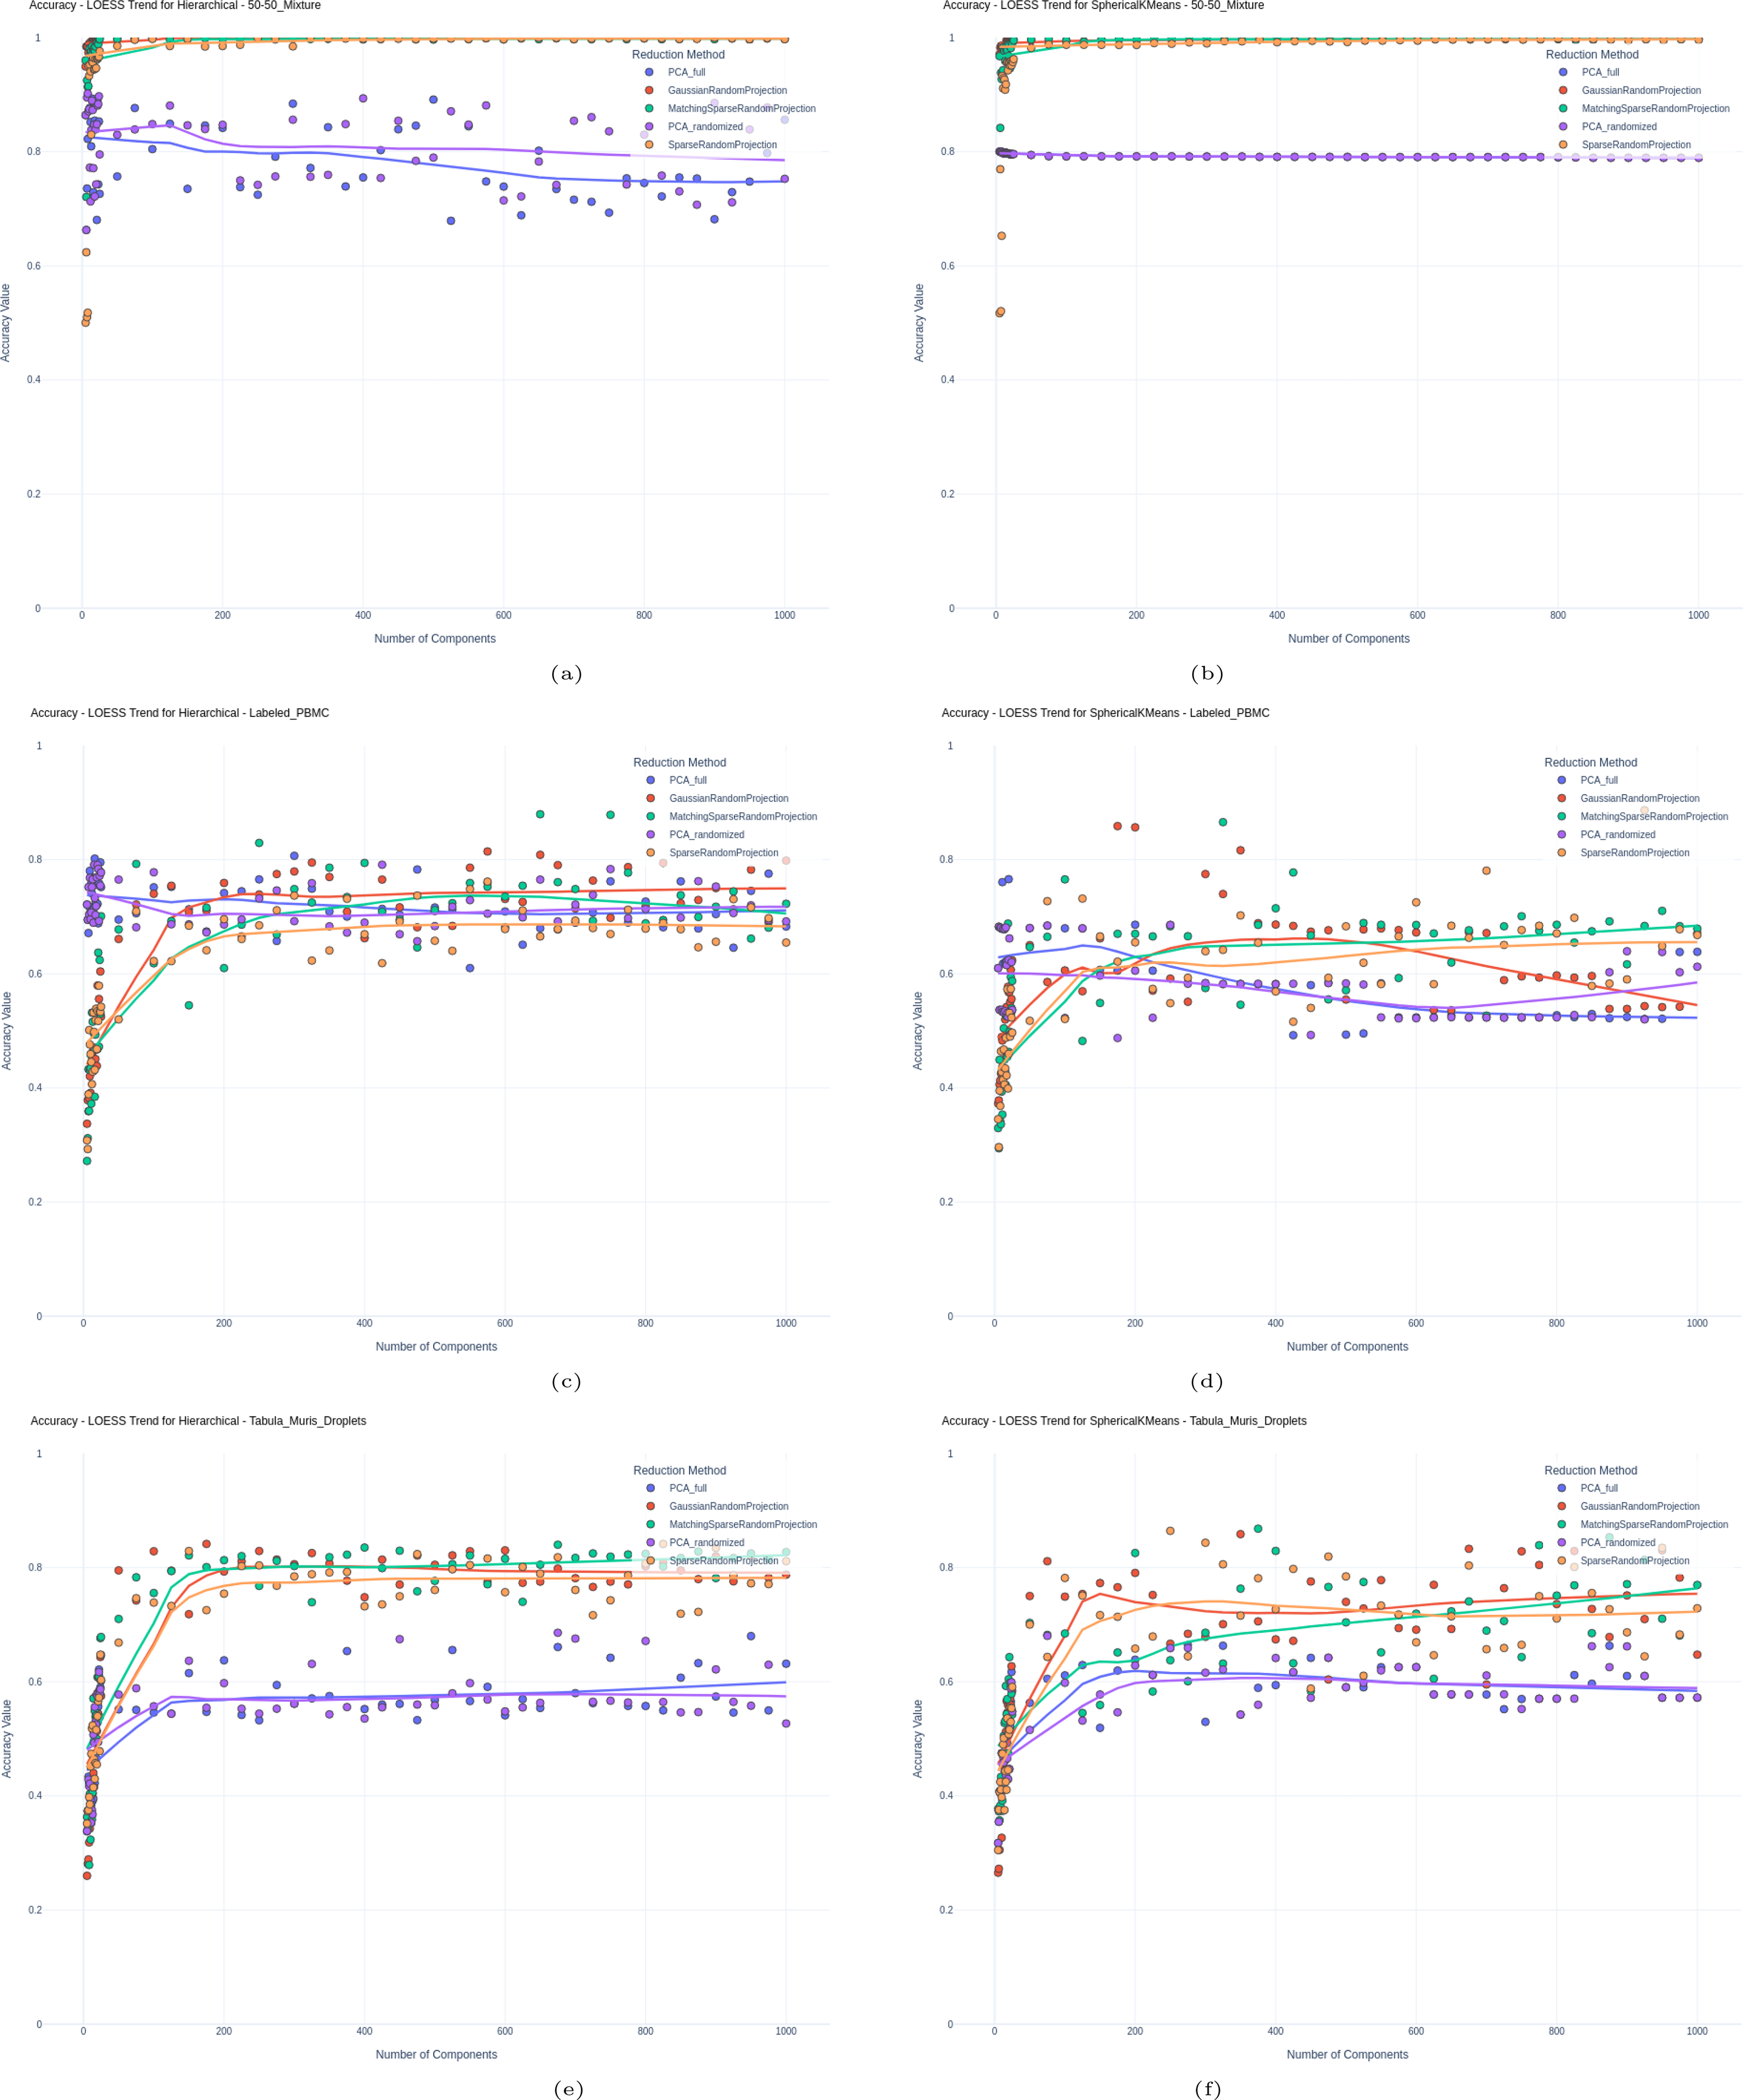
Accuracy for
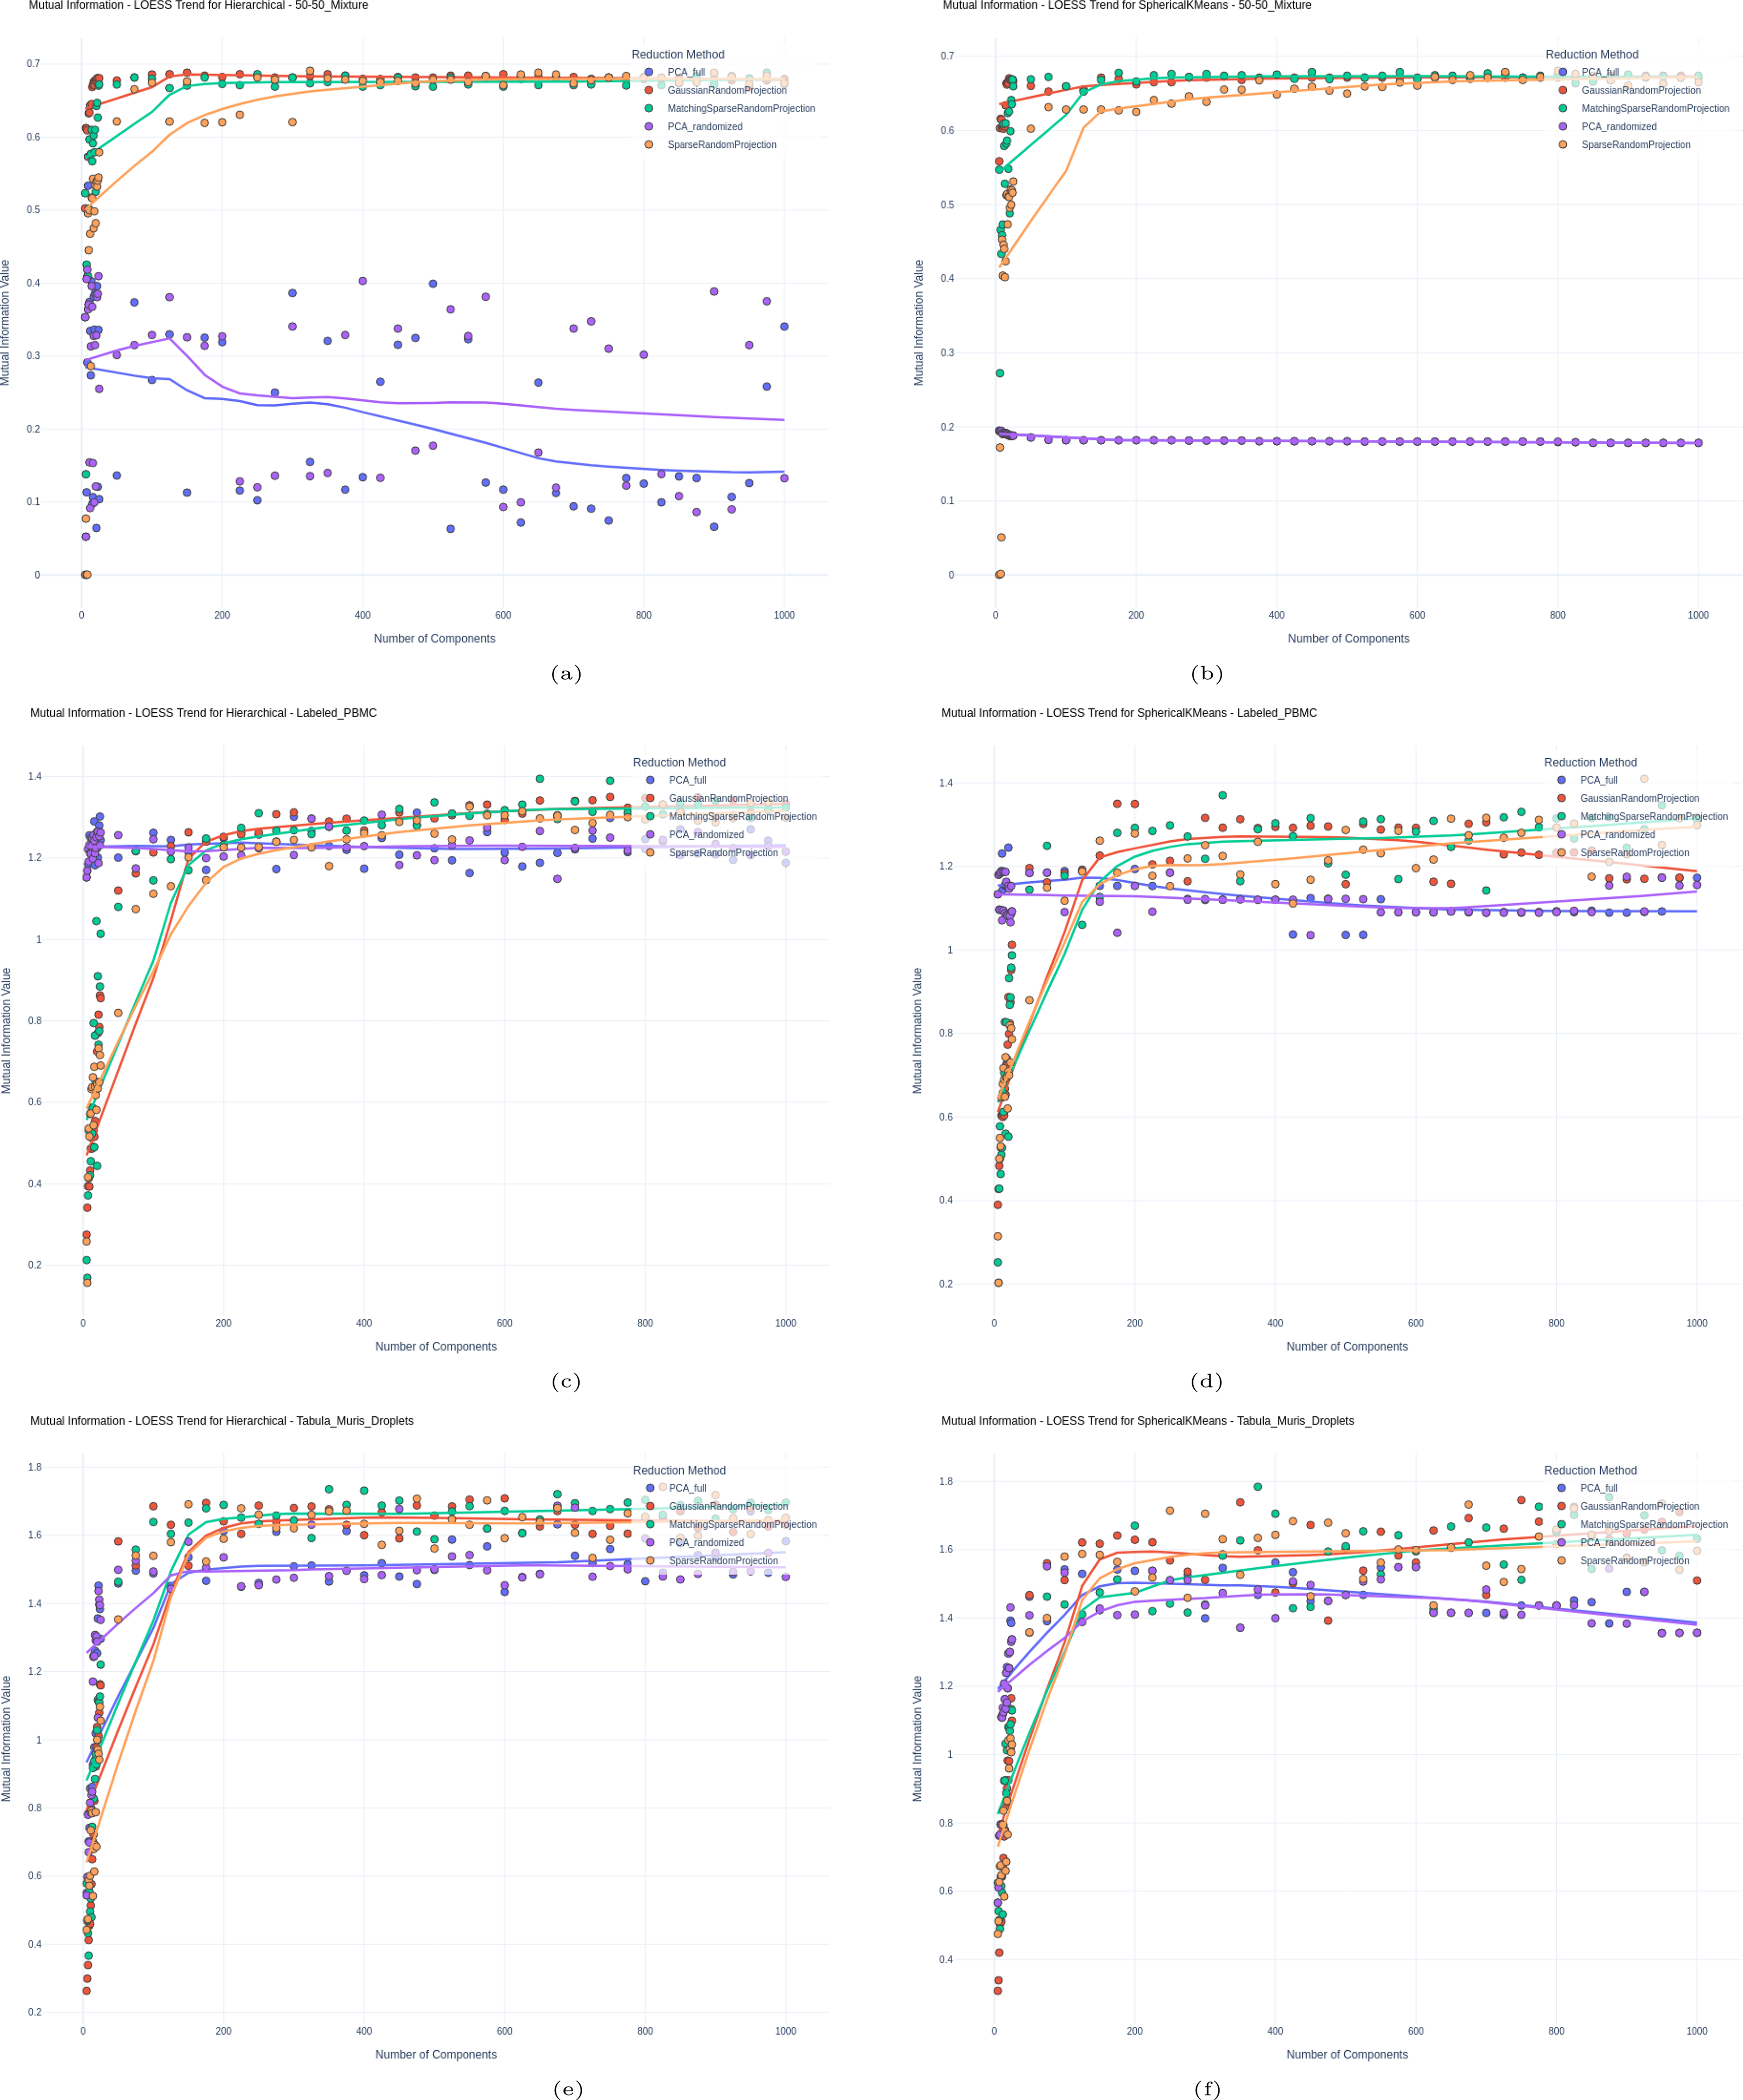
Mutual information for
Furthermore, for unlabeled data, we examined the “goodness” of clustering by evaluating the Dunn Index and Gap Statistics values as described in Methods. Figures 4 and 5 illustrate these results, respectively, again for all evaluated methods and varying number of components used for clustering.
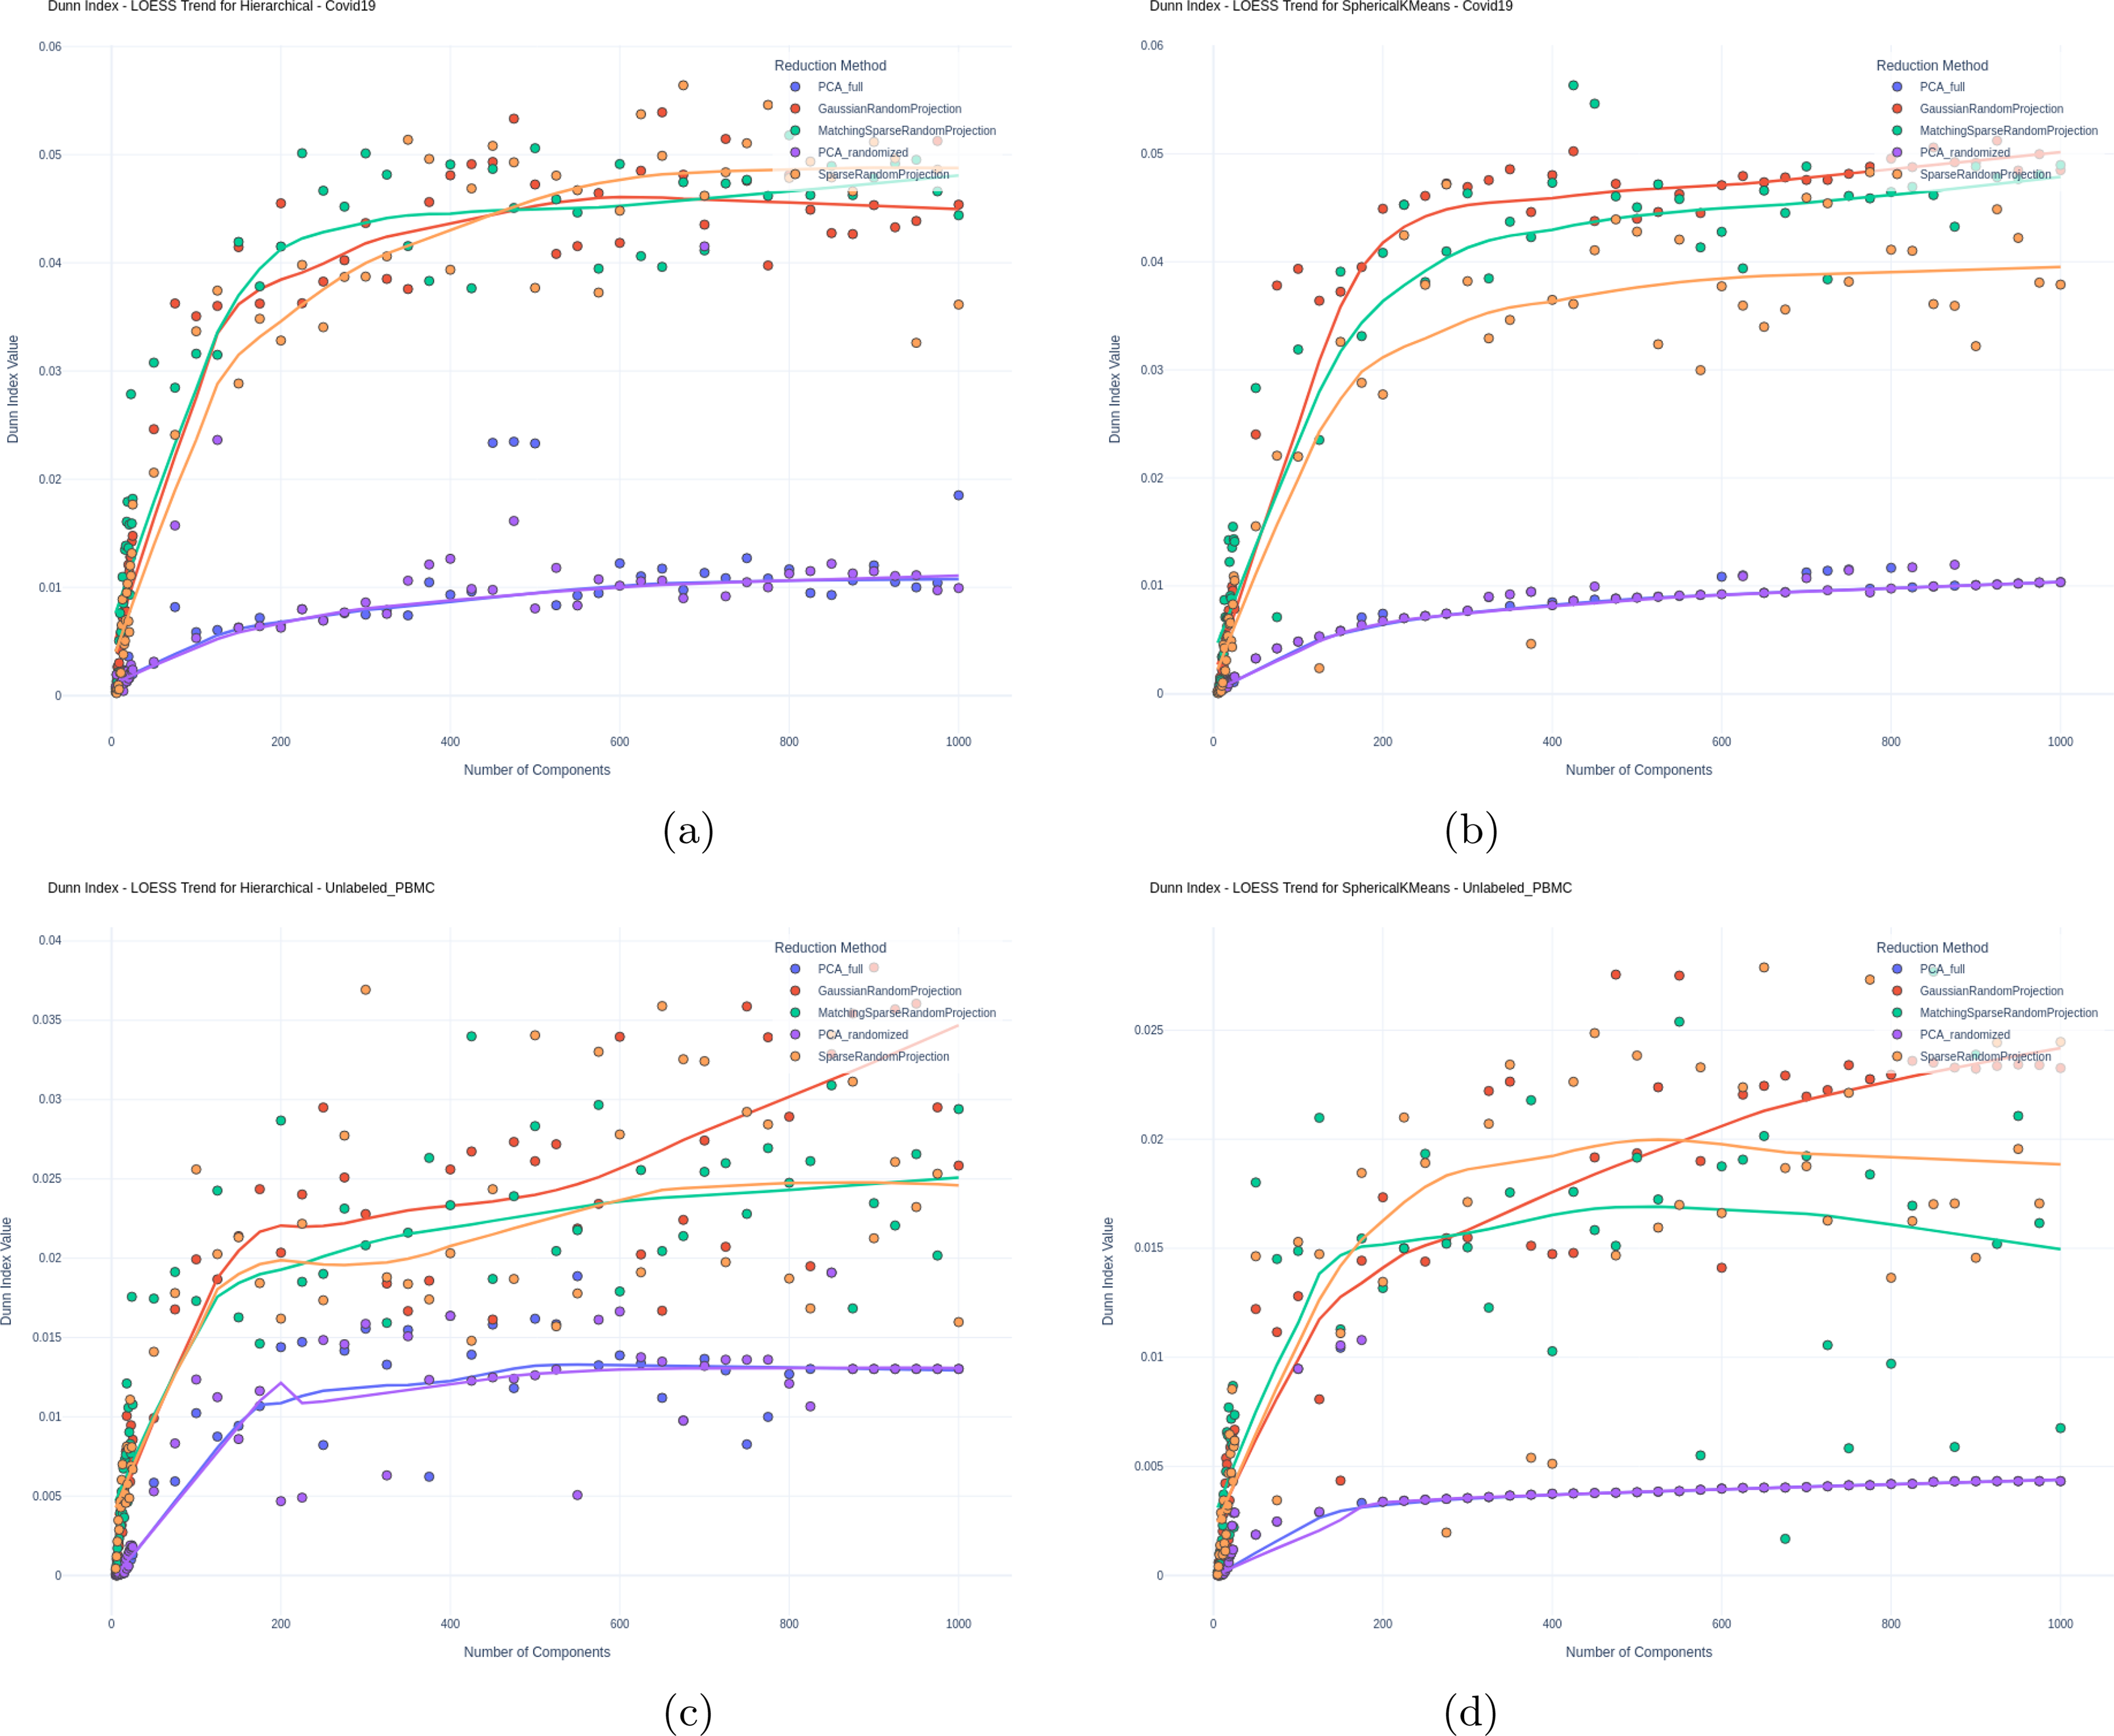
Dunn index for
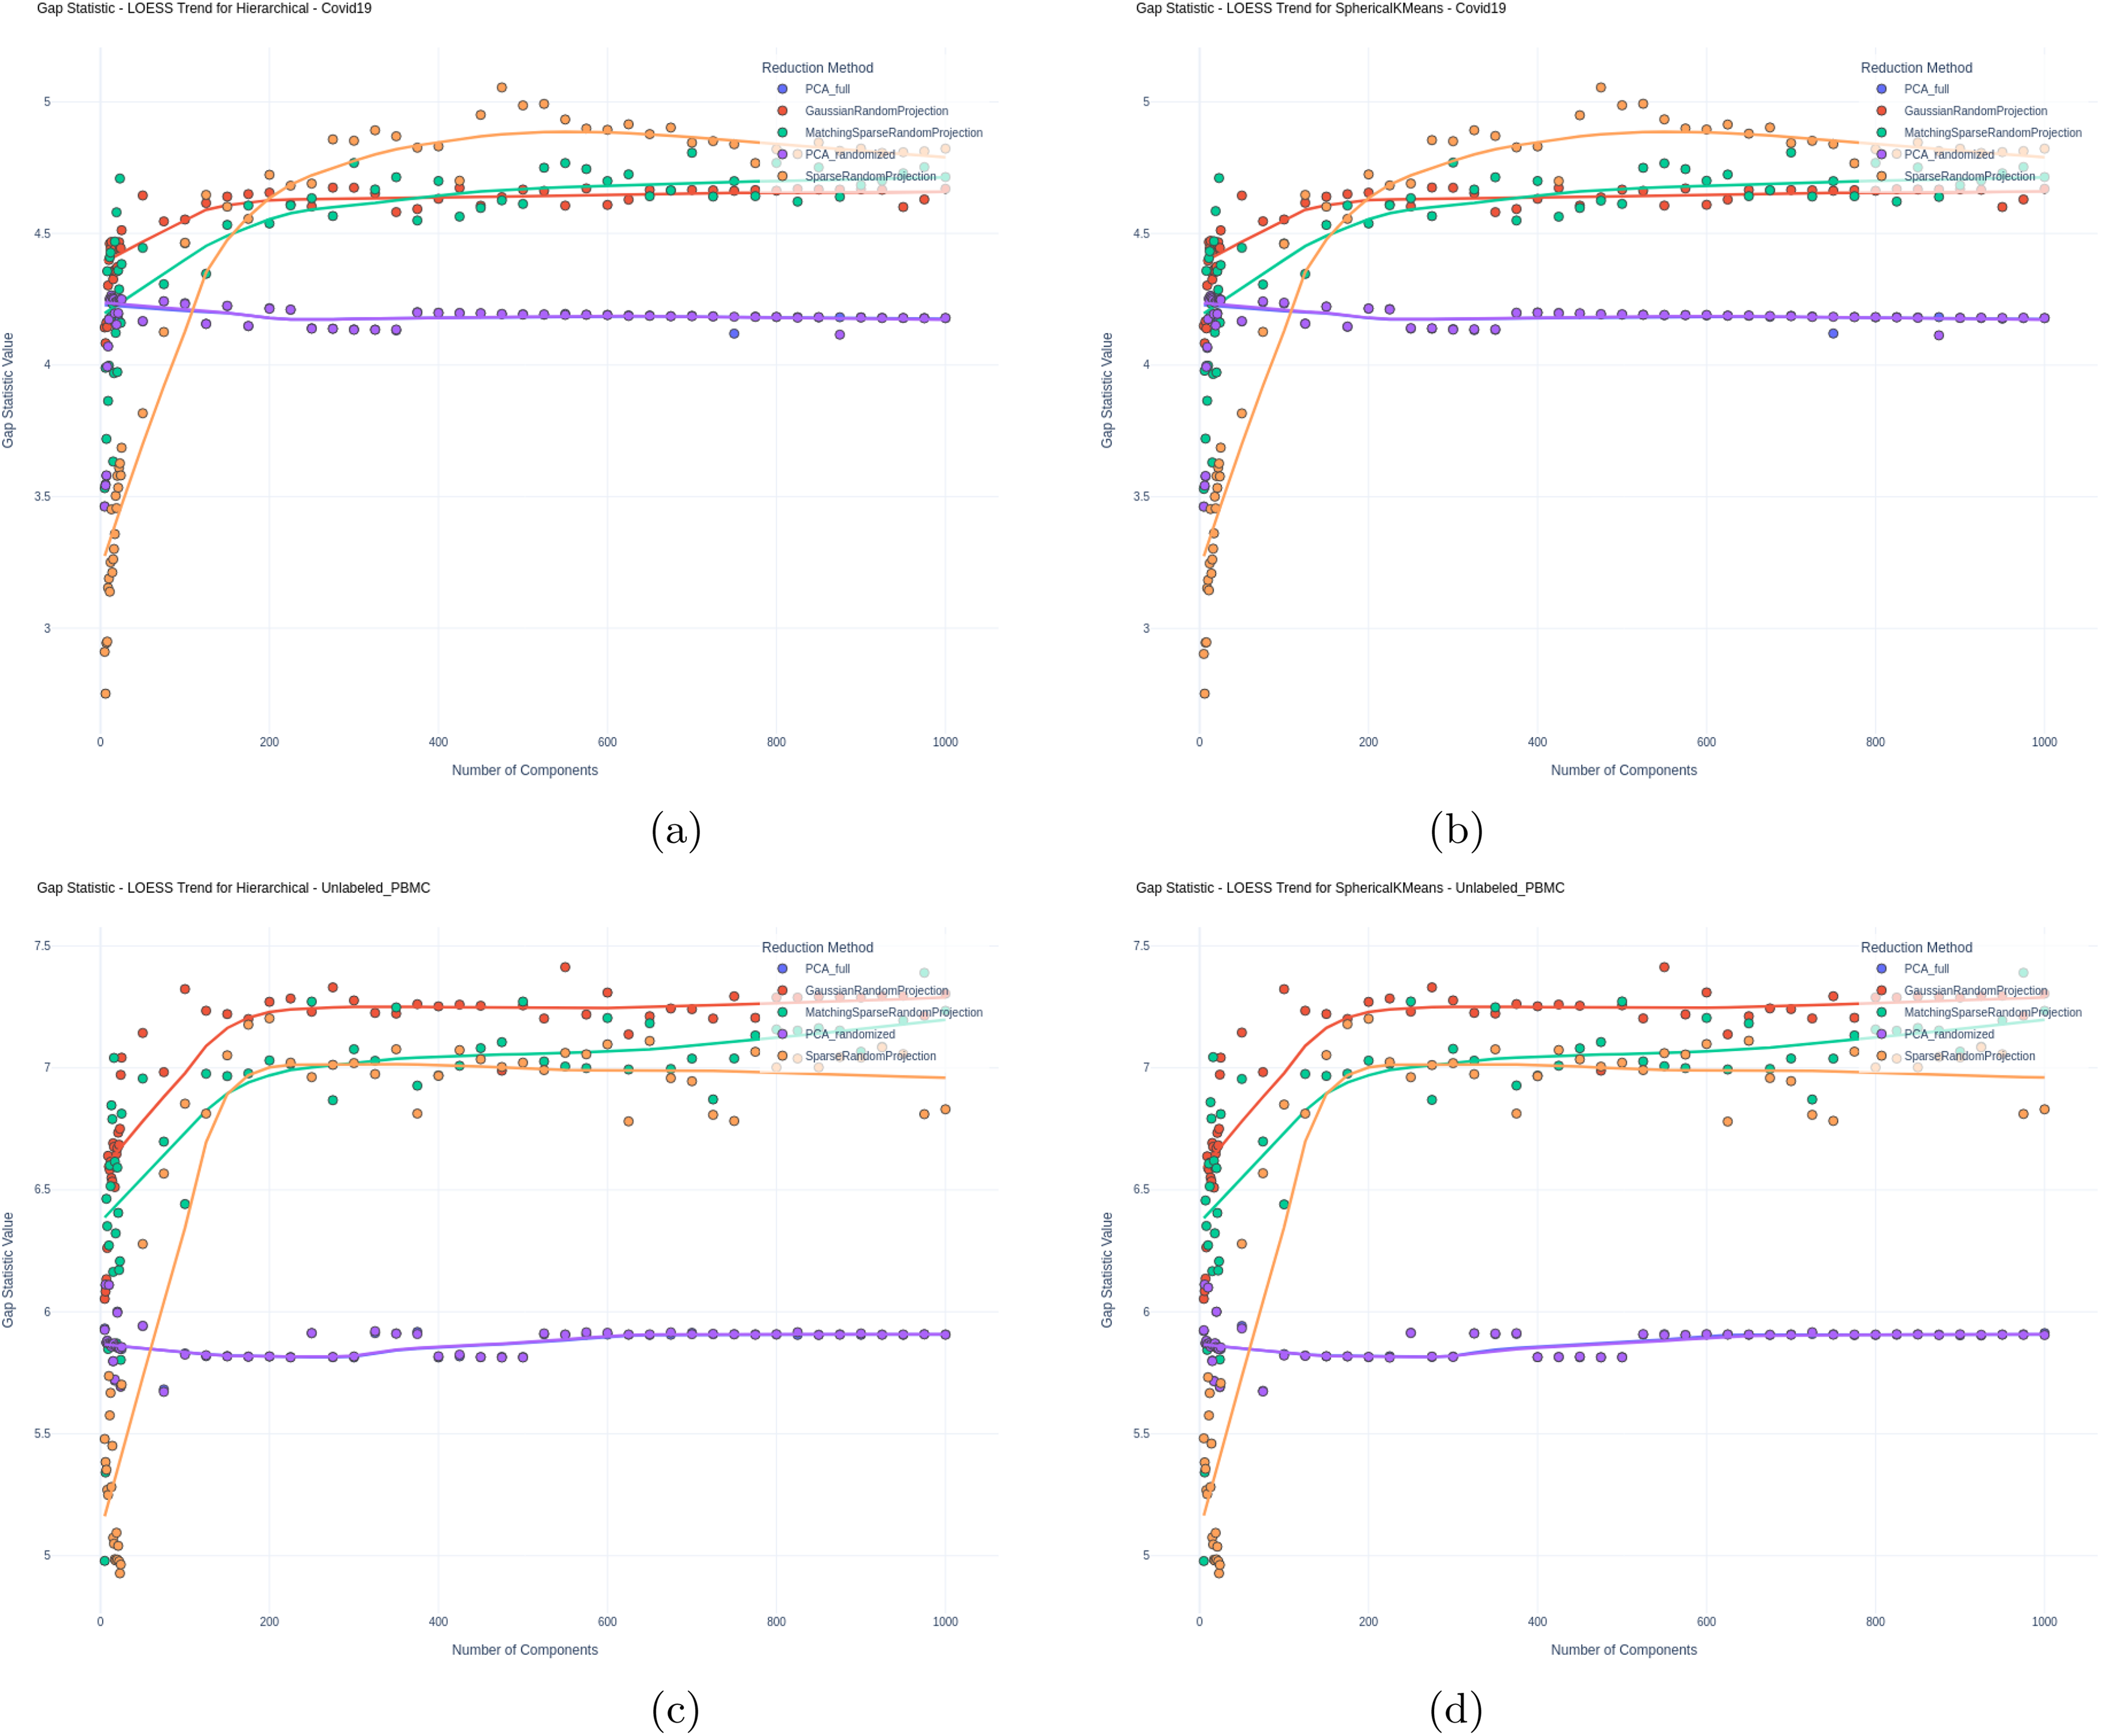
Gap Statistic for
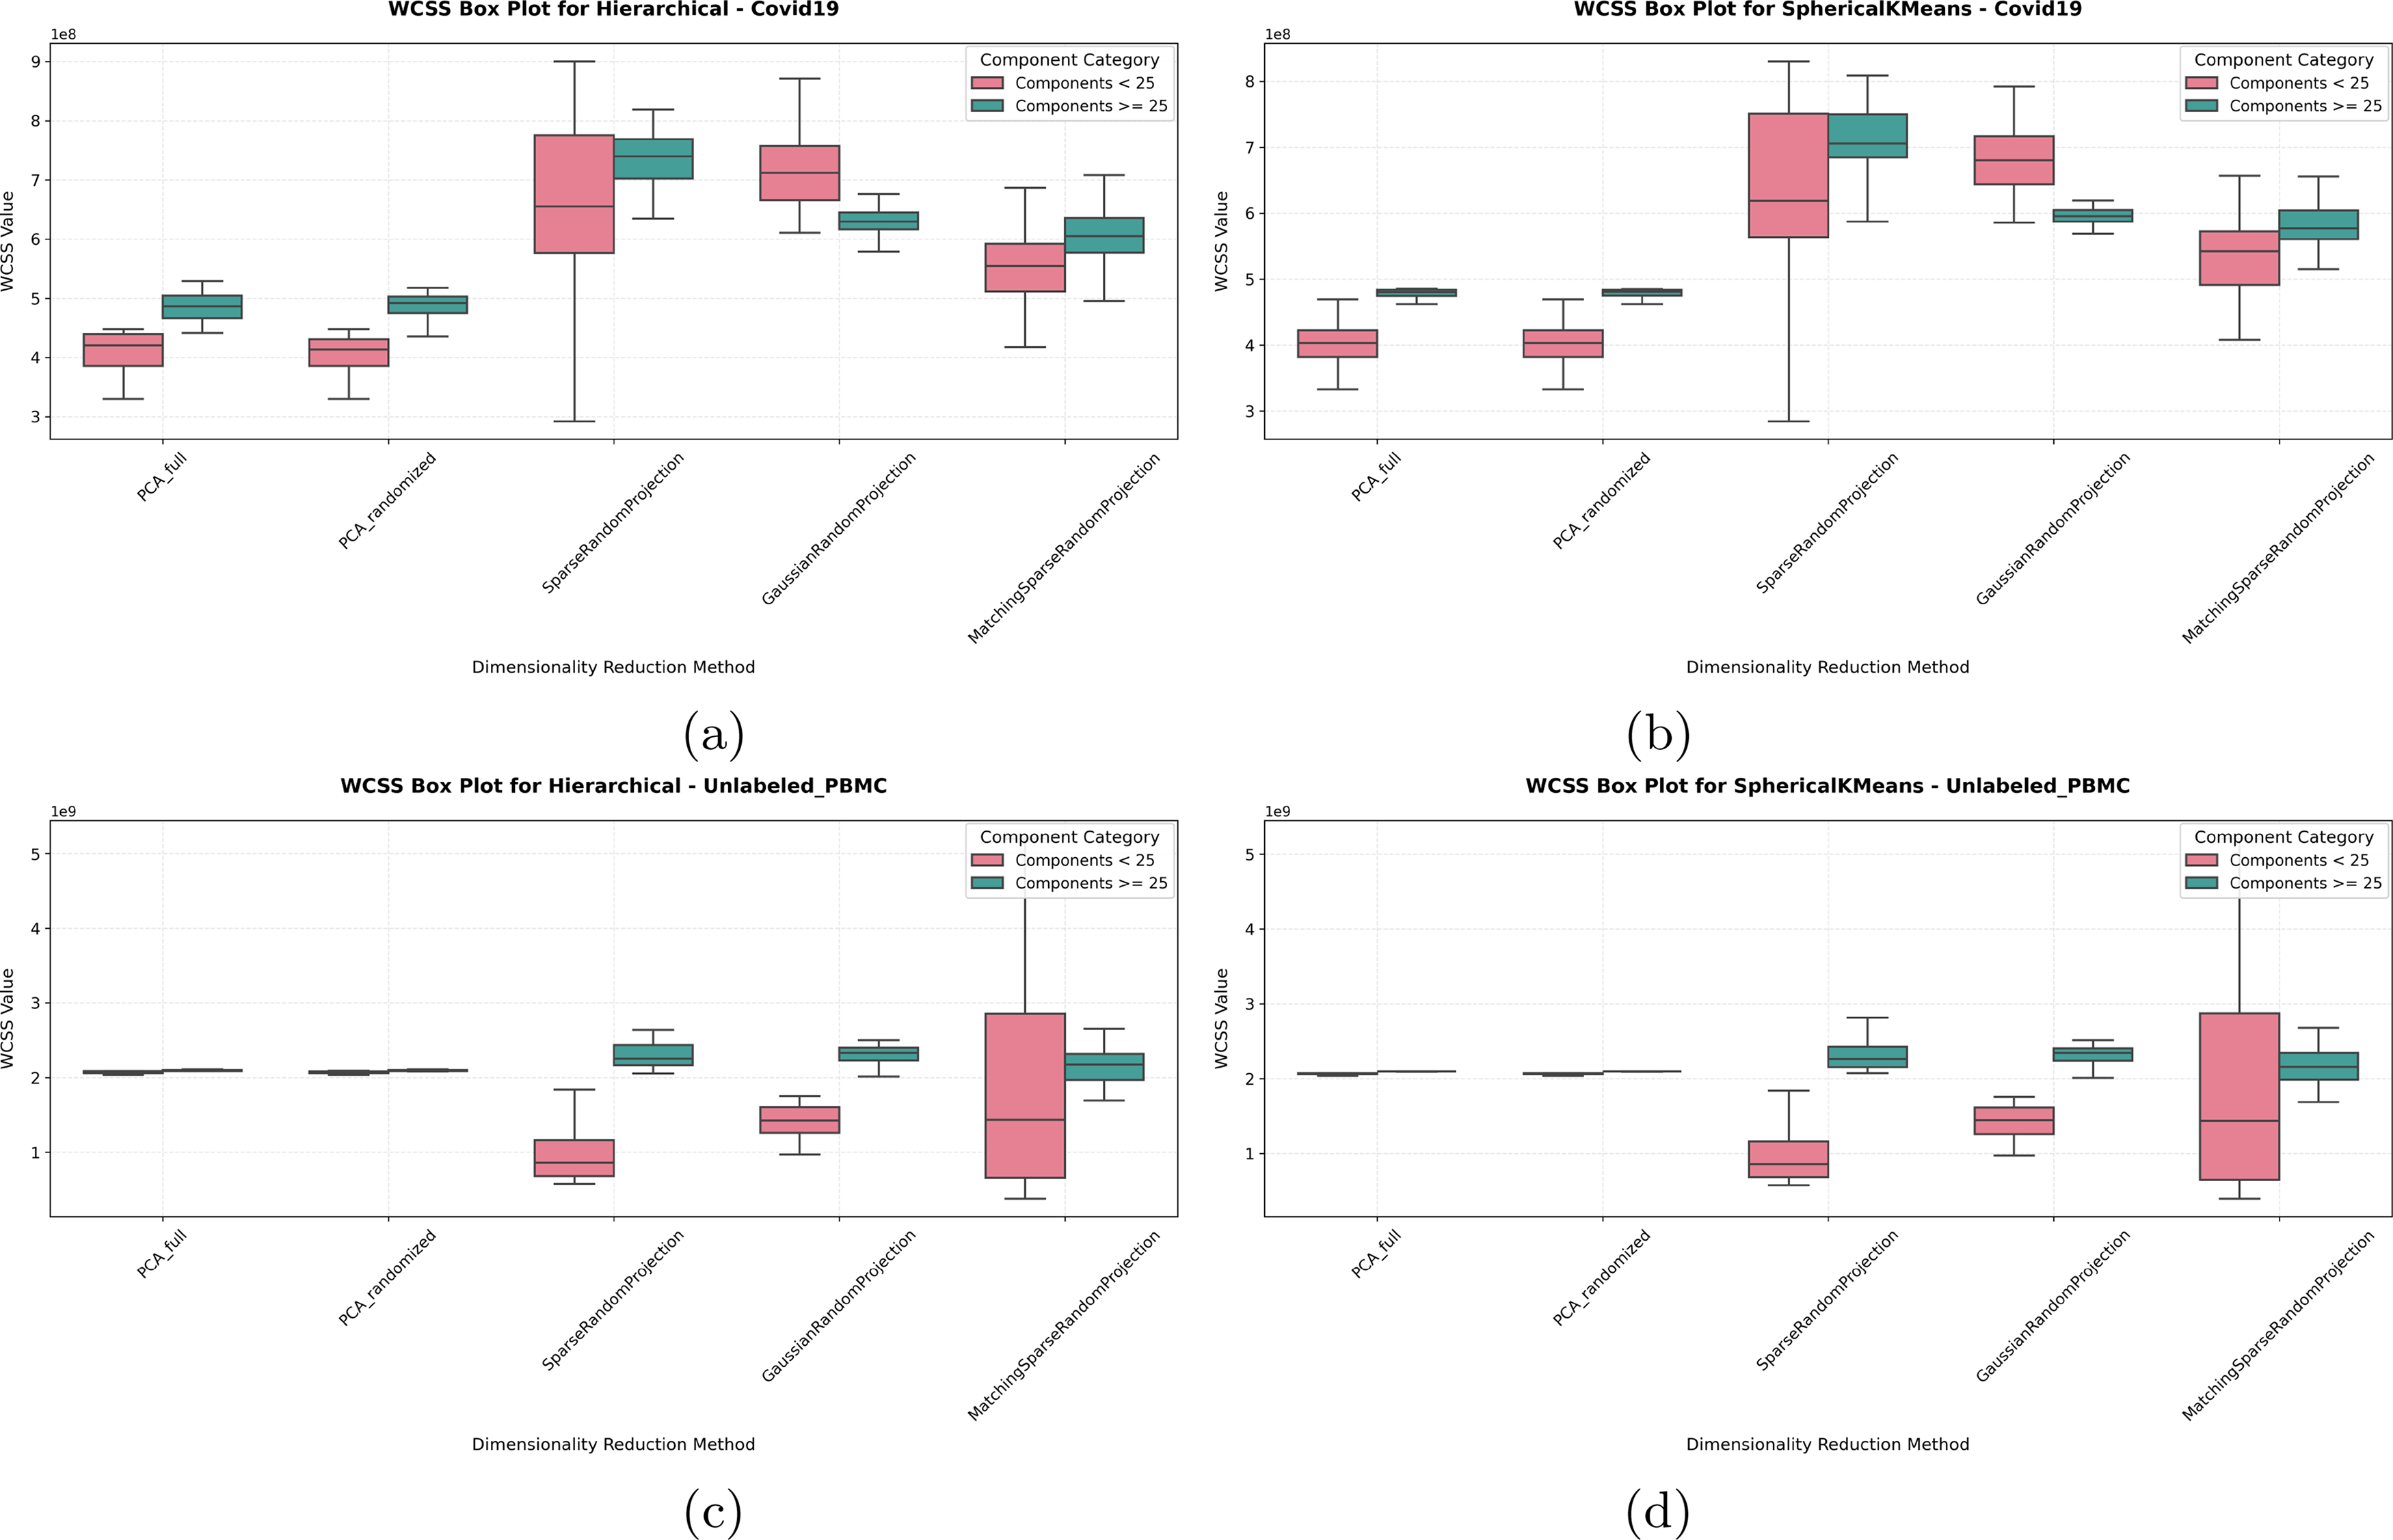
Since capturing variability or heterogeneity is one of the main insights PCA and RP methods provide, we set to evaluate whether preserving variability would impact performance to lower accuracy, since, depending on the downstream task, higher or lower variability preservation can be considered a desired or undesired feature. However, when evaluating the WCSS metric to measure the heterogeneity preserved by each dimensionality reduction method for each dataset, see Figures 6 and 7, we see that RP methods indicate higher variability preservation while still achieving higher accuracies, especially when using >25 components for clustering. This is especially valuable for downstream applications such as lineage or trajectory inference from single-cell RNA-Seq, methods that rely on the cells “spread” and order along a trajectory pseudo-time line (Van den Berge et al., 2020; Moussa and Măndoiu, 2021a; Moussa and Street, 2025).
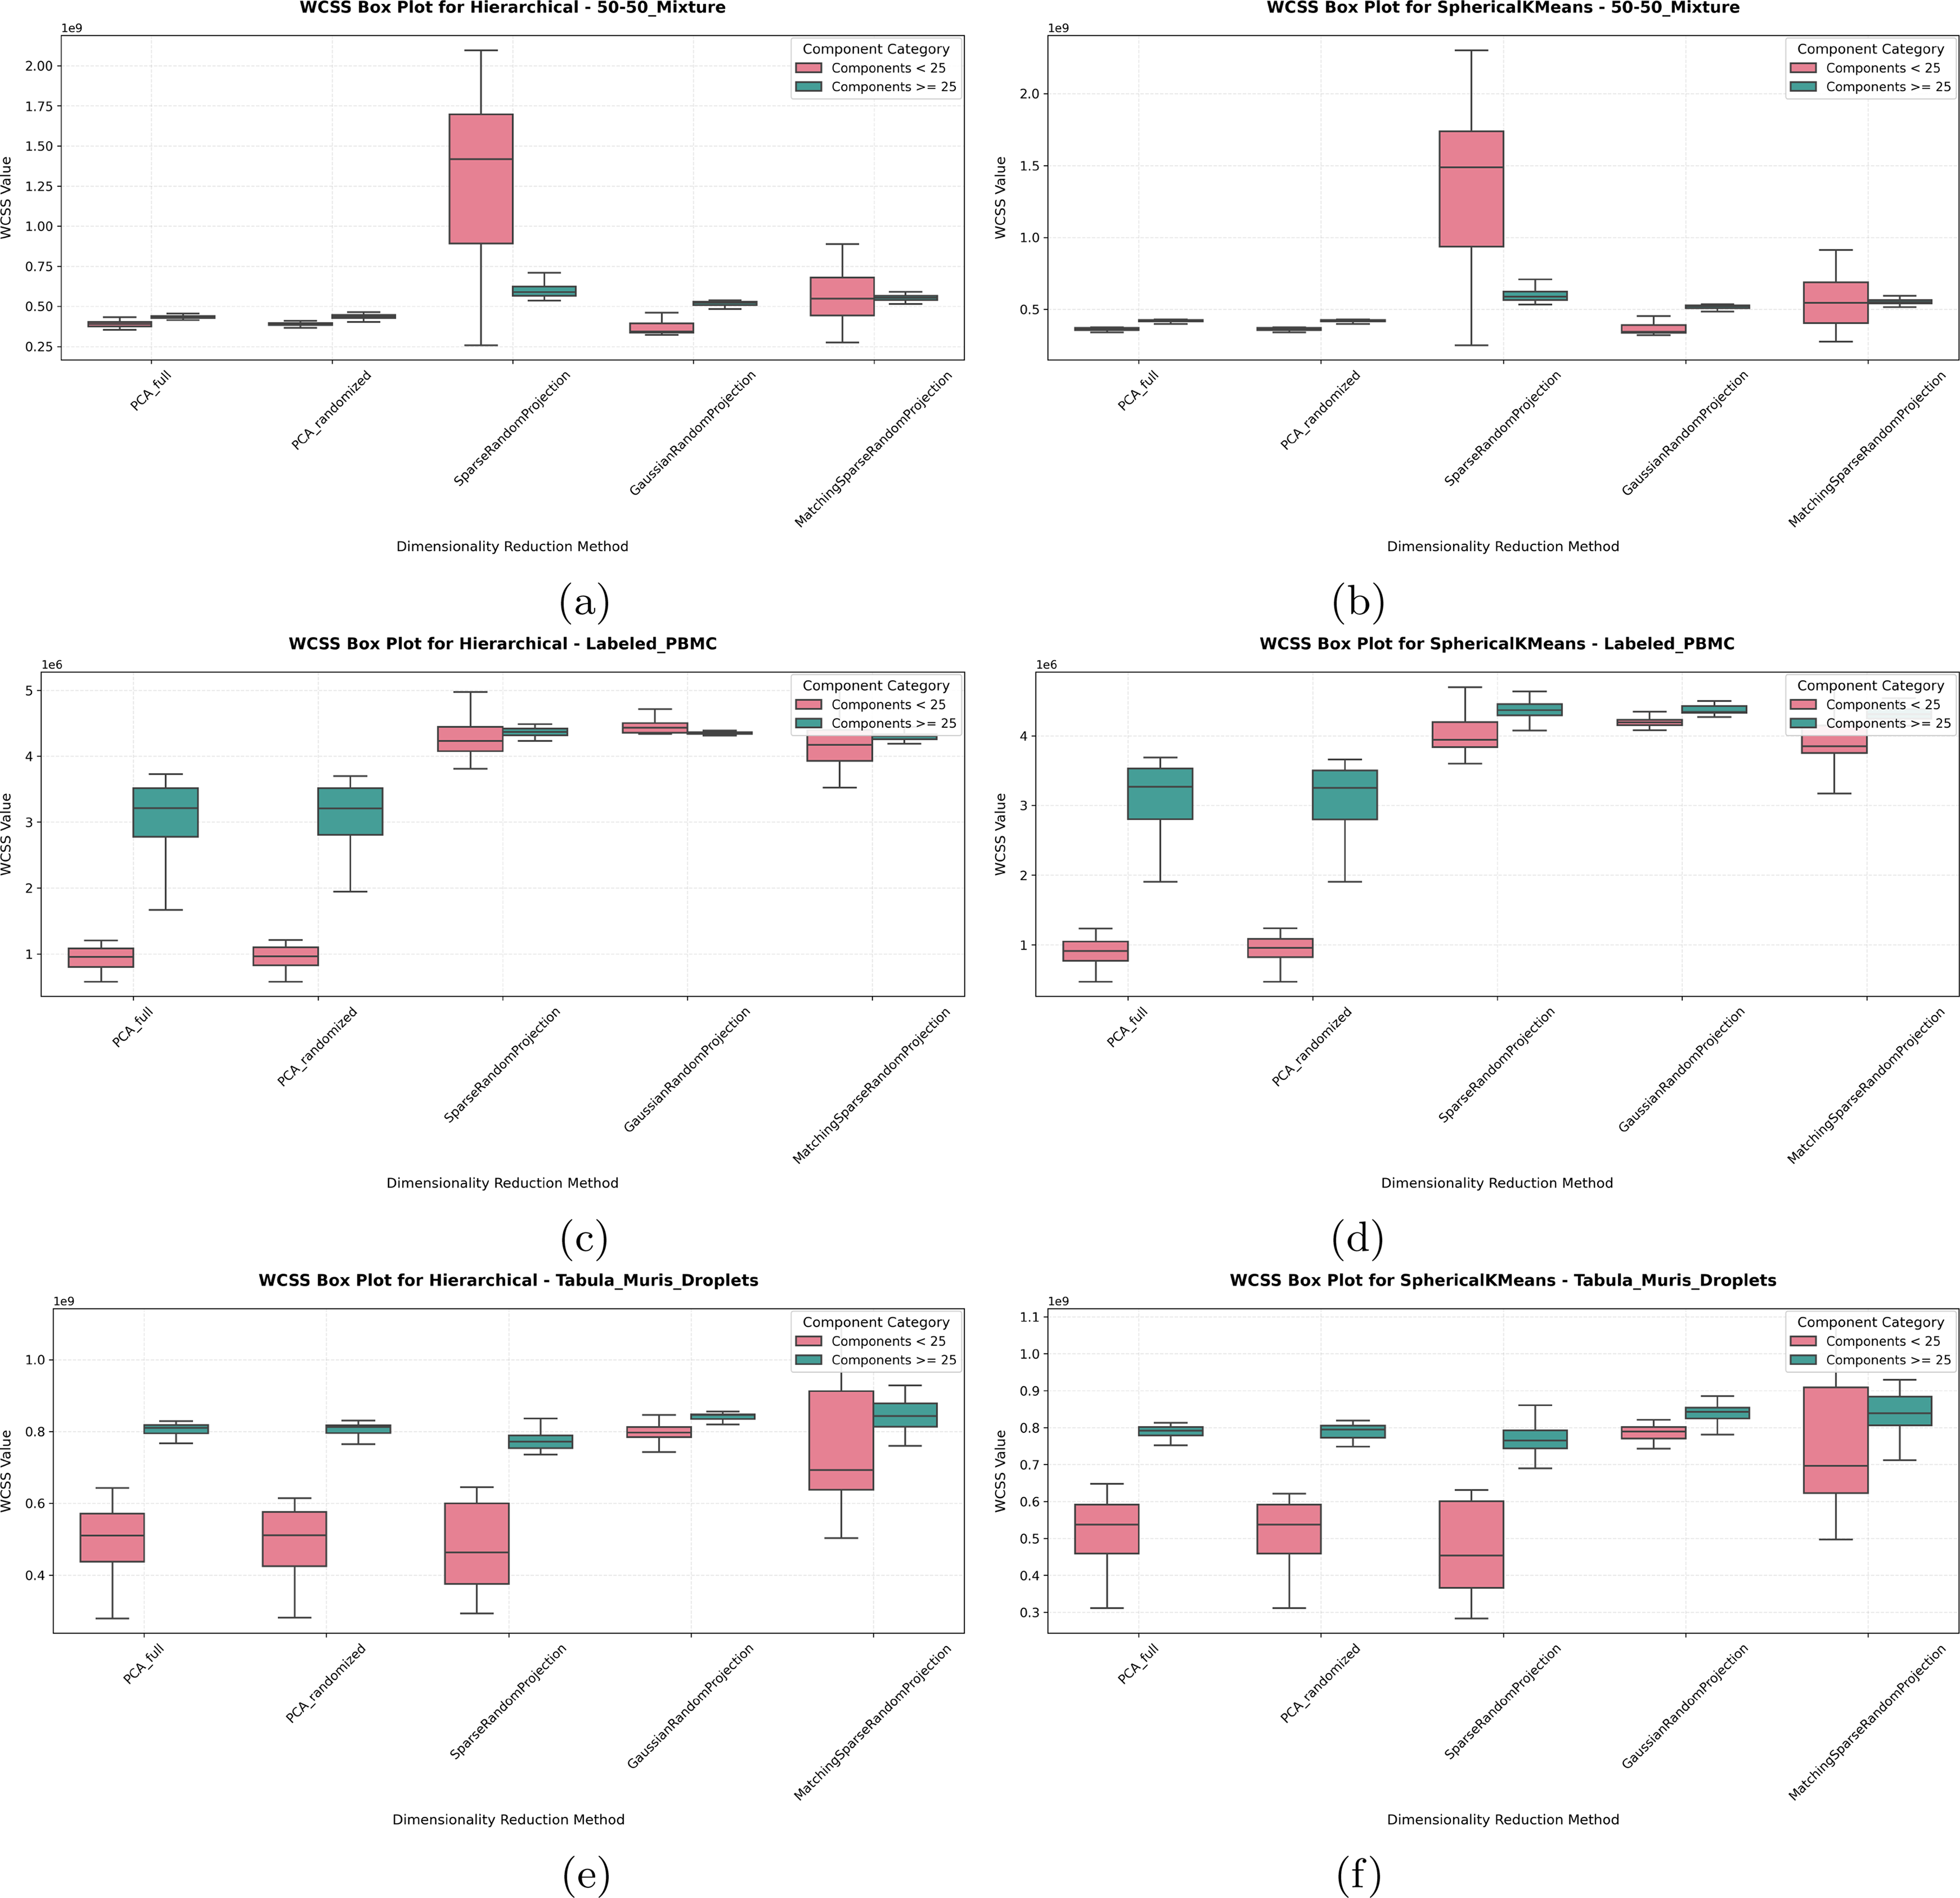
WCSS (variability measure) for
WCSS (Variability Measure) for
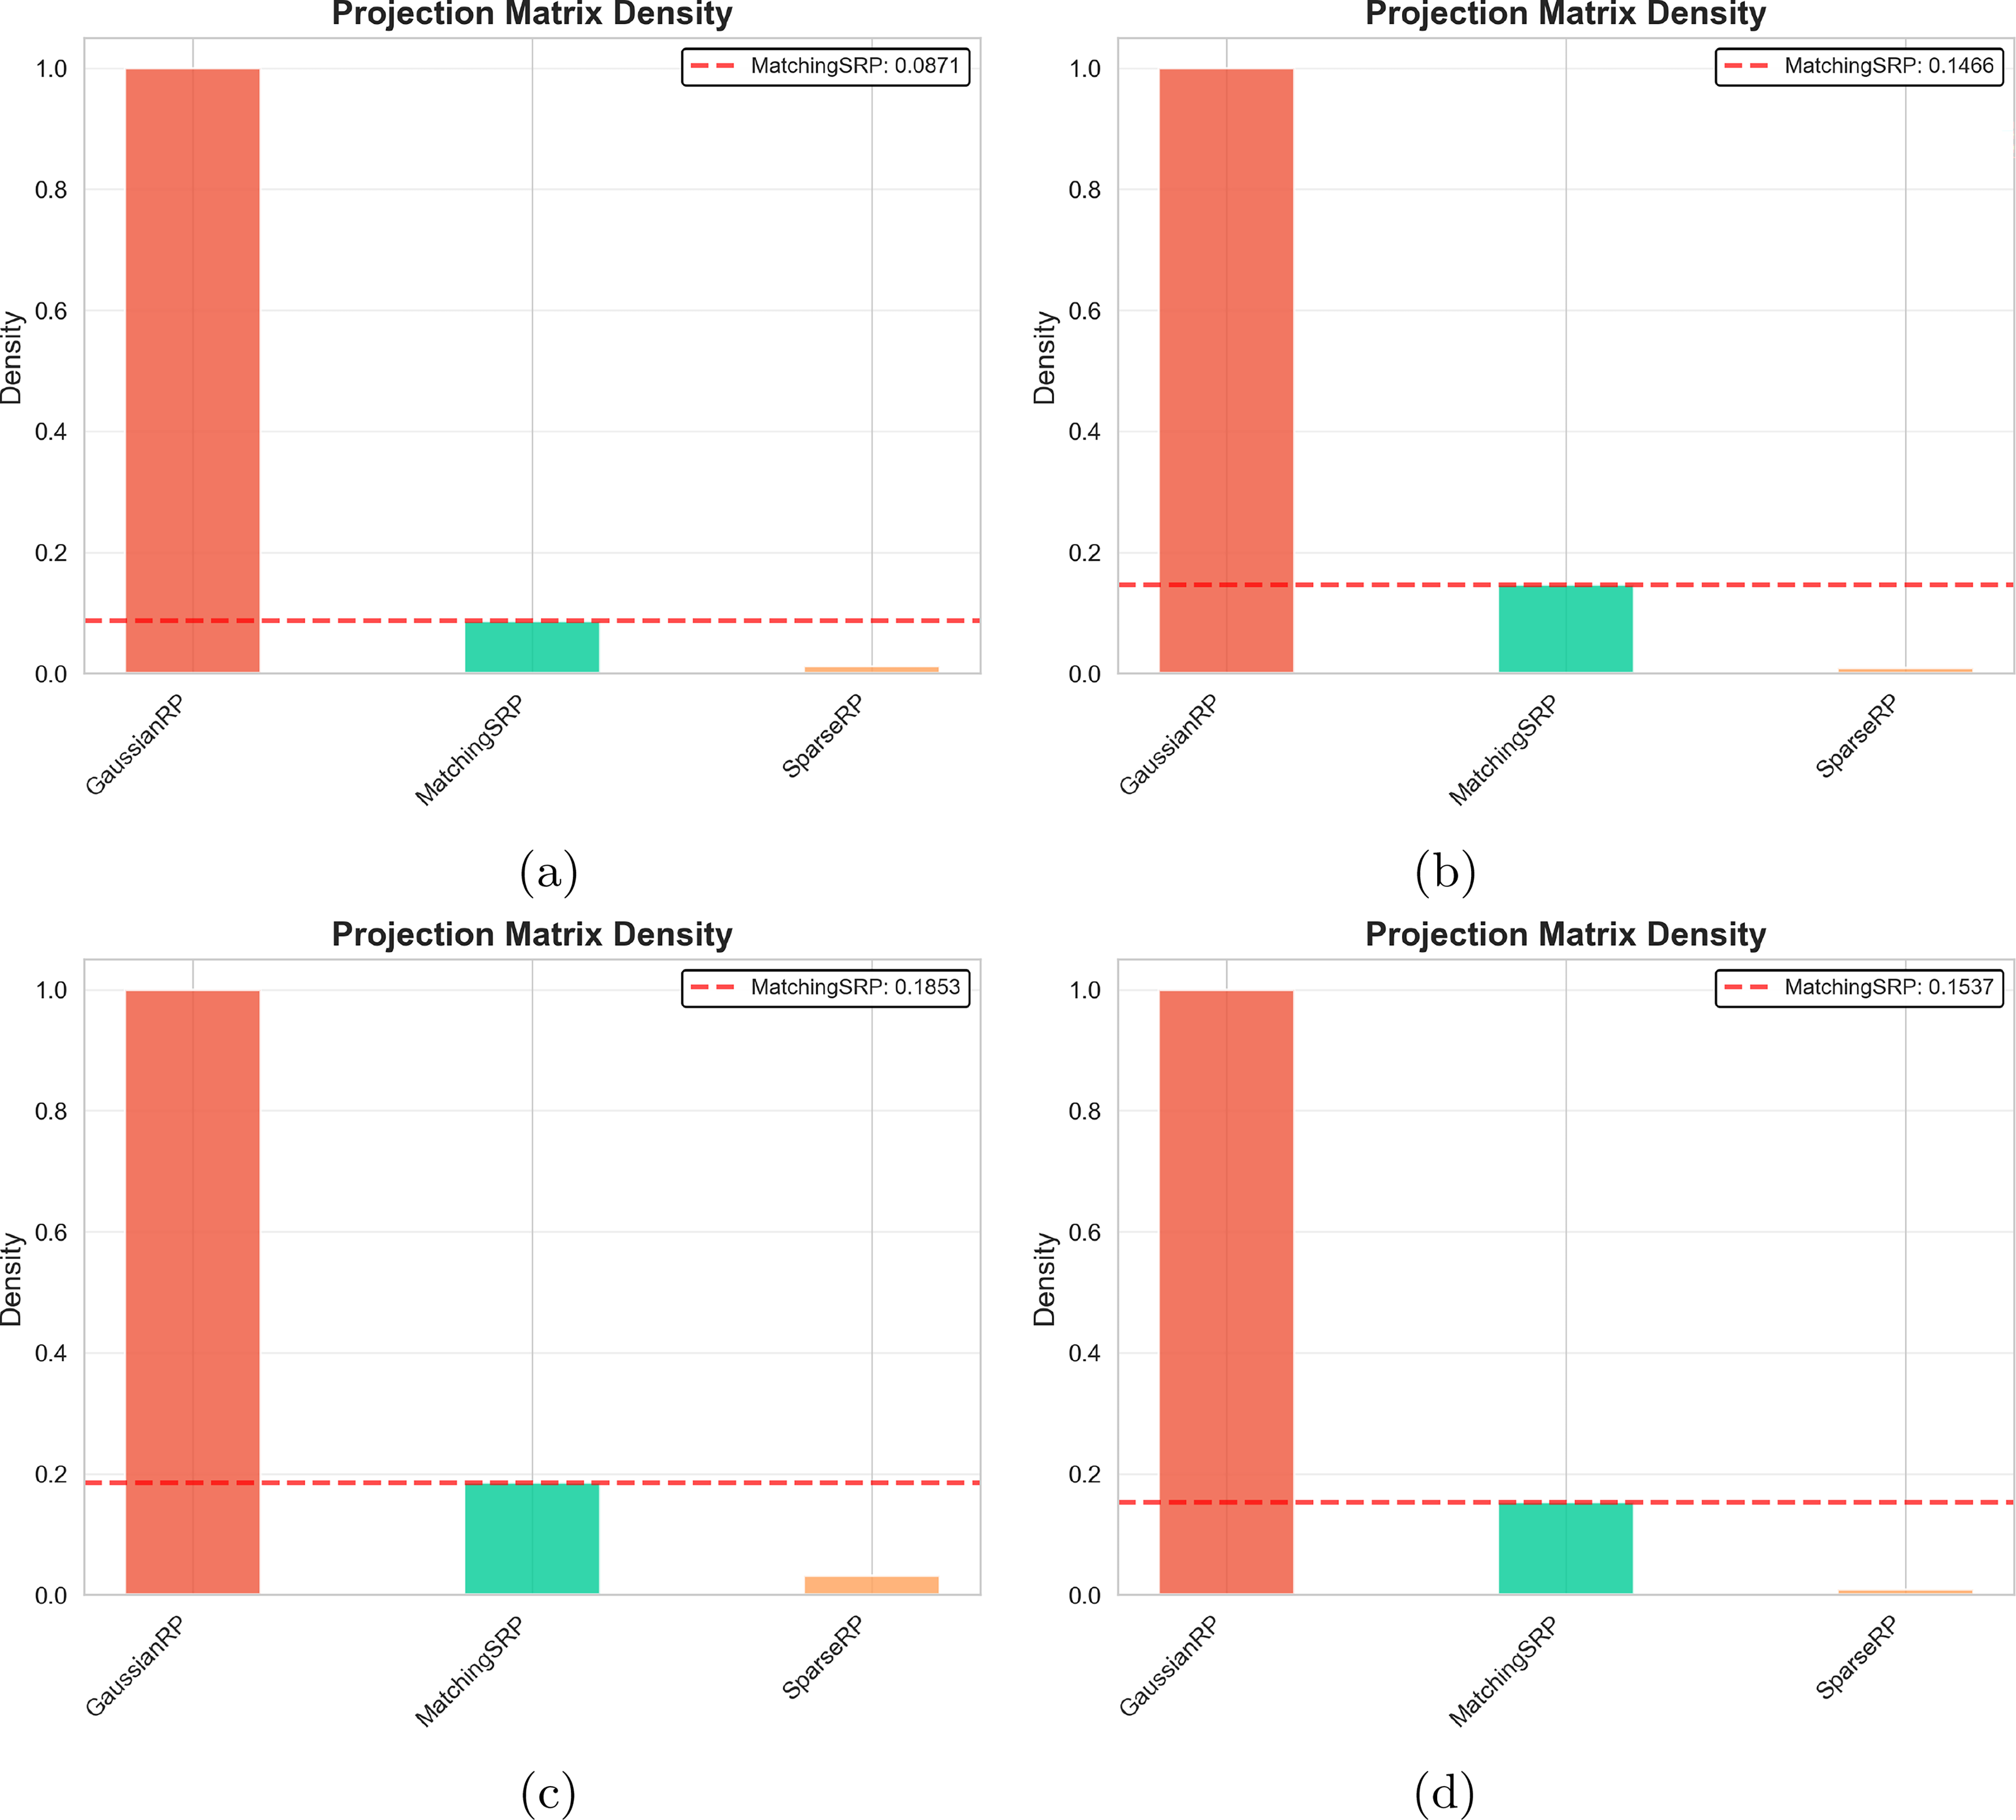
Our proposed Matching Sparsity Random Projection method dynamically adapts its projection matrix density to match the sparsity characteristics of the input scRNA-seq data. Compared with the rest of the random projection-based methods, Figure 8 illustrates the projection matrix density for all three RP methods across the four datasets, with the red dashed line indicating the Matching SRP’s automatically selected density value.
Projection matrix density comparison across methods for
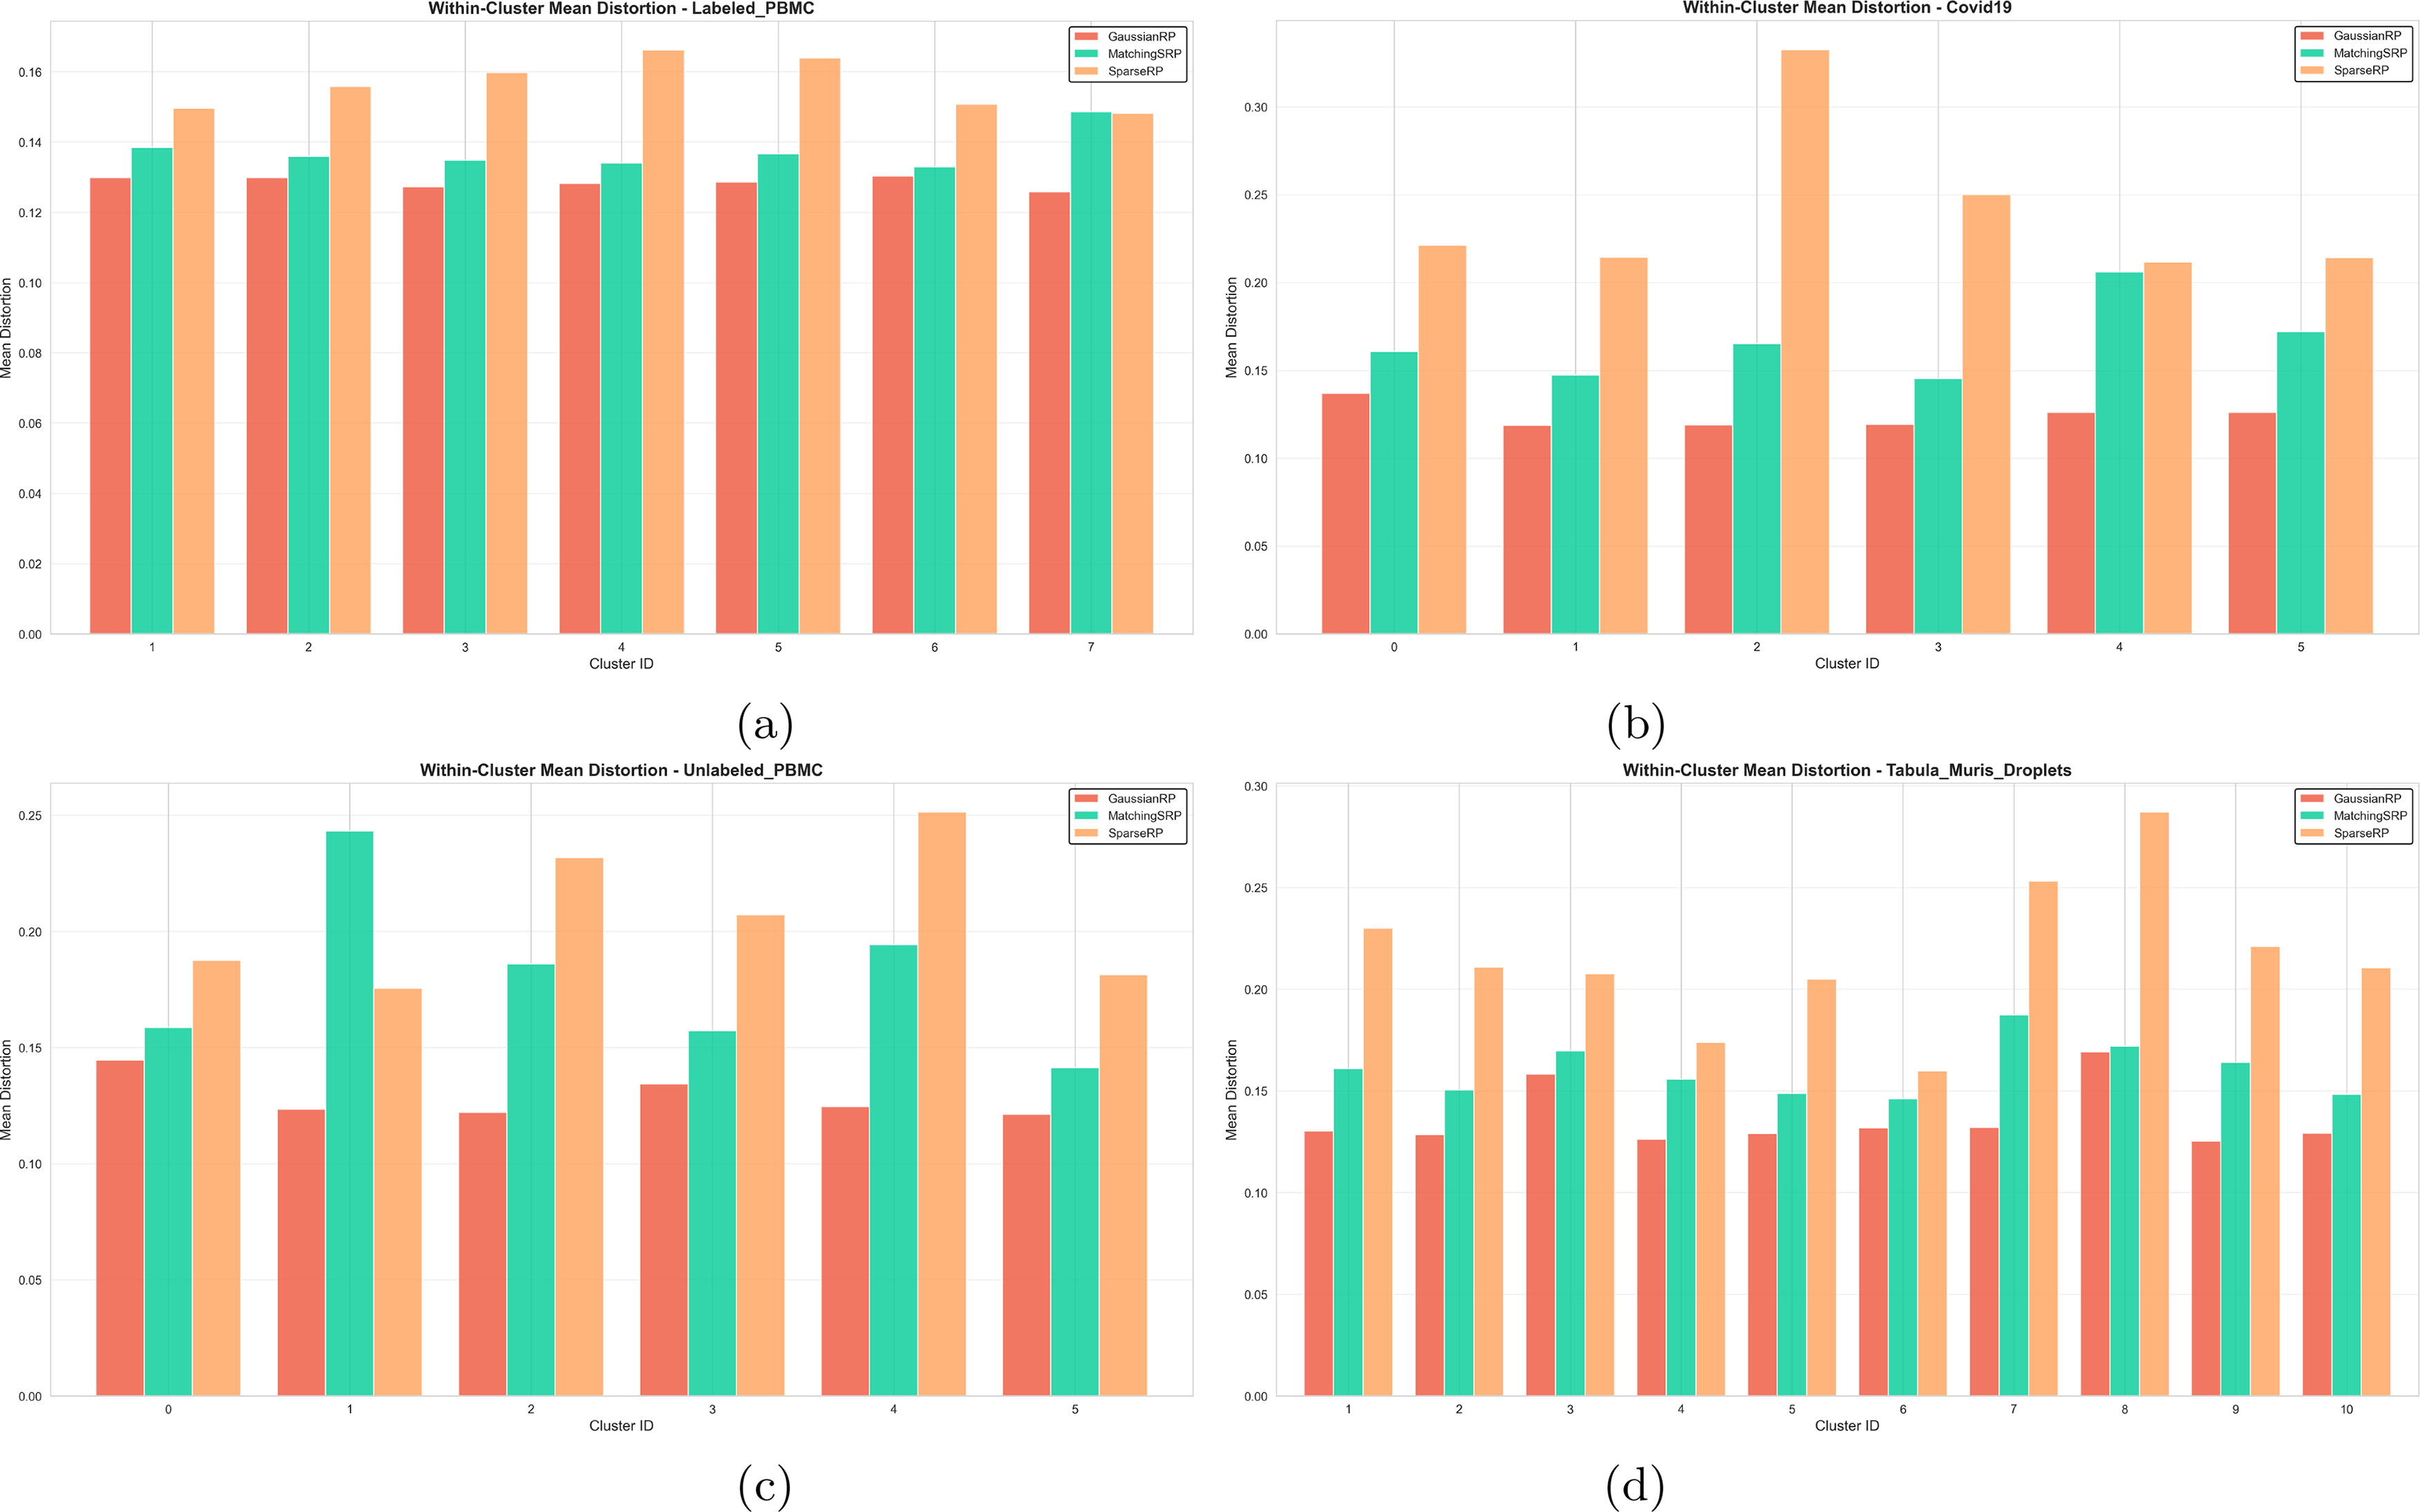
Figure 9 presents the within-cluster mean cosine distortion for all three RP methods (GRP, Matching SRP, and SRP) across the four datasets analyzed. This metric is particularly important because it directly measures how well the projection maintains the relationships between cells that are known to be similar.
Within-cluster mean cosine distortion for
We compared the ability of PCA and RP to preserve locality or pairwise similarity of cells by projecting the Sorted PBMC dataset and the Jurkat-293 T 50-50 Mixture dataset into a 2D space using UMAP. Figure 10 shows that SRP results in a visually similar UMAP to PCA, preserving essential data relationships crucial for downstream analyses, such as clustering or other. To quantify the locality preservation further, we calculated cluster accuracy metrics for PCA and RP when using 500 embeddings or components each, followed by applying UMAP to project further to a three-dimensional UMAP space. SKMeans Clustering accuracy and Mutual Information metrics using the resulting UMAP components are given in Table 2.

UMAP 2D projection of the Sorted PBMC dataset with dimensionality reduction of PCA and GRP of 500 components.
Comparison of Single-Cell RNA Sequencing Datasets
Clustering Performance Metrics for Jurkat at 500 Components and after UMAP to 3D
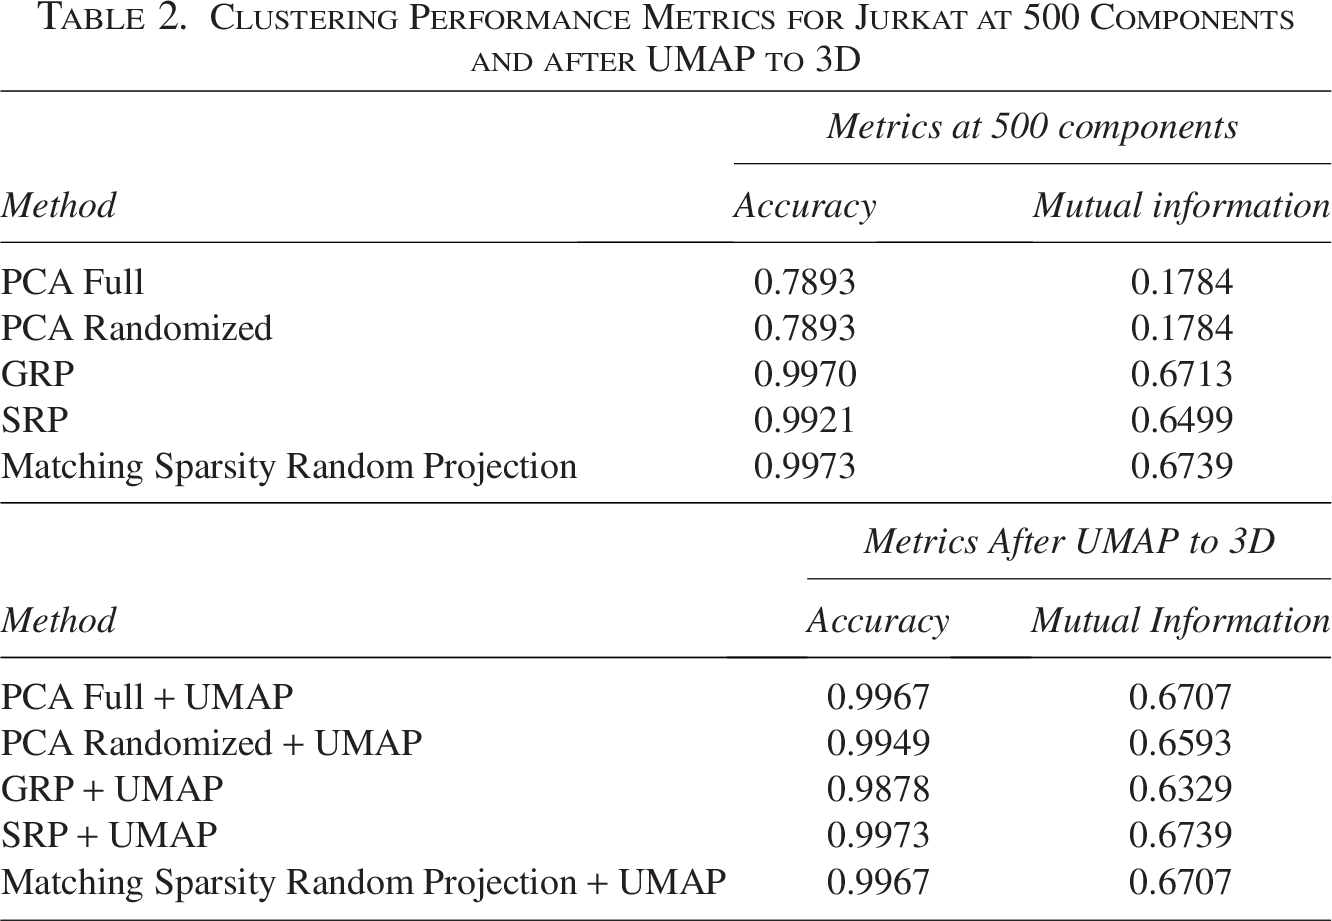
Figure 11 demonstrates the execution times of the dimensionality reduction methods across all the datasets. Additionally, we conducted an experiment in which we varied the size of the targeted PBMCs by Gibbs sub-sampling cells to create multiple datasets of varying sizes ranging from 1000 to 10,000 cells with steps of 1000; using these datasets, we assessed the execution time in relation to dataset size. Figure 12 highlights the scalability of RP methods across increasing dataset sizes, with SRP consistently being the most efficient method, even for the largest sample sizes.
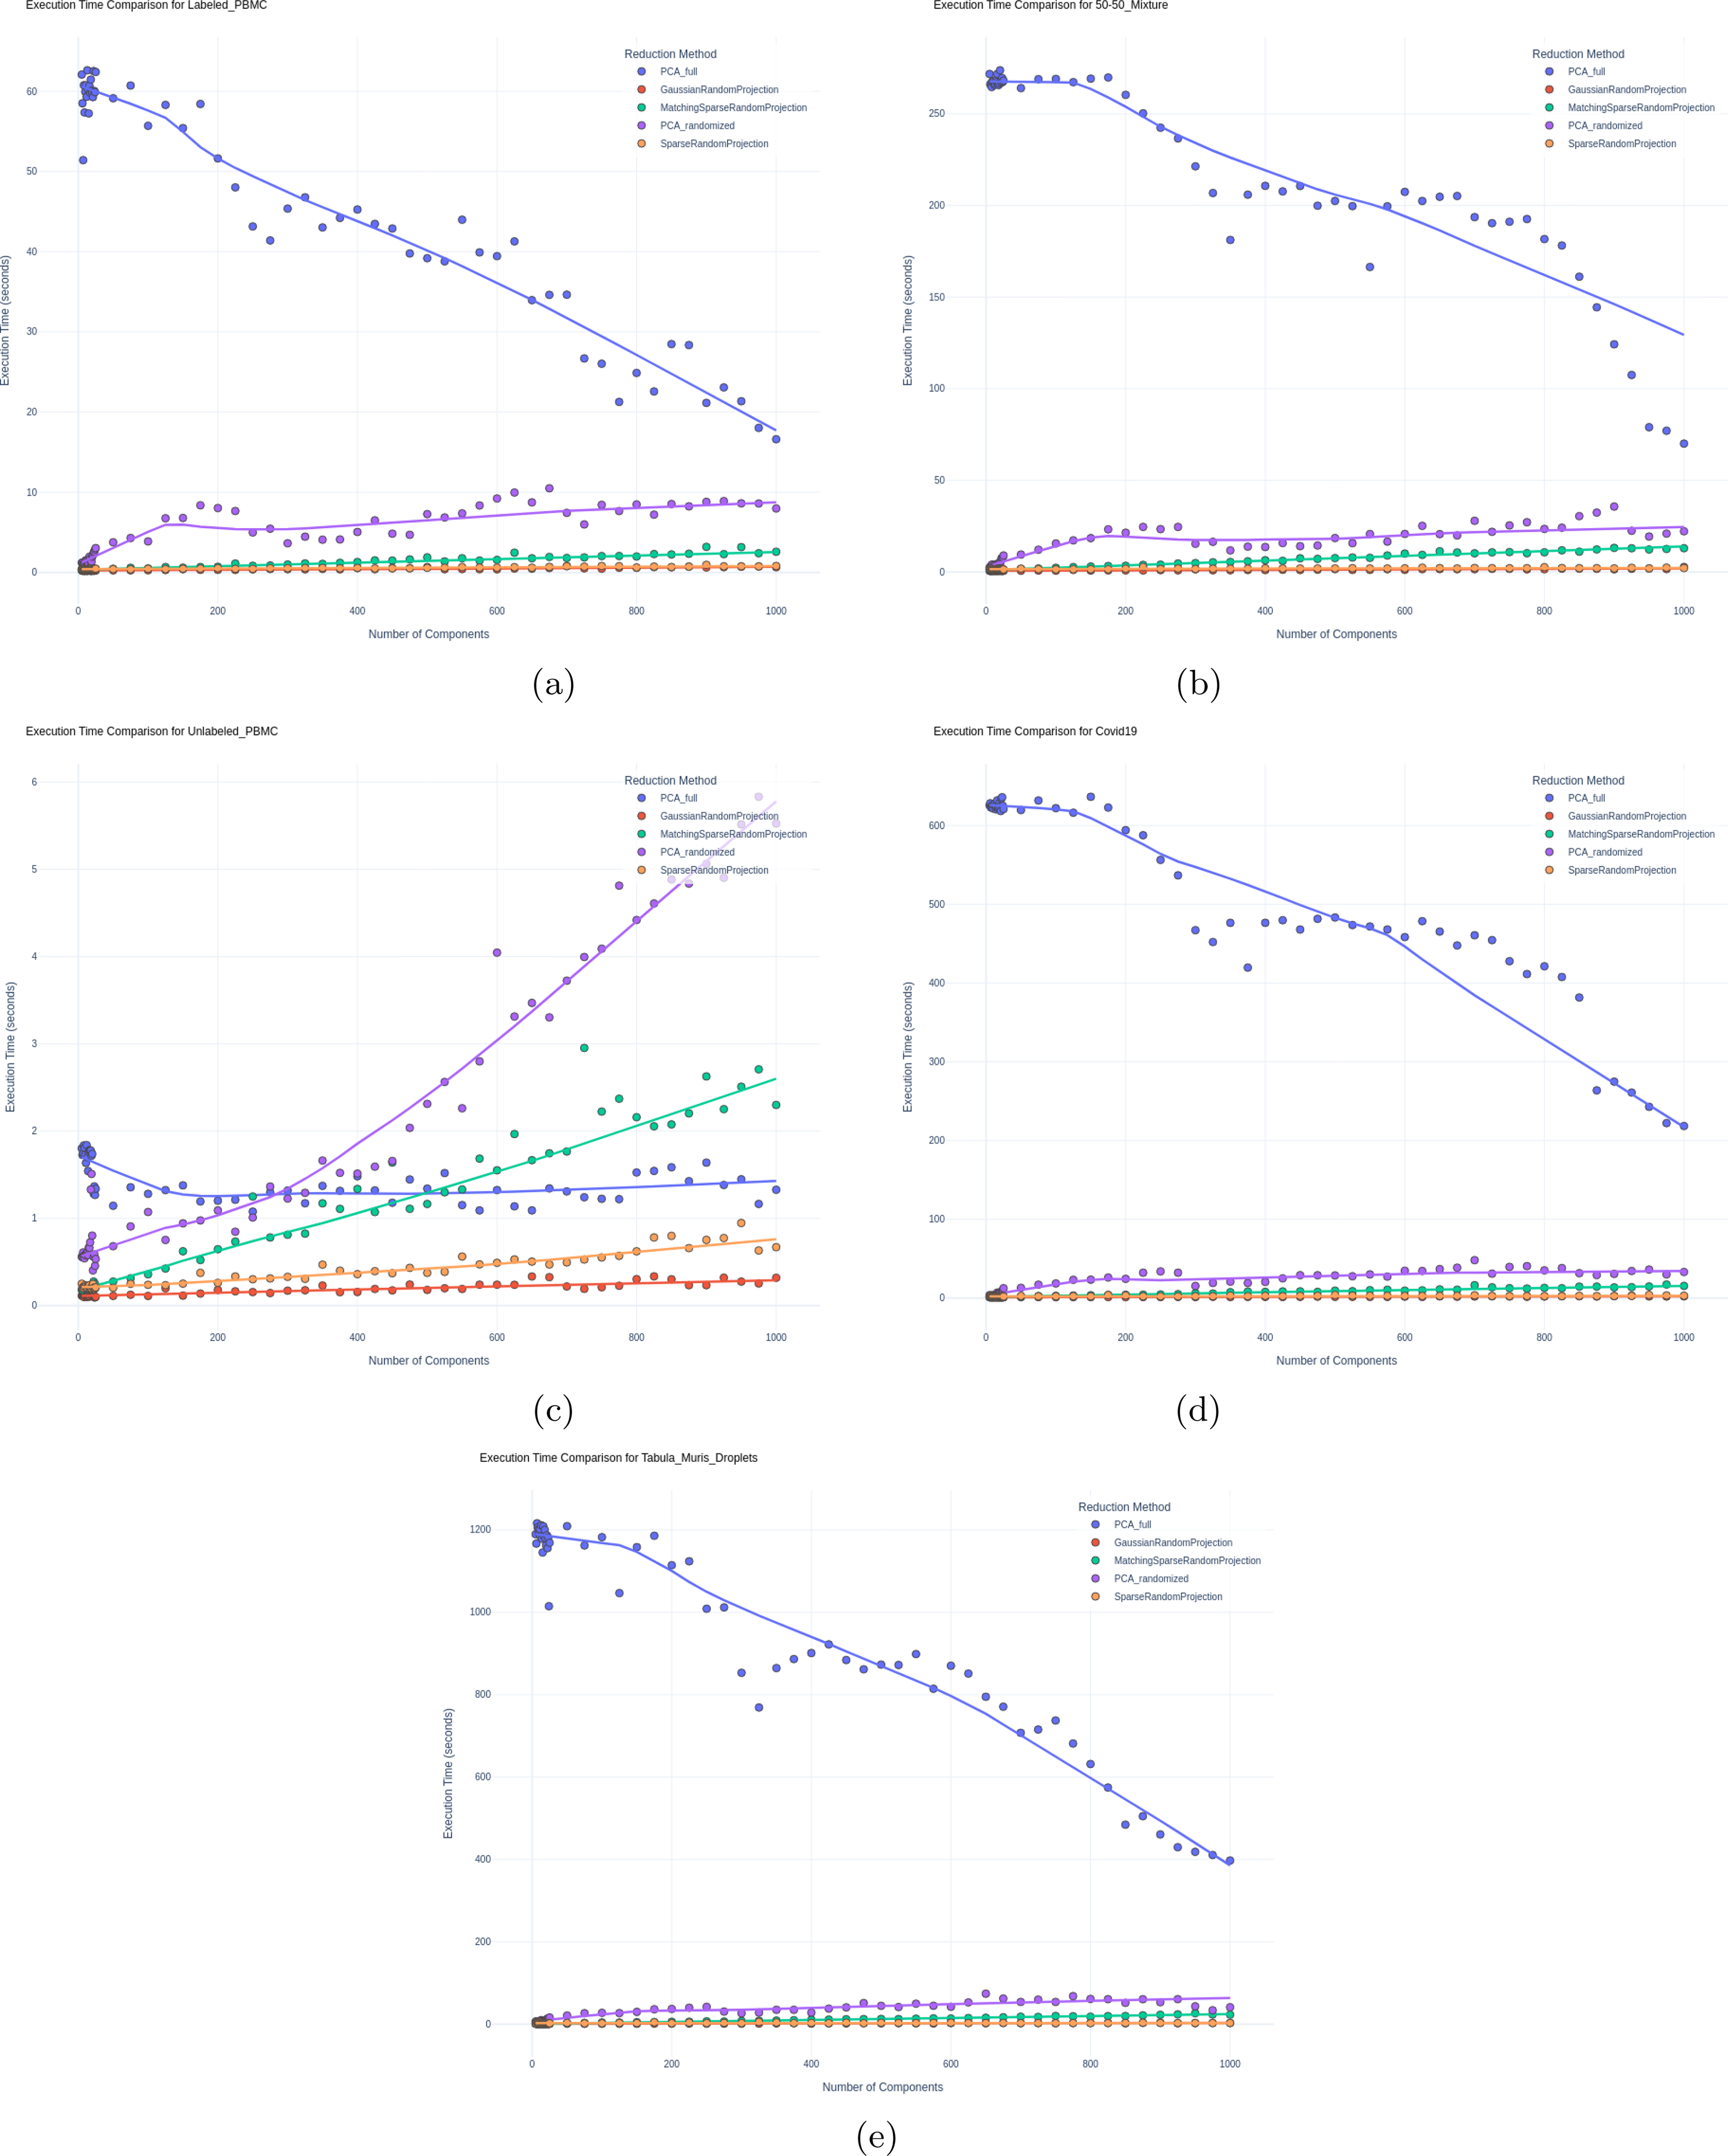
Execution time vs. number of components for each dimensionality reduction technique on the

Execution time vs. dataset sizes (1000–10,000 samples) for each of the dimensionality reduction techniques.
Our results show that RP exceeds PCA in clustering accuracy across various datasets. As shown in Figures 2 and 3, SRP, GRP, and the Matching Sparsity Random Projection variants of RP achieved higher accuracy compared to PCA (both Full and Randomized SVD) on the Jurkat-293T 50-50 Mixture dataset, with both Hierarchical and SKMeans clustering methods. In the labeled PBMC dataset, PCA performed slightly better in lower-dimensional spaces, but as dimensionality increased, RP either matched (for Hierarchical clustering) or surpassed PCA (for SKMeans); this can indicate PCA’s susceptibility to noise in higher dimensions. We also observe the same trend with the Tabula Muris dataset; however, RP with all versions performs better, even at lower dimensions.
This trend is similarly reflected when considering the Mutual Information Index, suggesting RP’s superiority in the 50-50 Mixture dataset. While RP initially underperforms in lower dimensions in the labeled PBMC dataset, it begins to surpass PCA as more components are added, suggesting RP’s increasing reliability with higher dimensions.
For the unlabeled datasets, RP again delivers improved performance over PCA. Figure 4 shows that RP consistently exceeded PCA in Dunn index values on the COVID-19 dataset across both clustering algorithms. In the unlabeled PBMC dataset, RP and PCA had nearly identical performance in lower dimensions, but RP gained an advantage as dimensionality increased for both clustering algorithms.
In Figure 5, we assessed clustering separation with the Gap Statistic on the unlabeled datasets, where RP again consistently surpasses PCA. These results reinforce the effectiveness of RP, particularly in higher dimensions and across various datasets, emphasizing its potential as a superior dimensionality reduction method for clustering tasks compared to PCA.
In Figures 6 and 7, the box plots reveal that RP methods generally display higher WCSS variability compared with PCA, especially in the range using a higher number of components (>25) (Note the median line in all box plots). This increased WCSS median value reflects a broader spread within the clusters formed by RP, which, while resulting in slightly looser clusters, does not detract from RP’s overall clustering accuracy. Interestingly, as dimensionality increases, the variability of the WCSS measure itself (inter-quartile range of the box plots) decreases for RP, suggesting that RP’s clustering performance becomes more stable and consistent at higher dimensions, still preserving more variability than PCA (higher median line).
Indeed, for all labeled data as well as for the COVID-19 dataset, the box plots further show RP’s tendency toward higher WCSS across dimensions. Despite this variability, RP consistently performs well in clustering accuracy, as supported by the measured evaluation metrics. For the Unlabeled PBMC dataset, a targeted gene panel dataset, both PCA and RP show relatively similar WCSS values in higher dimensions. RP’s variability is decreased when fewer components are used, reflecting the importance of all genes in the panel for capturing the latent variability of this dataset.
Figure 9 shows the mean within-cluster cosine distortion for GRP, MatchingSRP, and SRP across the four datasets. In all cases, the distortions are relatively small, showing preserved relations between original and projected space; however, there are clear and consistent differences between methods, placing GRP (lowest) and MatchingSRP with lower mean distortion (i.e., better) than SRP. For example, in the labeled PBMC dataset (Fig. 9a), GRP has the lowest within-cluster distortion in every annotated cell type, with MatchingSRP and SRP slightly higher, and MatchingSRP performing better than SRP. The COVID-19 dataset (Fig. 9b) shows stronger differences between the methods. GRP and MatchingSRP are similar in several clusters, but SRP has a higher mean distortion across the clusters. The Tabula Muris droplet dataset (Fig. 9d) shows more alternation between GRP and MatchingSRP. GRP has the lowest distortion in many clusters, while MatchingSRP is best in several others. SRP, however, remains the method with the highest distortion in nearly every cluster.
Finally, Figure 12 illustrates RP’s clear and significant advantage in terms of execution time. We measured the execution time across all datasets for different numbers of components; RP, especially GRP, consistently and significantly outperformed both PCA methods, highlighting the strength of this method from the computational complexity perspective.
We noticed an interesting phenomenon where PCA with Full SVD shows some decrease in execution time at higher dimensions. This can be explained by the effect of sparsity in the produced embeddings with higher components (i.e., when higher dimensions are calculated, the per-component mean value is lower as shown in Fig. 13). Another interesting observation: in (c), the lower-dimensional targeted panel dataset, the randomized PCA performs better than Full SVD PCA up to a certain point before becoming less efficient, highlighting the overhead of performing randomization when not needed for lower-dimensional data.
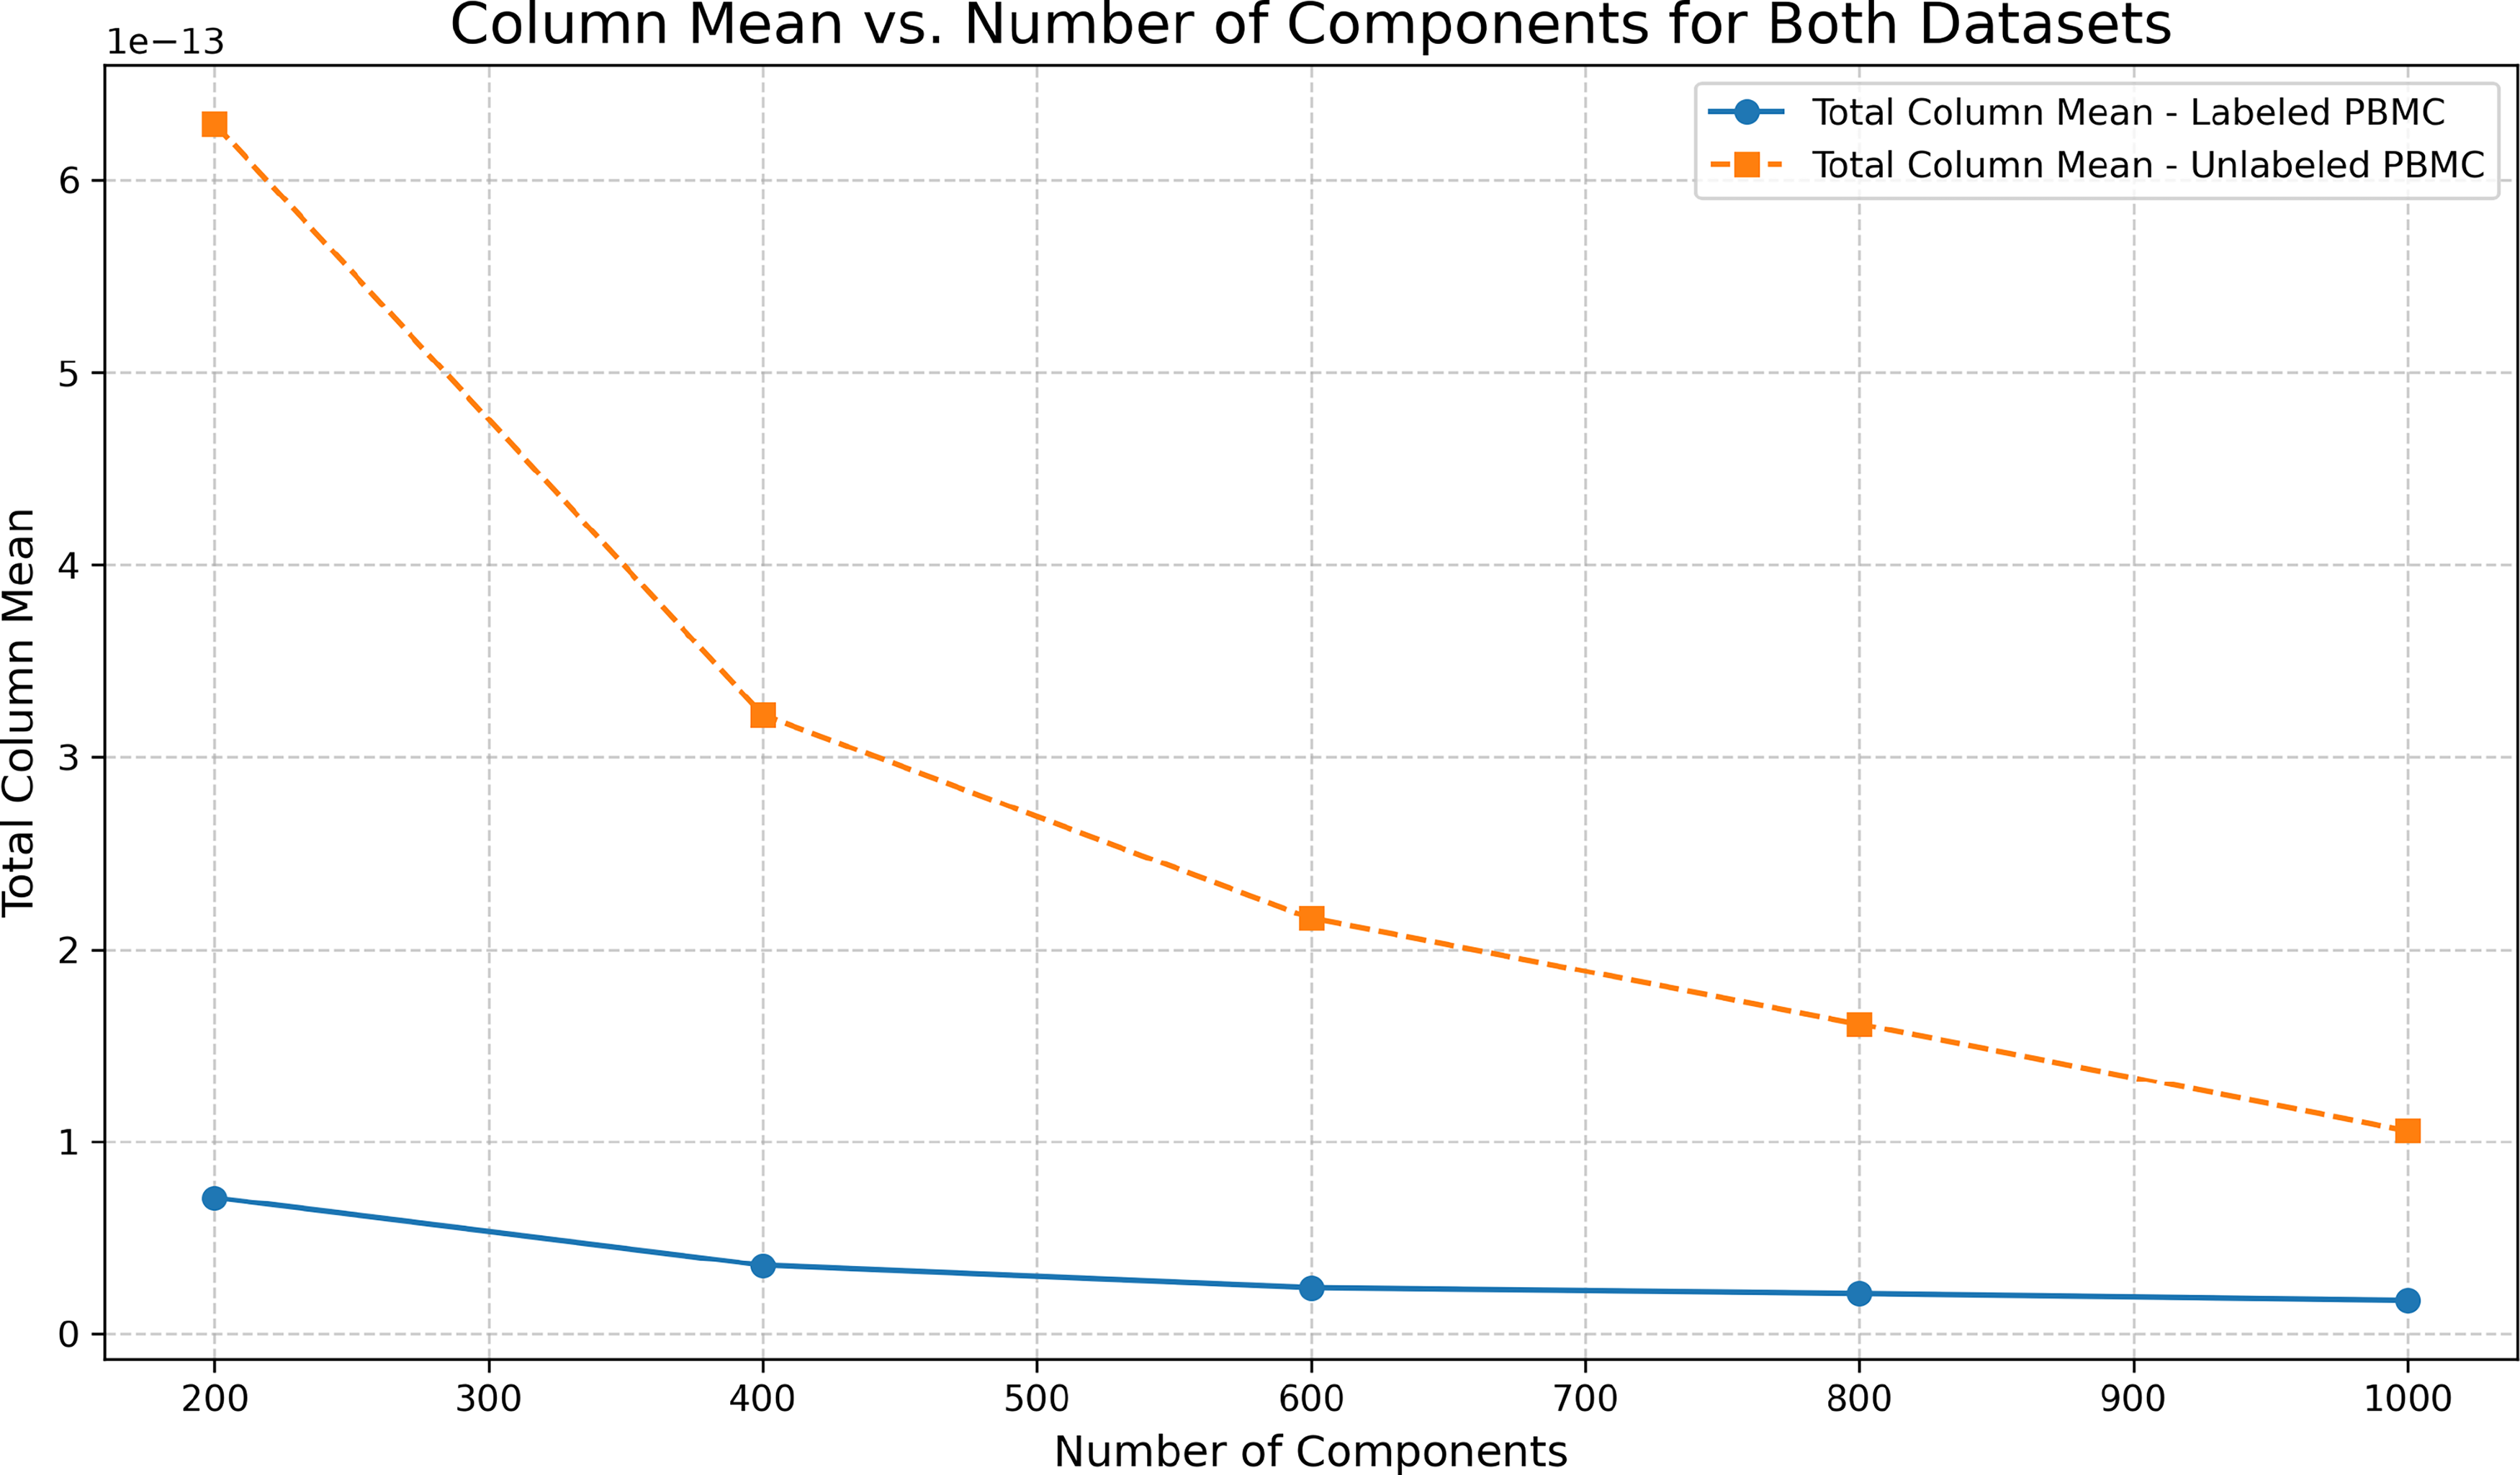
Mean value per component vs. number of components calculated for labeled and unlabeled PBMC datasets, highlighting the impact of PCA Full SVD on execution time.
All in all, and across all datasets, RP demonstrates superior performance in execution time and downstream analysis, highlighting its practical advantages and value in single-cell RNA-Seq analysis.
This study demonstrates that RP can outperform PCA in scRNA-seq analysis, especially in clustering tasks across various datasets, particularly as more dimensions are considered. RP, especially the SRP and GRP variants, achieved higher clustering accuracy and faster execution times compared to PCA. Although PCA performed slightly better in lower dimensions on some datasets, RP consistently excelled in higher-dimensional spaces, showing strong results across accuracy metrics such as the Mutual Information Index and Dunn Index. While RP sometimes resulted in broader cluster spreads, this variability did not compromise clustering performance, particularly in high-dimensional settings.
Data and code availability
The data and code used for this analysis are available on
GitHub: https://github.com/moussa-lab/BenchmarkingPCA-RP or upon reasonable request to the authors.
AUTHORS’ CONTRIBUTIONS
M.A.: Conceptualization, software, formal analysis, data curation, writing—original draft, visualization, and project administration. M.R.M.: Conceptualization, methodology, validation, formal analysis, investigation, data curation, writing—review and editing, supervision, and funding acquisition.
Footnotes
AUTHOR DISCLOSURE STATEMENT
Nothing to disclose.
FUNDING INFORMATION
This work is supported by the following awards:
NSF-2341725, NSF-2443386, NSF-2409466, NIH-NCI K25CA270079, and OU-BIC2.0. Financial support was also provided by the University of Oklahoma Libraries' Open Access Fund.