
Abstract
Recently, deep cell clustering, which employs deep neural networks to learn cell representation for clustering purposes, has attracted increasing research interests. Traditional deep cell clustering models for single-cell RNA sequencing data rely only on the cell’s internal features for learning the representation and suffer from the insufficient problem of representation learning. In this article, we introduce a deep structural enhanced network for cell clustering, namely, Deep Structure-Enhanced Cell Clustering (scDSEC). The scDSEC model uses the internal features of the cells as a foundation and enhances them by incorporating the external structural semantics of the cells. An integrated reinforcement enhancement strategy is designed, in which a complete cell representation, captured by fusing cell internal information and external information, and an enhanced cell internal representation, captured with the help of complete cell representation, are learned in a layer-by-layer reinforcement manner. Experimental results show that the scDSEC model outperforms various existing mainstream deep cell clustering algorithms in terms of performance.
Keywords
INTRODUCTION
Single-cell RNA sequencing (scRNA-seq) technology (Yu et al., 2022, 2024) is a revolutionary advancement in the biomedical field in recent years, enabling high-throughput sequencing of gene expression at the single-cell level, thereby revealing complex biological processes and intercellular heterogeneity. Unlike traditional RNA sequencing, which can only obtain average expression information from a population of cells, scRNA-seq allows for in-depth analysis of the characteristics and functions of individual cells, showcasing immense potential in fields such as cancer research, immunology, developmental biology, and neuroscience. For instance, scRNA-seq can identify cell types within the tumor microenvironment, analyze the functional states of immune cells, and track the differentiation trajectories of cells during embryonic development. Clustering, as an essential step in analyzing scRNA-seq data, helps identify different cell types or states by grouping similar cells together. Therefore, researching clustering methods for scRNA-seq data not only aids in better understanding the diversity and complexity among cells but also holds broad application prospects and significant importance.
Early cell clustering methods, such as K-means (Hartigan and Wong, 1979) and hierarchical clustering (Nielsen and Nielsen, 2016), were able to capture patterns and structures within scRNA-seq data to some extent. In addition, graph-based methods such as (Leiden Traag et al. and Louvain Ghosh et al., 2018) clustering are commonly used. These methods construct a k-nearest neighbor (kNN) graph of cells based on gene expression similarities to identify clusters. Overall, these traditional approaches provide important tools for understanding cellular heterogeneity. However, traditional clustering methods perform poorly on the high-dimensional scRNA-seq data, are easily affected by the sparsity of scRNA-seq data, and are sensitive to noise and outliers, significantly diminishing the accuracy and stability of cell clustering. For example, noise may lead to incorrect assignment of cells to different clusters, while sparsity may obscure actual intercellular differences.
In recent years, with the development of deep learning, deep cell clustering methods (Chen et al., 2020; Tian et al., 2019) have gradually become a research hotspot due to their excellent clustering performance on high-dimensional and sparse scRNA-seq data. These methods refine clustering iteratively by using auxiliary target distributions to learn highly reliable assignments, resulting in better cell clustering outcomes. However, traditional deep cell clustering models typically rely solely on the inherent features of each cell data sample to learn its internal representation. This approach mainly considers the internal features of cells, but due to the limited gene length of each cell, the descriptions often only encompass part of the distinguishing features, potentially overlooking other key characteristics. Thus, relying solely on internal cell features can lead to incomplete cell representations, causing similar cells to be incorrectly deemed dissimilar due to differing feature sets. This incomplete cell representation makes it challenging for traditional methods to accurately reflect the true relationships between cells, thereby affecting the accuracy of deep cell clustering.
In real scRNA-seq data, in addition to the internal features of the cells, there is also useful external information that can be discovered outside of each cell. For instance, neighboring cells, which refer to cells similar in gene expression profiles, are considered external structural information that typically contains meaningful supplementary features missing from the internal features of the cells themselves. Therefore, it is beneficial to improve the internal representations of cells by utilizing such external structural information. Although some traditional clustering methods, such as Leiden, utilize KNN graphs to group similar cells, they primarily rely on these graphs for clustering assignments and do not explicitly leverage external structural information to enhance internal cell representations.
To address these issues, this article designs a Deep Structure-Enhanced Cell Clustering (scDSEC) model for scRNA-seq data, which employs a structural enhancement network to learn cell partitions. Specifically, the scDSEC model uses the internal features of the cells as a foundation and enhances them by incorporating the external structural semantics of the cells. For each cell, an autoencoder (AE) (Hinton and Salakhutdinov, 2006) is used to capture its internal representation by mapping the original high-dimensional internal cell features to a low-dimensional representation space. A graph convolutional network (GCN) (Kipf and Welling, 2017) model is employed to learn the external representation of each cell, as it has shown superior results in representing scRNA-seq data as graphs and encoding external structural information for each cell sample. Both the AE and GCN models can capture the latent information of cells at different levels through their multilayer network architectures.
To utilize external information to enhance internal representations of cells, a common strategy is to assume that each cell representation is independent, learning these different cell representations separately and directly combining these learning results through a conventional fusion process (Bai et al., 2021; Shi et al., 2020). However, in reality, the internal and external representations of cells are not independent but are interrelated. A well-learned external representation can be used to emphasize, supplement, and eliminate ambiguities in internal cell features, which in turn helps to improve internal cell representations. Therefore, utilizing external structural information to enhance internal representations during the learning process is beneficial. The scDSEC model designs an integrated reinforcement enhancement strategy for cell representation learning, capable of simultaneously learning enhanced internal cell representations and integrated cell representations layer by layer. By integrating the integrated representations learned from internal and external representations, it captures the complete semantic features of both the internal content and external structure of cells. Subsequently, enhanced internal cell representations are learned based on the integrated representations of cells. The enhanced internal representations and integrated representations of cells are reinforced layer by layer, allowing the cell information learned in the previous stage to be used to further enhance the subsequent representation learning process. Additionally, the scDSEC model also designs a joint objective function to simultaneously achieve the learning of cell cluster partitioning and optimize the cell representation learning network of the scDSEC model.
The main contributions of this article can be summarized as follows:
This article designs a Deep Structure-Enhanced Cell Clustering (scDSEC) model for scRNA-seq data, employing a structural enhancement network to learn cell partitions. Specifically, the scDSEC model utilizes the internal features of the cells as a foundation and enhances them using the external structural information of the cells. This article proposes an integrated reinforcement enhancement strategy for cell representation learning. The strategy progressively fuses internal and external representations to form a more comprehensive and discriminative cell embedding. Enhanced internal representations are refined under the guidance of integrated representations, and both are jointly optimized in a layer-by-layer reinforcement manner to achieve more robust and biologically meaningful clustering results. This article conducts extensive experiments on real scRNA-seq datasets, comparing the proposed scDSEC model with several state-of-the-art clustering models. The experimental results demonstrate that the scDSEC model is effective and significantly improves cell clustering performance.
Deep cell clustering methods based on internal cell representations
In recent years, deep cell clustering methods for analyzing scRNA-seq data have received widespread attention due to their powerful capabilities in cell representation learning. For example, scDeepCluster (Chen et al., 2020) combines Deep Clustering Network (Yang et al., 2017) and Deep Embedded Clustering (Xie et al., 2016) to simultaneously learn latent feature representations and clustering assignments. The model-based deep learning approach (scziDesk) (Tian et al., 2019) employs a weighted soft K-means algorithm in the latent space to achieve high-quality cell clustering. The deep multi-constraint soft clustering model for single-cell RNA-seq data via zero-inflated autoencoder embedding (scMCKC) (He et al., 2023) introduce cell-level compactness constraints by considering the associations among similar cells. The denoising adaptive deep clustering with self-attention mechanism (scDASFK) (Su et al., 2023) incorporates cell similarity information into clustering methods and uses deep denoising network modules to clean the data. Overall, these methods integrate feature representation learning and clustering assignments to enhance final clustering performance. However, they only consider gene expression information without explicitly describing the relationships and structural information between cells, neglecting the relationships among cells.
Deep cell clustering methods based on external structural representations
In recent years, deep graph clustering methods have significantly addressed the aforementioned issues by learning latent low-dimensional representations while considering the global structure of the entire graph. To this end, many researchers have proposed various deep graph embedding clustering methods to learn the structural information and associations between cells. For instance, the single-cell model-based deep graph embedding clustering (scTAG ) (Yu et al., 2022) and the deep graph clustering model for single-cell transcriptomics data based on unsupervised Gene-Cell Collective representation learning and Optimal Transport (scGCOT) (Yu et al., 2024) utilize graph neural networks to encode both the topological relationships between cells and the attributes of individual cells, thereby enhancing clustering accuracy. Overall, existing state-of-the-art graph embedding clustering methods extract cell associations to better understand gene expression. However, they only consider external structural information, neglecting the internal gene expression information of the cells themselves.
Recently, some studies have begun to incorporate both internal and external information to enhance the clustering process. The Structural Deep Clustering Network (SDCN) (Bo et al., 2020) integrates structural information into deep clustering by designing a transfer operator that passes the representations learned by an AE to corresponding GCN layers. Building upon SDCN, the Deep Fusion Clustering Network (DFCN) (Tu et al., 2021) further refines this approach by dynamically combining the structural representation to enrich the semantic representation at the final layer. Despite the success of these models, both SDCN and DFCN are not ideally suited for cell clustering tasks. This limitation arises because these models were developed primarily to leverage GCN-based structural information for clustering. Consequently, the structural representation derived from GCNs, which often includes significant noise for cell data, serves as the base representation. Additionally, the importance of gene features, which has been well recognized in prior literature, is not fully explored and only plays a supplementary role in the SDCN and DFCN models. As a result, these models are more effective for tasks that emphasize structural data processing. In contrast, the scDSEC model proposed in this article improves cell clustering performance by using the internal features of cells as the primary foundation and incorporating external structural information to enhance clustering outcomes.
PROPOSED MODEL
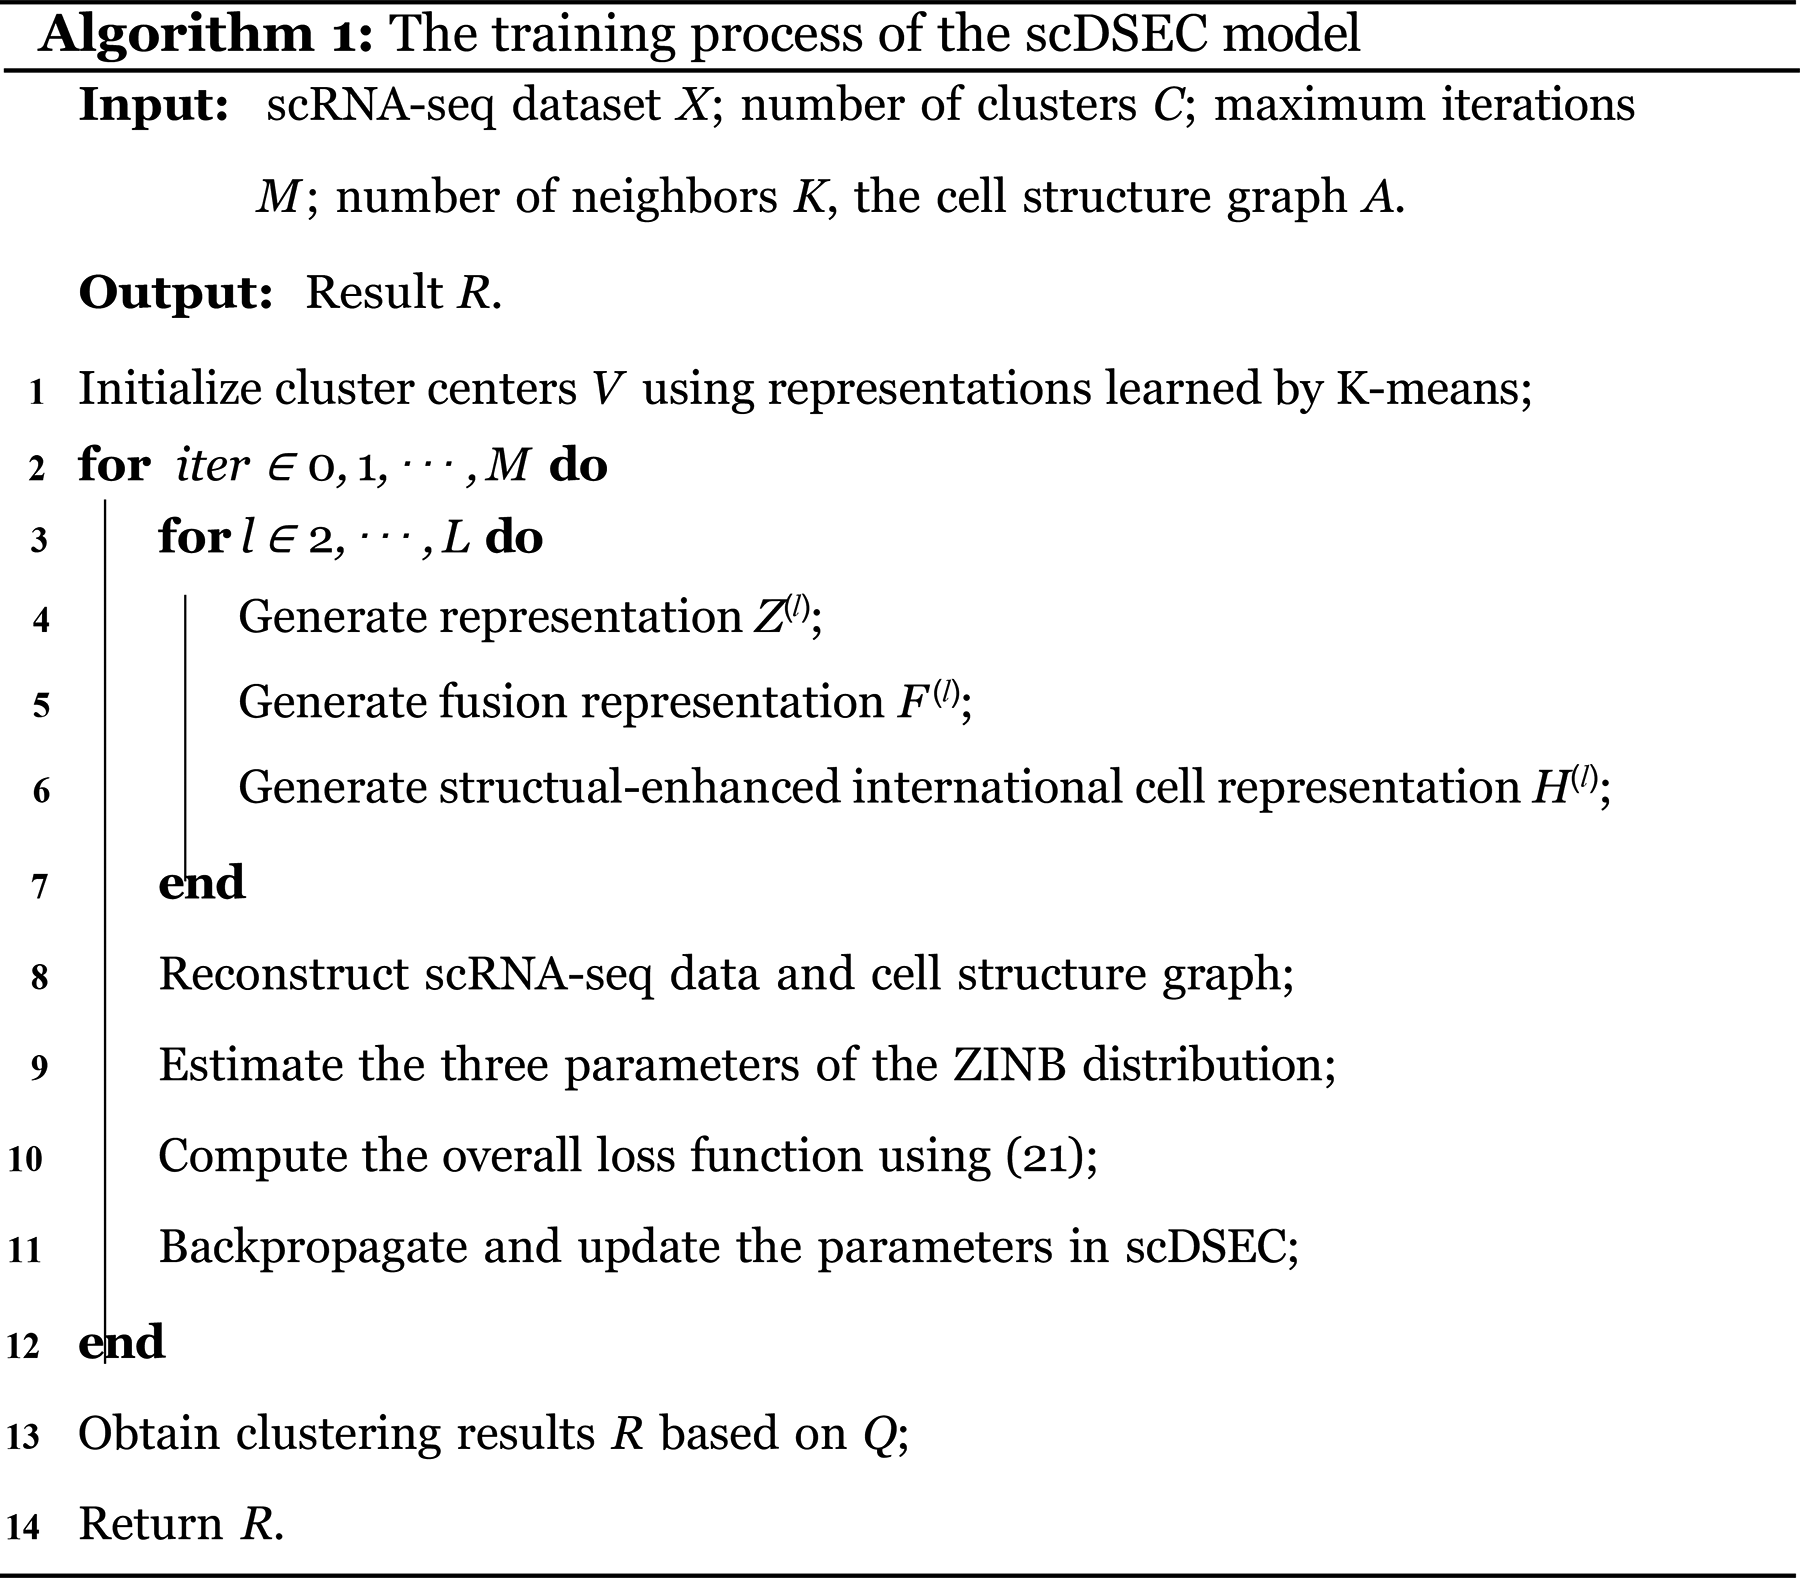
The overall framework of the proposed scDSEC model consists of four modules: The cell data processor, the structurally enhanced internal cell representation encoder, the Zero-Inflated Negative Binomial (ZINB)-based cell representation decoder, and the cell clustering module. First, for the scRNA-seq dataset, the scDSEC model normalizes the scRNA-seq data through the cell data processor and applies PCA for dimensionality reduction on the processed data. The structural-enhanced internal cell representation encoder uses external structural information to enhance the internal representations of cells at different levels, layer by layer, through an integrated reinforcement enhancement strategy. Next, the ZINB-based cell representation decoder takes the enhanced internal representations outputted by the internal cell representation enhancement learning module as input, reconstructs the cell data based on the ZINB (Miao et al., 2018; Risso et al., 2018) distribution, and reconstructs the cell structure graph using an inner product decoder. This design choice is motivated by previous findings that the distribution of scRNA-seq gene expression counts can be well approximated by a ZINB model (Yu et al., 2022). Finally, the cell clustering module optimizes the learning of enhanced cell representations through a joint objective function and performs the clustering of cell groups. The overall structure of the model is illustrated in Figure 1, which will be detailed in the following sections covering the four modules.
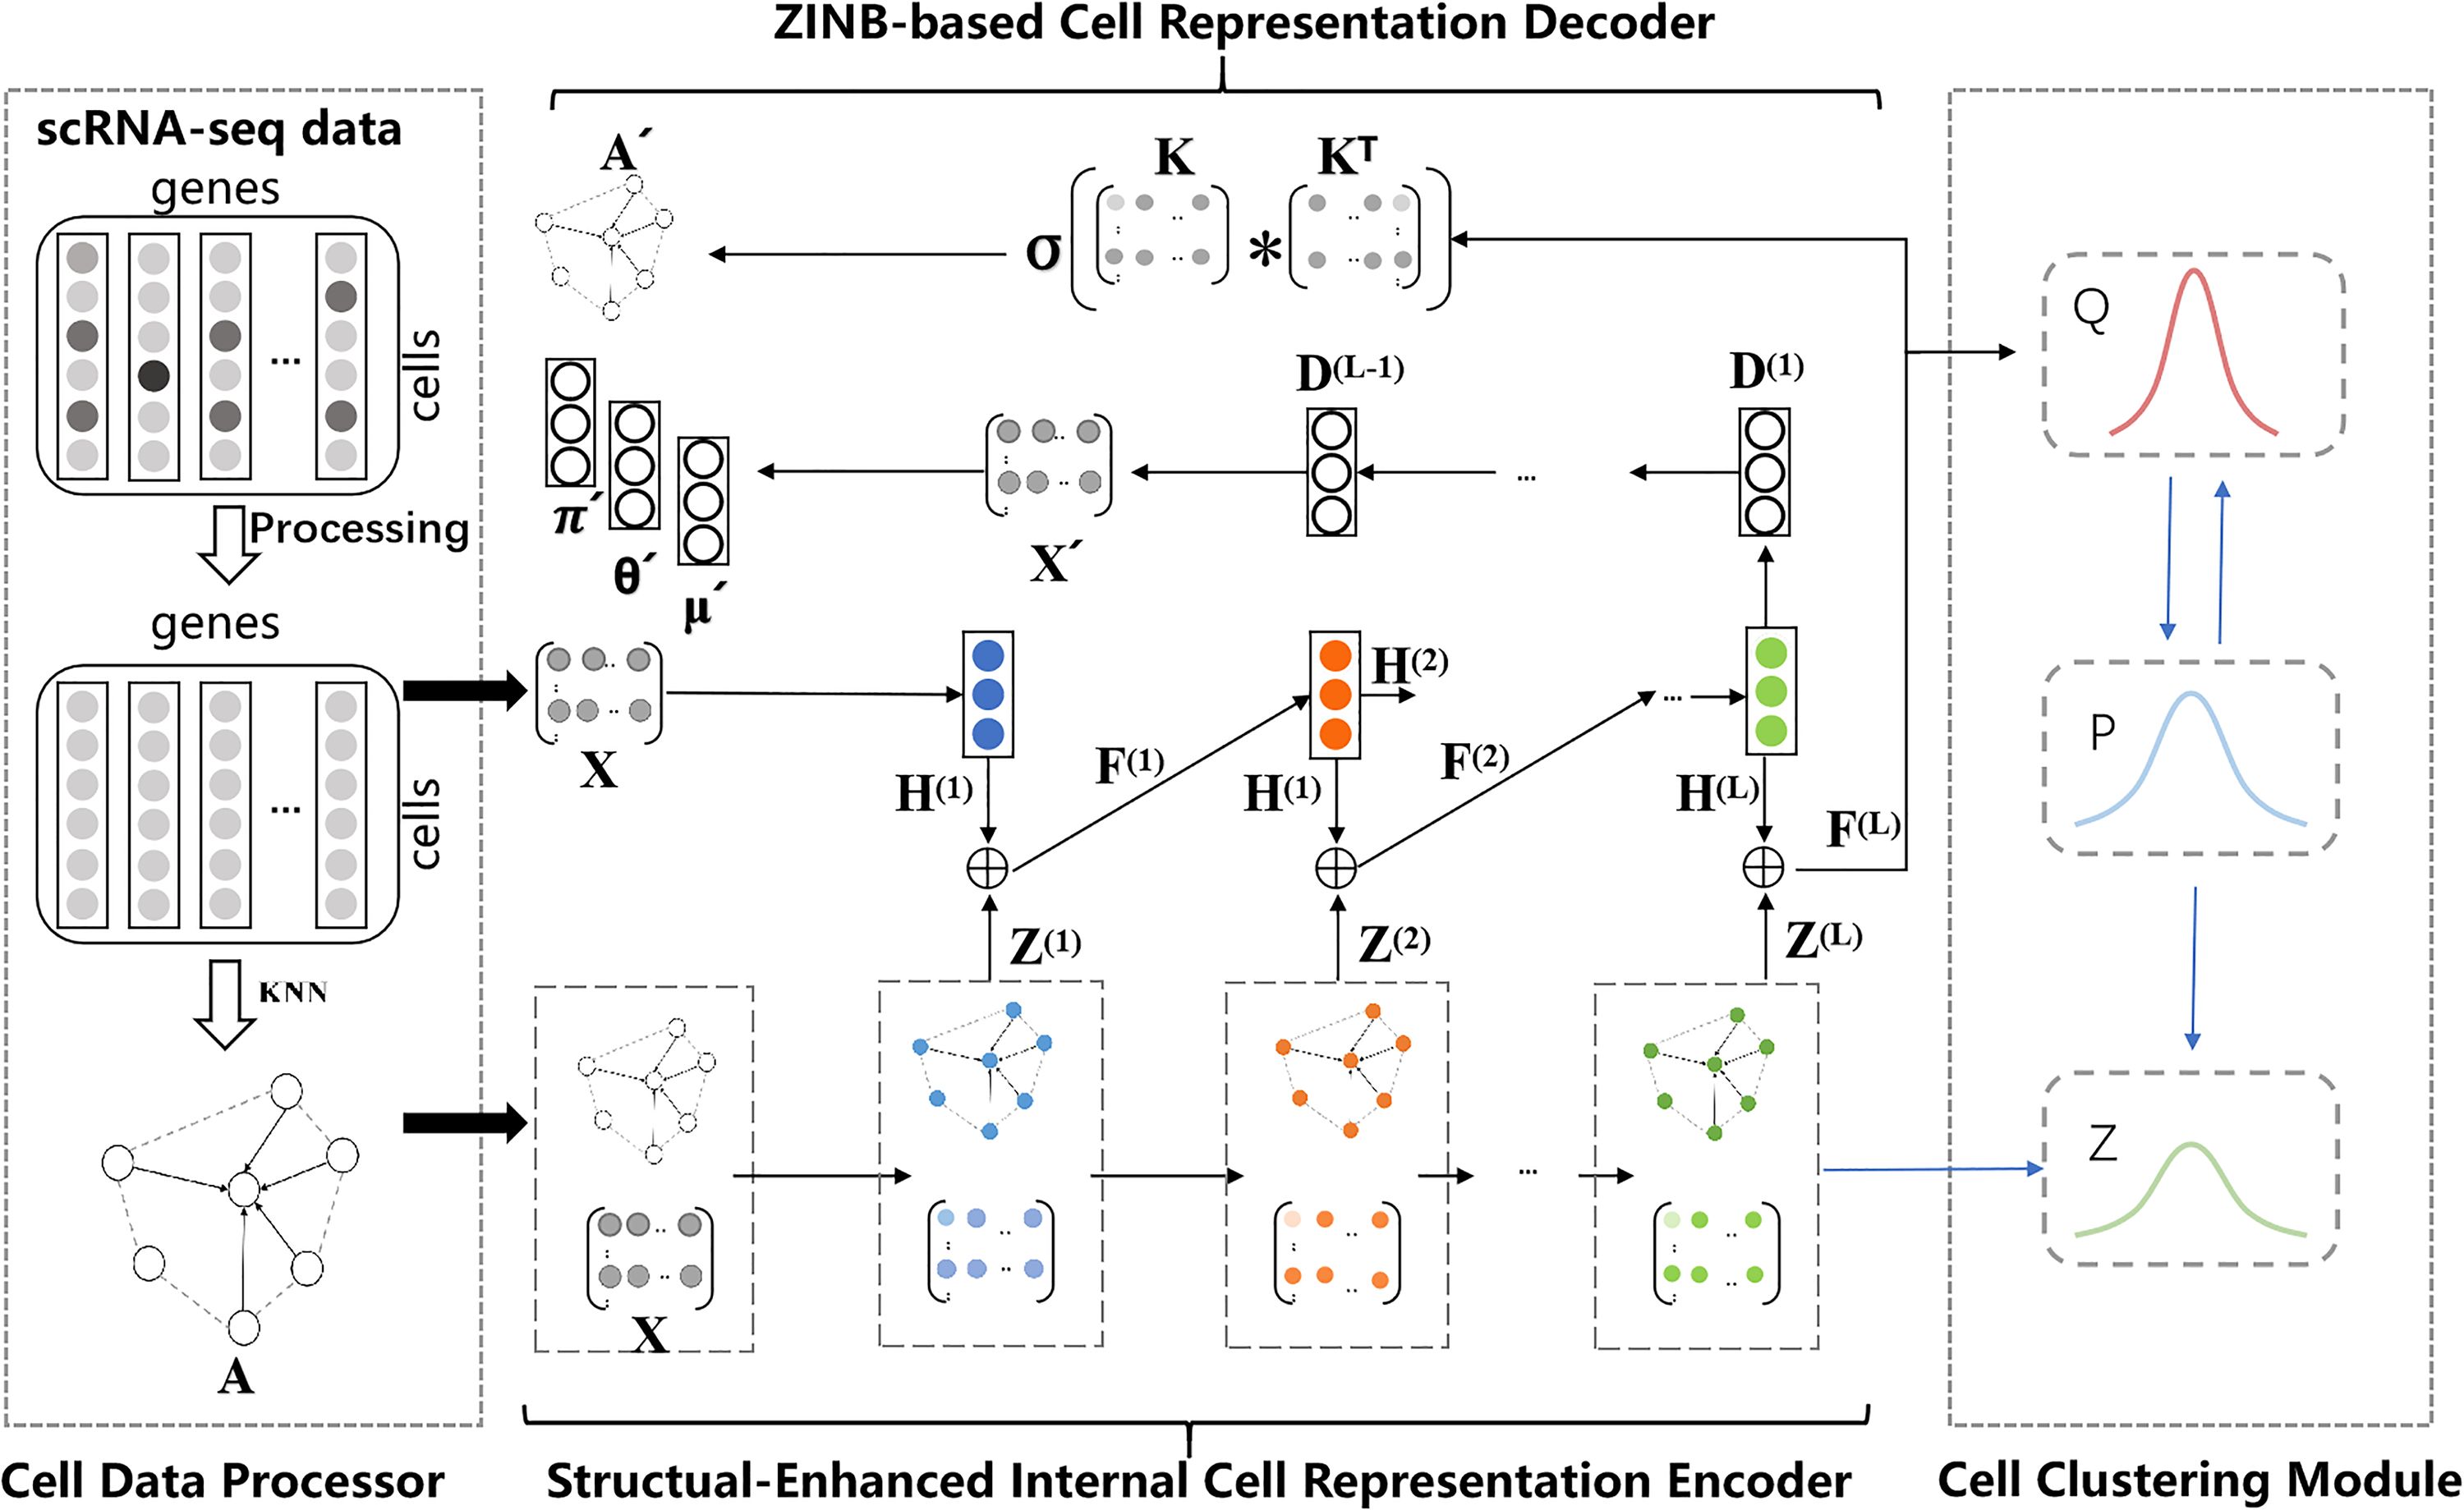
The framework of the proposed model (scDSEC). scDSEC, Deep Structure-Enhanced Cell Clustering.
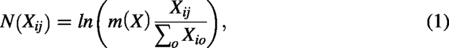
The cell data processor takes the scRNA-seq gene expression matrix as input, where Xij represents the expression count of gene j (1 ≤ j ≤ O) in cell i (1 ≤ i ≤ N). The first step is to filter out genes that are expressed in less than 1% of the cells or not expressed at all. Considering that the count scRNA-seq data in the matrix is discrete and varies greatly in size, the normalization is defined as follows:
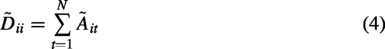
The scDSEC model constructs the cell structure graph A from the normalized expression matrix of the selected top t highly variable genes. To improve computational efficiency and reduce noise, PCA is first applied to obtain a lower-dimensional representation of the cells. Euclidean distance is then used to compute pairwise similarities between cells in this feature space, and the KNN algorithm is applied to identify the k nearest neighbors for each cell. Specifically, if node a is among the k nearest neighbors of node b, an edge is established between them. The resulting graph A represents the cell–cell neighborhood structure used in subsequent graph learning.
Due to the outstanding performance of graph convolutional neural networks (GCNs) in structural representation learning, the scDSEC model utilizes a multilayer GCN to learn external structural representations of cells in the structural-enhanced internal cell representation encoder. The specific design of the external structural representation learning network is as follows:


To learn enhanced internal representations of cells, the scDSEC model designs an integrated reinforcement enhancement strategy, which utilizes external structural information to enhance internal representations during the learning process, capable of simultaneously learning enhanced internal cell representations and integrated cell representations layer by layer. By integrating the integrated representations learned from internal and external representations, it captures the complete features of both internal content and external structure of cells. Subsequently, enhanced internal cell representations are learned based on the integrated representations of cells. The enhanced internal representations and integrated representations of cells are reinforced layer by layer, allowing the cell information learned in the previous stage to be used to further enhance the subsequent representation learning process. The specific design of the cell internal representation learning network is as follows:


To better guide the learning of cell representations, the scDSEC model designs a ZINB-based cell representation decoder. As shown in Figure 1, the ZINB-based cell representation decoder first decodes the enhanced cell internal representations H(
L
) output by the cell internal representation enhancement learning module, aiming to reconstruct both the cell data X and the cell structure graph A. The specific network structure is as follows:


The last layer of the decoding network can be expressed as follows:

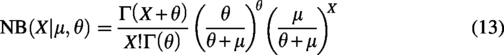
Given that scRNA-seq gene expression count matrices typically exhibit three characteristics, namely, (1) discreteness, (2) variance greater than the mean, and (3) many zero entries, these features can be modeled by a ZINB distribution. Therefore, to preserve the global structure of cell data X, the scDSEC model utilizes ZINB distribution as the target, combining it with the reconstructed cell data to better capture the structure of scRNA-seq data. Formally, ZINB is represented by the mean parameter μ and the dispersion parameter θ of the negative binomial distribution, along with an additional coefficient π (representing the probability weight of dropout events in scRNA-seq data):


The cell clustering module involves two tasks. The first task is to perform cell clustering using the enhanced internal cell representations H( L ) output by the structural-enhanced internal cell representation encoder. The second task is to optimize the cell representation learning network in the scDSEC model. Thus, the cell clustering module designs a joint objective function to accomplish both tasks simultaneously. This objective function incorporates four guiding pieces of information: clustering loss, the reconstruction loss of cell data, the reconstruction loss of cell data based on ZINB, and the reconstruction loss of the cell structure graph.
To learn the cell cluster assignments, given the i-th cell sample and the j-th cluster center, we use the Student’s t-distribution Van der Maaten and Hinton, 2008 to measure the similarity between the enhanced internal cell representation H(
L
) and the cluster center vj and let Q = qij represent the distribution of the cell clustering result. Therefore, similar to the approach in the literature, the clustering loss of the cells is calculated as follows:

The reconstruction loss of the cell data based on ZINB is calculated using the negative log-likelihood of the ZINB distribution, allowing the model to learn neural network layer parameters that best capture the scRNA-seq data’s characteristics. Thus, the loss function for this part is defined as follows:

The reconstruction loss of the cell representation is calculated as follows:

The reconstruction loss of the cell structure graph is calculated as follows:

Combining the above losses, the overall loss function of the scDSEC model is expressed as follows:

Experimental datasets
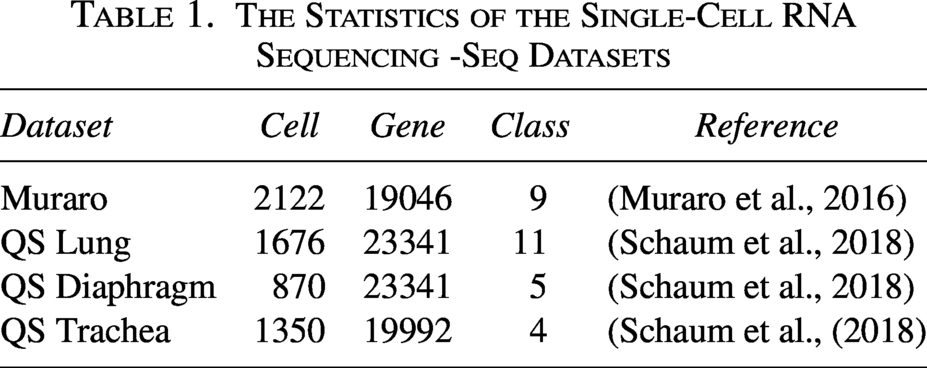
We perform our experiments using four real scRNA-seq datasets. These datasets include a variety of species, such as mice and humans, covering different types of cells, including lung cells and trachea cells. The statistics for these datasets are presented in Table 1.
The Statistics of the Single-Cell RNA Sequencing -Seq Datasets
The Statistics of the Single-Cell RNA Sequencing -Seq Datasets
We selected six state-of-the-art methods for comparison. Those compared baselines can be categorized into four groups as follows: (1) Traditional cell clustering method: Leiden (standard Scanpy pipeline); (2) deep cell clustering methods via internal representation learning: scEMC (Clustering method via skip aggregation network) (Hu et al., 2024); scMCKC (He et al., 2023), scDASFK (Su et al., 2023), and scVI (Deep generative modeling for single-cell transcriptomics) (Lopez et al., 2018); (3) deep cell clustering methods via external representation learning: scGCOT (Yu et al., 2024) and scTAG (Yu et al., 2022); and (4) deep clustering methods via internal and external representation learning: DFCN (Tu et al., 2021) and SDCN (Bo et al., 2020).
Evaluation metrics and experimental setup
To assess the performance of the clustering tasks, this chapter employs two widely used evaluation metrics: Normalized Mutual Information (NMI) (Estévez et al., 2009) and Average Rand Index (ARI) (Xia et al., 2014). Higher values for each metric indicate superior performance.
All experiments were conducted using the PyTorch platform and an NVIDIA 4060 TI GPU. In the proposed scDSEC, we set the dimension of the latent layers to d-500-500-2000-10, with the nearest neighbor parameter E = 50 and the number of highly variable genes set to 1000. β1, β2, and β3 were set to 1. α was set to 0.5. The model was trained for 50, and optimization was performed using the Adam algorithm with a learning rate of 1e-5. For all baseline methods, we used their official implementations with default parameters unless otherwise specified. All methods were executed under the same computational environment to ensure fair comparison. To account for variability, we report the average results over 10 independent runs.
Analysis of clustering results
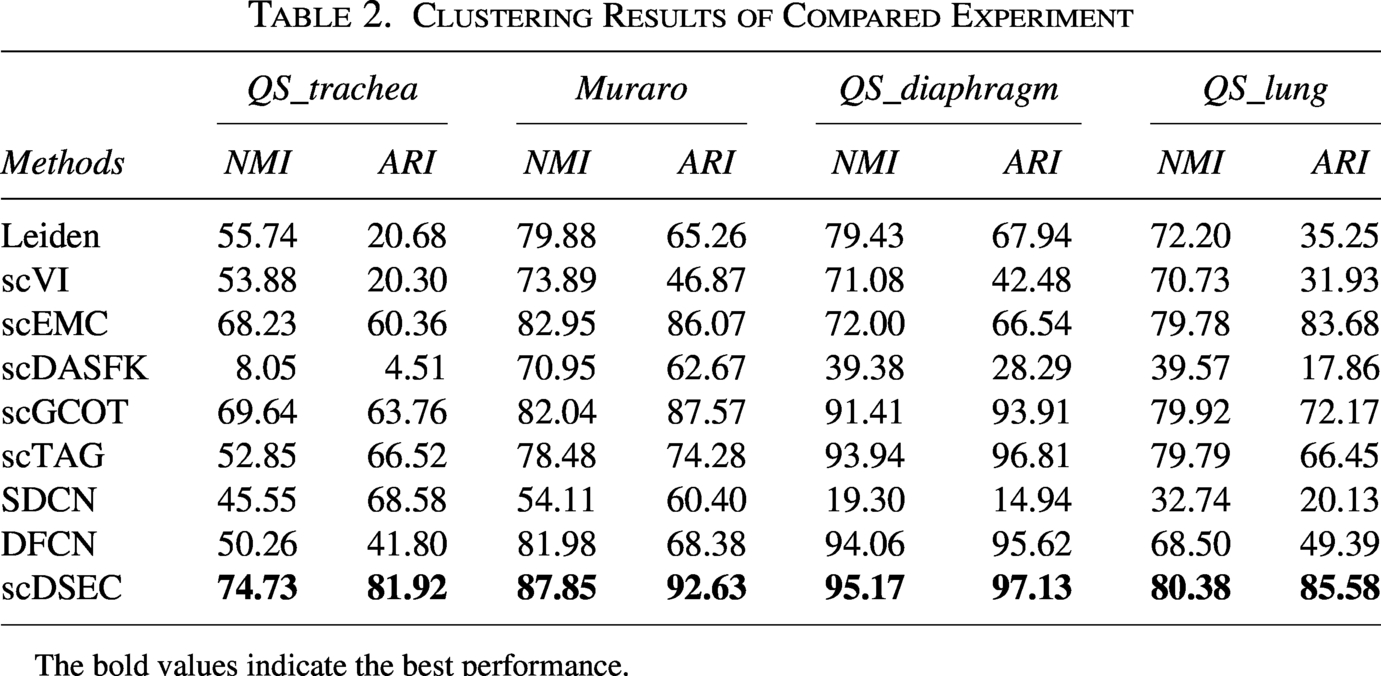
To evaluate the effectiveness of the scDSEC model, this experiment compares and analyzes its clustering results against several baseline models across four scRNA-seq datasets. The clustering results are summarized in Table 2, with the following key observations:
Clustering Results of Compared Experiment
Clustering Results of Compared Experiment
The bold values indicate the best performance.
For each evaluation metric, scDSEC consistently outperformed all baseline models across all scRNA-seq datasets, achieving the highest clustering performance. These results strongly validate the effectiveness of the scDSEC model. The findings indicate that scDSEC successfully learns structurally enhanced internal representations, ensuring that the cell representations effectively capture both deep features and structural information, which in turn improves the accuracy and performance of cell clustering.
A comparison of various methods reveals that deep cell clustering techniques using external representation learning generally outperform those relying on internal representation learning. This advantage stems from the fact that internal representation learning methods depend solely on scRNA-seq data features, overlooking the richer graph representations learned through cell graphs and failing to incorporate external structural information. In contrast, external representation learning methods effectively capture more comprehensive graph-based information. Consequently, deep cell clustering methods using external representation learning demonstrate superior performance when dealing with complex scRNA-seq data, offering a more accurate representation of the underlying cell structure.
Additionally, deep clustering methods that leverage both internal and external representation learning typically perform well across various scRNA-seq datasets. This is because these methods can effectively learn both internal and external representations, leading to improved clustering outcomes. The scDSEC model outperforms both the DFCN and SDCN models due to its ability to learn structurally enhanced representations of cells, which integrate the structural information into the internal representation of the scRNA-seq data, resulting in higher clustering accuracy. Furthermore, scDSEC employs a reconstruction loss based on ZINB, which is particularly well-suited for modeling scRNA-seq data.
1 Architecture ablation
To investigate the contributions of the major architectural components in scDSEC, we conducted a series of architecture ablation experiments by removing or modifying specific modules. The following variants were evaluated: (1) removing the reinforcement enhancement mechanism and replacing the layer-wise fusion strategy with a single-layer fusion (w/o RE), (2) removing the AE encoder component (w/o AE), and (3) removing the GCN component (w/o GCN).
The quantitative results on four datasets are summarized in Figure 2. It can be observed that removing any component leads to a degradation in clustering performance compared with the scDSEC model, indicating that each module contributes positively to the overall framework. Interestingly, removing the AE encoder leads to the worst performance on all datasets. This observation indicates that the latent representations learned by the AE encoder contain richer and more discriminative biological information.
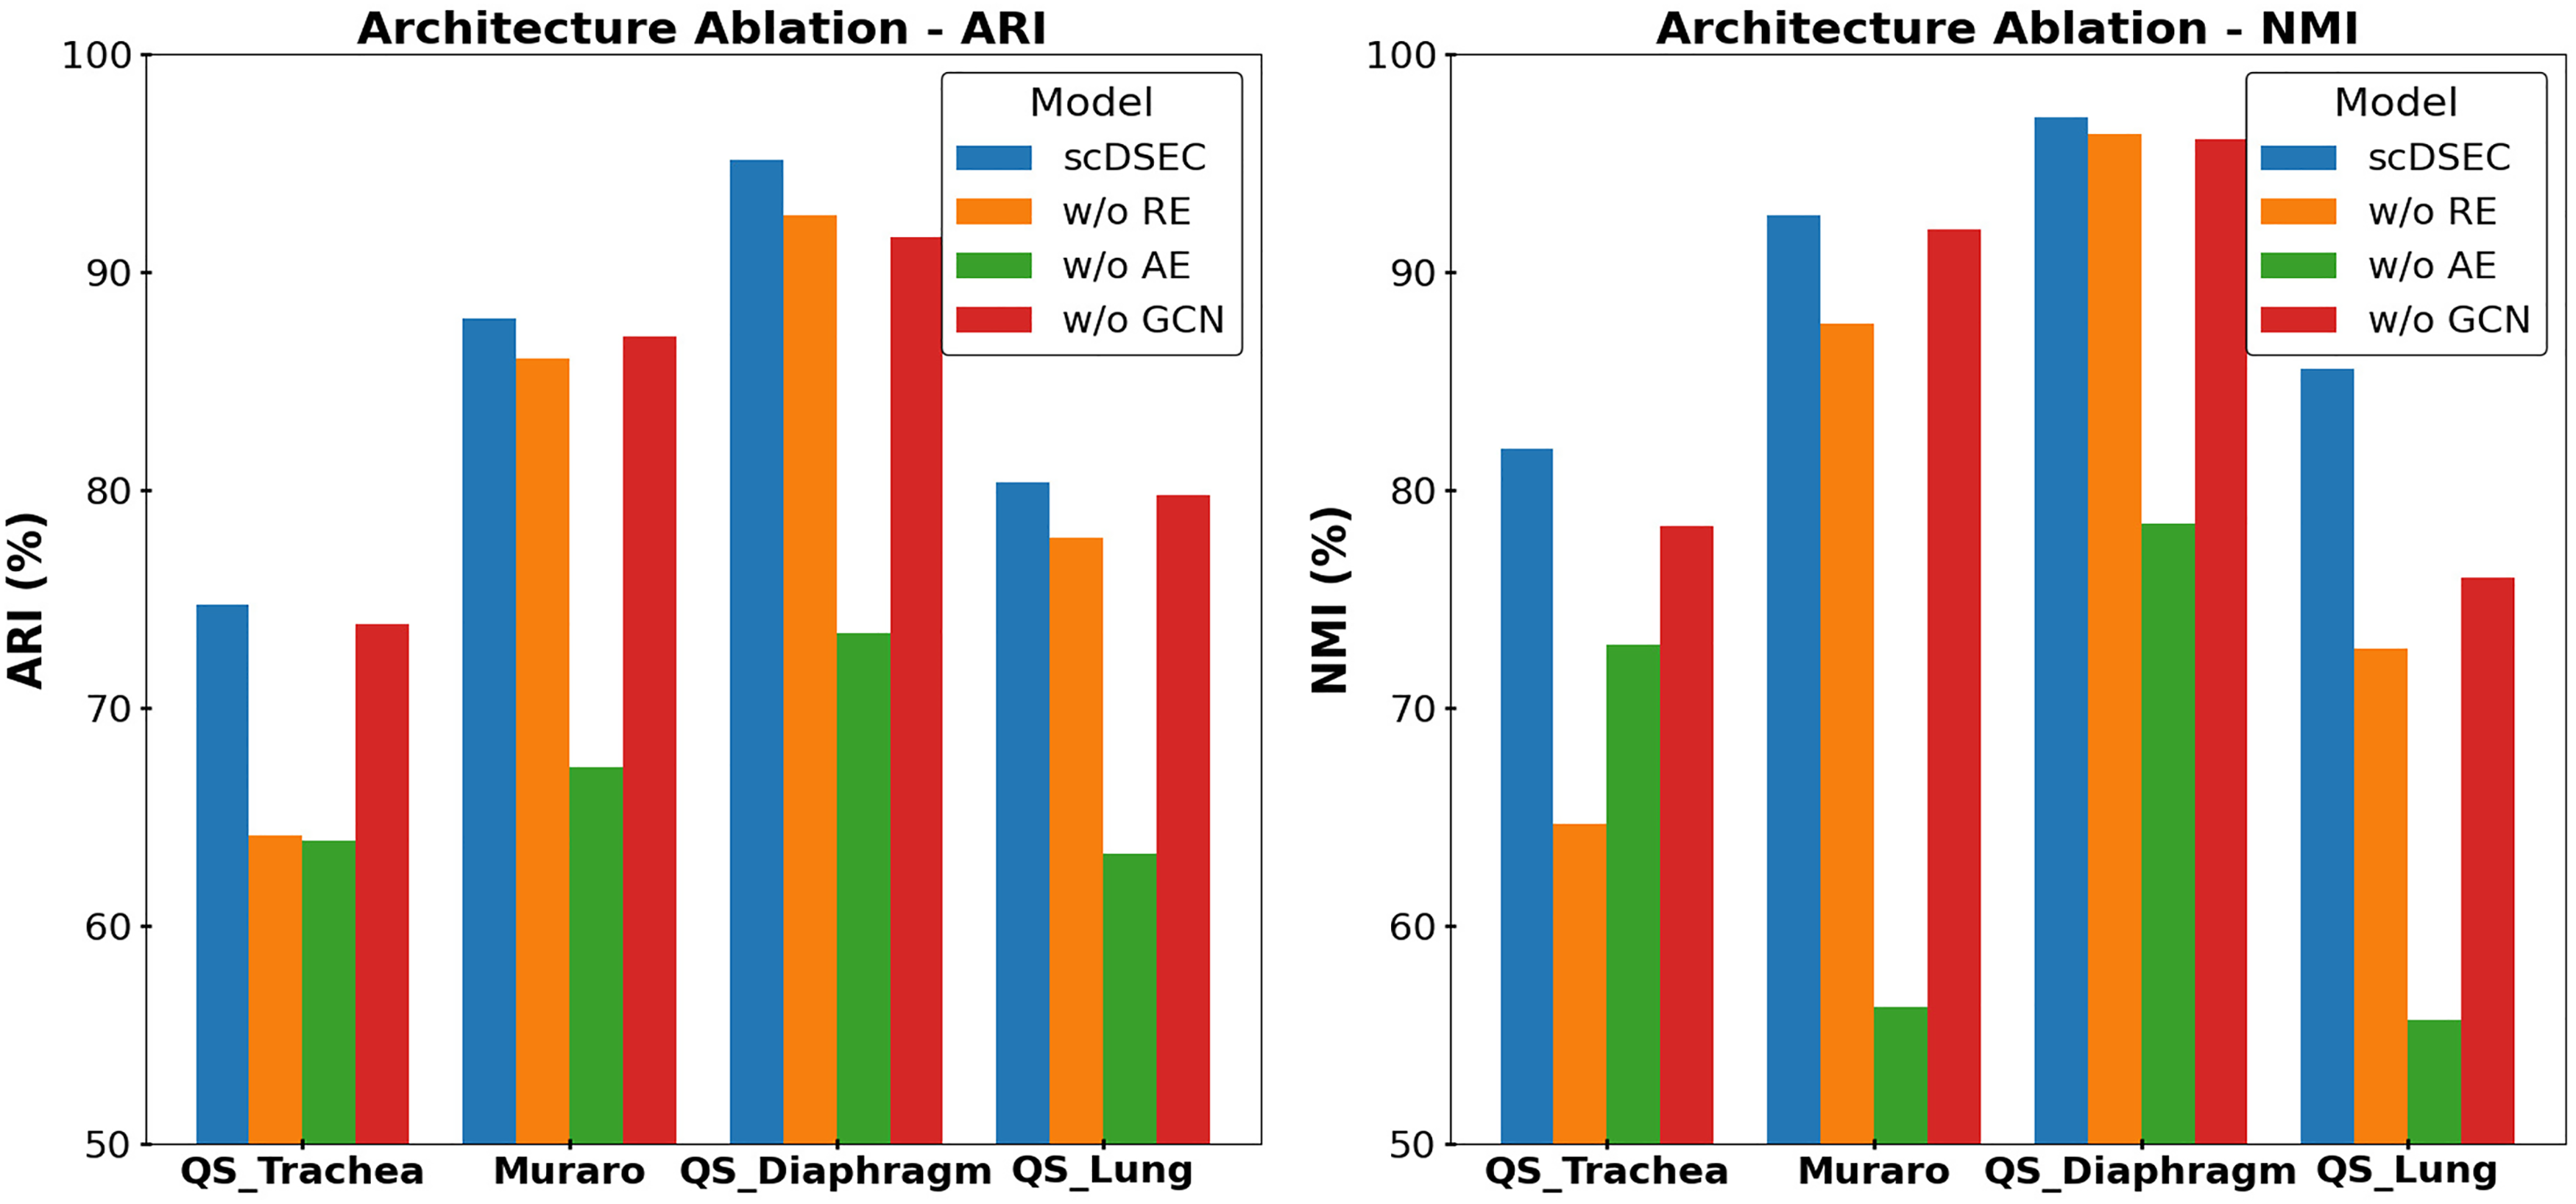
Architecture ablation results for scDSEC on four datasets.
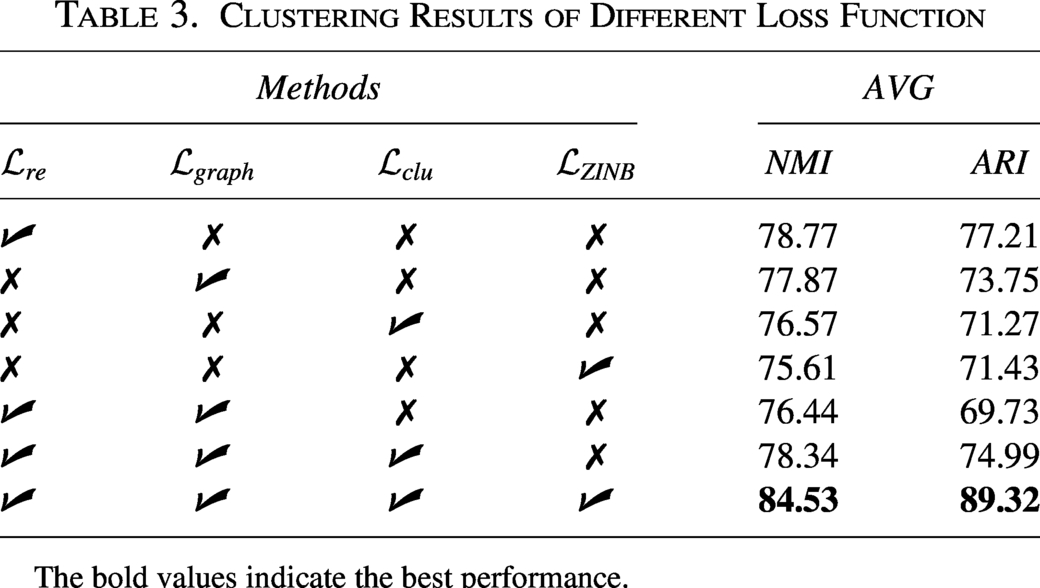
In this experiment, we performed auxiliary tests across all datasets to evaluate the individual contributions of each loss function to overall clustering performance. Specifically, AVG represents the average performance across all datasets,
Clustering Results of Different Loss Function
Clustering Results of Different Loss Function
The bold values indicate the best performance.
The performance of scDSEC surpasses that of all its variants, attributed to its more effective clustering optimization achieved through the joint objective function. The interaction among the four loss functions within this joint objective function enhances their collective impact, leading to a significant improvement in clustering performance. This underscores the effectiveness of employing a joint objective function.
Moreover, without the reconstruction loss of cell data using ZINB
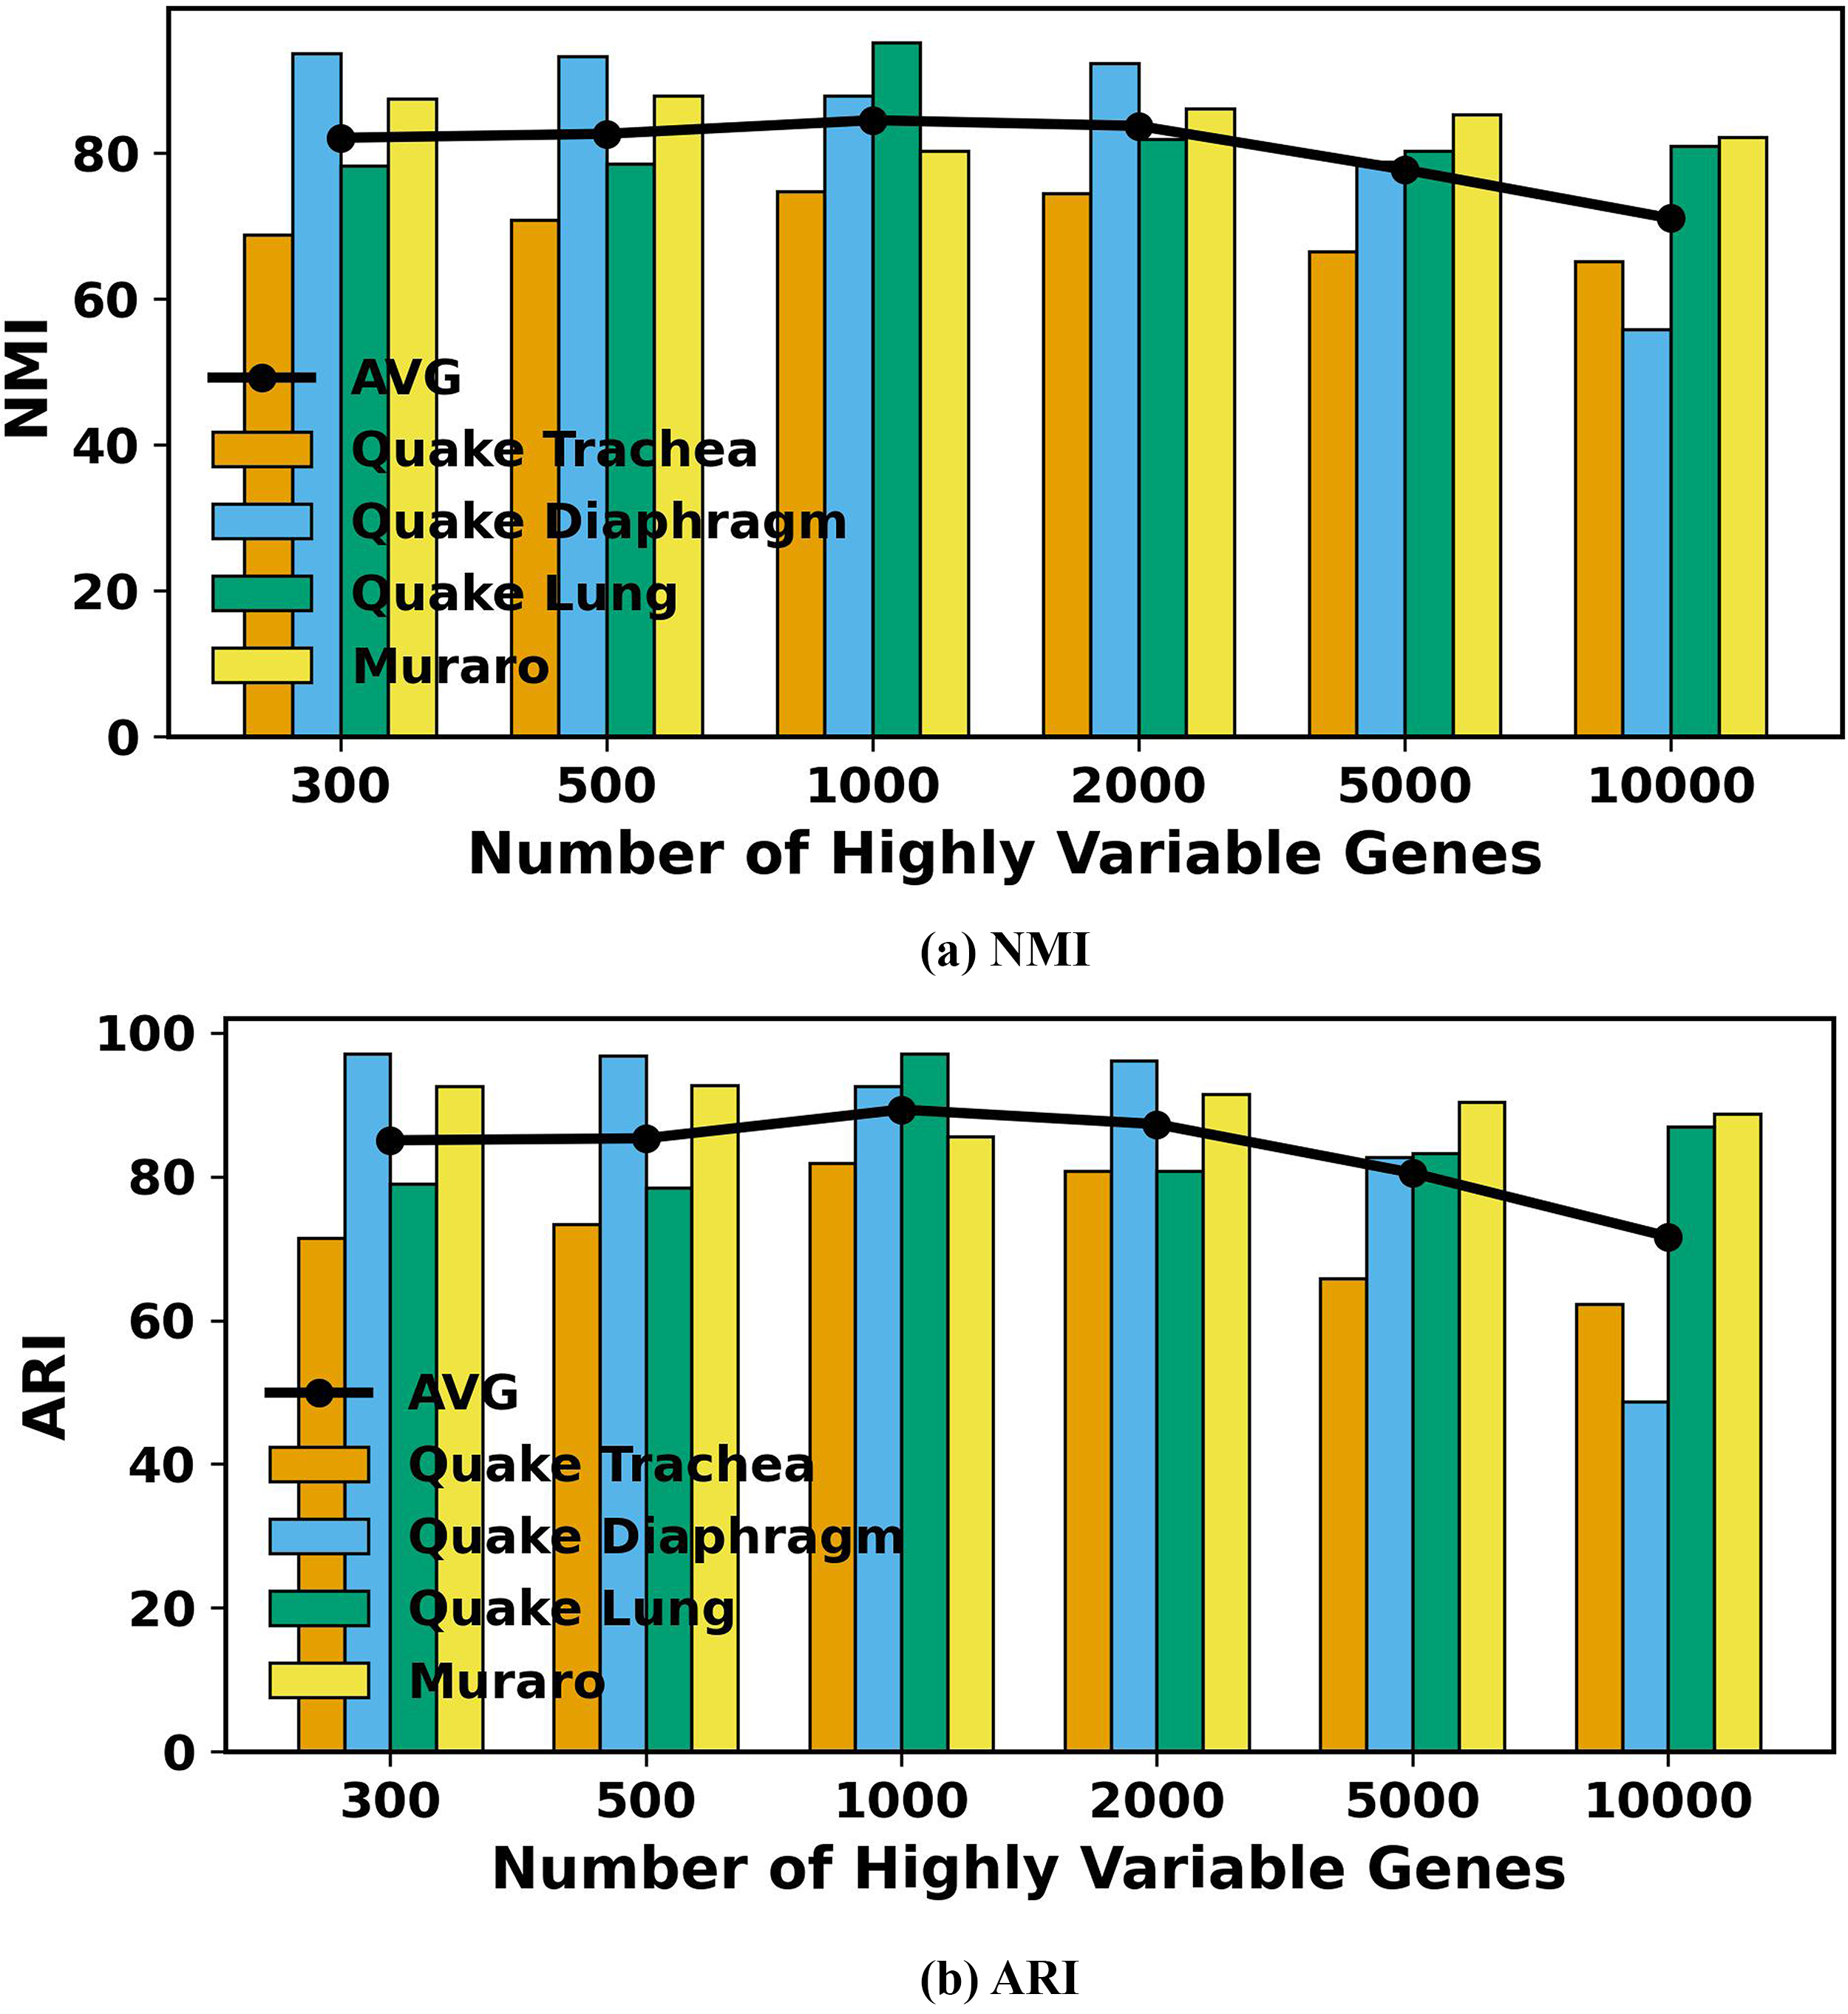
In single-cell data analysis, highly variable genes are essential for capturing valuable biological insights and identifying cell types. To evaluate the impact of the number of selected highly variable genes, we applied scDSEC to real scRNA-seq datasets, varying the gene counts from 300 to 10,000. Figure 3 presents the NMI and ARI values for all datasets, using 300, 500, 1000, 2000, 5000, and 10,000 highly variable genes, respectively. The results demonstrate that selecting 1000 highly variable genes yields the highest performance, while using only 300 genes results in significantly poorer outcomes. Additionally, as the number of selected genes exceeds 1000, performance shows a slight decline, likely due to the noise introduced by incorporating additional genes. Consequently, to optimize computational resources, we set the number of selected highly variable genes in the model to 1000.
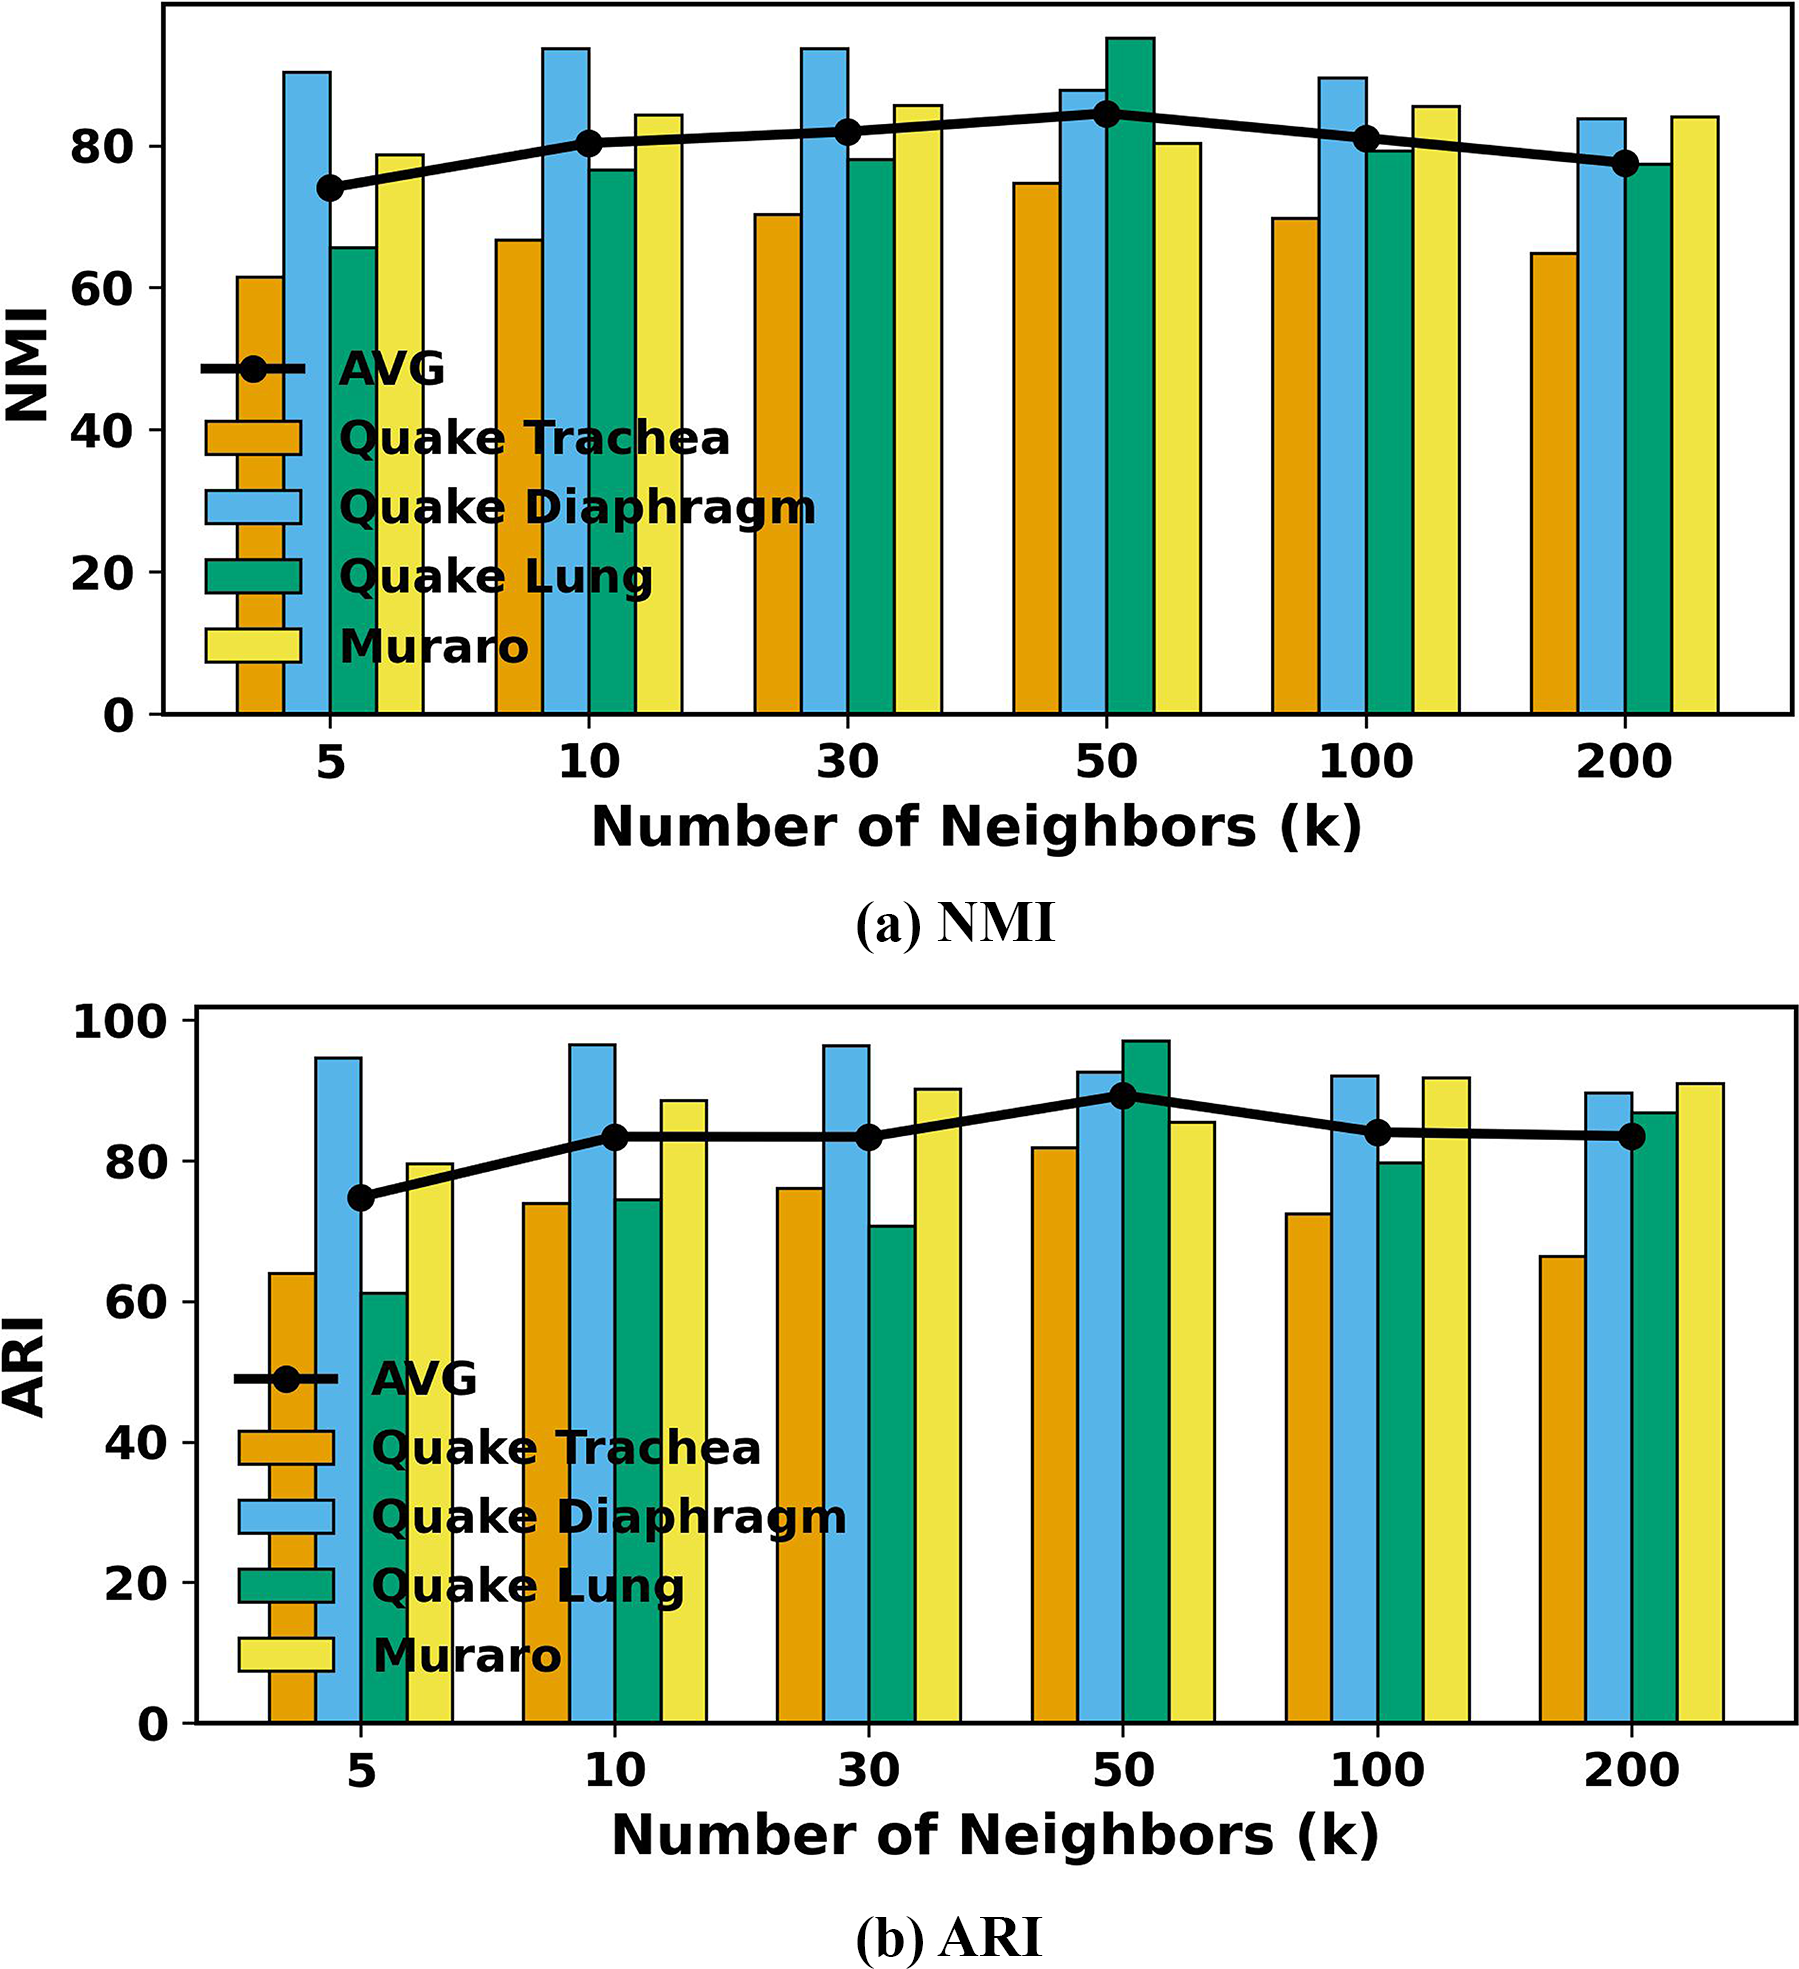
The number of neighbors K is a critical parameter in constructing the KNN graph to capture external relationships between cells. To evaluate the impact of K on clustering performance, we varied K ∈ {5, 10, 30, 50, 100, 200} for all scRNA-seq datasets. Figure 4 presents the NMI and ARI values on all datasets for the six cases with the scDSEC. From Figure 4, the cell clustering performance improves rapidly with an increase in K up to a certain point, where it reaches an optimal value. However, when K becomes excessively large, the performance begins to decline slightly. This degradation may be attributed to the introduction of noise and redundant information from distant or less relevant neighbors, which can blur cluster boundaries and weaken feature discrimination. To maintain optimal clustering performance, we set K within a reasonable range for all experiments.
To study the effect of balance coefficient α, we set α = {0.0, 0.1, 0.3, 0.5, 0.7, 0.9.1.0} on all scRNA-seq datasets in detail. Figure 5 tabulates the average NMI and ARI values on all scRNA-seq datasets for the seven cases with the scDSEC. Note that α = 0 means that the learned cell representation only contains the external representation, and α = 1 represents that the scDSEC only uses the internal representation.
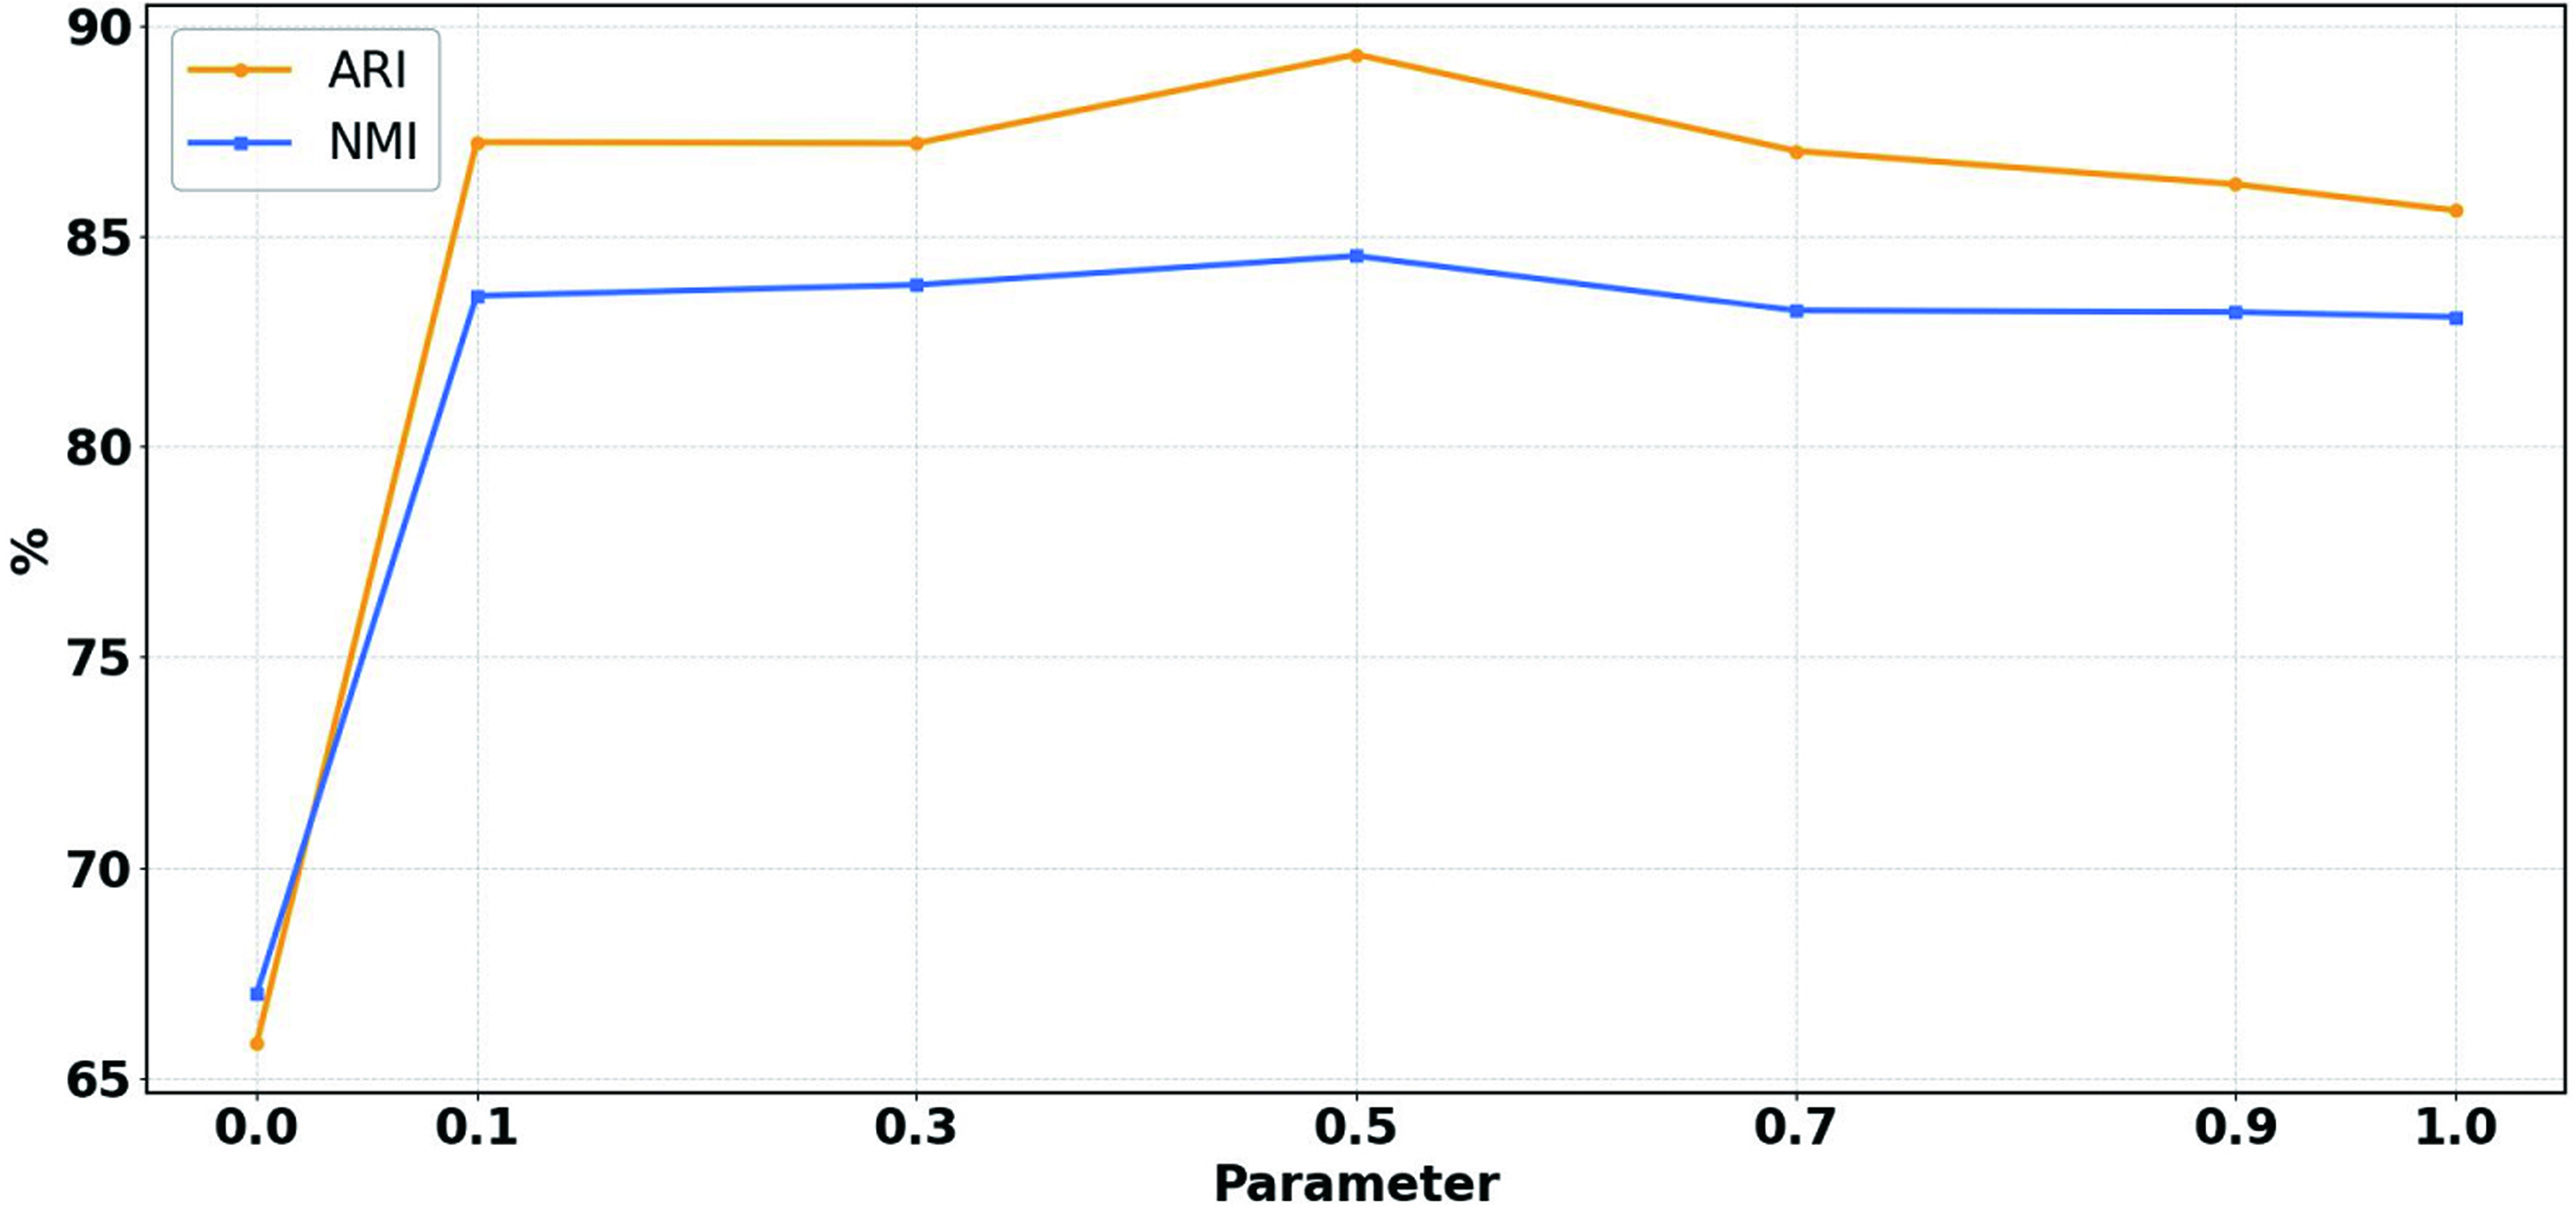
The clustering results of the average NMI and ARI values with the parameter α.
From Figure 5, all metrics reach their highest performance when the parameter α = 0.5, indicating that both internal and external representations are equally critical for optimal results. This suggests that the improvements in scDSEC largely stem from enhanced cell representation. Another interesting observation is that when α = 0.1 and α = 0.9, even a slight fusion of internal or external representations improves cell clustering performance and helps mitigate the oversmoothing issue.
To further assess the biological relevance and interpretability of the representations learned by scDSEC, we conducted a qualitative biological validation on multiple representative scRNA-seq datasets. Specifically, we compared the two-dimensional visualizations of cells in both the raw expression space and the scDSEC representation space, with each point colored according to its ground-truth biological cell type annotation. As illustrated in Figure 6, the left panels show the cell distributions in the raw expression space, while the right panels present those in the corresponding scDSEC representation space.
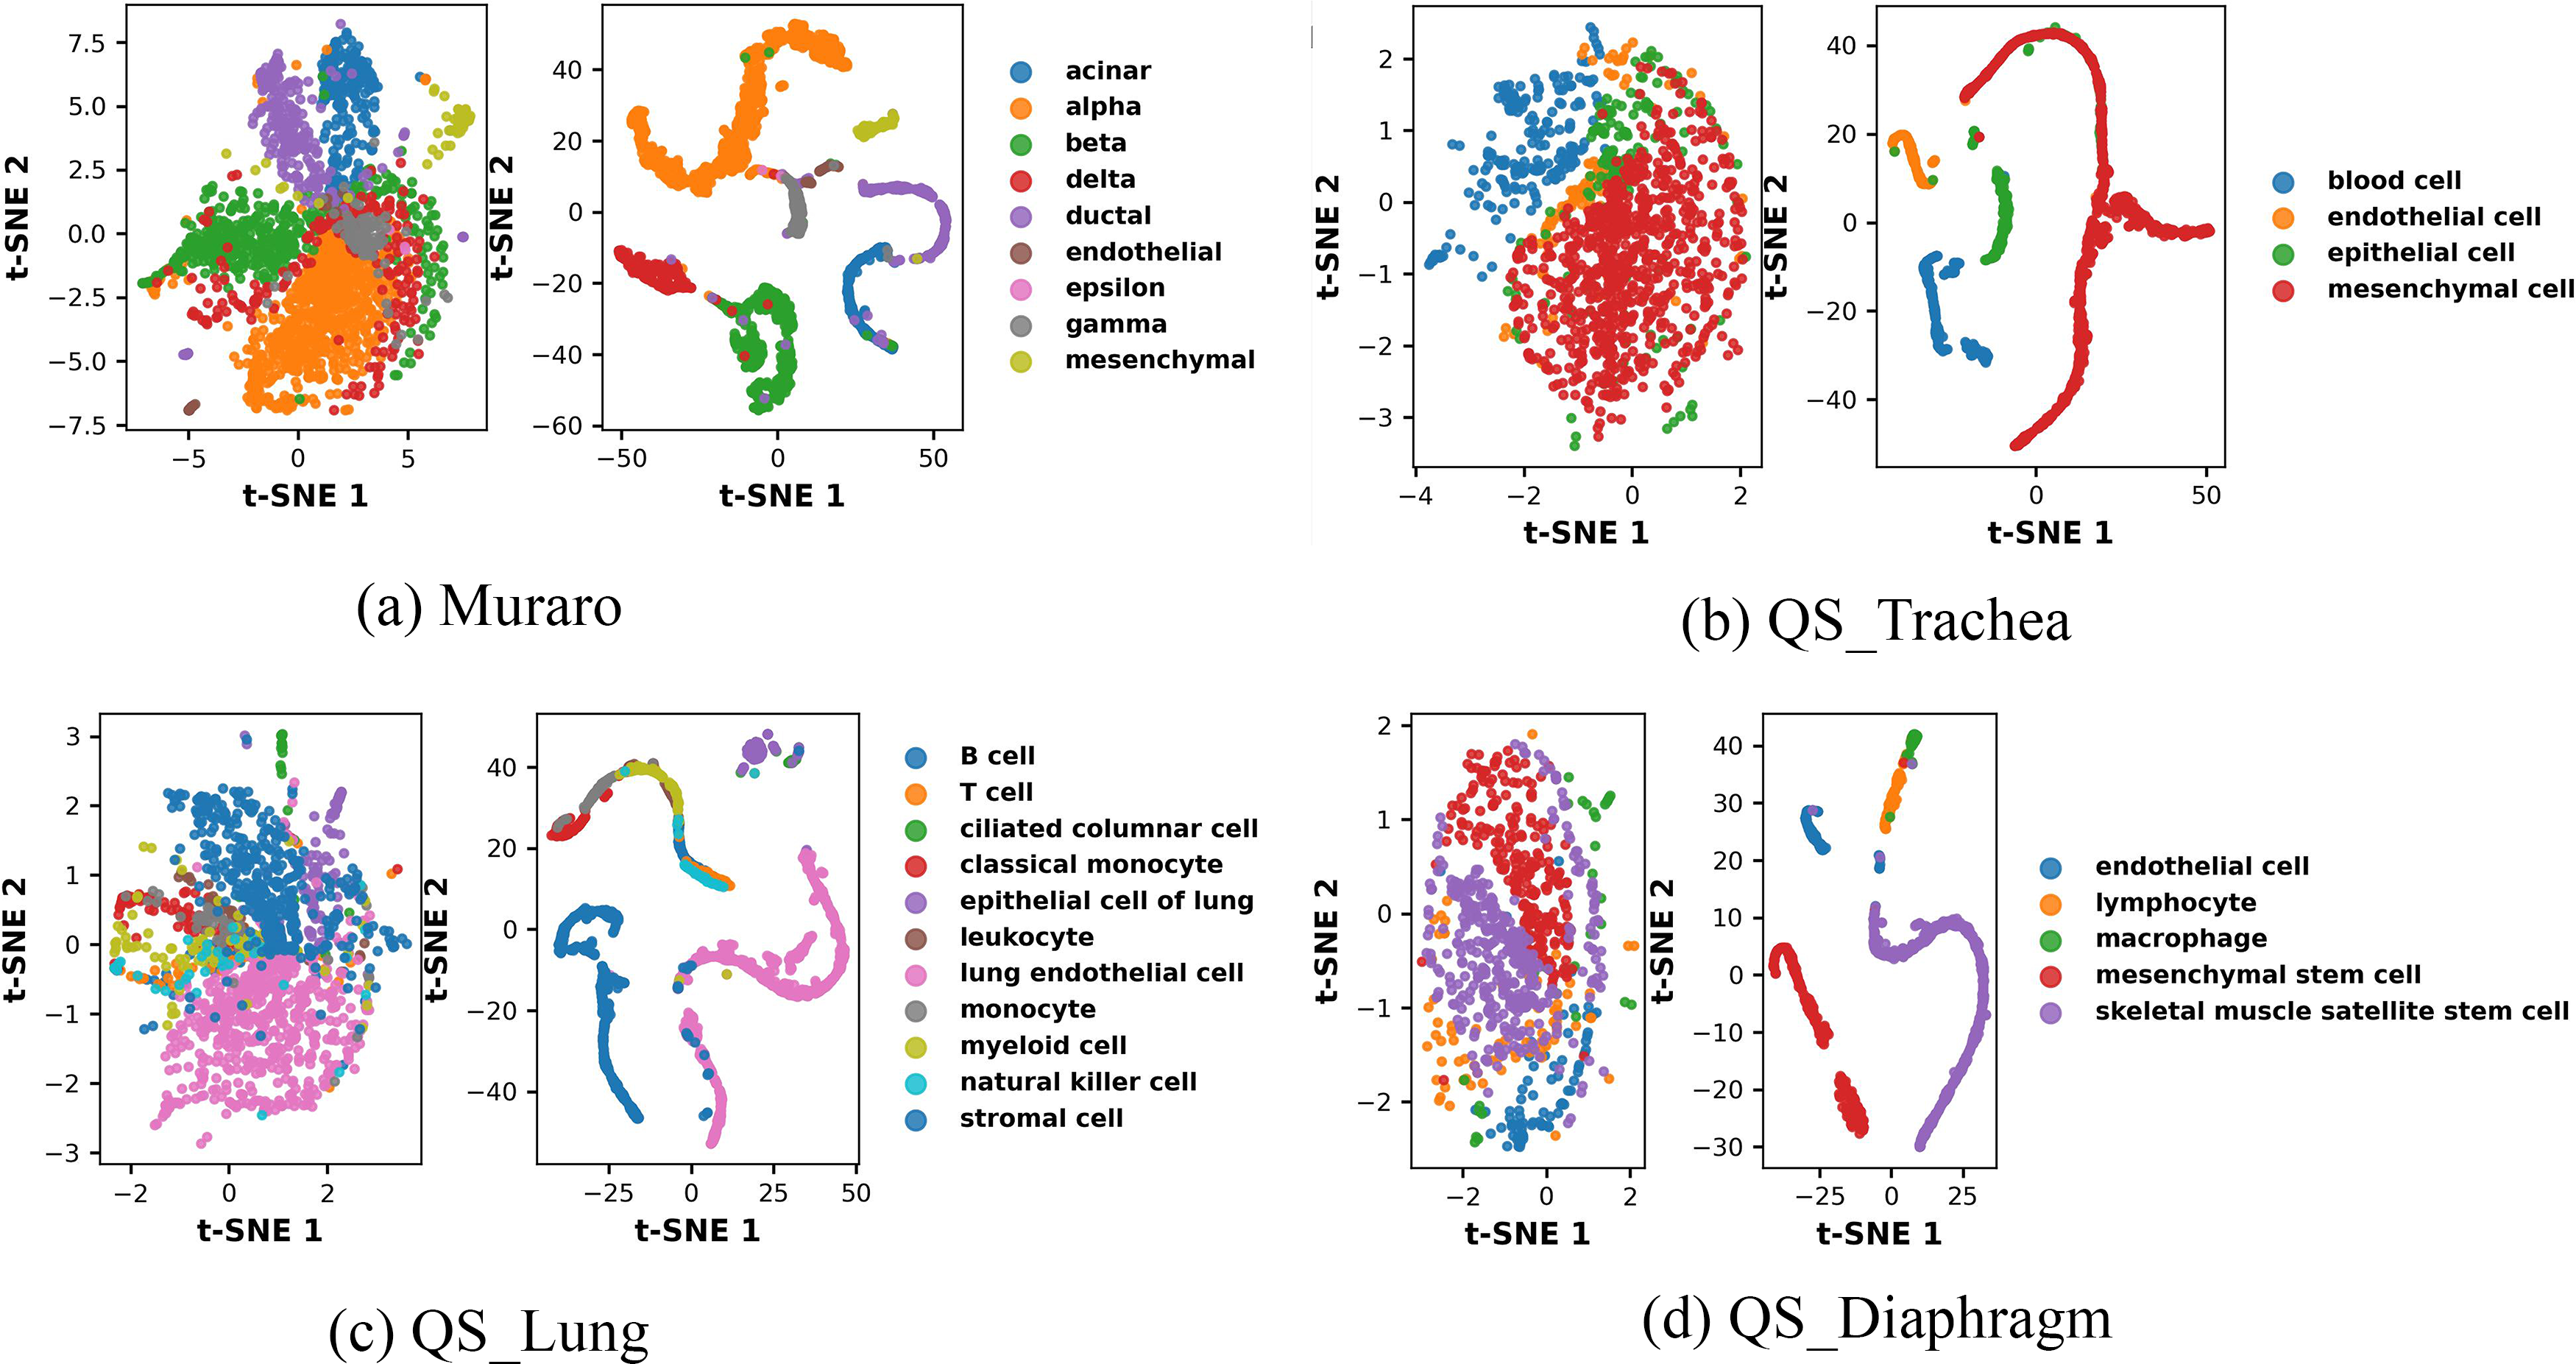
Biological Validation of scDSEC representations across multiple datasets. For each dataset, the left panel shows the t-SNE visualization of cells in the raw expression space, while the right panel shows the t-SNE visualization of the corresponding scDSEC representation space, with points colored by ground-truth biological cell type annotations.
Across all datasets (Muraro, QS Trachea, QS Lung, and QS Diaphragm), the embeddings generated by scDSEC exhibit substantially clearer separation and more compact clustering boundaries compared with the raw expression space. For instance, distinct pancreatic cell types such as alpha, beta, and delta cells in the Muraro dataset, as well as epithelial, endothelial, and mesenchymal cell populations in the QS Trachea datasets, are well separated in the scDSEC representation space. These results demonstrate that scDSEC effectively captures biologically meaningful structures and enhances the discriminability among different cell types, validating the biological interpretability of the learned representations.
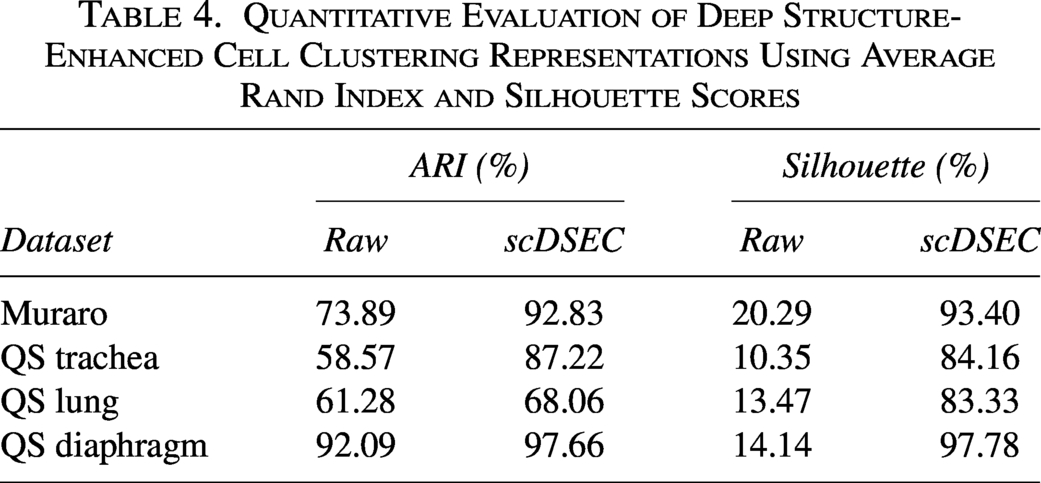
To quantify these improvements, we applied k-means clustering to both the raw expression space and the scDSEC representation space and computed the Average Rand Index (ARI) and Silhouette scores. As shown in Table 4, the scDSEC representations consistently achieve higher ARI and Silhouette scores across all datasets. These results indicate that scDSEC not only improves clustering accuracy with respect to ground-truth cell types but also enhances cluster compactness and separation. Together with Figure 6, these findings demonstrate that scDSEC effectively captures biologically meaningful structures and improves the interpretability of the learned representations.
Quantitative Evaluation of Deep Structure-Enhanced Cell Clustering Representations Using Average Rand Index and Silhouette Scores
With the rapid advancement of scRNA-seq technologies, the number of sequenced cells has grown dramatically, giving rise to large-scale datasets that pose significant computational challenges. Therefore, assessing the scalability and computational efficiency of clustering algorithms is crucial for evaluating their practical applicability to modern single-cell studies.
To this end, we extended our scalability analysis of scDSEC by incorporating two large-scale scRNA-seq datasets: Cao 2020 Intestine and Cao 2020 Pancreas, which contain approximately 51,650 and 45,653 cells annotated with 12 and 14 clusters, respectively. During experimentation, we found that among the base-line methods, only Leiden, scVI, and scDSEC could be successfully executed on these large-scale datasets within our computational environment. Other deep learning-based clustering methods either failed to converge or encountered out-of-memory errors when processing datasets larger than 40k cells. Figure 7 presents the clustering performance (NMI and ARI), the runtime and memory consumption of scDSEC, Leiden, and scVI on these two large datasets.
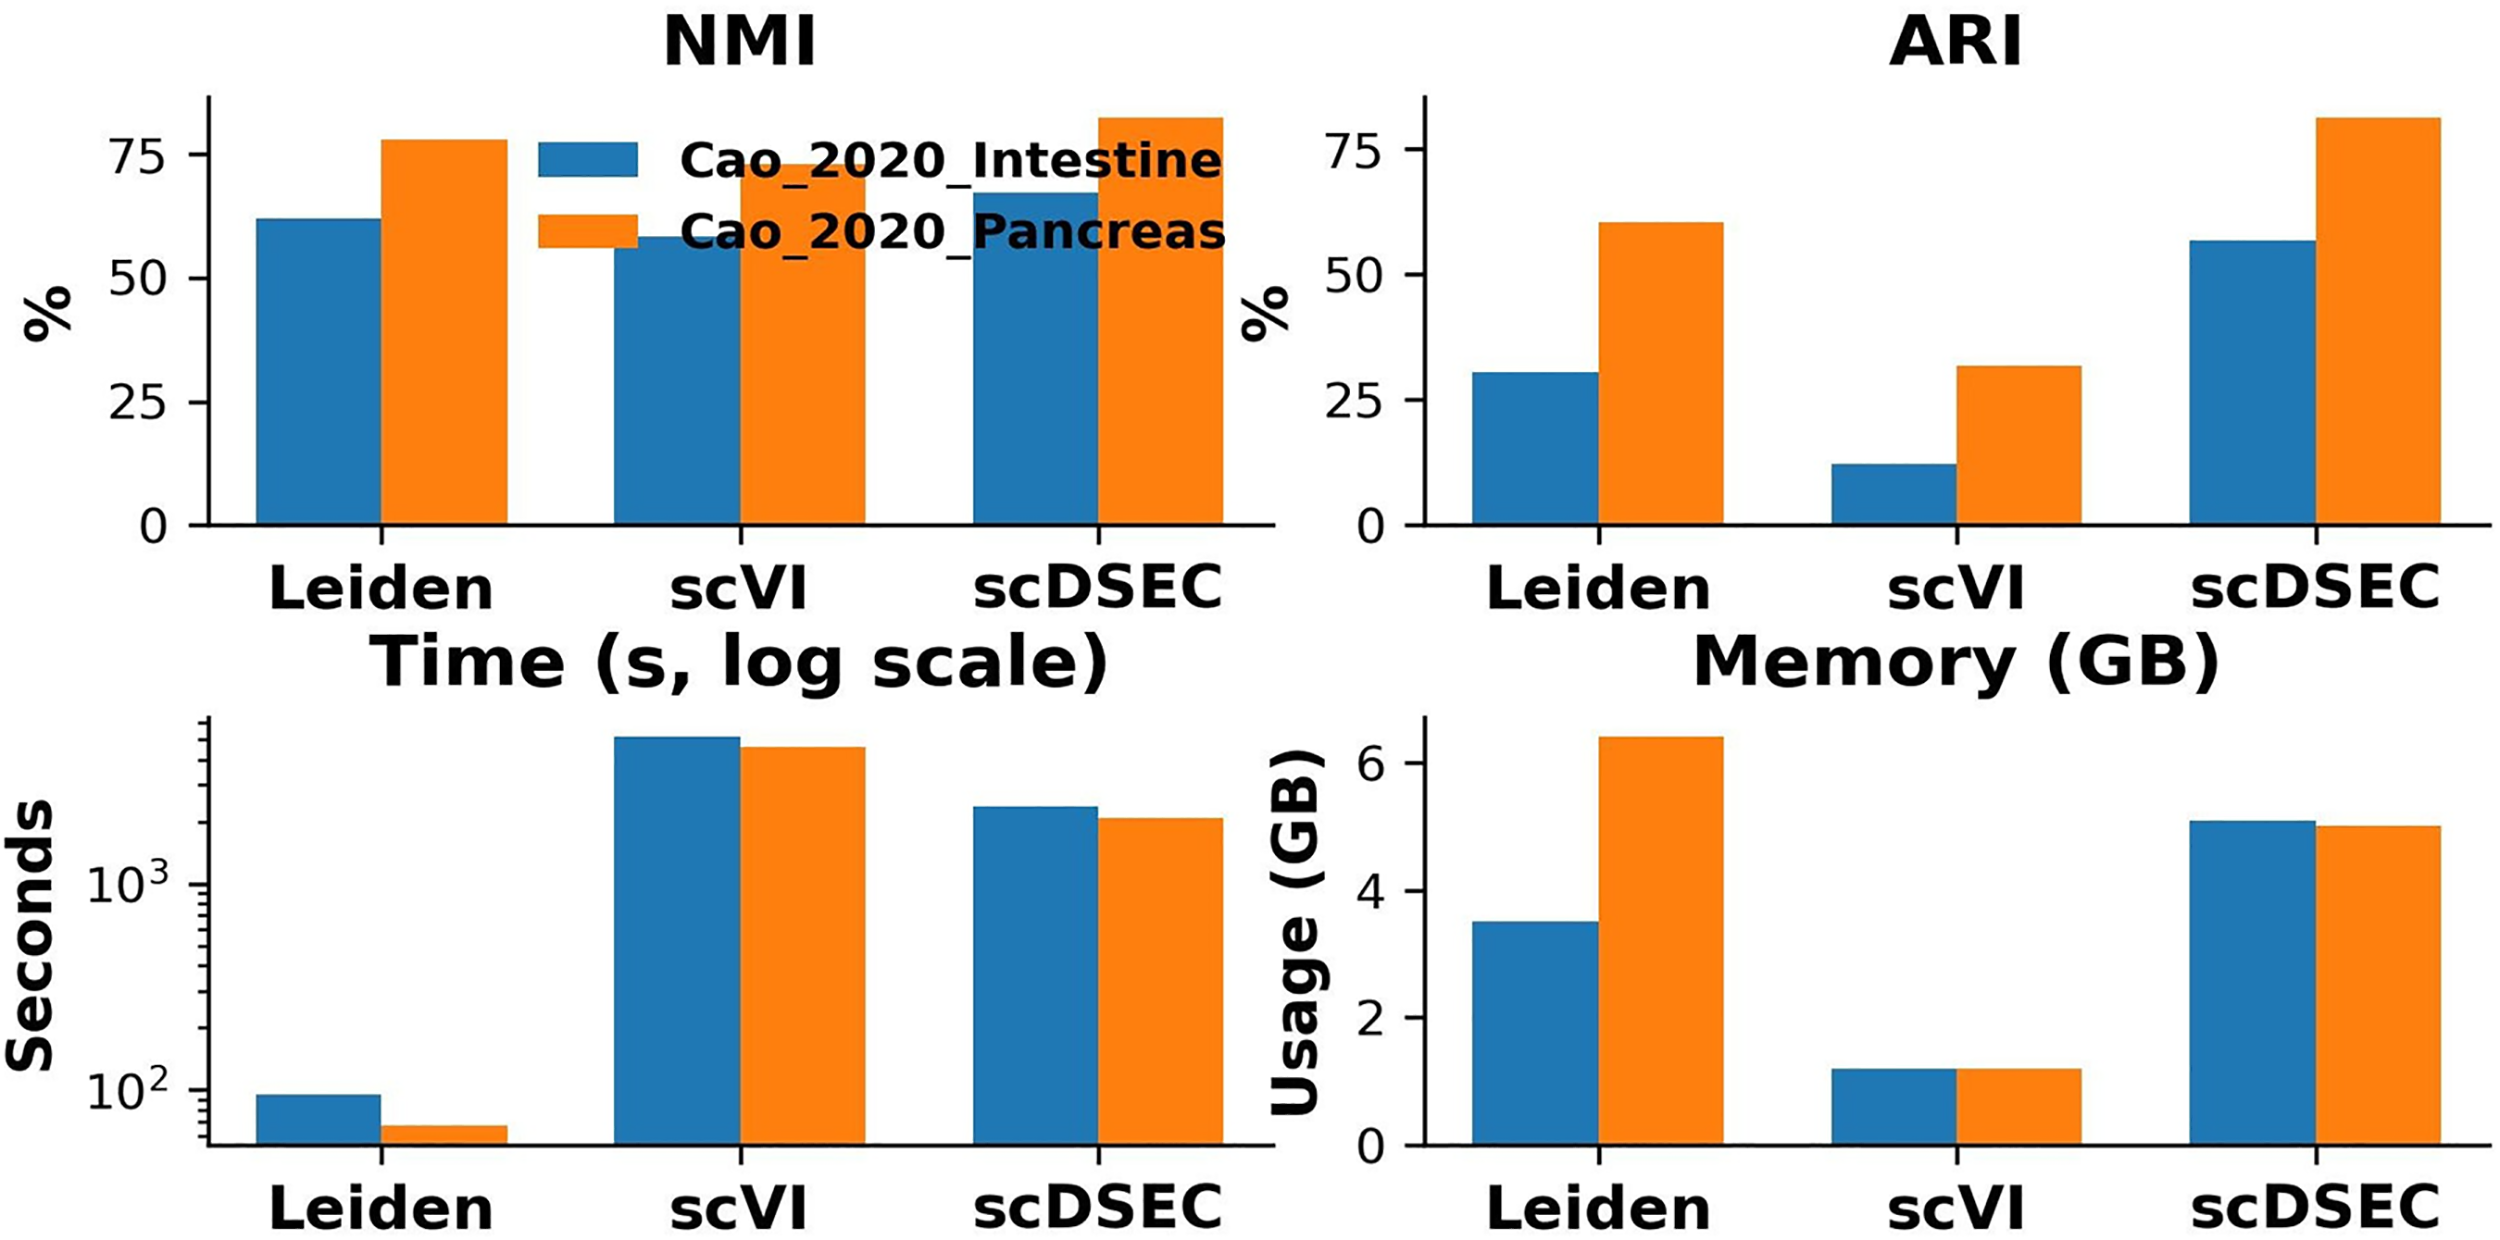
Comparison of clustering performance and efficiency on large-scale scRNA-seq datasets. scRNA-seq, single-cell RNA sequencing.
The results demonstrate that scDSEC achieves the best overall clustering performance, maintaining both high NMI and ARI values across datasets while preserving computational feasibility. Although scDSEC introduces a moderate increase in memory usage due to its dual-representation enhancement mechanism, it remains significantly faster than scVI and well within acceptable computational limits. These findings confirm that scDSEC effectively scales to large single-cell datasets while delivering superior clustering accuracy and reasonable computational cost.
To demonstrate the robustness and generalization of the proposed scDSEC model, we conducted additional experiments on several widely used benchmark datasets, including PBMC and Baron (Table 5). The Baron dataset contains pancreatic cells collected from four human donors and two mouse donors. These samples were grouped by species to construct two separate datasets, namely, Baron (human) and Baron (mouse), allowing us to evaluate model robustness across different biological sources. Since the PBMC dataset is large, and under our experimental environment, only scVI and Leiden can be executed on the full dataset. To enable fair comparisons with all baseline methods, we randomly sampled 10% of the cells from each cell type for our experiments.
Summary of Benchmark Datasets
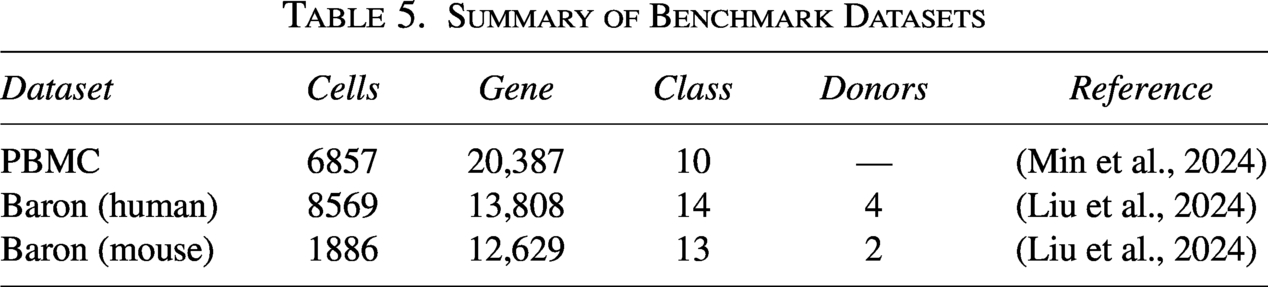
Summary of Benchmark Datasets
Table 6 reports the clustering performance of different methods on these datasets in terms of ARI and NMI. The results demonstrate that scDSEC consistently achieves competitive or superior clustering performance compared with baseline methods across the additional benchmark datasets, confirming its robustness and generalization capability.
Clustering Results on Benchmark Datasets
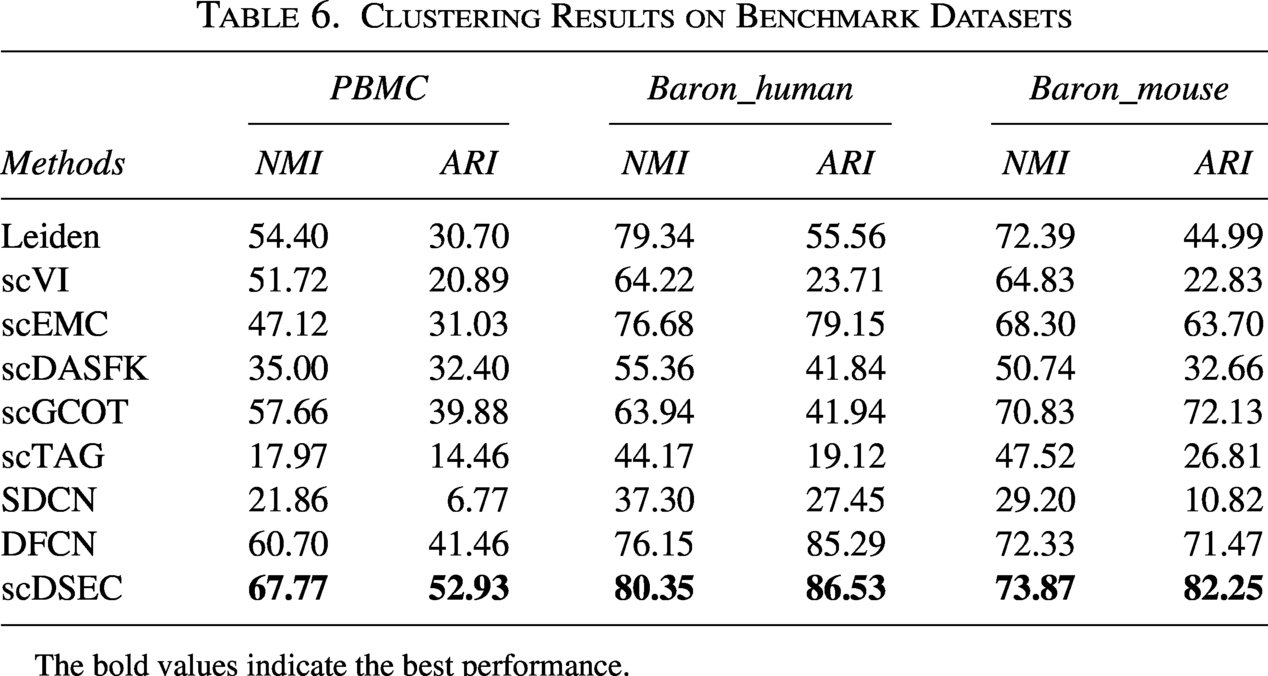
The bold values indicate the best performance.
To further illustrate the clustering structure and batch mixing characteristics, we visualized the clustering results on the Baron datasets using t-SNE. As shown in Figure 8, cells belonging to the same cell type form compact clusters, while cells from different donors are well mixed. These results indicate that the proposed method effectively captures the underlying biological structure while mitigating batch effects across different donors.
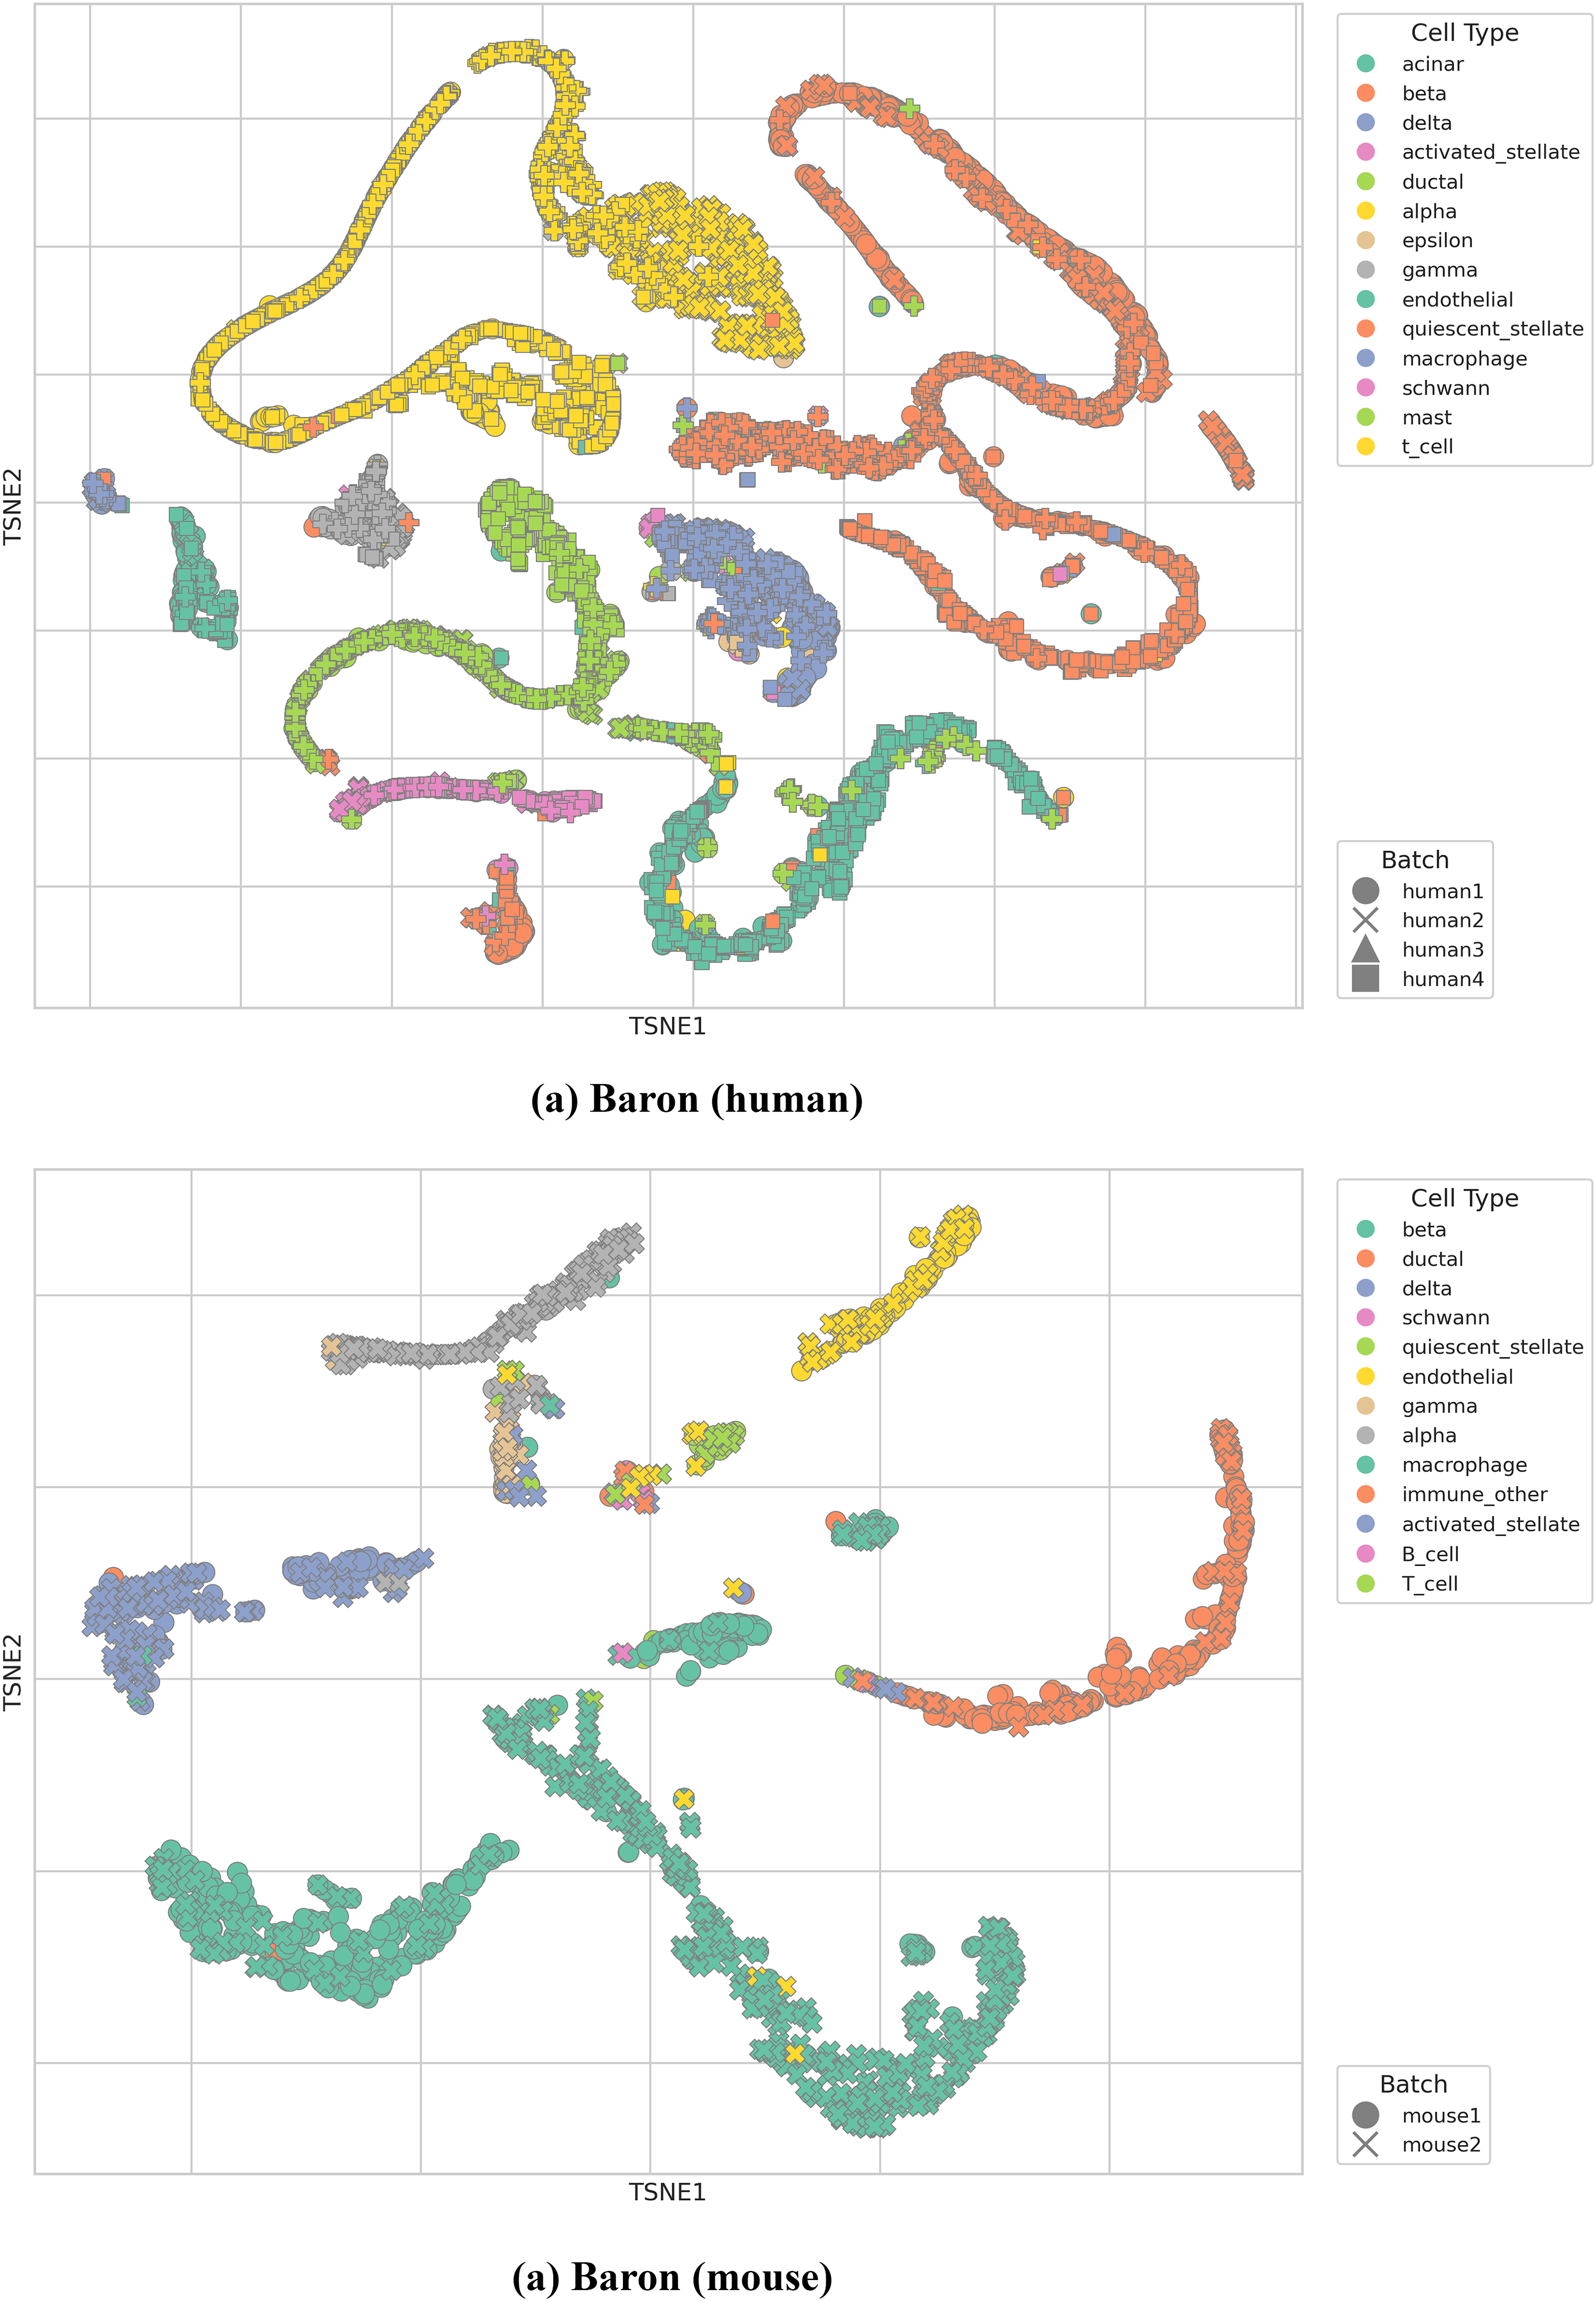
Visualization of clustering results on the Baron datasets.
This article introduces a novel deep structure-enhanced cell clustering model for scRNA-seq data, named scDSEC. The model uses the internal features of cells as its foundation and enhances these features by integrating external structural information. A unique reinforcement enhancement strategy is employed, wherein a comprehensive cell representation-formed by merging internal and external information-and an improved internal cell representation, refined with the aid of the complete cell representation, are learned in a progressive, layer-by-layer manner. Experimental results on multiple scRNA-seq datasets validate the effectiveness of scDSEC.
An interesting direction for future research involves exploring how the scDSEC model can be adapted to handle noisy cell features, which remains a significant challenge in cell analysis. In addition, we plan to extend our framework to automatically determine the optimal number of clusters in a data-driven manner, which could further improve the model’s robustness and biological interpretability. Moreover, investigating alternative distributional assumptions is an interesting and promising direction for future research, as it may reveal how different count models affect clustering performance and generalization.
AUTHORS’ CONTRIBUTIONS
M/Y.: Investigation, resources, writing—original draft, and funding acquisition. L.R.: Validation, conceptualization, methodology, writing—review and editing, funding acquisition, and supervision. Both authors have read and approved the final article.
Footnotes
ACKNOWLEDGMENTS
This work is supported by Guizhou Province Basic Research Program (Natural Science) General Project No.
DISCLOSURE STATEMENT
The authors declare that they have no known competing financial interests or personal relationships that could have appeared to influence the work reported in this article.
FUNDING INFORMATION
Guizhou Province Basic Research Program (Natural Science) General Project (No. MS[2025]338); Project of Guizhou Light Industry Technical College (No. 25QY17).