
Abstract
Spatial transcriptomics (ST) often requires aligning multiple tissue slices to reconstruct three-dimensional biological structures, a task hindered by complex deformations and structural heterogeneity. We propose GMSA, a synergistic alignment framework that integrates graph matching with point cloud registration. Unlike existing tools, GMSA first identifies high-confidence correspondences through subgraph matching based on gene expression and spatial topology, which provides a robust initialization for subsequent rigid Iterative Closest Point (ICP) or Nonrigid Iterative Closest Point (NICP) registration. Benchmark results on dorsolateral prefrontal cortex (DLPFC), spatially-resolved transcript amplicon readout mapping (STARmap), and multiplexed error-robust fluorescence in situ hybridization (MERFISH) datasets demonstrate that GMSA consistently outperforms state-of-the-art methods in alignment accuracy. Notably, GMSA’s nonrigid strategy successfully resolves complex structural distortions in MERFISH data where traditional methods fail, while maintaining stable gene expression distributions across aligned slices. This framework provides a flexible and precise solution for multimodal spatial transcriptomics integration.
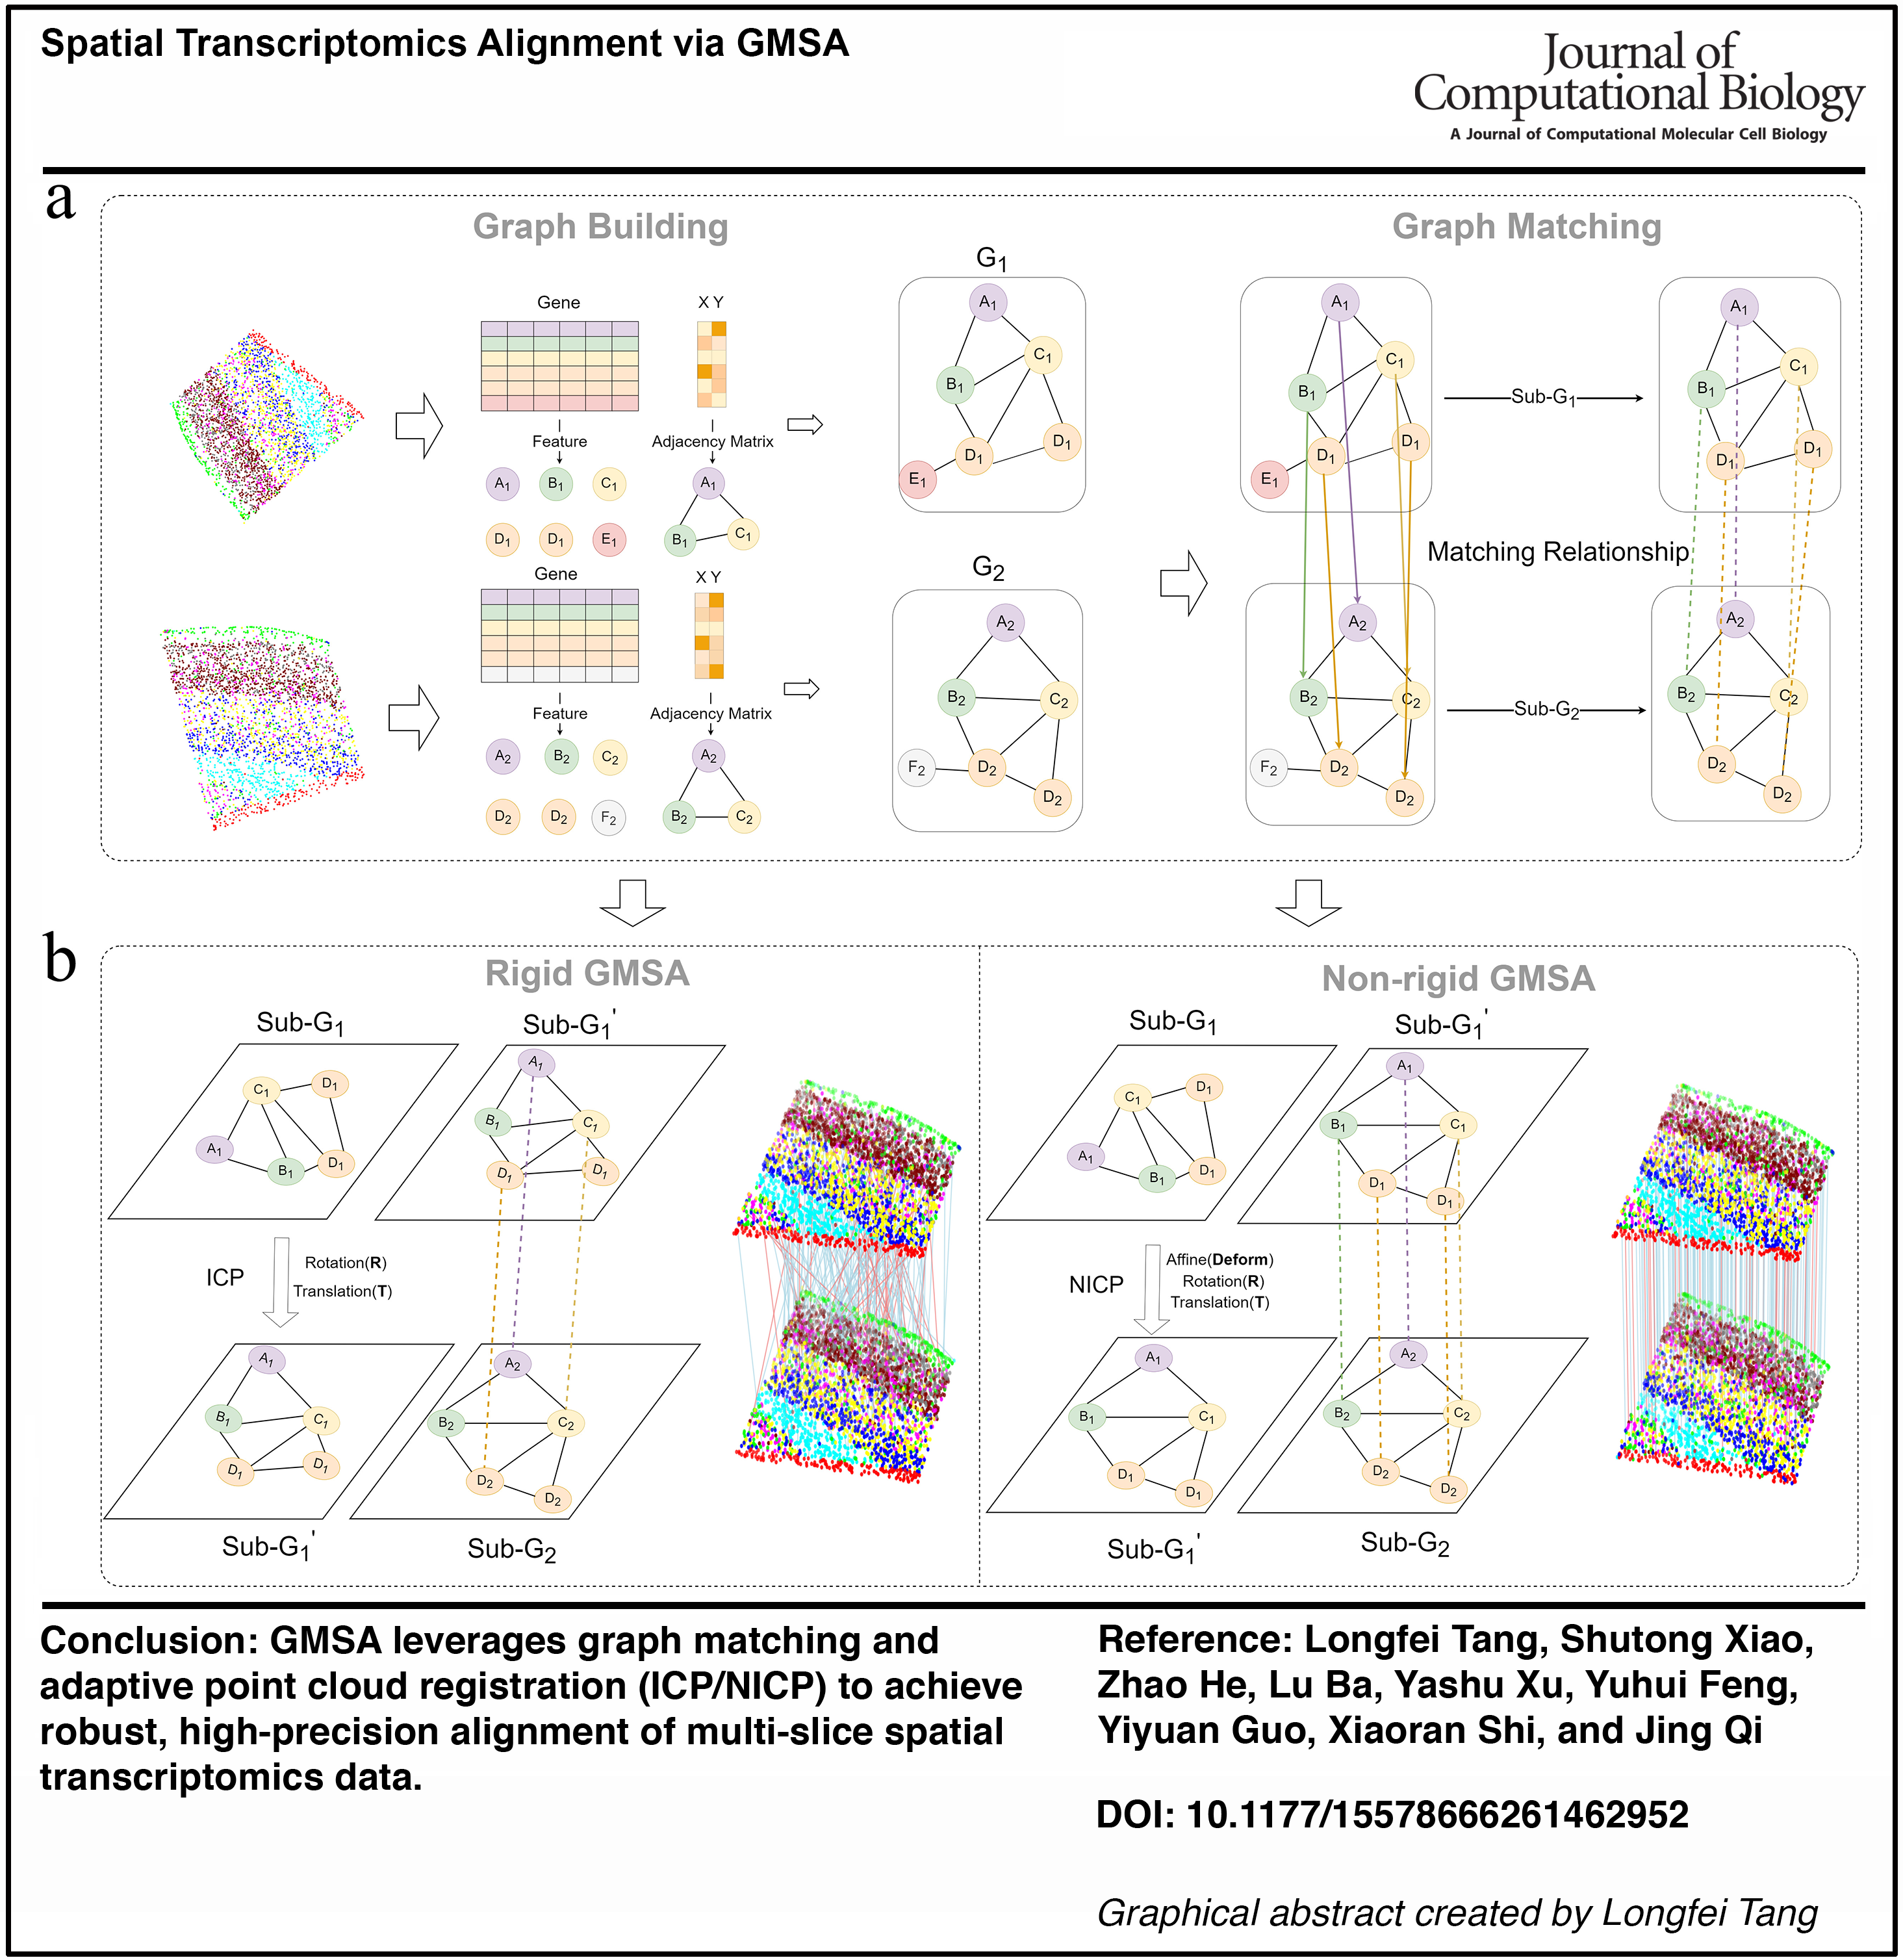
Graphical abstract
INTRODUCTION
Spatial transcriptomics (ST), in combination with single-cell RNA sequencing, provides a powerful tool for investigating gene expression patterns in situ and elucidating molecular communication between cells. This approach not only facilitates the analysis of cellular interactions and heterogeneity but also captures complex biological processes that traditional sequencing methods fail to resolve, thereby advancing research on the tissue microenvironment (Zhang et al., 2022). ST integrates high-resolution imaging, molecular labeling, sequencing, and computational analysis, enabling precise spatial localization of gene expression within tissue sections. This, in turn, allows for the characterization of cell-type spatial distributions and interactions, as well as the construction of gene expression maps across different tissue regions, which are critical for understanding functional tissue organization and pathophysiological mechanisms (Domínguez Conde et al., 2022).
Currently, spatial transcriptomics relies primarily on two complementary strategies for decoding spatial gene expression: next-generation sequencing (NGS)-based approaches and imaging-based approaches (Rao et al., 2021). NGS-based methods utilize spatial barcodes to encode the spatial coordinates of mRNA molecules, allowing sequencing data to be mapped back to specific tissue regions (Bressan et al., 2023). Representative techniques include Slide-seq (Rodriques et al., 2019) and Visium (10x Genomics, 2019). In contrast, imaging-based methods leverage in situ sequencing or in situ hybridization to directly visualize gene expression in tissue sections using fluorescence probes or signal amplification techniques, achieving single-cell or even subcellular resolution (Zhuang, 2021). Notable imaging-based approaches include MERFISH (Zhang et al., 2021) and seqFISH+ (Eng et al., 2019). With continuous technological advancements, ST has been widely applied in diverse fields, including cancer biology (Berglund et al., 2018) and neuroscience (Chen et al., 2020).
A key challenge in ST data analysis lies in the integration of cross-sectional information. Despite the inherent spatial continuity between adjacent tissue slices, anatomical variations and experimental conditions—such as differences in section orientation and positioning—can introduce discrepancies. Simply relying on gene expression data for integration may not guarantee precise alignment. Therefore, a more comprehensive approach that incorporates both spatial and molecular information is essential for accurately interpreting multi-section data and capturing tissue heterogeneity and function (Zeira et al., 2022). Accurate spatial alignment effectively corrects anatomical discrepancies, ensures consistency of biological structures across sections, and minimizes gene expression shifts caused by section-placement errors. By improving the accuracy of cross-section integration, spatial alignment techniques not only maximize the spatial resolution of ST data but also provide a refined spatial perspective for high-resolution studies of complex biological systems.
Graph-based methods have been widely applied in the analysis of spatial transcriptomics data. For example, STAGATE (Dong and Zhang, 2022) models each spot as a graph node, constructs relationships between nodes using spatial location information, and employs a Graph Attention Network to integrate data, significantly improving spatial domain identification. This demonstrates that graph-based methods can effectively encode feature information as node attributes and construct edges based on spatial proximity, enabling integrated analysis of feature and spatial information.
Point cloud fine registration (Besl and McKay, 1992) is a critical technique in fields such as three-dimensional (3D) reconstruction, robotic navigation, and medical image analysis. It aims to align multiple sets of point cloud data by optimizing transformations (e.g., translation and rotation). The core objective is to determine the optimal transformation matrix by minimizing alignment errors—such as point-to-point, point-to-surface, or point-to-line distances—between point clouds. The classical Iterative Closest Point (ICP) algorithm is widely used in various registration tasks due to its simplicity and efficiency. Building upon ICP, the Nonrigid Iterative Closest Point (NICP) (Serafin and Grisetti, 2015) introduces nonrigid deformation capabilities, allowing it to handle more complex registration tasks.
Currently, mainstream spatial transcriptomics alignment methods include the optimal transport-based PASTE method, which utilizes Gromov–Wasserstein (GW) distance for alignment (Zeira et al., 2022); the Gaussian process-based deformation alignment method Gaussian Process Spatial Alignment (GPSA) (Jones et al., 2023); the STAlign method, which employs large-deformation diffeomorphic mapping for alignment (Clifton et al., 2023); CAST, which combines size and probabilistic matching strategies (Tang et al., 2024); and SPIRAL, an alignment method based on graph neural network embeddings (Guo et al., 2023). More recently, several methods have been proposed specifically for multi-slice integration. JADE (Guo et al., 2026) is a unified framework that simultaneously learns spatial alignment and shared low-dimensional embeddings across slices using a roundtrip architecture with attention mechanisms, although it focuses on embedding learning rather than explicit physical coordinate transformation. MaskGraphene (Hu et al., 2025) employs a graph neural network with masked self-supervised learning, triplet loss, and cluster-wise local alignment to generate joint embeddings that preserve spatial geometry while correcting batch effects; however, it relies on pre-alignment to establish inter-slice connections. A comprehensive review by Khan et al. (2025) categorizes 24 multi-slice alignment and integration tools into three classes—statistical mapping, image processing and registration, and graph-based methods—and discusses their strengths, limitations, and downstream applications. Recent benchmarking and evaluation studies have also highlighted the rapid development of ST alignment and integration methods, emphasizing the importance of robustness, cross-platform generalizability, and standardized evaluation strategies across diverse datasets and technologies (Hu et al., 2024; Yan et al., 2026). These studies further demonstrate the increasing need for accurate and scalable alignment frameworks capable of handling heterogeneous spatial transcriptomics data.
However, these methods typically proceed directly to alignment after preprocessing without first capturing the potential correspondences between data points. The root cause of this limitation is that they attempt to estimate spatial transformations directly from raw coordinates and expression profiles, lacking a set of reliable, high-confidence anchor correspondences to guide the alignment process. This limitation leads to suboptimal alignment performance, especially when dealing with datasets exhibiting complex feature distributions. Additionally, rigid alignment methods like PASTE are constrained by the initial shapes of tissue slices, making it difficult to further improve alignment accuracy. On the other hand, nonrigid methods often impose stringent requirements on the initial spatial distribution of slices. For example, GPSA’s de novo alignment struggles to align slices with significant spatial differences, where STAlign requires manual adjustment of slice orientations to achieve effective deformation-based alignment—a task that is both labor-intensive and impractical for identifying optimal angles.
To address these limitations, we propose GMSA, a pairwise alignment method based on GM that preemptively captures point correspondences. GMSA incorporates both rigid and nonrigid alignment strategies. In GMSA, spatial transcriptomics data are modeled as graph structures, where node attributes represent feature information and edge weights are defined by the Euclidean distances between spatial coordinates. GM is used to extract correspondence relationships between data slices. Based on the matching results, subgraphs are generated and aligned efficiently using the ICP or NICP algorithms.
The effectiveness of GMSA has been validated on datasets, such as DLPFC (Maynard et al., 2021), MERFISH (Zhang et al., 2021), STARMAP (Wang et al., 2018), and Stereo-seq (Chen et al., 2022), where the nonrigid version of GMSA outperformed existing methods on the MERFISH and STARMAP datasets, demonstrating superior alignment performance.
RESULTS
Overview of the method
In this study, we propose a novel alignment method, GMSA, which integrates GM and point cloud registration framework to jointly consider gene expression information and spatial location information, enabling efficient alignment of spatial transcriptomic slices. The GMSA framework consists of two modules: The Graph Construction and Matching Module and the Alignment Implementation Module (Fig. 1).
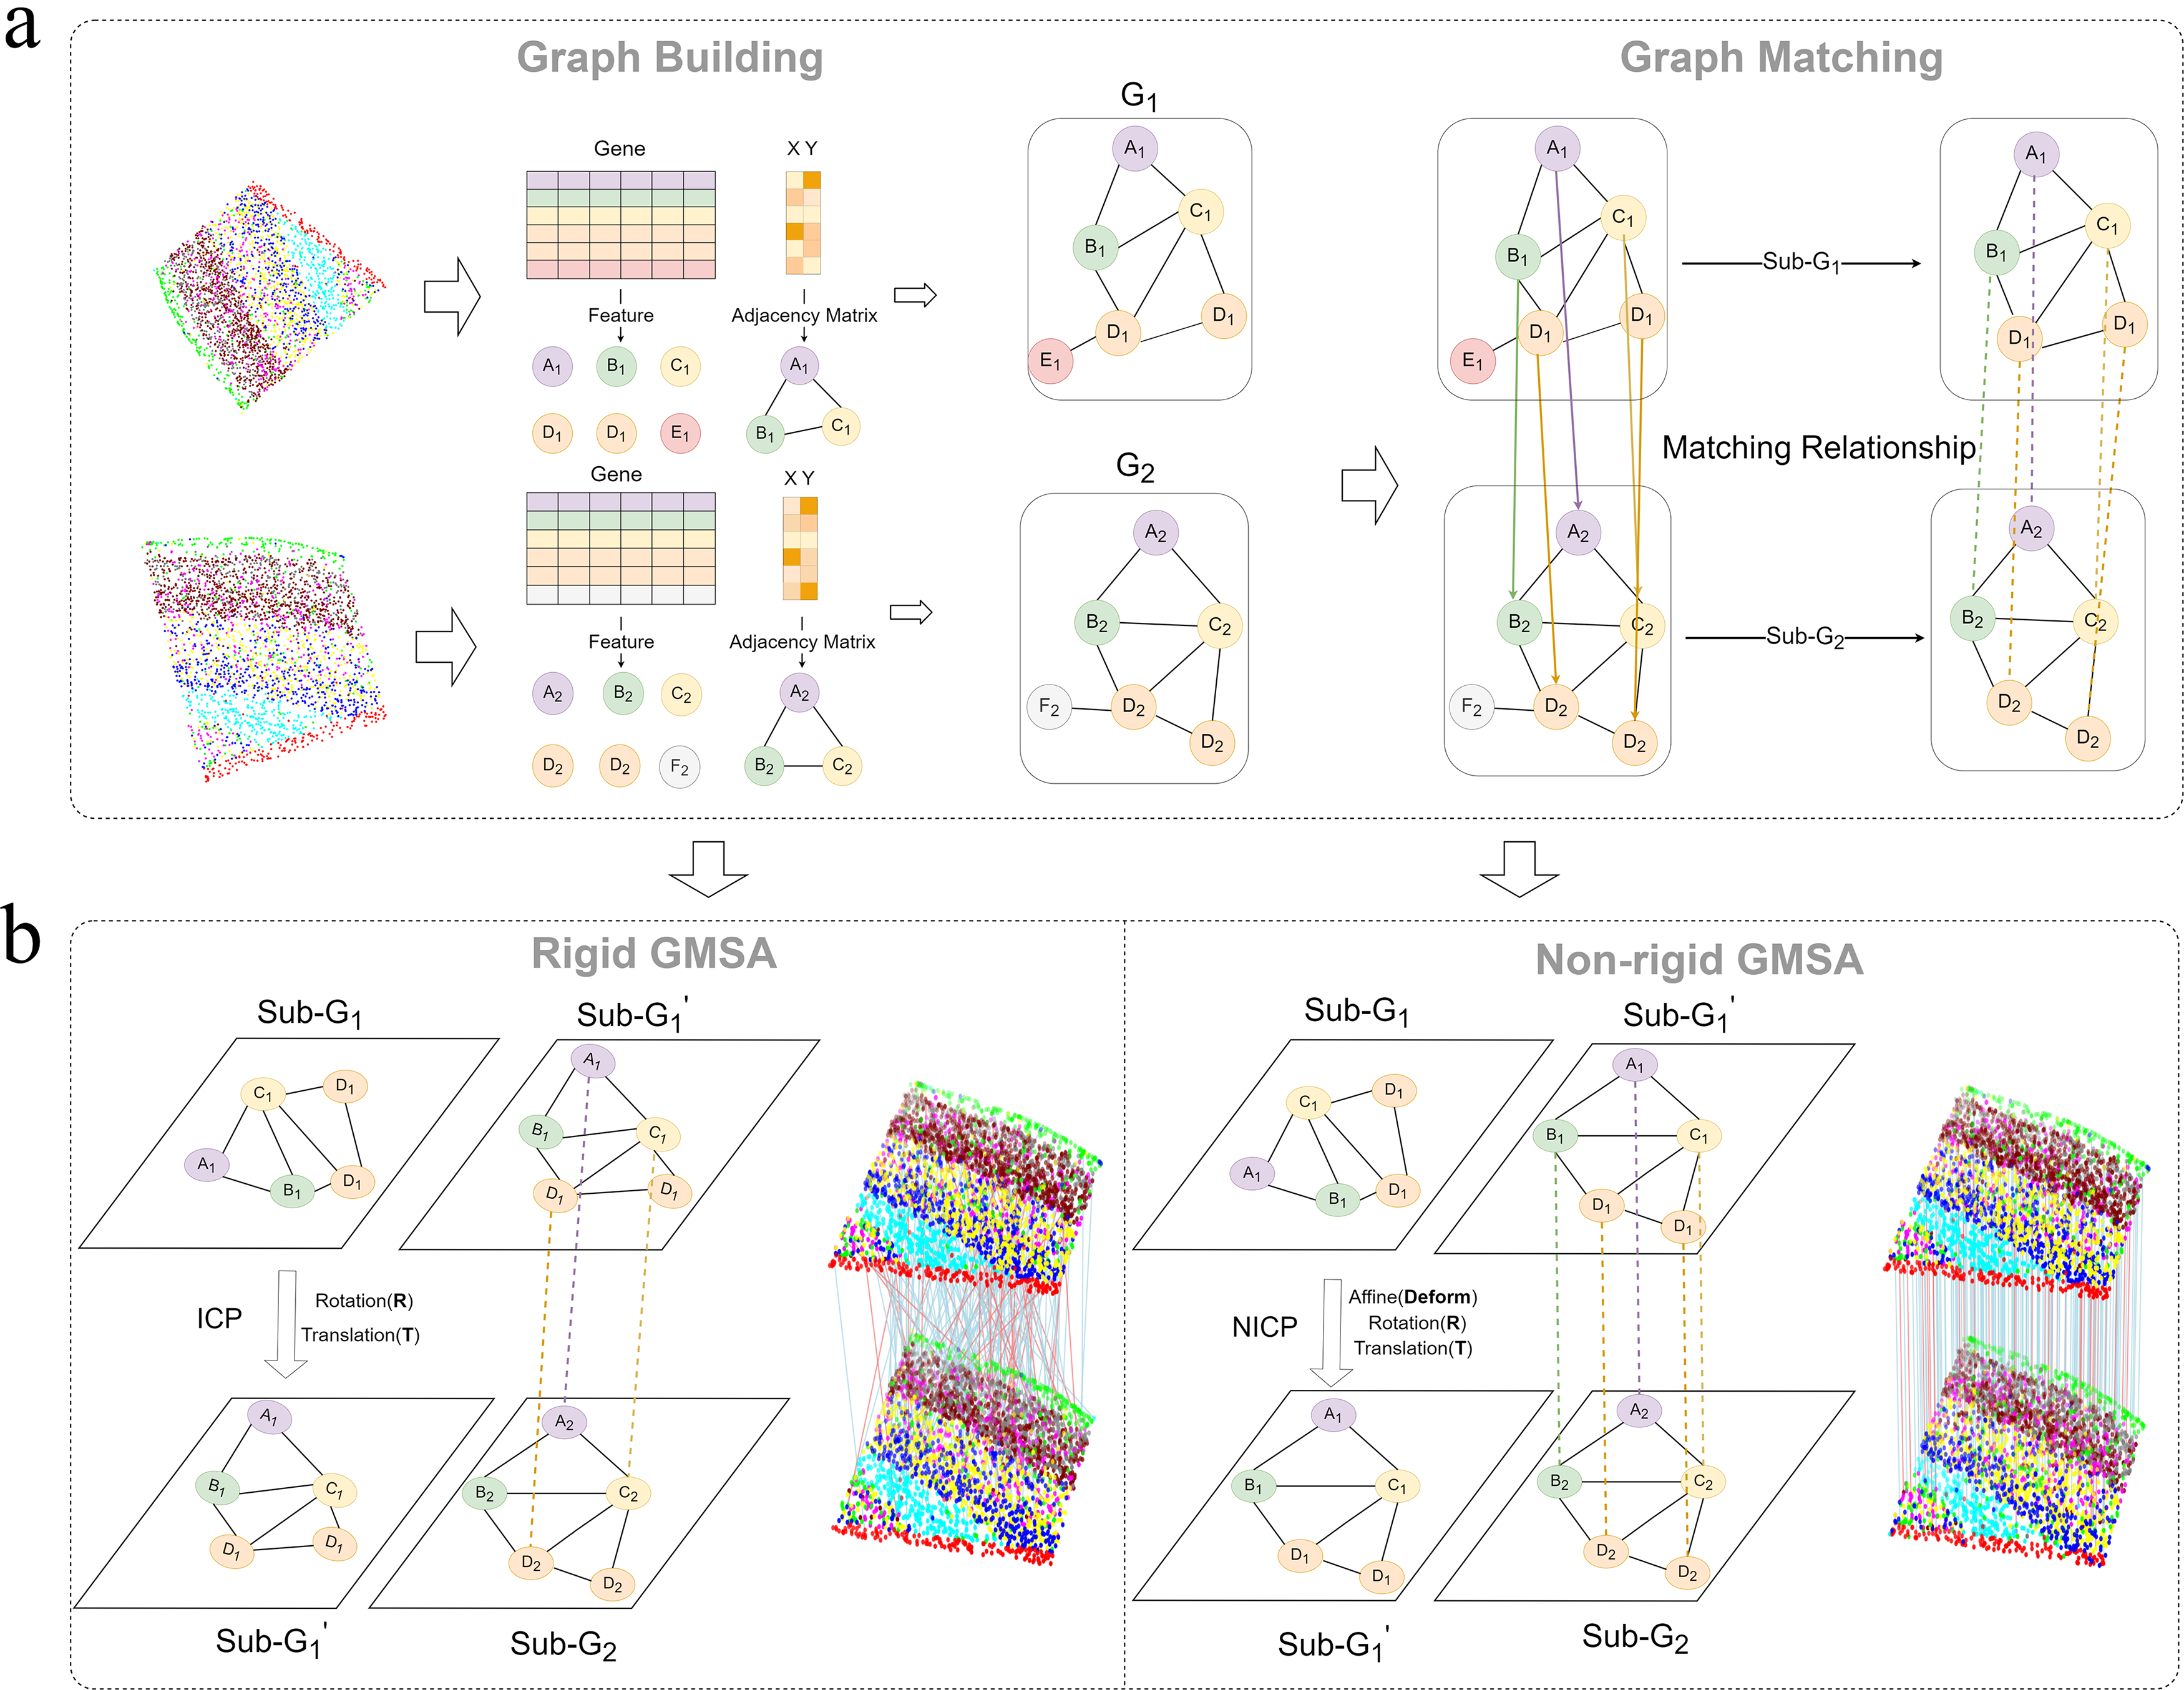
Overview of GMSA.
In the Graph Construction and Matching Module (Fig. 1a), we represent spatial transcriptomic data as a graph, where nodes correspond to gene expression profiles and edge weights are computed based on the Euclidean distances between spatial locations. Specifically, we first embed gene expression information into node features and construct edges between nodes while applying a threshold filter to remove low-correlation edges, thereby reducing noise and computational complexity. This graph representation effectively captures the relationship between gene expression and spatial positions, providing richer contextual information for subsequent alignment tasks. Furthermore, we employ a GM algorithm to establish pairwise correspondences between the constructed node graphs, identifying matched point pairs by integrating both gene expression and spatial location information. Depending on the task requirements, the matching process can be performed based solely on gene expression or in combination with spatial information. Based on the matching results, we further filter out noise points that were not captured and extract the matched point pairs as a subgraph to minimize interference in subsequent computations.
In the Alignment Implementation Module (Fig. 1b), we perform alignment on the extracted subgraph using either rigid or nonrigid point cloud registration methods, selecting between ICP for rigid alignment and NICP for nonrigid alignment. For rigid registration, the ICP algorithm iteratively optimizes to compute the rotation matrix R and translation vector T, ensuring optimal matching under rigid transformations. For nonrigid registration, NICP extends this approach by introducing affine transformation components, enabling the method to accommodate complex deformations in datasets with significant nonrigid variations. After completing the registration process, the obtained alignment parameters (R, T, and affine components) are applied to the original data, generating the final aligned results.
To evaluate GMSA’s performance, we conducted alignment experiments on three representative datasets: DLPFC, STARMAP, and MERFISH (Supplementary Table S1). The rationale and robustness of the framework were systematically assessed through a series of ablation studies.
The results of GM + ICP (Fig. 2a) demonstrate that this approach achieves effective alignment across paired slices in all three datasets, with particularly strong performance on the MERFISH dataset (Fig. 2a, right). The MERFISH dataset exhibits complex gene expression distributions, and the selected slices span a large range, making it challenging for traditional rigid alignment methods to handle. In contrast, GM + ICP performs exceptionally well on this dataset.
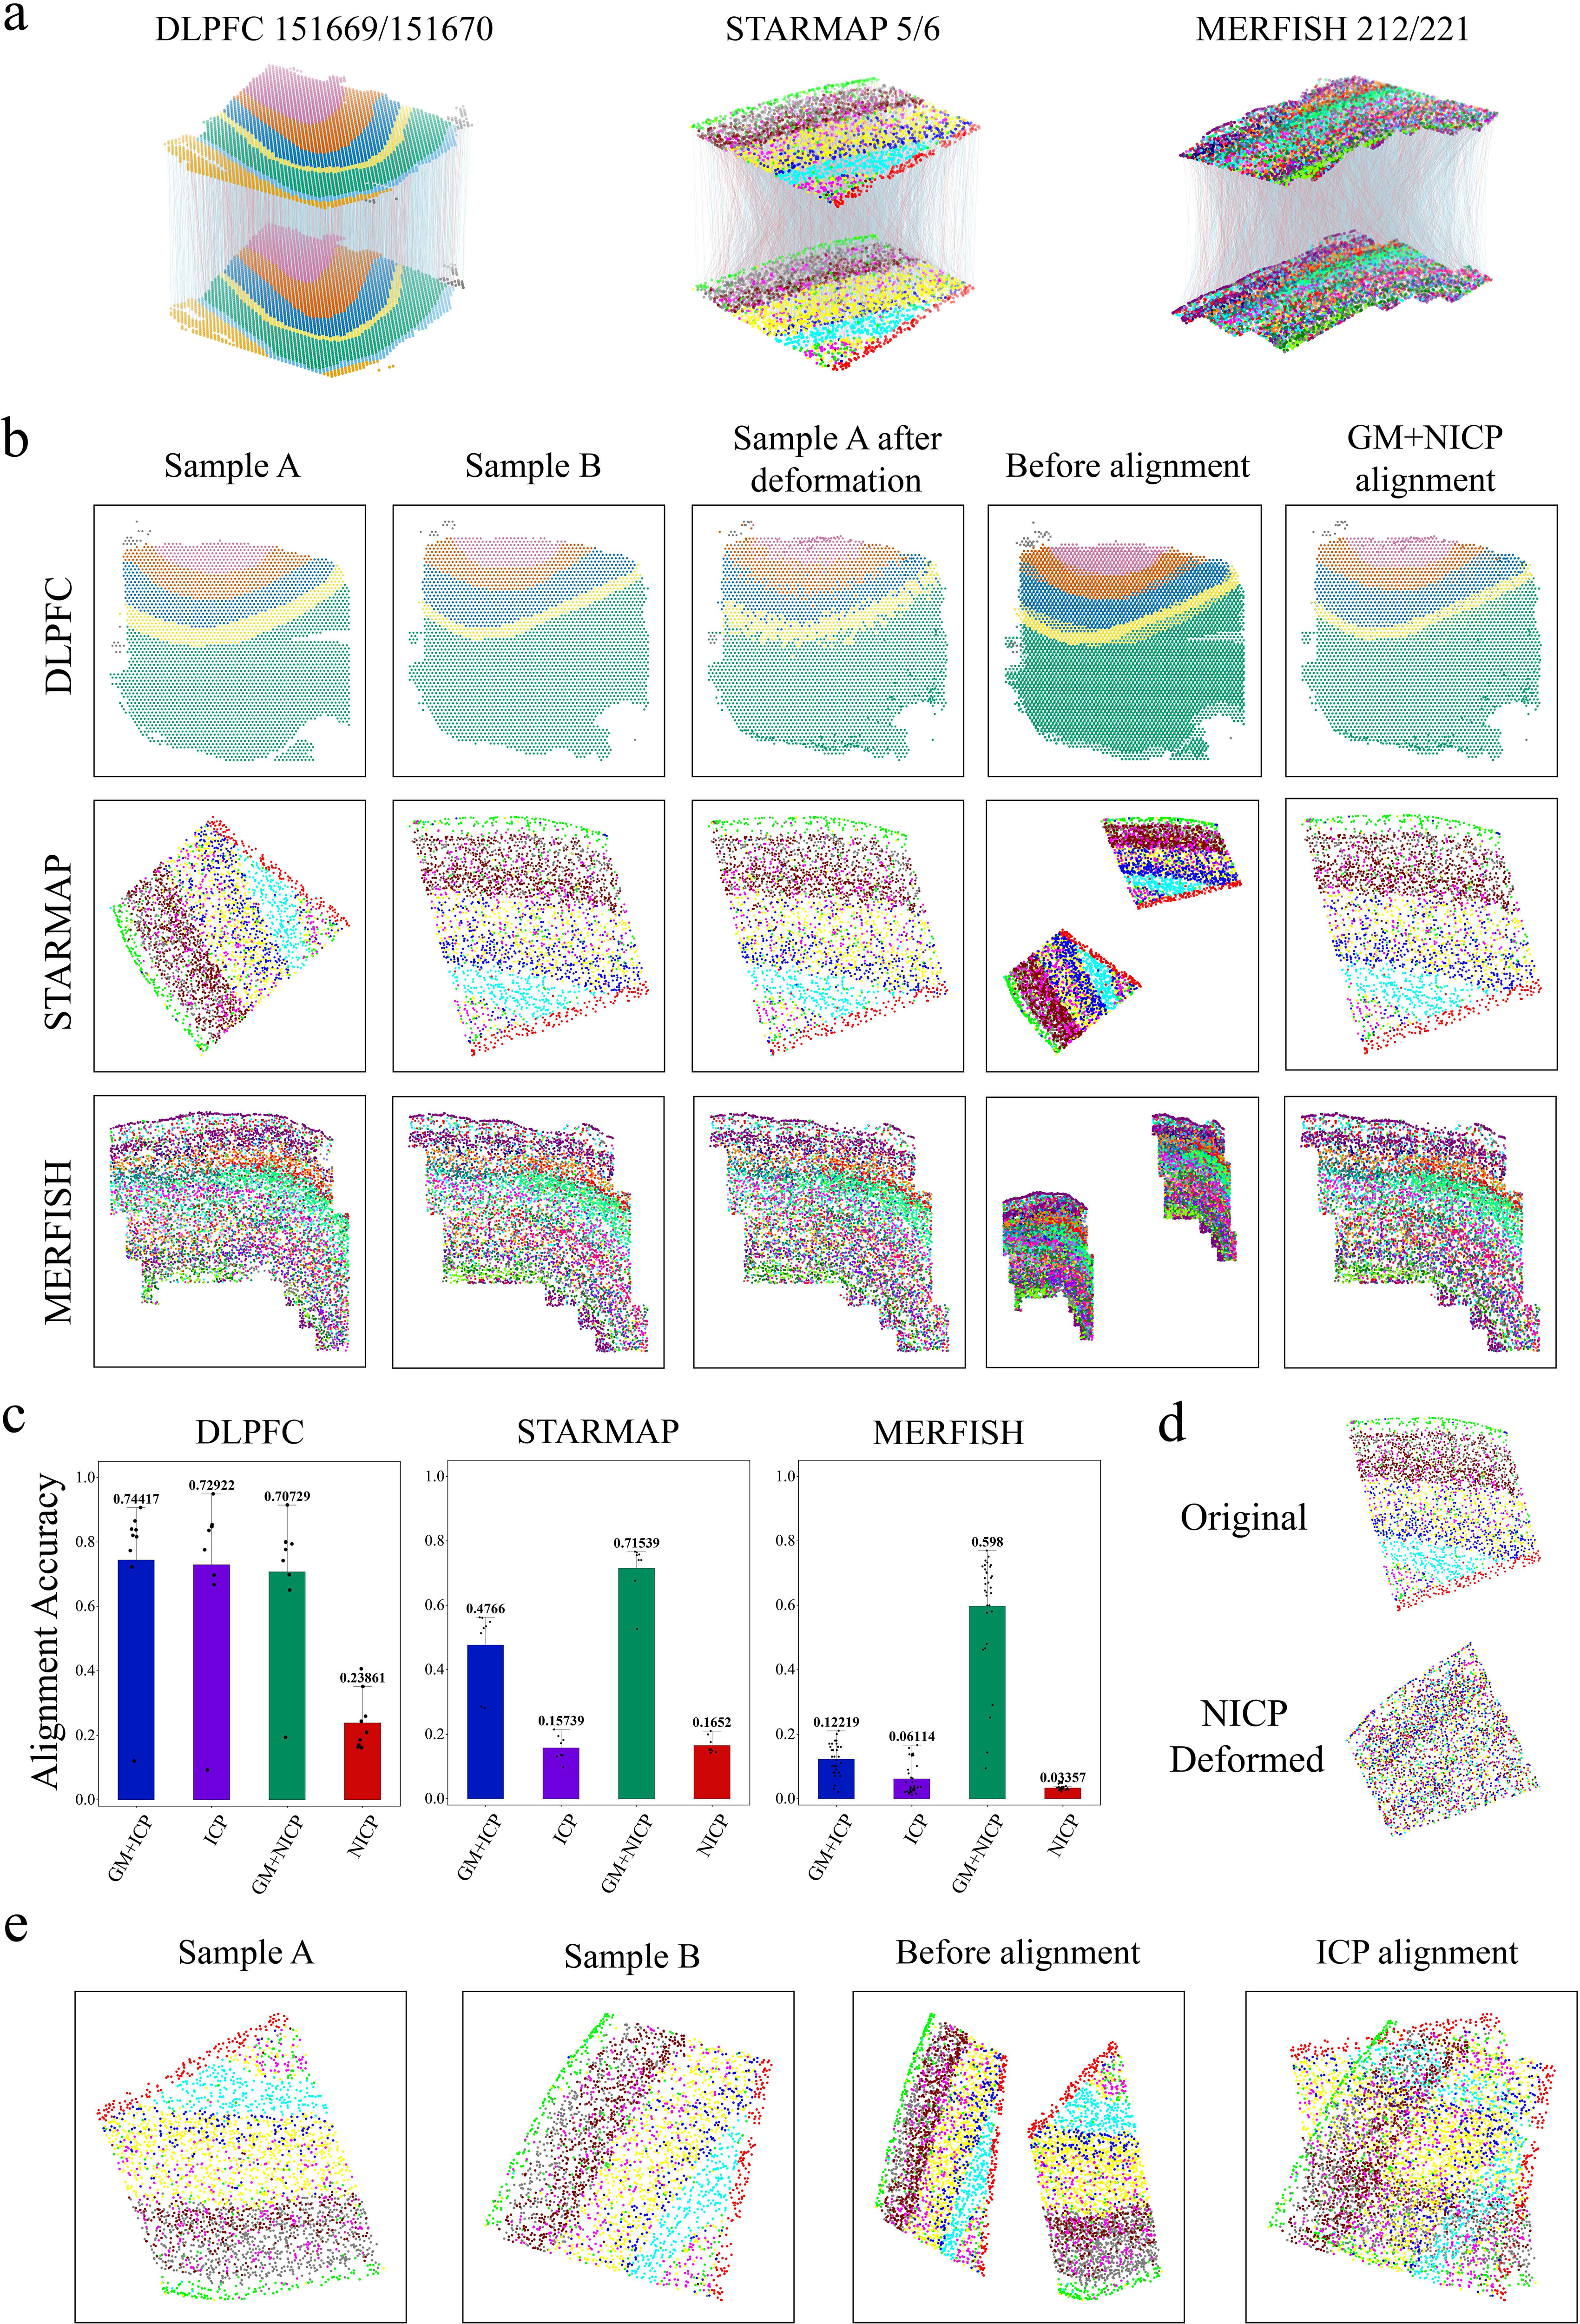
Illustration of GMSA alignment performance.
For GM + NICP, the results (Fig. 2b) highlight its capability for nonrigid alignment. By applying deformable alignment to map sample A onto sample B, GM + NICP successfully aligns paired slices from the DLPFC, STARMAP, and MERFISH datasets while preserving the spatial distribution of true labels. The postalignment visualizations reveal that after nonrigid transformation, sample A closely overlaps with sample B in both spatial positioning and true label distributions. The contours of the two aligned slices nearly coincide, demonstrating the effectiveness of GM + NICP in capturing complex structural variations.
Furthermore, we analyzed the necessity of GM through ablation studies (Fig. 2c). The experimental results indicate that GM + ICP and GM + NICP, which incorporate GM, consistently achieve superior alignment performance compared to directly applying ICP or NICP to the slices. In the case of NICP alignment, the accuracy is significantly lower than GM + NICP across all datasets. Notably, for the MERFISH dataset, NICP achieves an accuracy of only 0.03357, rendering it entirely unsuitable for alignment tasks. Even on the DLPFC dataset, where NICP performs best (0.23861), it still falls far short of GM + NICP’s accuracy. Regarding ICP, its performance on the DLPFC dataset is comparable to GM + ICP, which can be attributed to the relatively similar initial spatial orientations and lower complexity of gene expression distributions in DLPFC slices. However, in the STARMAP and MERFISH datasets, ICP’s alignment accuracy is significantly lower than GM + ICP due to larger initial spatial differences and more complex gene expression distributions. Compared to STARMAP and MERFISH, the DLPFC dataset exhibits clearer and smoother layer structures, leading to smaller deviations between initial and aligned positions. In essence, while ICP and NICP rely solely on spatial positioning, GMSA effectively preserves both gene expression information and spatial consistency by integrating GM as a critical initialization step (Fig. 2d,e).
In fact, GM is a critical step in capturing the correspondence between points based on gene expression similarities. By integrating GM with fine-grained point cloud registration, GMSA effectively achieves alignment that simultaneously preserves both gene expression information and spatial positioning.
We conducted a comprehensive comparison of rigid GMSA (GM + ICP) with two widely used rigid alignment methods, PASTE and ICP, across three datasets: DLPFC, STARMAP, and MERFISH (Fig. 3). The results demonstrate that GM + ICP exhibits broad alignment effectiveness across various data scenarios.
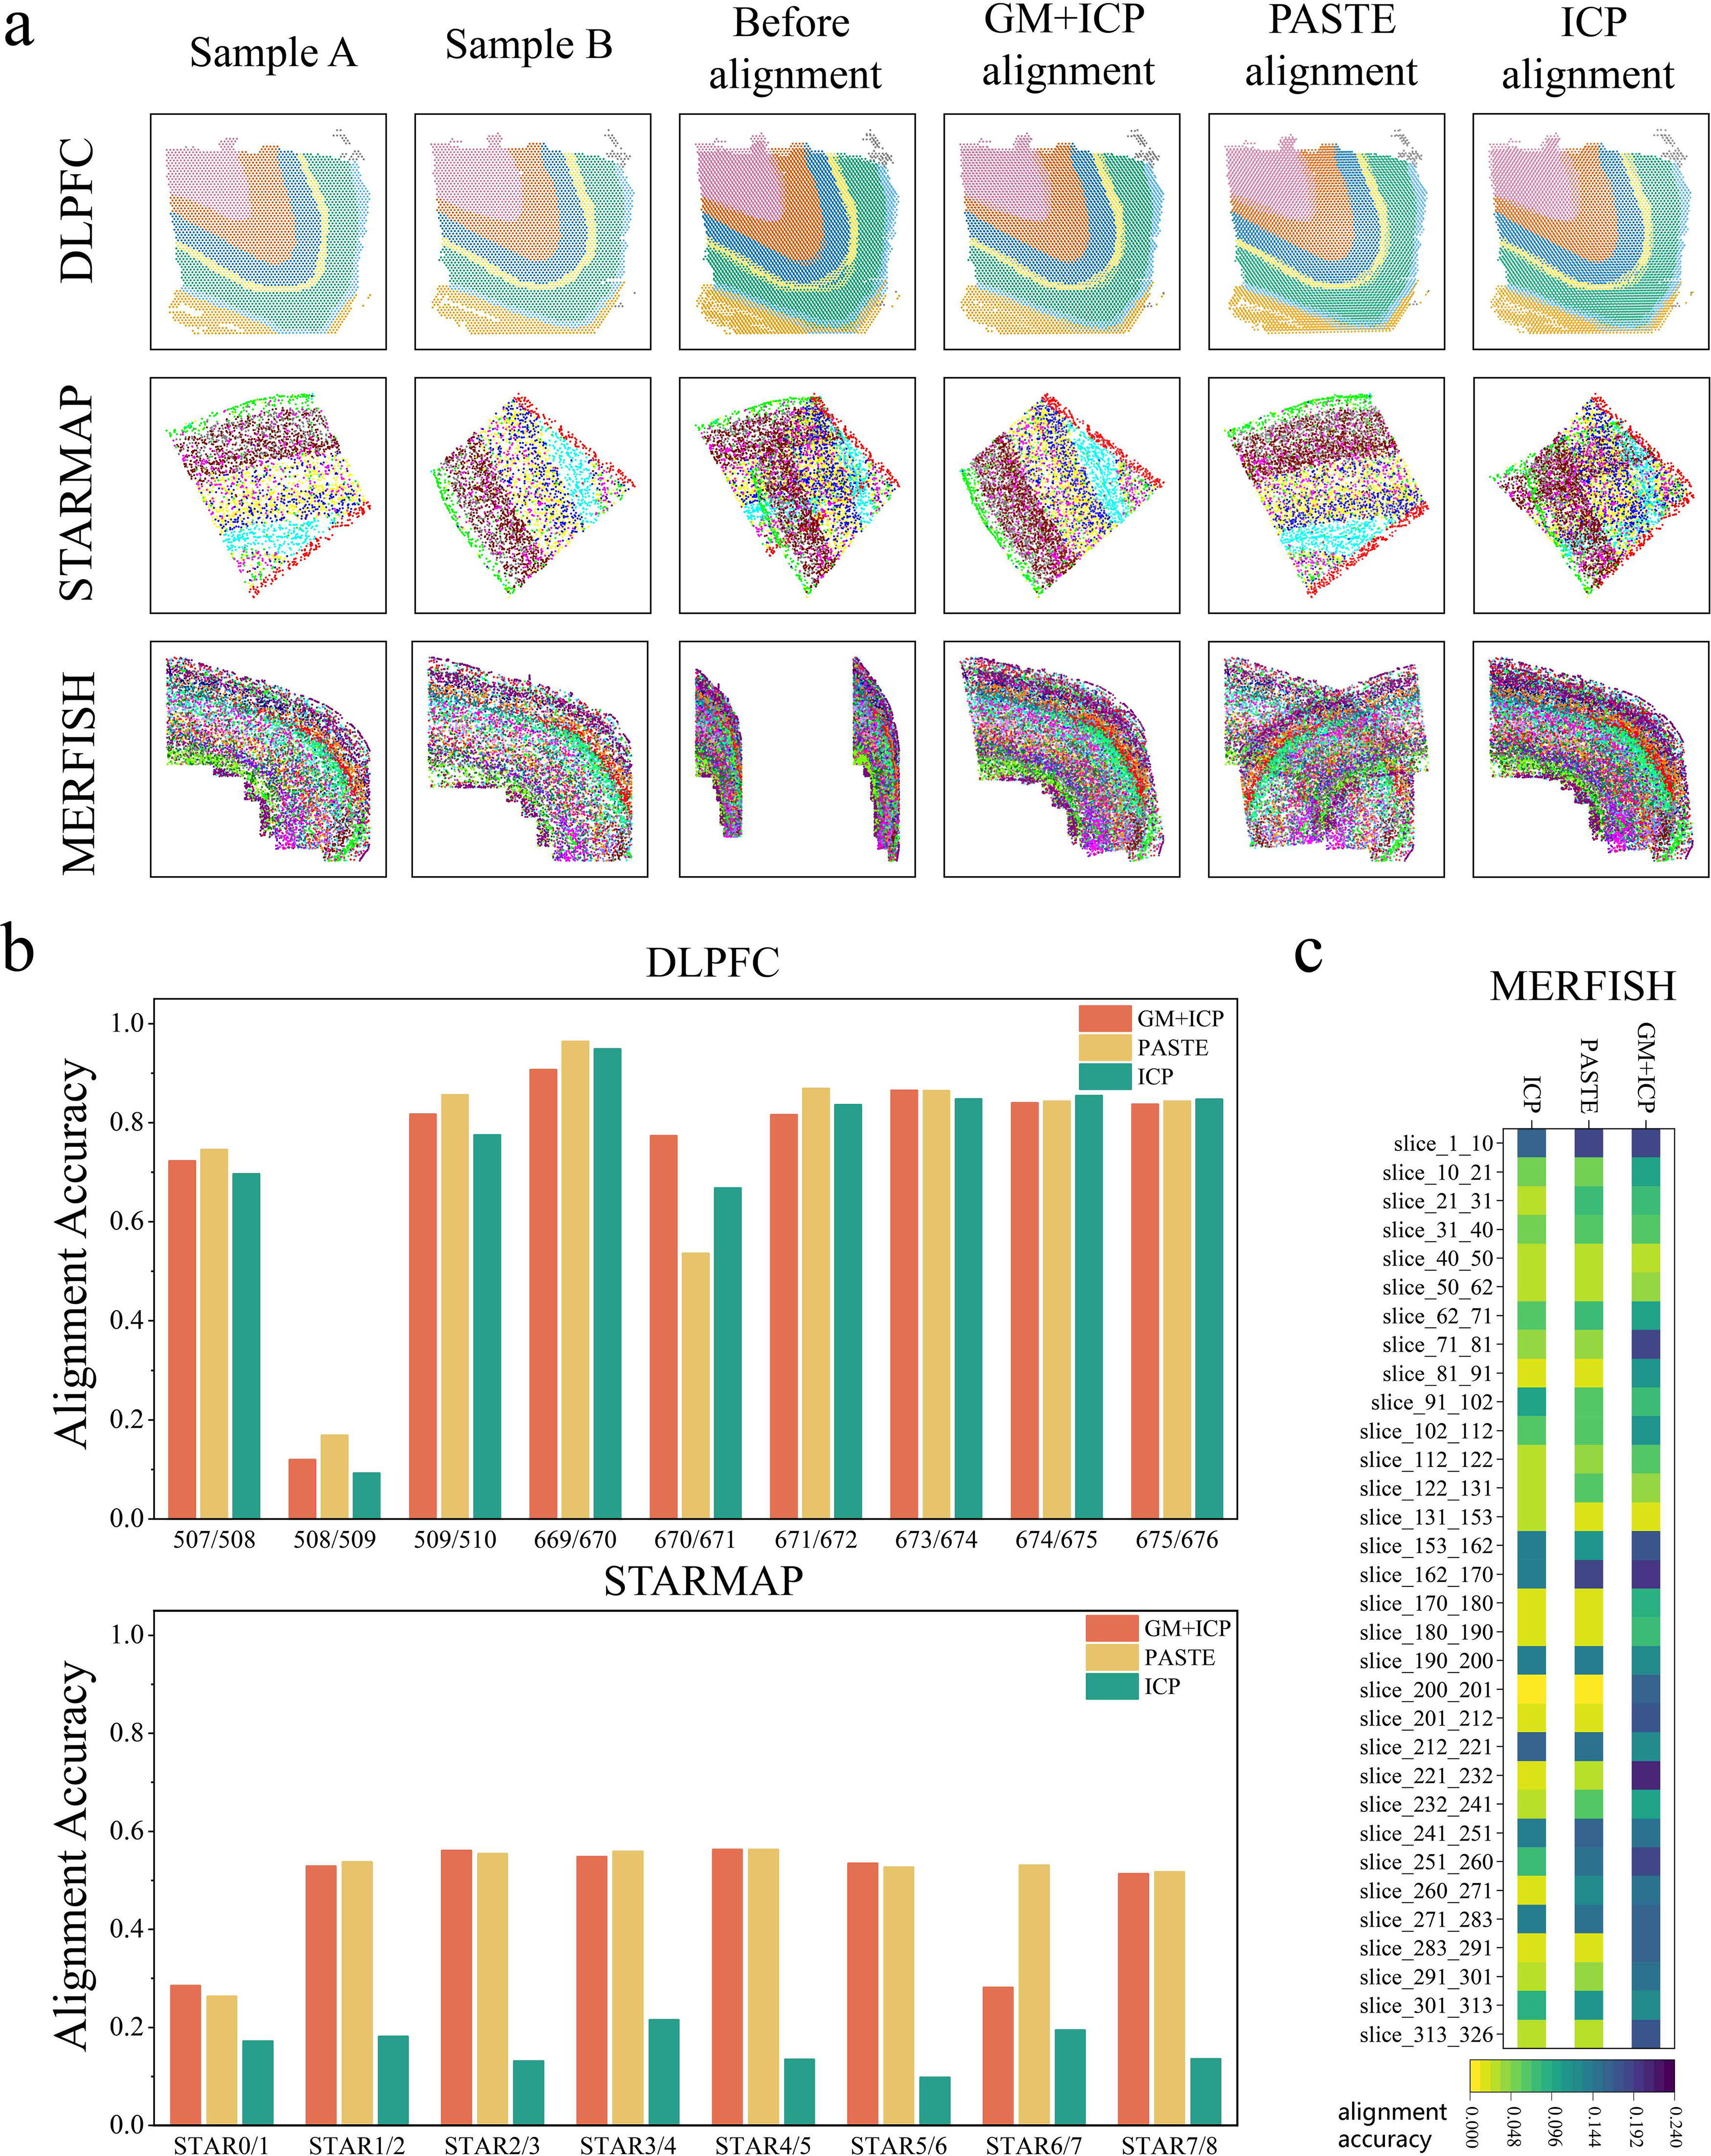
Analysis of rigid alignment results.
In the DLPFC dataset, which features relatively simple gene expression distributions, all three methods achieved high alignment accuracy (Fig. 3b, top). While PASTE demonstrated superior performance in most dataset pairs (except for 508/509 and 670/671), GM + ICP performed exceptionally well on these two pairs, particularly in 670/671, where its accuracy significantly surpassed that of both PASTE and ICP. These findings indicate that GM + ICP can leverage its advantages effectively in certain dataset pairs.
The STARMAP dataset presents a more challenging alignment scenario due to the complex spatial distribution of slices before alignment, including substantial differences in spatial distances and angles. Overall, GM + ICP and PASTE achieved comparable accuracy across most dataset pairs, whereas ICP struggled to produce effective alignments (Fig. 3a). For instance, in the 4/5 dataset pair of STARMAP (Fig. 3b, bottom), both GM + ICP and PASTE identified reasonable translation and rotation parameters, achieving similar alignment accuracy. However, in the 6/7 dataset pair, GM + ICP performed poorly. This limitation stems from the constraints of the ICP mechanism—GM + ICP supports only rotation and translation but lacks the capability to perform necessary flipping operations, directly impacting alignment accuracy.
In the MERFISH dataset (Fig. 3c), which exhibits the most complex gene expression distributions, GM + ICP demonstrated a clear advantage over the other methods in most dataset pairs. For example, in the 153/162 dataset pair, all three methods achieved accuracy exceeding 0.1; however, PASTE introduced an unintended flipping operation during alignment, leading to ineffective registration. In contrast, GM + ICP not only achieved the highest accuracy but also provided more precise contour matching, outperforming ICP in overall alignment precision.
The experimental results highlight the broad applicability of GM + ICP across different datasets and alignment scenarios. For datasets with relatively simple gene expression distributions, such as DLPFC, GM + ICP maintains stable alignment accuracy comparable to that of PASTE. In the STARMAP dataset, which features significant spatial positioning and orientation differences, GM + ICP remains competitive with PASTE in most cases despite its limitations in handling slice pairs requiring flipping. In the MERFISH dataset, which contains highly complex gene expression distributions, GM + ICP consistently outperforms both PASTE and ICP in most dataset pairs, particularly excelling in contour matching.
In summary, GM + ICP demonstrates broad applicability across datasets and alignment tasks, particularly in scenarios that do not require flipping operations, where it exhibits stable and superior performance.
In nonrigid alignment tasks, GMSA combines GM with NICP to capture the correspondences between gene expression features and spatial structural information, enabling nonrigid spatial transformation. This method aligns gene expression features with high precision and leverages these correspondences to achieve deformation-based spatial alignment. We compared GM + NICP with mainstream nonrigid alignment methods, including CAST, SPIRAL, and GPSA, across three datasets: DLPFC, STARMAP, and MERFISH (Fig. 4).
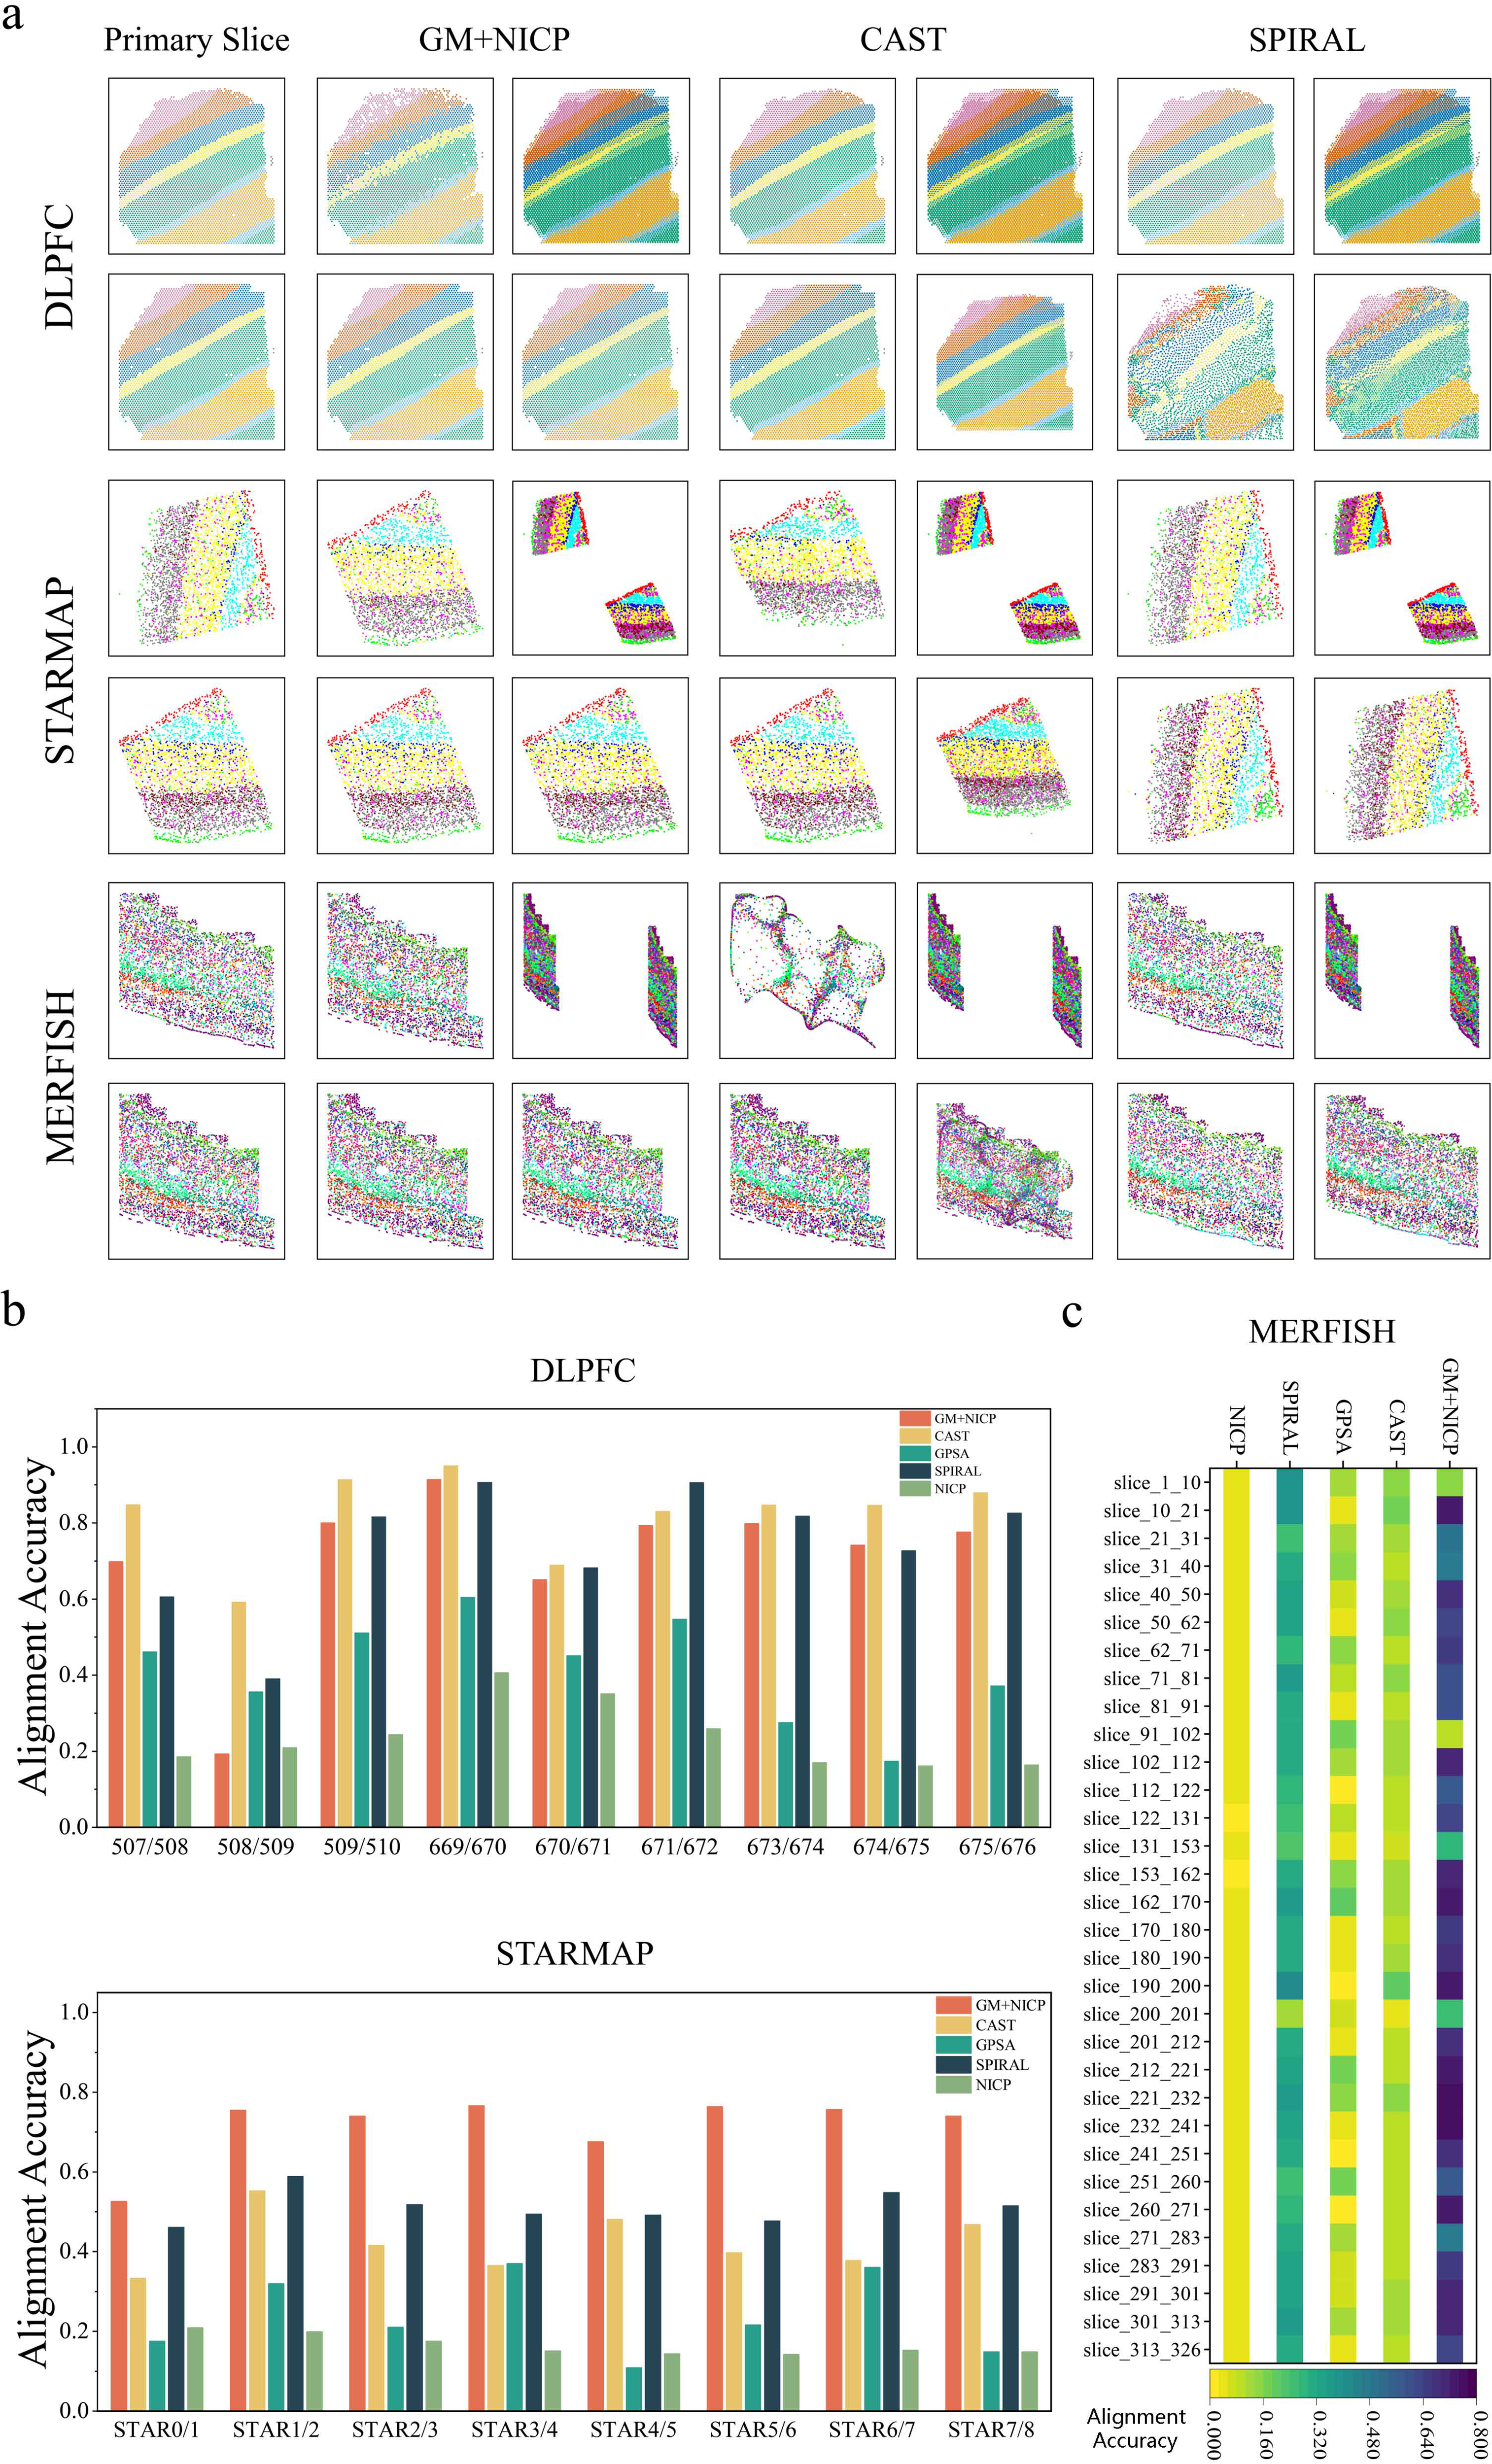
Analysis of nonrigid alignment results.
Unlike GMSA, methods like CAST and SPIRAL employ different alignment strategies. CAST incorporates graph neural networks to embed gene expression and spatial information, achieving scale transformation through physical alignment before completing the nonrigid registration process. SPIRAL, on the other hand, uses a combination of gene expression and a separate graph constructed from each sample’s spatial coordinates as input. It employs discriminators and classifiers to disentangle embeddings into biological and noise components, ultimately aligning shared clustering coordinates between reference and query samples via GW optimal transport. These implementation details are reflected in some experimental results (Fig. 4a). For CAST, across all experiments (CAST, bottom right in Fig. 4a), scale transformations for spatial adjustments are clearly observed. Meanwhile, in the DLPFC dataset (Fig. 4a, top), SPIRAL demonstrates its disentanglement approach through discriminators and classifiers, aligning real labels with mappings derived from GW optimal transport.
On the DLPFC dataset (Fig. 4b, top), CAST achieved alignment accuracy significantly higher than other methods, primarily due to the pronounced scale differences between slices in this dataset. SPIRAL performed second best in terms of accuracy, though its postalignment slice distributions exhibited unevenness and lack of smoothness in some datasets (SPIRAL, bottom right in Fig. 4a). In contrast, GM + NICP, while slightly less accurate, produced deformations that better matched the distribution of true label values, indicating that GM + NICP preserves the biological characteristics of the original slices more effectively.
On the STARMAP dataset (Fig. 4b, bottom), GM + NICP outperformed all other methods in alignment accuracy. It achieved substantial deformations from the original to target slices (Fig. 4a), whereas CAST, despite achieving partial corrections in gene expression, displayed significant deviations in spatial distribution. SPIRAL selected different target slices than other methods, correctly identifying gene expression domains and achieving partial deformations, but its final alignment accuracy was slightly lower than GM + NICP.
On the MERFISH dataset (Fig. 4c), GM + NICP demonstrated superior alignment accuracy across most dataset pairs. It achieved highly accurate slice deformation and spatial alignment during experiments (Fig. 4a). Although SPIRAL produced stable alignment results, its accuracy was slightly lower than that of GM + NICP. CAST, on the other hand, performed poorly on most dataset pairs, with deformation results deviating significantly from the true slice distributions. GPSA, relying on a de novo alignment approach, failed to achieve satisfactory deformations in multiple alignment tasks (Fig. 4b,c).
In summary, nonrigid GMSA combines GM with NICP, offering a novel alignment strategy. Across multiple experiments, GMSA demonstrated broad applicability, significantly outperforming CAST, SPIRAL, and GPSA on the STARMAP and MERFISH datasets, achieving higher alignment accuracy and superior deformation results. These findings highlight the potential advantages of GMSA for nonrigid alignment tasks.
GMSA demonstrated remarkable alignment effectiveness on the Stereo-seq cross-period datasets. Both rigid and nonrigid GMSA were applied to slices E11.5 E1S1 and E11.5 E1S2 in the Stereo-seq dataset (Fig. 5), achieving excellent alignment of both gene expression and spatial information. Rigid GMSA successfully aligned major tissues, such as the brain, head, heart, surface ectoderm, and sclerotome (Fig. 5e,f), showing good contour overlap (Fig. 5c). These results indicate that rigid GMSA effectively maintains the overall structural integrity and spatial consistency of tissues during alignment, making it well suited for aligning slices with minimal structural variations.
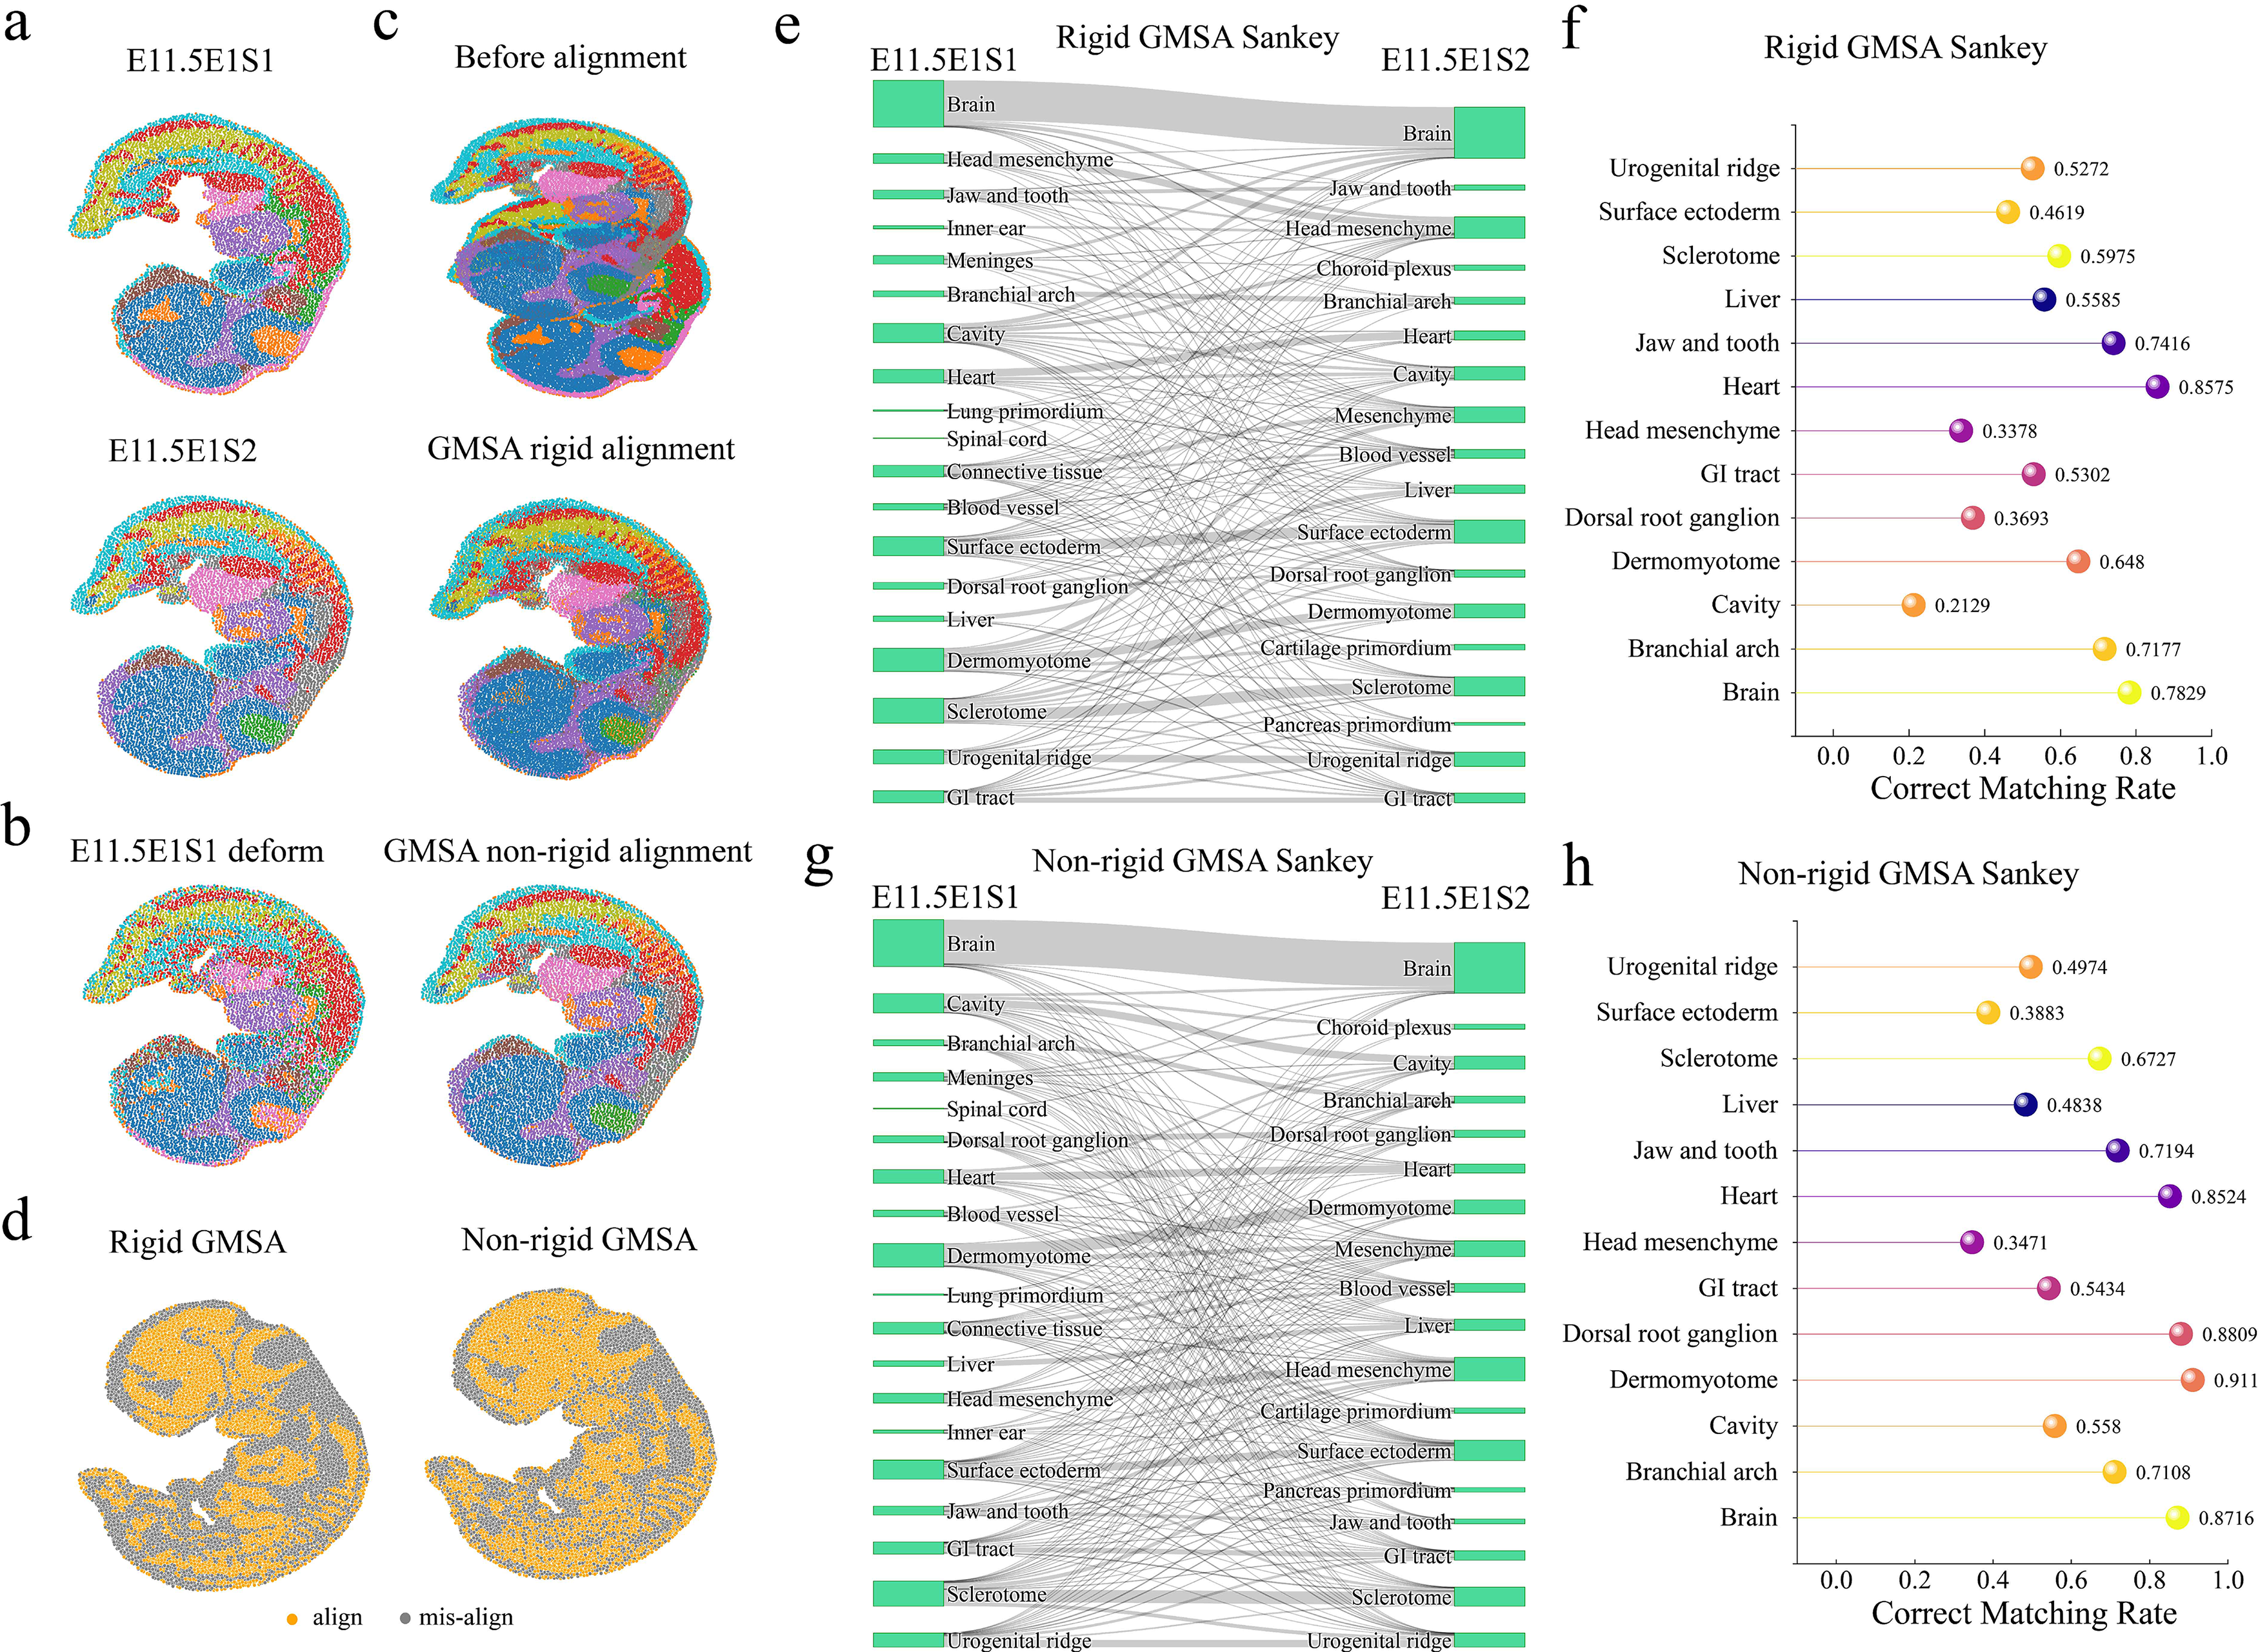
Analysis of cross-period slice alignment results.
In comparison, nonrigid GMSA exhibited superior alignment performance. By deforming the target sample (Fig. 5b), nonrigid GMSA successfully transferred tissues such as the brain, heart, and dermomyotome. It also aligned a greater number of spots (Fig. 5g,h) and achieved higher spatial precision (Fig. 5c). This approach is particularly effective for capturing subtle differences between tissues, enabling finer alignment for datasets with complex deformations or local structural variations. The alignment status distribution maps (Fig. 5d) further illustrate that nonrigid GMSA (right panel) outperforms rigid GMSA (left panel) in the number of aligned spots. Specifically, within the brain tissue, nonrigid GMSA not only successfully aligned the entire brain but also captured surrounding head mesenchyme regions. It also achieved more comprehensive alignment for the heart and liver tissues, highlighting its flexibility and efficiency in aligning cross-period datasets (Fig. 5g,h).
Additionally, the Sankey diagrams (Fig. 5e–h) provide an intuitive visualization of the alignment differences between the two GMSA methods across tissue types. Rigid GMSA achieved stable alignment for major tissue structures but showed limited effectiveness in edge regions and areas with significant deformation. Nonrigid GMSA, on the other hand, delivered more precise registration both globally and locally, particularly excelling in transitional regions of complex tissue structures. This capability holds significant importance for research in developmental biology and tissue remodeling.
In conclusion, both rigid and nonrigid GMSA effectively aligned cross-period Stereo-seq datasets, with nonrigid GMSA demonstrating superior accuracy and coverage. Future developments could integrate the strengths of both methods to create more efficient and precise cross-period alignment approaches, providing robust support for in-depth studies of tissue development and disease progression.
This study proposes a novel spatial transcriptomics data alignment framework, GMSA, which demonstrates significant advantages, particularly in nonrigid alignment. The novelty of GMSA lies not in the individual use of GM or point cloud registration, but in their synergistic integration within a “local-to-global” alignment framework. By first extracting highly matched subgraphs as reliable anchors, GMSA addresses the root cause of existing methods’ limitations: the lack of explicit, high-confidence correspondence initialization. Experimental results indicate that GMSA achieves high alignment accuracy across multiple datasets, outperforming traditional methods, especially on the MERFISH dataset, highlighting its robustness and broad applicability. Additional robustness analysis against batch effects (see Supplementary Data S1) further demonstrates that GMSA maintains stable alignment accuracy under expression perturbations, confirming its reliability across technical variability.
GM plays a pivotal role in the GMSA framework, directly influencing the final alignment outcome. Ablation experiments and Sankey diagram (Xia et al., 2023) analysis further validate that the node correspondences established by GM are critical for nonrigid alignment, providing precise initialization for subsequent point cloud fine registration. Additionally, GM effectively captures spatial relationships among complex tissue structures, significantly enhancing the accuracy of fine-grained tissue alignment. Unlike end-to-end deep learning methods (Supplementary Fig. S6), such as GraSpot (Gao et al., 2024) and STAligner (Zhou et al., 2023), this GM module serves as an interpretable topological prior that can flexibly adapt to various downstream registration techniques, demonstrating its methodological versatility.
While GMSA can integrate multiple slices through sequential pairwise alignment, as demonstrated on the STARmap dataset, where slices 1–4 were progressively aligned within a common coordinate system, true 3D tissue reconstruction remains beyond the current scope (Supplementary Fig. S1). Extending GMSA to full 3D reconstruction would require addressing several challenges: (1) generalizing the current 2D GM framework to 3D volumetric graphs that capture inter-slice continuity; (2) designing deformation models capable of handling nonrigid transformations in three dimensions without overfitting to sparse tissue sections; and (3) mitigating the increased computational cost associated with larger graph sizes and iterative multi-slice registration. These directions represent important opportunities for future research.
Despite its strong performance, GMSA has certain limitations. For instance, rigid alignment struggles with slice-flipping issues in the STARMAP dataset and exhibits suboptimal performance when aligning slices with significant size differences in the DLPFC dataset. These limitations primarily stem from the use of basic GM and point cloud registration methods (ICP, NICP). Additionally, GMSA assumes substantial biological overlap between slices, a valid assumption for consecutive sections from the same tissue block. The effectiveness of GMSA largely depends on the ability of the GM module to identify reliable structural correspondences before registration. In more challenging scenarios, such as partial-overlap or cross-technology alignment, future improvements may require more robust graph matching strategies to identify highly matched anchor points under heterogeneous feature distributions and incomplete spatial correspondence. This issue has been partially addressed by methods such as PASTE2 (Liu et al., 2023) and MaskGraphene (Hu et al., 2025). Recent benchmarking studies have similarly emphasized that cross-platform alignment remains a critical, unresolved challenge (Hu et al., 2024; Yan et al., 2026). Furthermore, GMSA incurs a relatively high computational costs on large-scale spatial transcriptomics data (Supplementary Fig. S5). As highlighted by the benchmark, resolving these computational bottlenecks via algorithmic optimization is paramount for next-generation tools.
Overall, GMSA demonstrates superior alignment performance across multiple datasets, including DLPFC, STARMAP, MERFISH, and Stereo-seq. By integrating rigid alignment (GM + ICP) and nonrigid alignment (GM + NICP), GMSA effectively combines gene expression information with spatial location information, facilitating cross-slice alignment. Future research could further optimize GM and point cloud registration methods to improve alignment accuracy and reduce computational costs, thereby expanding the applicability of GMSA to large-scale spatial transcriptomics data.
METHODS
GMSA algorithm
Graph node generation
Graph node generation is an important step in GMSA. In this process, spatial transcriptomics datasets are transformed into graphs, with specified node and edge features.
First, the spatial transcriptomics dataset is denoted as
GMSA constructs an undirected graph for an ST data slice based on the following strategy (neighbor selection and edge construction):
The feature information of each point in D is used as the node feature information of the graph. For each point, the 30 nearest points or all points within a given Euclidean distance threshold are selected to form edges. To evaluate the impact of graph sparsity on alignment performance, we tested five settings with neighborhood sizes of 10, 20, 30, 40, and 50. As shown in Supplementary Figure S4, GMSA maintains highly stable alignment performance across different sparsity levels, demonstrating the robustness of the method to graph construction parameters. The edge feature values are defined by the Euclidean distance between two nodes:

Based on the above strategy, the spatial transcriptomics data can be written as a quadruplet graph:

Based on the graph node generation method, two sets of spatial transcriptomics data generate
Given two sets of spatial transcriptomics data, GMSA represents them as
The GM problem is formulated as an optimization problem in which the objective is to determine an optimal assignment matrix X that maximizes both node and edge similarity. To balance feature information and spatial consistency, we introduce a weighting parameter


To obtain an optimal solution to the GM problem, we employ the Hungarian algorithm. According to the constraints in Equation (4), the resulting matched nodes between the two graphs are necessarily one-to-one correspondences. This step inherently filters out unmatched points in both graphs. Subsequently, only those nodes that fulfill the GM criteria and satisfy the one-to-one constraint are retained, whereas unmatched nodes are discarded. This process ultimately results in two separate subgraphs.
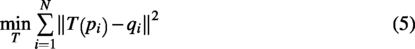
The goal of point cloud fine registration is to find an optimal transformation T, which typically includes translation and rotation (rigid transformation) or more complex nonrigid transformations, to minimize the error between the two point clouds.
Given the source point cloud
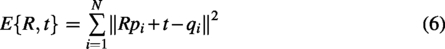
The core idea of ICP is to iteratively compute the nearest-neighbor point pairs between point clouds and optimize the geometric transformation (such as translation and rotation) to minimize the error between the two point clouds P and Q. The goal is to find the rotation matrix R and translation vector t that minimize the registration error:
Given the source point cloud

The goal of NICP is to find a deformation function

The NICP algorithm optimizes parameters R, t, and D to minimize the registration error and deformation smoothness:

In the GMSA framework, the GM process involves a hyperparameter
Evaluation indicators
The alignment accuracy is evaluated using the spot-to-spot matching ratio, layer-wise alignment accuracy (Supplementary Data S2) and spot-to-spot alignment metric (Hu et al., 2024), which quantify the consistency of spatial transcriptomics data alignment. Given two samples,
To compute alignment accuracy, we first determine the Euclidean distance matrix D between aligned sample coordinates and transform it into a probability matrix A using an exponential function, ensuring that closer points have higher alignment probabilities. The final alignment result matrix R is obtained by selecting the best-matching point for each sample based on A.
The alignment accuracy is calculated as the proportion of correctly matched points by comparing R with the ground-truth matrix G:
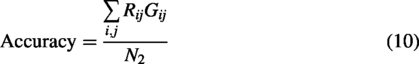
All experiments were conducted on a workstation equipped with an Intel(R) Core(TM) i7-14700KF processor, 125 GB RAM, and NVIDIA GeForce RTX 4090 GPU. The GMSA framework was implemented in Python 3.8.
AUTHORS’ CONTRIBUTIONS
J.Q., X.S., and Y.G.: Resources, supervision, project administration, funding acquisition, and writing—review and editing. L.T.: Conception, methodology, software, formal analysis, writing—original draft, investigation, and visualization. S.X.: Conception, methodology, writing—review and editing, and visualization. Z.H.: Conception, software, and writing—review and editing. L.B.: Writing—review and editing and visualization. Y.X.: Writing—review and editing, visualization, and data curation. Y.F.: Writing—review and editing and visualization.
DATA AVAILABILITY
The datasets used in this study are publicly available from various sources. The human DLPFC 10X Visium data, consisting of 12 slices, can be accessed at http://research.libd.org/spatialLIBD/. The mouse brain STARmap data are available for download at https://www.dropbox.com/sh/f7ebheru1lbz91s/AADm6D54GSEFXB1feRy6OSASa/visual_1020/20180505_BY3_1kgenes?dl=0&subfolder_nav_tracking=1. The mouse MOp MERFISH data can be obtained through the Brain Image Library at https://doi.brainimagelibrary.org/doi/10.35077/g.21. Additionally, the Stereo-seq MOSTA datasets are available for download from the CNGB database at https://db.cngb.org/stomics/mosta/download/.
CODE AVAILABILITY
The source code of GMSA is publicly available at the following GitHub repository: https://github.com/COMP1LEX1/GMSA.
Footnotes
ACKNOWLEDGMENT
The authors thank all members of our laboratory for their insightful discussions.
AUTHOR DISCLOSURE STATEMENT
The authors declare that they have no competing interests
FUNDING INFORMATION
This work was supported by the National Natural Science Foundation of China (Grant Nos. 12301623 and 82401214), the Postdoctoral Fellowship Program of CPSF (Grant No. GZC20233473), the Heilongjiang Provincial Postdoctoral Science Foundation (Grant Nos. LBH-Z23020 and LBH-Z22206), the Provincial Natural Science Foundation of Heilongjiang Province of China (Grant Nos. LH2024A003 and LH2022H041), the Beijing Natural Science Foundation (Grant No. L252176), the Science and Technology Innovation Talent Program for Advanced Manufacturing of Harbin City (Grant No. CXRC20231117155), and the 2024 Open Project of the State Key Laboratory of Advanced Welding and Joining, Harbin Institute of Technology (Grant No. MSWJ-24M15). The funders had no role in study design, data collection and analysis, decision to publish, or preparation of the article.
Supplemental Material
References
Supplementary Material
Please find the following supplemental material available below.
For Open Access articles published under a Creative Commons License, all supplemental material carries the same license as the article it is associated with.
For non-Open Access articles published, all supplemental material carries a non-exclusive license, and permission requests for re-use of supplemental material or any part of supplemental material shall be sent directly to the copyright owner as specified in the copyright notice associated with the article.