



Abstract
The escalating global plastic pollution has led to the widespread presence of microplastics in marine environments, posing a significant risk by adsorbing organic pollutants such as tebuconazole (TEB). Ocean acidification, a consequence of increased carbon dioxide (CO2) emissions, is also altering the marine environment. This study investigates the adsorption behavior of TEB on various microplastic materials under conditions of seawater acidification, a critical environmental stressor. It was found that the adsorption capacity of TEB varies among different microplastics, with degradable microplastics Poly(butylene adipate-co-terephthalate) (PBAT) and Poly(butylene succinate) (PBS) exhibiting higher adsorption capacity due to the presence of oxygen-containing functional groups. The sorption capacity followed the order of PBAT ≈ PBS > Polyamide (PA) > Polyvinyl Chloride (PVC) > Polystyrene (PS) > Polyethylene (PE). The influence of salinity on adsorption was pronounced, with increased salt concentrations enhancing adsorption on certain microplastics (PA, PBAT, and PBS), likely due to the salting-out effect and charge neutralization. Acidification significantly affected the adsorption on nondegradable microplastics by altering the degree of TEB dissociation and microplastic surface potential, showing up to 15–30% higher capacity when exposed to CO2- or HCl-acidified environments, while degradable microplastics and PA showed minimal pH sensitivity, suggesting hydrogen bonding as the conduct adsorption mechanism, which makes them less affected by changes in pH. These findings provide insights into how microplastic properties and environmental changes affect the distribution and behavior of organic pollutants in marine settings, emphasizing the ecological risks linked to microplastic pollution and ocean acidification.
Introduction
Since plastic first entered human life in the 1940s, its global production has increased dramatically from about 0.5 million tons in 1950 to 350 million tons in 2018 (Cui et al., 2023; Thompson et al., 2009; Zhang et al., 2020). After oxidation, solar radiation, water immersion, and other processes, large pieces of discarded plastic are broken down into smaller pieces, and plastic fragments less than 5 mm in diameter are often referred to as microplastics (MPs) (Crawford and Quinn, 2016; Yu et al., 2024). Microplastics are ubiquitous in the environment (Akbari et al., 2024; Bowman et al., 2024; Hasenmueller and Ritter, 2024; Johnson et al., 2024; Kryl et al., 2024). The concentration of microplastics has been reported to reach 900–4,000 particles/m3 in some areas of the Yangtze Estuary and East China Sea (Wang et al., 2020). The particle size ranges from a few microns to a few millimeters and has complex surface morphology (Salehi et al., 2024). They can adsorb some harmful substances and become a carrier of organic pollutants, which has a certain impact on the diffusion of pollutants on a global scale (Wu et al., 2024; Zhang et al., 2020). Studies have shown that microplastics have a strong adsorption effect on coexisting organic pollutants, such as polychlorinated biphenyls (PCBs) (Li et al., 2023), polycyclic aromatic hydrocarbons (PAHs) (Kong et al., 2023), bisphenol A, antibiotics, pesticides (Cai et al., 2024; Liu et al., 2023), and so on. While previous studies on microplastic–pollutant interactions predominantly focus on nondegradable materials (Li et al., 2018; Sun et al., 2019), the role of oxygen-rich functional groups in degradables (e.g., Poly[butylene adipate-co-terephthalate] [PBAT]/Poly[butylene succinate] [PBS]) under ocean acidification remains underexplored. This gap is critical because degradable microplastics may exhibit distinct sorption mechanisms (e.g., hydrogen bonding) compared with conventional plastics (Gong et al., 2019).
On Earth, the ocean covers an area of up to 71%, and a large amount of carbon dioxide (CO2) gas is exchanged between the ocean and the atmosphere. When excess CO2 in the air enters the ocean, the ocean will be acidified, that is, “ocean acidification.” Since the Industrial Revolution, humans have released a large amount of CO2 into the atmosphere through fossil burning, deforestation, and other activities, resulting in an increase in atmospheric CO2 concentration from 280 ppm to more than 410 ppm (Friedlingstein et al., 2020). It is expected that the pH value of seawater will decrease to 7.1–7.2 by 2300 and 6.4–6.5 by 2500 (Caldeira and Wickett, 2005).
The adsorption process of organic pollutants by microplastics can not only affect the distribution of organic pollutants in water, sediments, and organisms, but also affect the bioavailability of pollutants. In addition, the adsorption of organic pollutants by microplastics is affected by many factors (such as microplastic particle size, type, pH, environment, and salinity). Excessive CO2 emissions will lead to a decrease in the pH value of the seawater surface, which in turn affects the ability of microplastics to adsorb organic pollutants. Tebuconazole (TEB), a triazole-based demethylation inhibitor fungicide, exhibits potent activity against a broad spectrum of phytopathogenic fungi affecting horticultural crops (e.g., fruits and vegetables) and staple food commodities (Strickland et al., 2004). This pesticide can enter the aquatic ecosystem through runoff and endanger aquatic organisms. It was found that the concentration of TEB ranged from 9.1 to 200 μg/L in surface water and in runoff events nearby farms (Jiang et al., 2021). Gu et al. (2022) tested pesticide residues in Yingzhou West Lake, Fuyang City, Anhui Province in different seasons, and the results showed that among the 29 tested pesticides, TEB (0.2∼278.2 ng/L) and four other pesticides were the most frequently detected in water samples.
Therefore, this experiment selected TEB, a commonly used triazole fungicide, as the research object to study the adsorption characteristics and mechanisms of TEB on different materials of microplastics under conditions of seawater acidification. Considering that more complex effects beyond acidification would occur during the dissolution of CO2 in seawater, we also applied mineral acid (HCl)-induced seawater acidification for comparison.
Materials and Methods
Chemicals
TEB (with >98.5% purity) was purchased from Dr. Ehrenstorfer GmbH, Augsburg, Germany. The physicochemical properties of TEB were presented in Supplementary Table S1. TEB was dissolved in background solutions (synthetic seawater), while methanol was added to enhance solubility. The stock solution was kept at 4°C for no more than 1 week. Methanol was HPLC (high-pressure liquid chromatography) grade, which was supplied by Thermo Fisher, USA. The other reagents were analytical grade or higher. The water used in this experiment was made by ultrapure Milli-Q water system.
The degradable virgin microplastics PBAT and PBS were obtained from Dongguan Te Su Lang Chemical Raw Material Factory (Dongguan, China). The nondegradable microplastics Polyamide (PA), Polystyrene (PS), Polyvinyl Chloride (PVC), and Polyethylene (PE) were from Zhonglian Plasticizing Technology Co., Ltd. (Dongguan, China). For the sake of repeatability and consistency of the experiment, the selected microplastics needed to pass a 100–200-mesh sieve, so that the particle size was 75–150 μm.
Characterization of microplastics
The microscopic morphology characteristics of MPs were analyzed by using scanning electron microscopy (SEM, S-4800, Hitachi, Japan). Brunauer–Emmett–Teller surface areas of MPs were determined by N2 adsorption isotherms using a surface area analyzer (ASAP 2020, Micromeritics Instrument Co., USA). The functional groups contained in the MPs were identified by Fourier transform infrared (FTIR, Shimadzu IRAffinity-1, Japan) spectra (Zhu et al., 2024). The spectral scanning range was 400–4,000 cm−1, and the spectral resolution was 4 cm−1. The surface potential of MPs was determined at pH values ranging from 3 to 9 using a Nicomp Z3000 Nanoparticle Size and Zeta Potential Analyzer (USA).
Preparation of solutions
Seawater: Accurately weigh 26.5 g NaCl, 24 g MgCl2, 0.73 g KCl, 3.3 g MgSO4, 0.2 g NaHCO3, 1.1 g CaCl2, and 0.28 g NaBr into a beaker, add an appropriate amount of distilled water to fully dissolve, then transfer to a 1,000 mL volumetric flask, and finally accurately make up to 1,000 mL (Yu et al., 2011). The pH value is 8.2. This treatment group simulates a normal seawater environment that is not currently affected by significant acidification.
Seawater CO2-acidification group: Use a gas flow control system to adjust the bubbling rate of CO2 gas into seawater, so that the pH of seawater can reach 7.2 (Shangguan et al., 2024). This group simulates a scenario in which the concentration of CO2 in the atmosphere continues to rise, resulting in acidification of seawater by absorbing excess CO2.
Seawater HCl-acidification group: 1 mol/L hydrochloric acid was used to adjust the pH of seawater to 7.2. This treatment group used hydrochloric acid to adjust the pH value of seawater to simulate seawater acidification (Sun et al., 2016).
Low-salinity seawater: Dilute the prepared artificial seawater by a factor of 20 to prepare low-salinity seawater. Use NaOH to adjust the pH to 8.2. This group simulates the environment of low-salinity seawater areas such as estuaries, where salinity is significantly lower than normal seawater due to freshwater injection (Bijani et al., 2023). The study of this group can help understand the effect of salinity reduction on the adsorption of TEB by microplastics.
Batch adsorption experiments
In the adsorption experiments, a total of four treatment groups were set: seawater without acidification treatment, seawater with CO2 acidification, seawater with HCl acidification, and the low-salinity seawater without acidification treatment.
Briefly, 10 mg of microplastics were accurately weighed into 10 mL glass serum bottles, and then seawater solutions without acidification, HCl acidification, CO2 acidification, or low-salinity seawater were added, respectively. Subsequently, TEB was added at different concentrations, and 0.001 mol/L sodium azide (NaN3) was added to the flask. The total volume of liquid in each serum bottle was 10 mL, and the final concentrations of TEB were 0.5, 1, 5, 10, and 15 mg/L, respectively. Then the mixed solutions were placed into an orbital shaker (ZQLY-300V, Zhichu Instrument Co., Ltd., Shanghai, China) at 190 rpm at 25°C for 48 h. The preliminary experimental data indicated that the adsorption equilibrium of TEB on the selected microplastics could be achieved within 48 h. After 48 h, the microplastic particles were filtered through a 0.45 μm needle filter after centrifugation of the serum bottle. The concentration of TEB in the supernatant was determined by HPLC. All the adsorption experiments were conducted in triplicate. The blank group under the same conditions containing TEB without MPs was carried out.
Detection of TEB
TEB was analyzed utilizing an HPLC system (LC-16, manufactured by Shimadzu, Japan), which incorporated an SPD-10AVP UV/vis detector. Chromatographic separation was achieved using a Kromasil C18 column (dimensions: 250 × 4.6 mm internal diameter, 5 μm; supplied by Eka Chemicals, Sweden). The column was maintained at a temperature of 30°C. The mobile phase consisted of a mixture of methanol and water in a ratio of 80:20 (v/v), with a flow rate of 1 mL/min. The detection wavelength was set to 220 nm, and the injection volume was 20 μL. Quantification of TEB concentration was performed using the external standard method, employing matrix-matched calibration curves.
Data analysis
The Linear model [Eq. (1)], Langmuir model [Eq. (2)], and Freundlich model [Eq. (3)] were chosen to analyze the sorption isotherms of TEB. These models were expressed as follows:
All data were analyzed using one-way analysis of variance followed by Tukey’s post hoc test (p < 0.05) to determine significant differences among treatment groups. Confidence intervals (CIs) (95%) were calculated based on triplicate measurements to represent data variability.
Results and Discussion
Characterization of MPs
The SEM figures of six MPs are shown in Fig. 1. The surfaces of PE and PS are relatively smooth; meanwhile, PS has few surface depressions and PE contains many holes and gaps. The surface of PA contains some folds and pores, and lots of raised micropores are found on the surface of PVC. PBAT and PBS have more folded structures and rougher surfaces than other plastics.
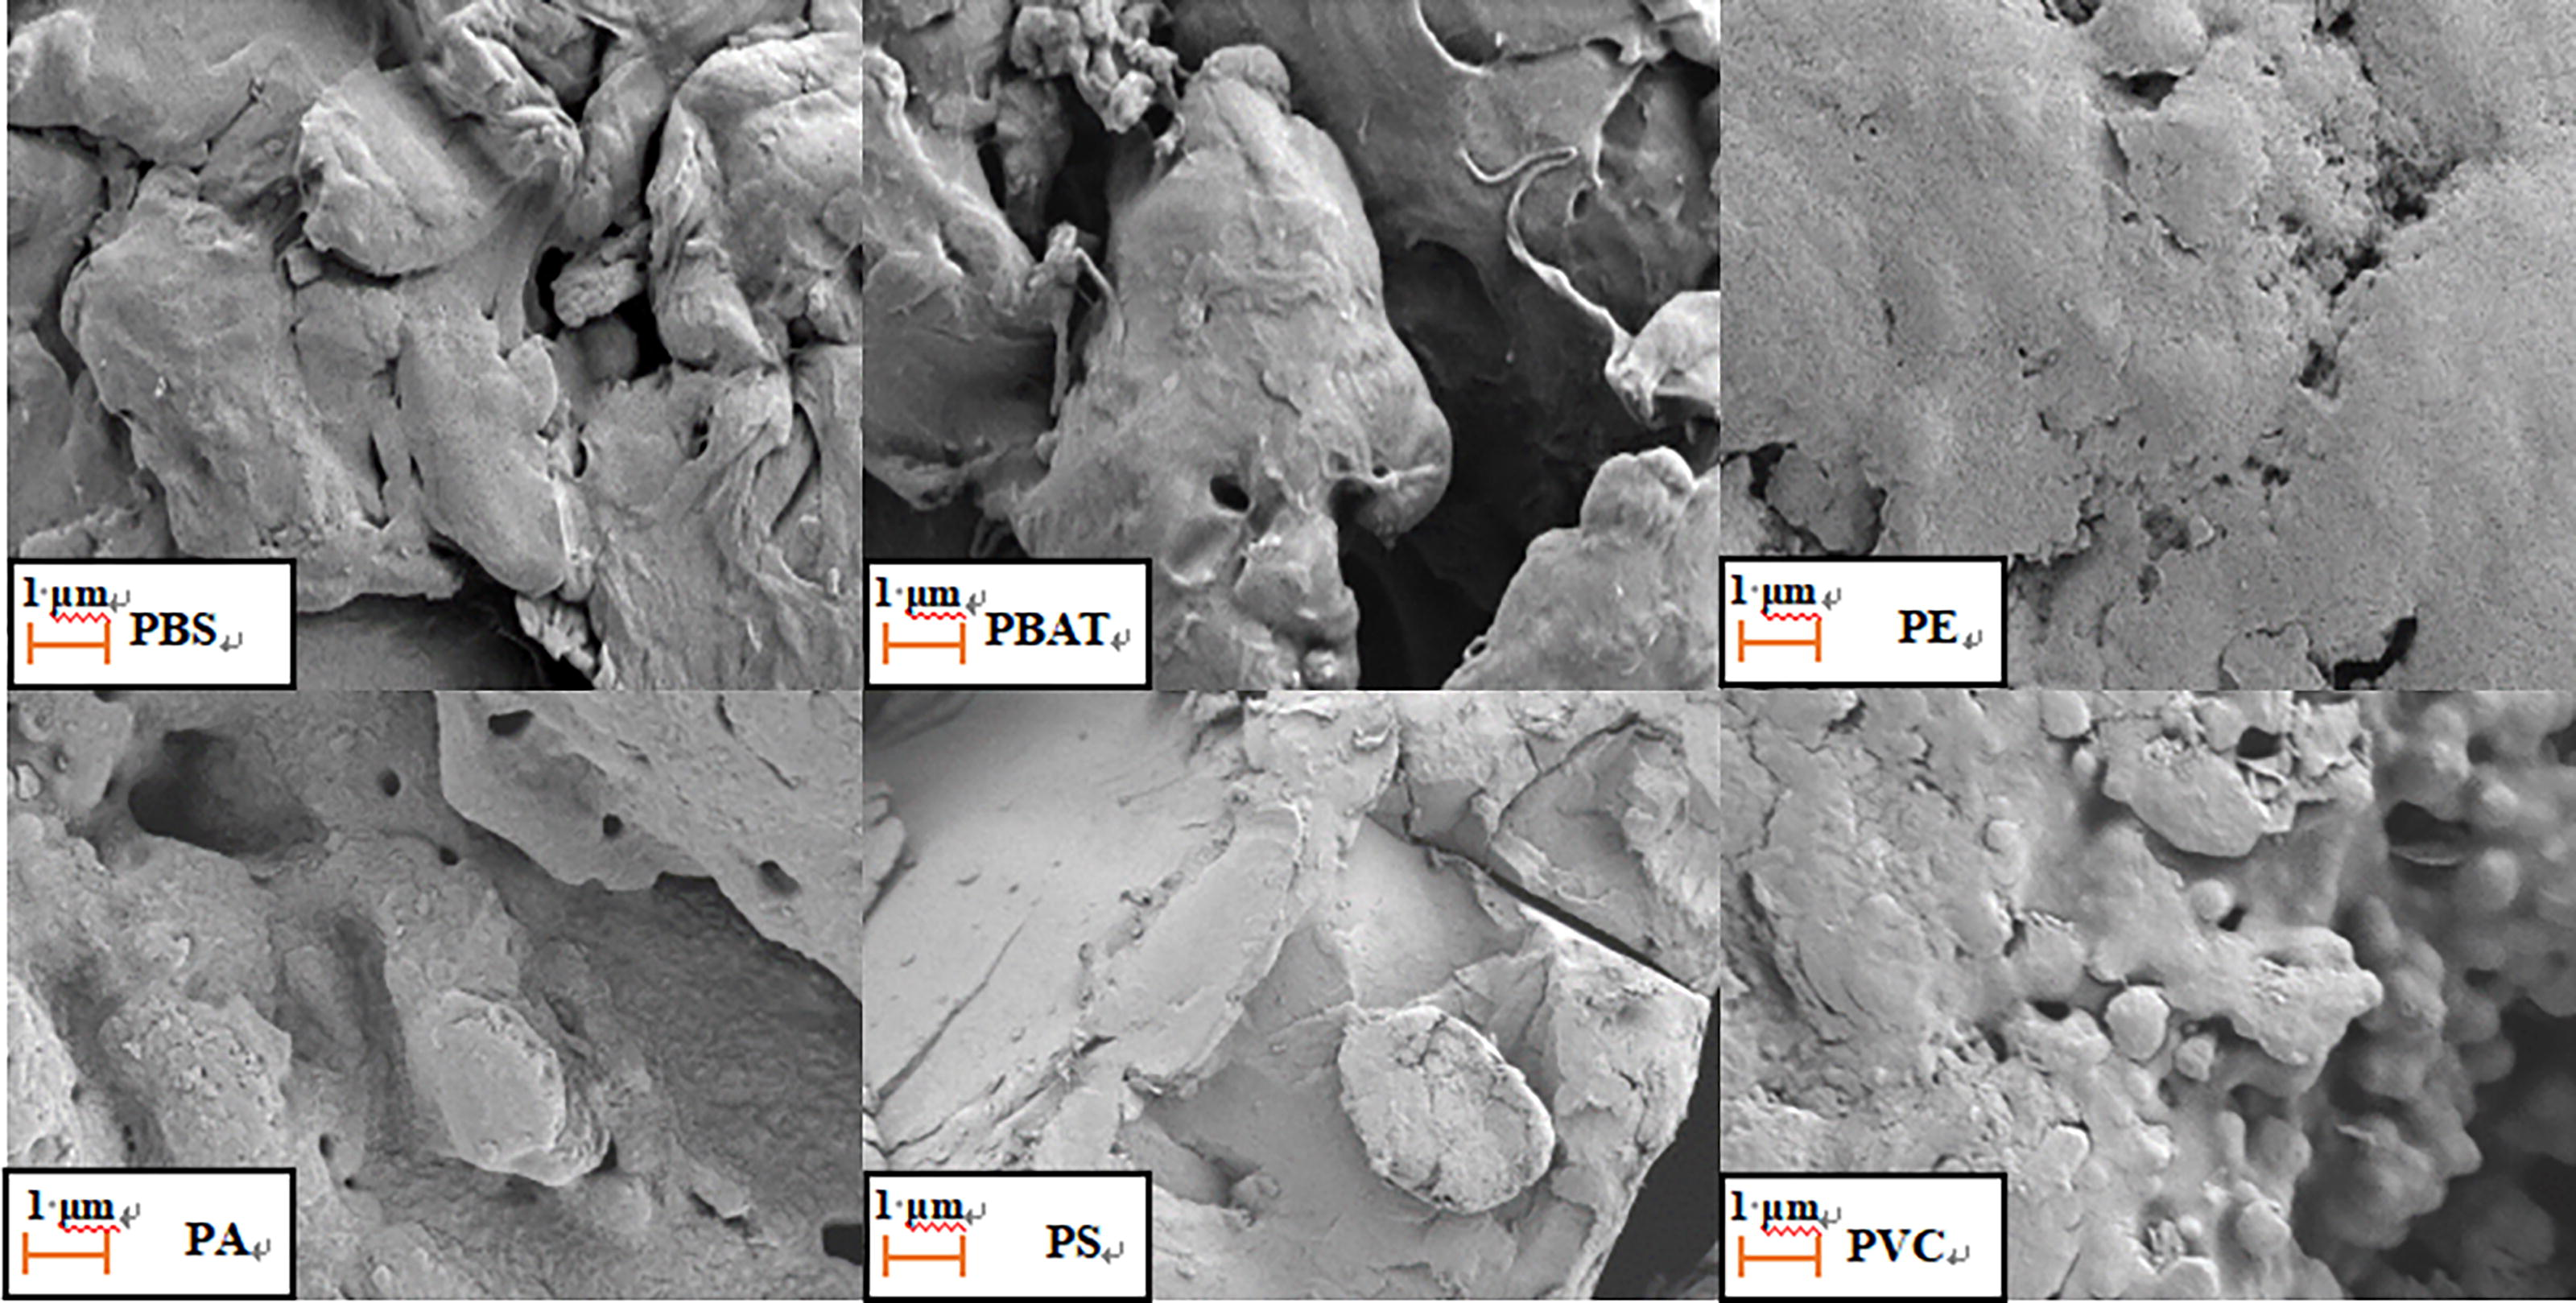
Scanning electron microscopy images of MPs.
The FTIR spectra of MPs and the characteristic peaks are shown in Fig. 2 and Supplementary Table S2. As seen in the spectra, the main infrared characteristic absorption peak of PA is at 1,634 cm−1, which is the absorption peak of the amide group (Guo and Wu, 2008). The absorption peaks of PS at 3,024 and 1,492 cm−1 were the C–H bond stretching of the benzene ring and the skeleton vibration of the benzene ring (Jung et al., 2018). The C–Cl plane vibration of PVC was caused at about 616 cm−1 (Guo and Wu, 2008; Liu et al., 2019). PE microplastics have several significant absorption peaks, which are found at 721 cm−1 (CH2 rock), 1,470 cm−1 (CH2 bend), 2,847 cm−1 (C–H stretch), and 2,919 cm−1 (C–H stretch), respectively (Jung et al., 2018). In the PBS infrared spectrum, 2,979 cm−1 is the C–H stretching vibration, 1,727 cm−1 is the region peak with the strongest carbonyl absorption, and 1,283 cm−1 is the C–O stretching vibration (Sun et al., 2022). The stretching vibration peak of the carbonyl group (−C=O) at 1,720 cm−1 is attributed to the carbonyl group on the ester bond in PBAT. The functional groups represented by the characteristic peaks (Fig. 2) at various positions are supplemented in Supplementary Table S2.
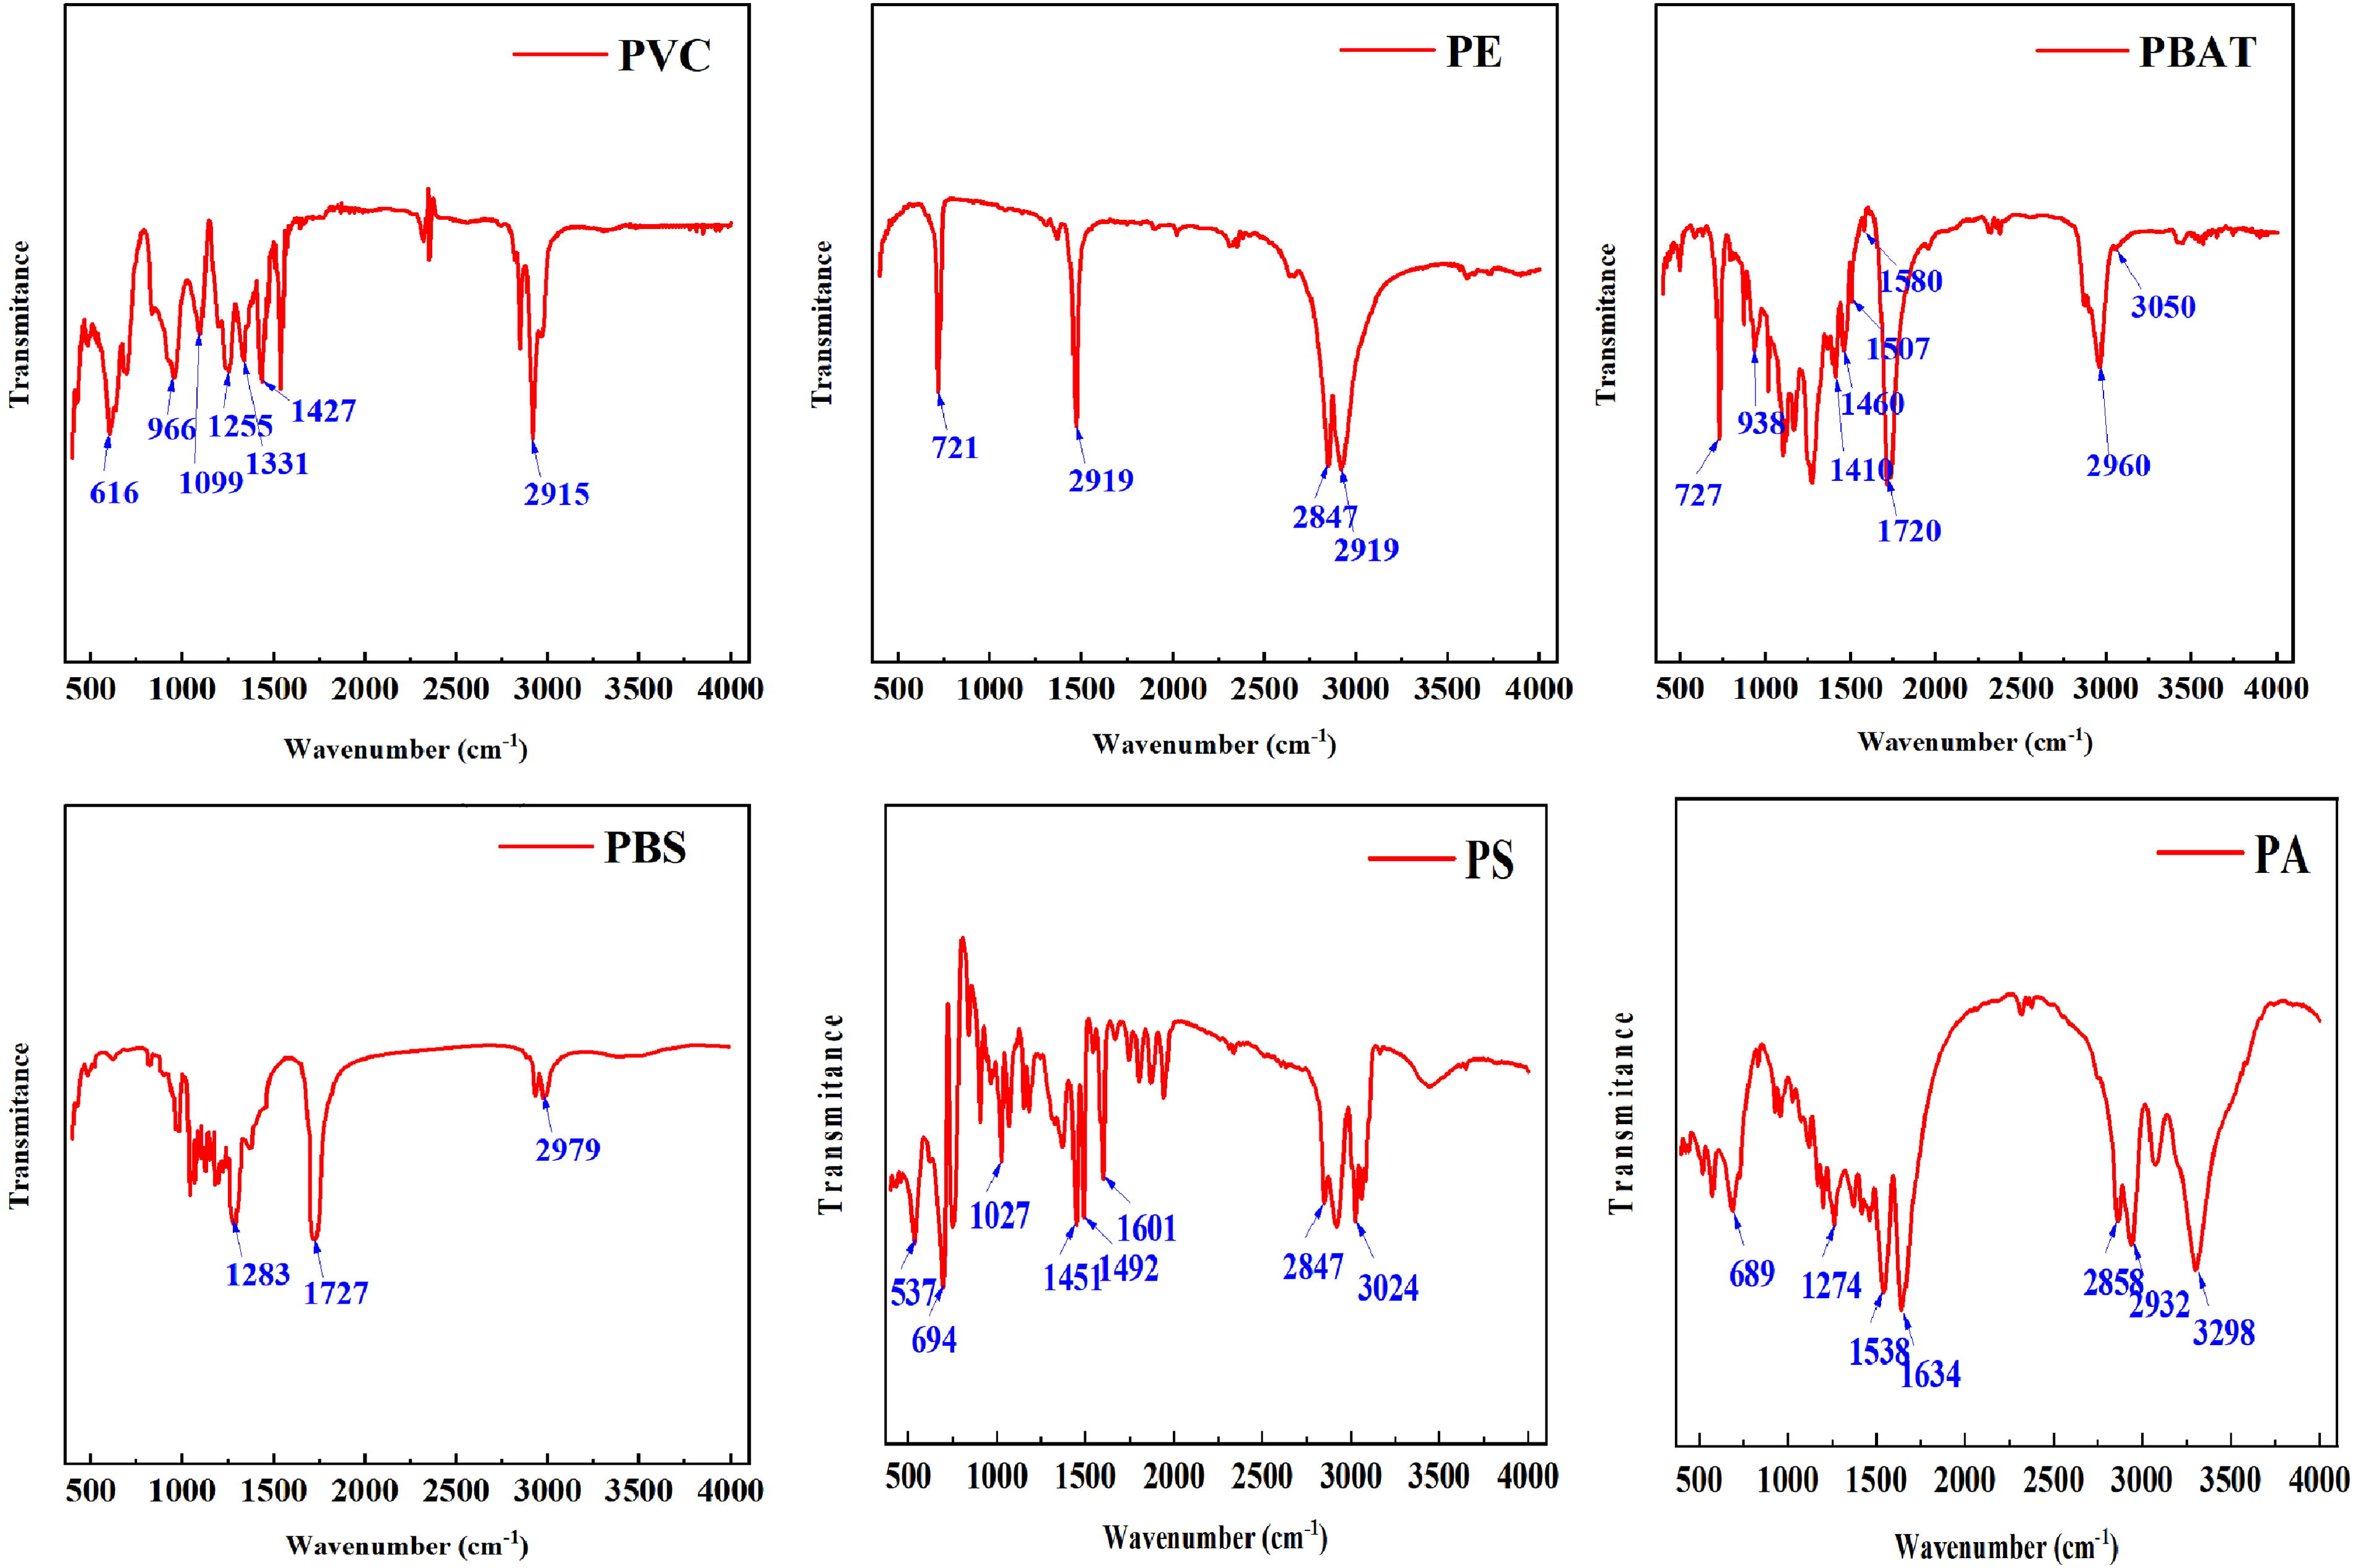
FTIR spectra of MPs. FTIR, Fourier transform infrared.
The microplastics were determined by comparison with the Shimadzu FTIR conventional library.
The values of the surface area for MPs were as follows: 0.774 m2/g for PS, 1.924 m2/g for PA, 0.275 m2/g for PE, 1.453 m2/g for PVC, 2.361 m2/g for PBAT, and 2.277 m2/g for PBS (Table 1). The zeta potentials of the MPs decreased with increasing pH, and the zeta potential was negative at the pH values from 4.0 to 11.0 (Fig. 3).
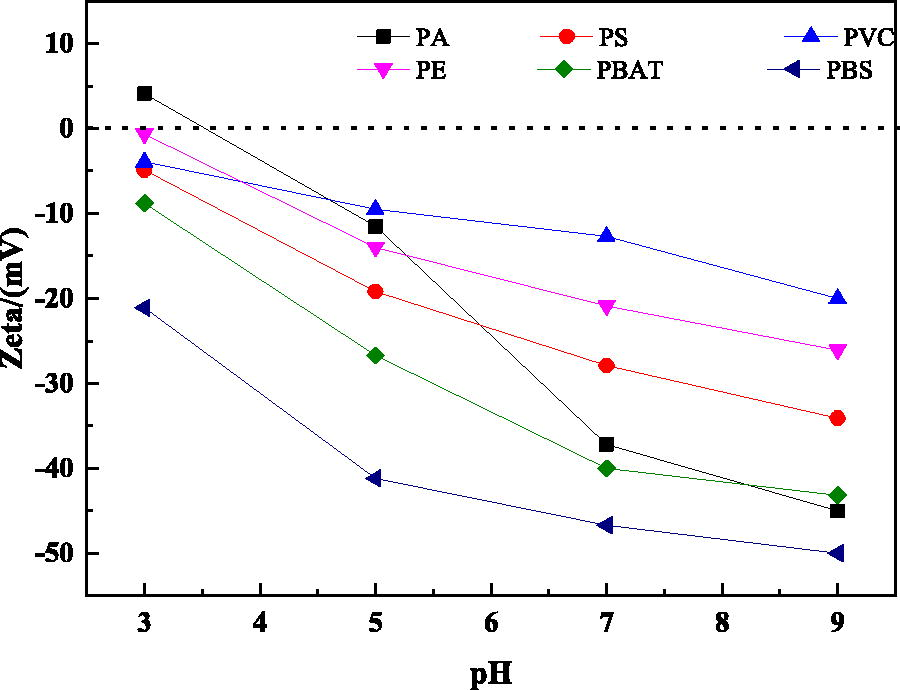
Zeta potential of MPs.
Physicochemical Properties of Microplastics
From Crawford and Quinn (2016).
From Jacquel et al. (2015).
From Lu et al. (2010).
Adsorption isotherms
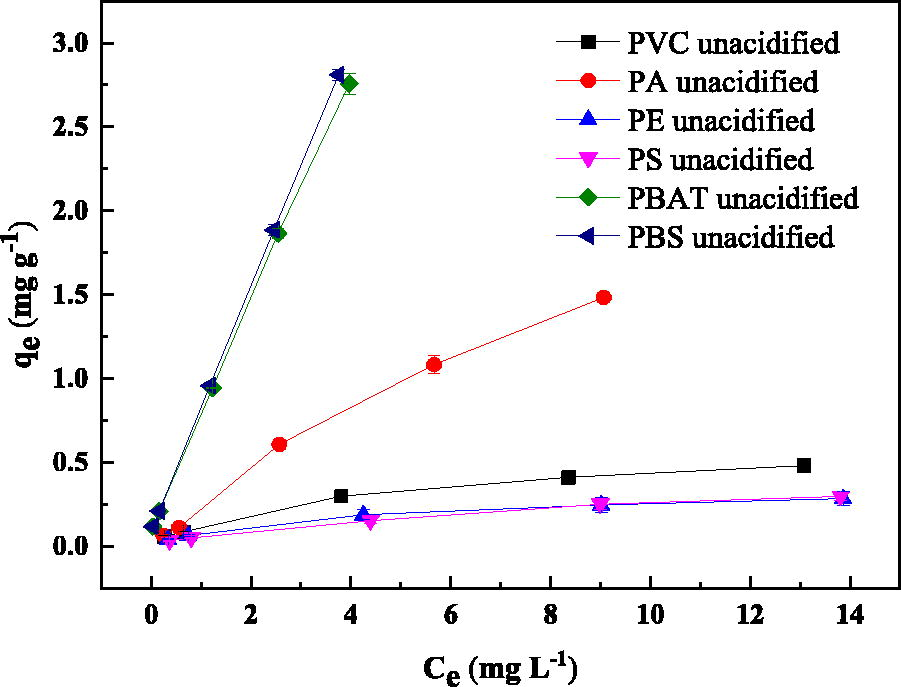
The adsorption isotherms of the six MPs at different pH (Fig. 4) were fitted with the Linear, Freundlich, and Langmuir isotherm models (Supplementary Fig. S1). The fitting parameters of R2 were applied to choose the best fitted model. Other parameters of the Linear, Langmuir, and Freundlich isotherms (
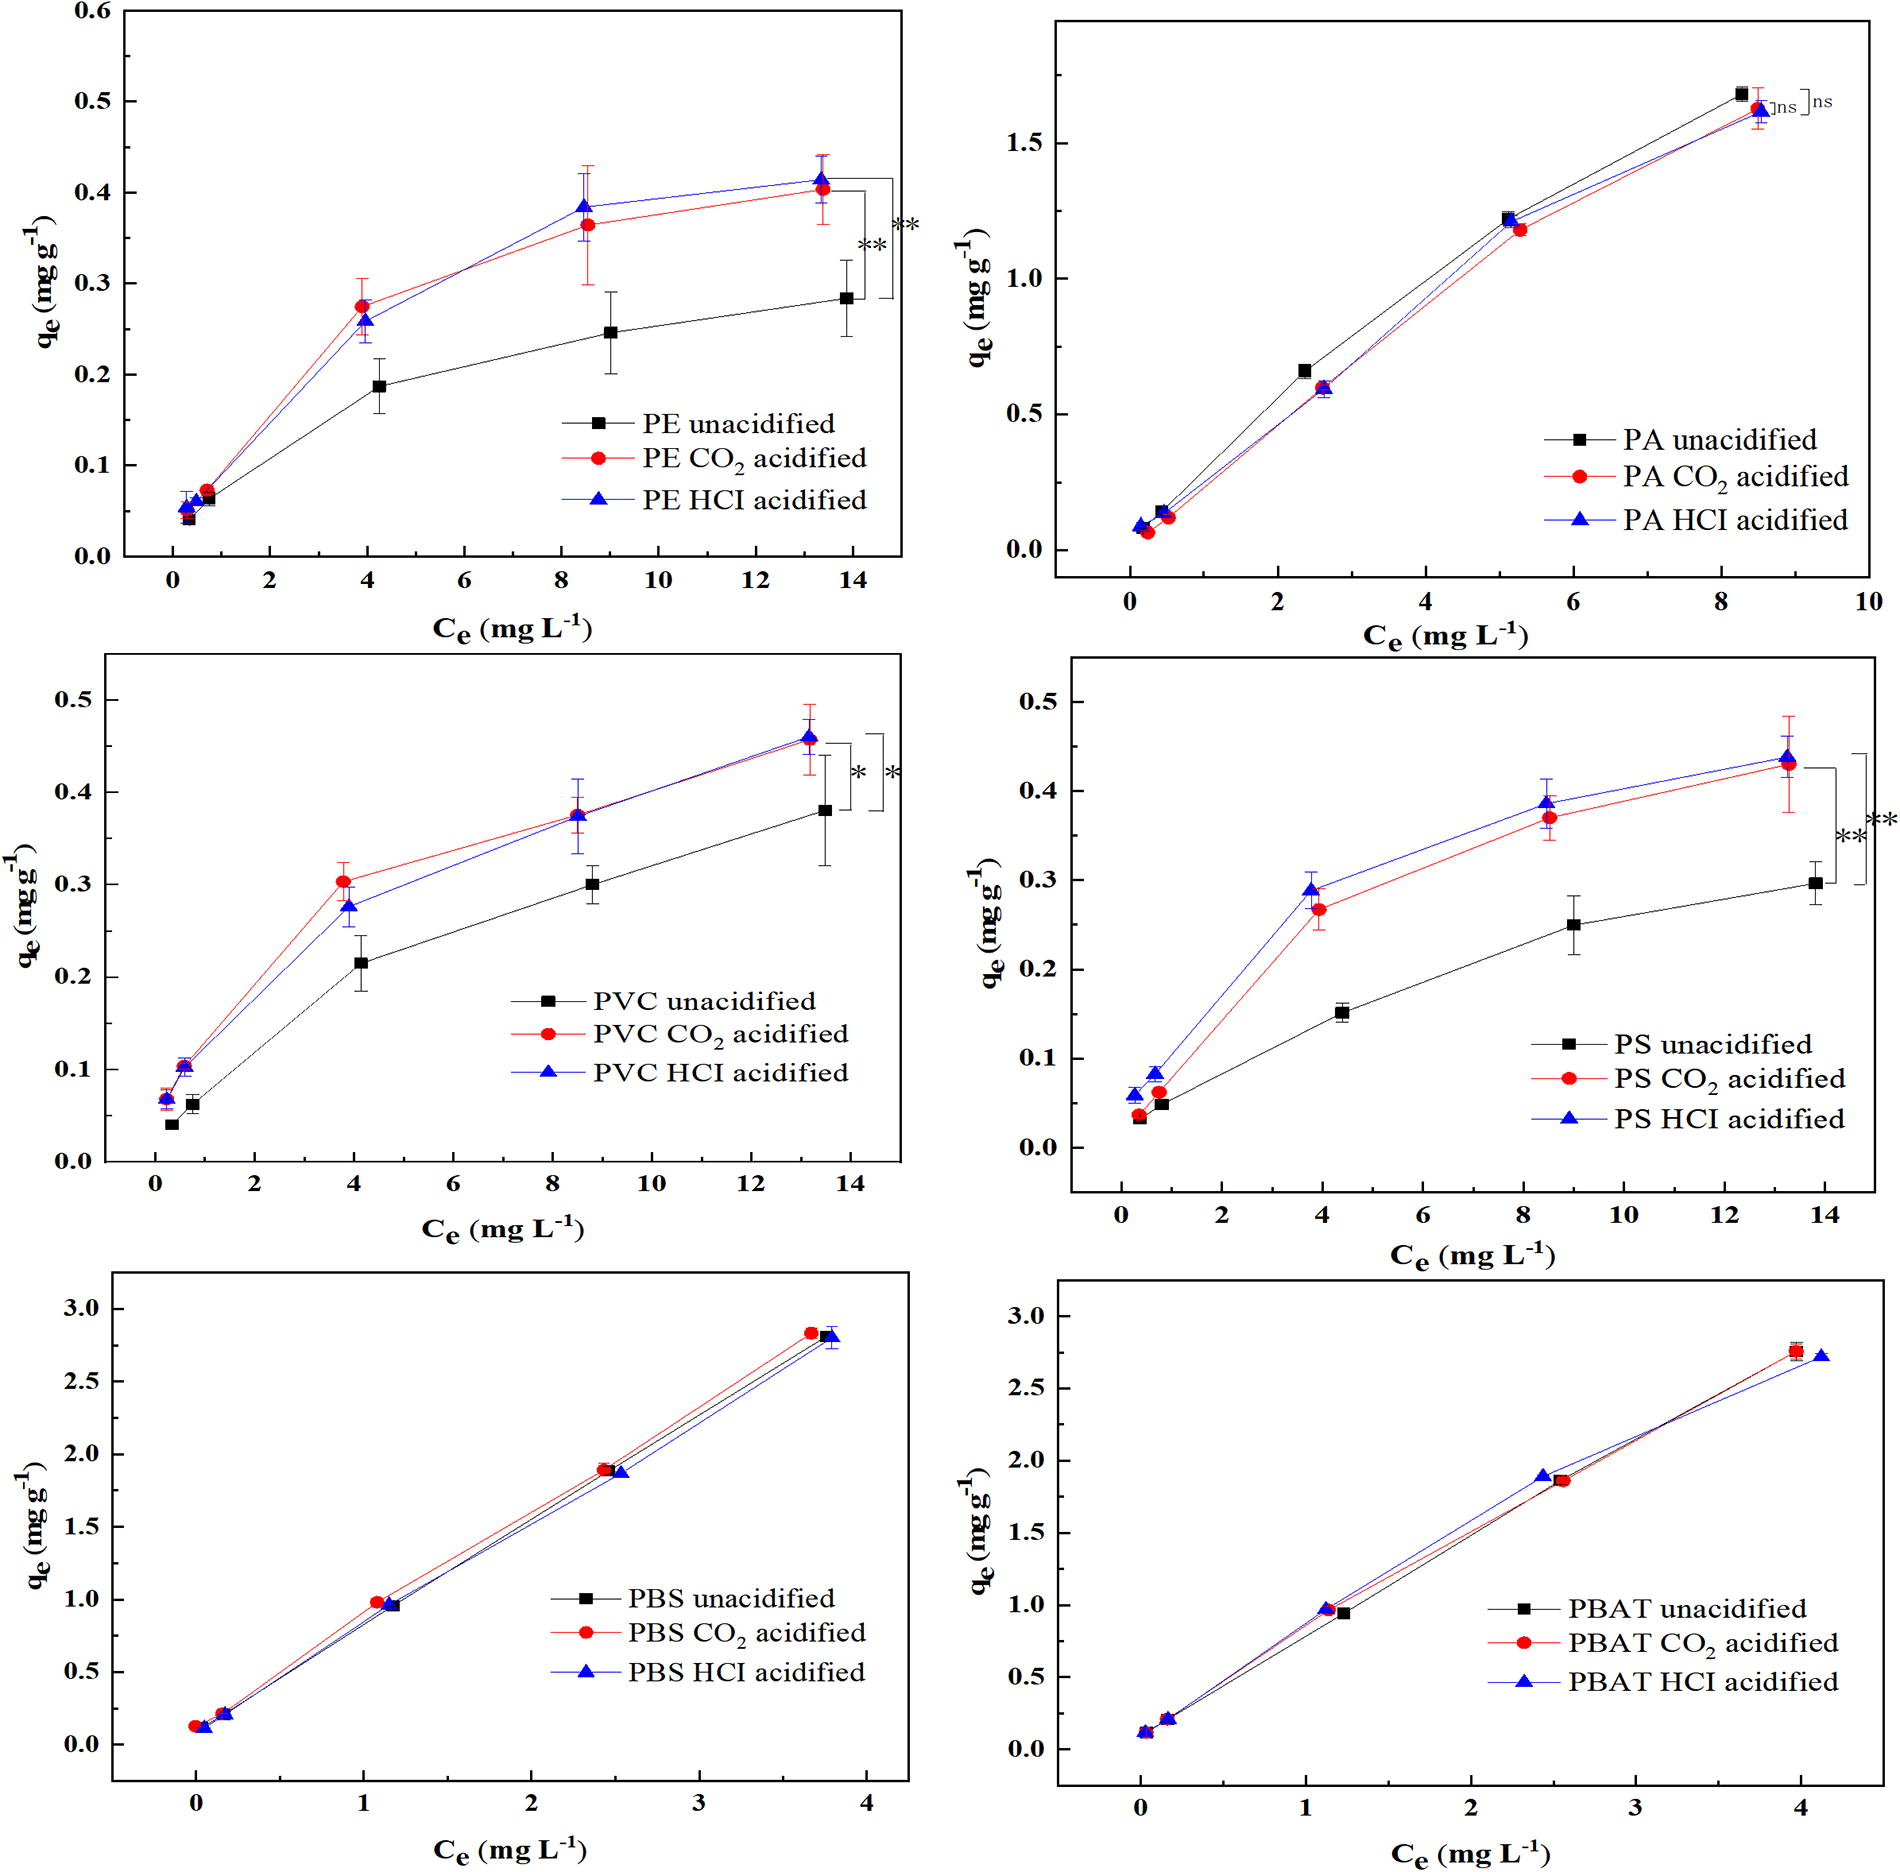
Adsorption of tebuconazole on MPs in the seawater system. *Indicates a statistically significant difference between two groups (typically p < 0.05). **Indicates a highly statistically significant difference between two groups (typically p < 0.01).
Estimated Linear, Freundlich, and Langmuir Parameters for Tebuconazole Adsorption on MPs in the Seawater System
The boldface indicates that the R2 value represented is the largest among the three models.
The Freundlich model, one of the frequently used nonlinear sorption models, involves the heterogeneity of the surface (Lee and Choi, 2018). As shown in Table 2, the 1/n values were less than 1, indicating that the six MPs satisfactorily adsorbed TEB at different pH. In this model, all the values of
The Langmuir model could also describe the nonlinear adsorption behavior in the monolayer. This model assumes that the adsorption site is constant and the energy is limited (Meghea et al., 1998). In the conventional plastics, the Qm of PA, PE, PVC, and PS were 5.9723–10.8672, 0.8401–1.9926, 3.0971–6.6803, and 1.0330–3.5300 mg/g, respectively. It was found that the sorption capacities followed the order of PA > PVC > PS > PE. The highest adsorption capacity of PA for TEB might be attributed to the formation of hydrogen bonds between PA and TEB (Endo et al., 2011; N’Diaye et al., 2012; Song et al., 2021). For the six MPs investigated in this research, the highest R2 of PS, PVC, and PE were obtained by the Langmuir model. Therefore, the Langmuir model is the most proper model for TEB adsorption on PS, PVC, and PE, and monolayer covering might be the main adsorption mechanism.
The Linear equation is the simplest adsorption model. It is more suitable to describe adsorption behavior at low solute concentrations and/or when dominated by distribution to homogeneous solids. As shown in Table 2, the R2 values for degradable MPs ranged from 0.9932 to 0.9993, which were the highest among the three models, while for nondegradable MPs, the fitted curves obviously deviated from the observed data. This indicated that the Linear model is proper for describing the adsorption behavior of TEB on degradable MPs, but not for nondegradable MPs. This could be attributed to the mass transfer driving force and a large number of adsorption sites on the degradable MPs’ surface.
Effects of microplastic properties on adsorption
Under the same conditions, the adsorption capacity of MPs for TEB varies with the types of MPs (Fig. 4). Physical and chemical characteristics of MPs like particle size, surface area, polarity, functional groups, and crystallinity may affect their adsorption capacities (Torres et al., 2021). Some studies indicated that polarity can affect the adsorption capacities of polar chemicals (Li et al., 2018; Wang et al., 2015). TEB is a polar compound (Pesticide Properties Database) and tends to be more easily adsorbed on polar MPs through polar–polar interaction. As shown in Table 1, the nonpolar MPs were PE and PS, which show low affinity to TEB. This indicated that the polarity could explain the low adsorption capacities of PE and PS. Besides, amorphous polymers have crystalline domains and/or rubbery domains, and this is determined by Tg (glass transition temperature, Tg). Polymers change from glassy polymers (below Tg) to rubbery polymers (above Tg) (Torres et al., 2021; Xu et al., 2018). Zhao et al. (2020) reported that the higher proportion of rubbery domains was associated with higher adsorption capacity. However, some research pointed out that the two had little or no correlation (Li et al., 2018; Zuo et al., 2019). As shown in Table 1, the degree of crystallinity of the six MPs followed the order: PE > PA > PBS > PBAT > PVC > PS (according to Tg). But this order was not consistent with the actual adsorption capacity of MPs, indicating that the crystallinity of MPs was not a key factor affecting the sorption behavior. The surface area of the six MPs decreased in the order of PBAT > PBS > PA > PVC > PS > PE. The adsorption isotherms indicated the adsorption capacity of MPs followed the order of PBAT ≈ PBS > PA > PVC > PS > PE. Li et al. (2019) also pointed out that the
Under the same conditions, adsorption capacities of TEB on PS were higher than those on PE. Some research indicated that aromatic TEB might be adsorbed to the benzene ring of PS through π–π interactions; thus, π–π interactions and nonspecific van der Waals interactions occurred between PS and TEB, while PE only undergoes van der Waals interactions (Qi et al., 2014; Song et al., 2021; Sun et al., 2019). Besides, the sorption capacities of PBAT and PBS to TEB are among the highest in contrast with conventional MPs. Gong et al. (2019) pointed out that the carboxylate oxygens in PBS and PLA (polylactic acid) may form hydrogen bonds with fipronil, which were stronger than the π–π interactions and hydrophobic interactions between the fipronil and conventional MPs (PE, PVC, PS, and PP). Therefore, further in-depth assessment of the potential risks of degradable plastics as pollutant carriers in agricultural runoff and the marine environment is needed to avoid equating “degradable” with “environmental safety.” Among the nondegradable MPs, PA had a higher sorption capacity than others, which can be attributed to the functional groups (i.e., amide group). The amide group could form hydrogen bonds with hydrogen-donor chemicals, thus enhancing the sorption capacity (Endo et al., 2011; Torres et al., 2021).
Effect of salinity on adsorption
Marine systems contain high concentrations of salt. Numerous studies have demonstrated that the difference in salinity between seawater and freshwater can markedly affect the environmental behavior of organic pollutants (Zuo et al., 2019). In this section, the adsorption of TEB by microplastics in artificial seawater and low-salinity seawater is compared with explore the effect of salt concentration on adsorption. The results of the tests assessing the effect of the salinity on the sorption behaviors are shown in Figs. 4 and 5. The fitted curves for the Linear, Langmuir, and Freundlich isotherms are presented in Supplementary Figs. S1 and Figs. S2, and the corresponding parameters are in Tables 2 and 3.
Adsorption of tebuconazole on MPs in low-salinity seawater system.
Estimated Linear, Freundlich, and Langmuir Parameters for Tebuconazole Adsorption on MPs in Low-Salinity Seawater System
The boldface indicates that the R2 value represented is the largest among the three models.
For PA, PBAT, and PBS, with the increase in salt concentration, the adsorption amount also increases. This increase can be attributed to two primary factors: First, with the increase of salt concentration, the salting-out effect will be enhanced, which may lead to changes in the physical and chemical properties of organic matter in the microplastic PA and aqueous solution mixture. This change makes it easier for organic matter to be adsorbed onto microplastics (Mejías et al., 2023). Second, Sodium Chloride (NaCl) may partially neutralize the negative surface charge of MPs, thereby diminishing the electrostatic interactions between TEB and MPs (Ma et al., 2019). Besides, at high salt concentrations, high ionic strength in seawater can enhance dipole–dipole and dipole–induced dipole interactions in the system, which contributes to the formation of hydrogen bonds (Li et al., 2020).
For PS, PVC, and PE, the sorption trend was consistent, which was decreased with the salinity increased. This might be due to Na+ competing with TEB on the sorption site of the MPs, which affects TEB adsorption (Zhang et al., 2018).
Effect of acidification on adsorption
The effect of solution acidification on TEB adsorption in seawater is investigated in this study (Fig. 4).
For nondegradable MPs PS, PVC, and PE, the effect of solution acidification displayed a similar trend in that the sorption capacity increased after acidification in seawater. That is, the adsorption capacity of the HCl-acidified and CO2-acidified groups was significantly higher than that of the unacidified group. Meantime, the HCl-acidification and CO2-acidification groups had no significant differences (p > 0.05). For example, when the concentrations of TEB were 0.5, 1, 5, 10, and 15 mg/L, the amounts of TEB adsorbed by PE in nonacidified seawater environments were 0.040 ± 0.005, 0.062 ± 0.009, 0.215 ± 0.033, 0.300 ± 0.042, and 0.381 ± 0.037 mg/g, respectively. In CO2-acidified seawater environments, the adsorbed amounts by PE increased to 0.670 ± 0.034, 0.104 ± 0.010, 0.303 ± 0.023, 0.376 ± 0.048, and 0.457 ± 0.052 (mean ±95% CI) mg/g, respectively. In HCl-acidified seawater environments, the adsorption capacities of PE were 0.068 ± 0.035, 0.102 ± 0.037, 0.277 ± 0.042, 0.374 ± 0.025, and 0.460 ± 0.050 mg/g, respectively.
The pH value primarily affects the sorption capacity by altering the degree of dissociation of TEB and the surface potential of microplastics. TEB is hydrophobic and ionizable, with a pKa value of 5.03 at 25°C. When pH > pKa, TEB exists as a negatively charged anion, whereas when pH < pKa, it primarily exists in solution in its molecular form. Thus, for TEB, a higher pH leads to a stronger degree of dissociation, resulting in an increase in negatively charged TEB. The surface potential of PS, PVC, and PE is negatively charged under the experimental pH values, and its negative charge intensity increases with rising pH. Therefore, as the pH increases, the hydrogen bonding between microplastics and TEB weakens, while electrostatic repulsion enhances, ultimately inhibiting sorption. The results indicate that electrostatic interaction is the primary mechanism underlying the adsorption behavior of PS, PVC, and PE (Guo et al., 2018, 2019). For PA, there was no significant difference in sorption capacity before and after acidification (p > 0.05), which may be due to the fact that the sorption of TEB by PA microplastics could be the result of a combined effect of hydrogen bonding, hydrophobic forces, intermolecular forces, electrostatic forces, and other interactions.
For degradable MPs PBAT and PBS, within the pH range of 7.3–8.2, no significant changes were observed in the adsorption capacities in seawater, indicating that hydrophobic and electrostatic interactions have minimal effects on the adsorption of TEB by PBS and PBAT. Instead, the adsorption of TEB by PBS and PBAT primarily relies on hydrogen bonding. Compared with nondegradable microplastics, PBS and PBAT possess a more abundant presence of oxygen-containing functional groups (C=O), which can enhance hydrogen bonding interactions. Consequently, the extent to which aged PBS and PBAT are influenced by pH is relatively smaller.
The statistical analysis revealed that the differences in adsorption capacities between acidified and nonacidified groups (e.g., PE and PVC) were statistically significant (p < 0.05), supporting the hypothesis that pH-driven changes in surface charge directly influence TEB adsorption. In the high CO2 emission areas (such as industrial coasts and estuaries), microplastic–pesticide combined pollution should be intensively monitored, and acid-sensitive plastics (such as PE/PS) should be preferentially detected.
Conclusion
This study comprehensively analyzes the adsorption behavior of TEB on various microplastic materials under different environmental conditions, including seawater acidification. Results show that degradable microplastics (e.g., PBAT, PBS) exhibit higher adsorption capacities due to oxygen-containing functional groups facilitating hydrogen bonding, while nondegradable plastics like PA adsorb TEB significantly via hydrogen bonding and other interactions. Salinity impacts adsorption differently: adsorption on PA, PBAT, and PBS increases with salt concentration, likely due to salting-out effects and partial neutralization of microplastic surface negative charges by NaCl. In contrast, adsorption on PS, PVC, and PE decreases with salinity, possibly from Na+ competing with TEB for adsorption sites. Acidification (via CO2 or HCl) generally enhances adsorption on nondegradable microplastics, while degradables show more stable adsorption under pH shifts due to dominant hydrogen bonding. These findings reveal that ocean acidification may exacerbate environmental risks of polar pesticides by strengthening their binding to nondegradable microplastics through electrostatic mechanisms, highlighting the need for material-specific risk assessments.
Footnotes
Authors' Contributions
N.C.: Conceptualization, data curation, formal analysis, investigation, methodology, software, visualization, writing—original draft, writing—review and editing. P.W.: Conceptualization, data curation, formal analysis, investigation, writing—original draft. J.S.: Conceptualization, data curation, formal analysis, funding acquisition, investigation, methodology, project administration, resources, supervision, validation, visualization, writing—original draft, writing—review and editing.
Author Disclosure Statement
The authors have no conflicts to disclose.
Funding Information
This work is supported by the Scientific Research Plan Projects of Shaanxi Education Department (Grant no. 23JK0627), the Initiation Funds for High-Level Talents Program of Xi’an International University (Grant no. XAIU202103), and the Xi’an Association for Science and Technology 2025 Youth Talents Lifting Plan Project (Grant no. 0959202513171).

References
Supplementary Material
Please find the following supplemental material available below.
For Open Access articles published under a Creative Commons License, all supplemental material carries the same license as the article it is associated with.
For non-Open Access articles published, all supplemental material carries a non-exclusive license, and permission requests for re-use of supplemental material or any part of supplemental material shall be sent directly to the copyright owner as specified in the copyright notice associated with the article.
