
Abstract
Although combining methods is nothing new, more contributions about why and how to mix methods for validation purposes are needed. This article presents a case of validating the inferences drawn from the Participatory Evaluation Measurement Instrument, an instrument that purports to measure stakeholder participation in evaluation. Although the process was intended to be almost exclusively quantitative, one of its components unexpectedly turned into a mixed methods study. This, in turn, spurred on a cycle of instrument revision and further quantitative validation. Whereas the validation evidence is modest and tentative, it suggests that the revised version of the Participatory Evaluation Measurement Instrument offers a better fit with the respondents’ opinions regarding the participation level of selected evaluation cases. The article concludes with a brief discussion on the added value of mixed methods for validation purposes.
Keywords
Mixed Methods for Validation Purposes
Although collecting quantitative and qualitative data within the same study is nothing new, their meaningful integration into an explicit and coherent research methodology is a relatively novel research practice (Creswell & Plano Clark, 2007; but see Creswell, 2011). Indeed, mixed methods research has only established itself recently as a distinct field of research, some would even say paradigm, on an equal footing with qualitative and quantitative research (Johnson, Onwuegbuzie, & Turner, 2007; Small, 2011). The following definition, based on a review of definitions from leaders in the field, clearly highlights that mixed methods research is much more than the mere collection of quantitative and qualitative data within the same study: Mixed methods research is the type of research in which a researcher or team of researchers combines elements of qualitative and quantitative research approaches (e.g., use of qualitative and quantitative viewpoints, data collection, analysis, inference techniques) for the broad purposes of breadth and depth of understanding and corroboration. (Johnson et al., 2007, p. 123)
Whereas there is still no consensus on the precise boundaries of the concept of mixed methods (e.g., is mixing different research paradigms possible?, see Creswell, 2011), the preceding definition conveys our own pragmatic perspective on mixed methods research. According to this definition, mixed methods validation requires the combination of qualitative and quantitative approaches for assessing the reliability and validity of the inferences derived from measurement instruments. Thus, even though “Campbell and Fiske (1959) are rightfully credited as being the first to explicitly show how to use multiple research methods for validation purposes” (Johnson et al., 2007, p. 114), their research orientation was first and foremost quantitative. In other words, qualitative data were only granted an auxiliary role. Indeed, in the psychometric and measurement literature, construct validation is often conceived as a largely quantitative endeavor. In this tradition, the role of qualitative methods is usually limited to instrument development or in assessing the cultural equivalence of items (e.g., see Curry, Nembhard, & Bradley, 2009). Some have even questioned the appropriateness of the use of a mixed methods label for scale development and validation as the former generally involves the use of qualitative data, whereas the latter relies on quantitative data (Creswell, 2011). In that case, however, mixing methods does not appear as a self-conscious decision and the extent to which methods are really integrated is debatable.
In contrast, many of the recent empirical studies that have combined qualitative and quantitative research for validation purposes are explicitly grounded in the mixed methods perspective and have therefore granted a larger place to qualitative research (e.g., Arnon & Reichel, 2009; Durham, Tan, & White, 2011). Assessing the validity and fidelity of inferences drawn from measurement instruments is a common rationale advocated by researchers for using mixed methods (Collins, Onwuegbuzie, & Sutton, 2006). For instance, Latcheva (2009) has mixed factor analysis (quantitative) with cognitive interviewing (qualitative) to validate the inferences derived from a survey that purport to measure national identity. The rationale for combining different types of research in Latcheva’s case was triangulation to achieve greater confidence about construct validity. Mixed methods validation has even been used in experimental settings in which the quantitative research approach is exclusive or, at least, dominant. For example, Spillane et al. (2010) have used mixed methods to help validate inferences generated by a measurement instrument in a randomized controlled trial setting. Mixing data, notably by “qualitizing” quantitative data and by “quantitizing” qualitative data, allowed Spillane and his colleagues to tackle the challenges posed by random assignment and treatment integrity. Others have argued in favor of using qualitative methods alongside more traditional quantitative techniques to “document and understand the context and human interactions associated with item and test development” (Secolsky, Wentland, & Dennison, 2011, p. 1305).
However, despite a growing literature on the topic, mixed methods validation has been described as an underdeveloped subfield: “. . . clearly, more publications are needed that outline explicitly ways of optimizing the development of instruments by mixing qualitative and quantitative techniques” (Onwuegbuzie, Bustamante, & Nelson, 2010, pp. 57-58). Philosophical and practical obstacles are indeed credited for having hindered the development of mixed methods for validation purposes (Luyt, 2011). Despite these difficulties, a few theoretical frameworks have been proposed to help mixed methods researchers in their validation endeavors (Dellinger & Leech, 2007; Luyt, 2011; Onwuegbuzie et al., 2010). For instance, Dellinger and Leech (2007) have proposed a unified validation framework for mixed methods research. However, we remain somewhat unconvinced by the value of creating new validity criteria in a domain that is already overwhelmed by a plethora of different concepts and terms. Beyond the particular terms used to talk about validation and validity, we favor—as pragmatists—a unified concept of validity that spans across research traditions.
The specific guidance offered by Luyt (2011) and Onwuegbuzie et al. (2010) about how to conduct mixed methods validation was, in contrast, a much-needed contribution. Both frameworks consider the validation process as made of a number of steps (phases or stages) that are linked together by a cyclical logic. Although both frameworks remain quite open in terms of the particular validation procedures to be used at each step, they serve to guide and structure the validation process. The Instrument Development and Construct Validation developed by Onwuegbuzie et al. (2010) contains 10 phases:
Conceptualize the construct of interest
Identify and describe behaviors that underlie the construct
Develop initial instrument
Pilot-test initial instrument
Design and field-test revised instrument
Validate revised instrument: Quantitative analysis phase
Validate revised instrument: Qualitative analysis phase
Validate revised instrument: Mixed analysis phase: Qualitative-dominant crossover analyses
Validate revised instrument: Mixed analysis phase: Quantitative-dominant crossover analyses
Evaluate the instrument development/construct evaluation process and product
The framework proposed by Luyt (2011) builds on Adcock and Collier (2001) and contains three interrelated stages: (a) measurement development (i.e., concept definition and operationalization), (b) measurement validation (i.e., assessing the extent to which the scores derived from the measurement instrument are meaningfully related to the concept), and (c) measurement revision (i.e., limited alterations and extensions to the concept based on the results of the second stage).
The validation frameworks by Onwuegbuzie et al. (2010) and Luyt (2011) can be used prescriptively (i.e., they can guide researchers through the validation process), but their analytical and heuristic value should not be underestimated. Indeed, they can be used to generate new insights about the validation process. These frameworks will therefore be used to illustrate the process followed in a research program aimed at developing a sound conceptualization and measurement instrument of participatory evaluation (see Table 1). References to these frameworks will occasionally be made in the text to provide readers with a point of comparison with respect to the steps followed in this validation study.
Use of Different Frameworks to Illustrate the Steps of a Research Program on Participatory Evaluation.
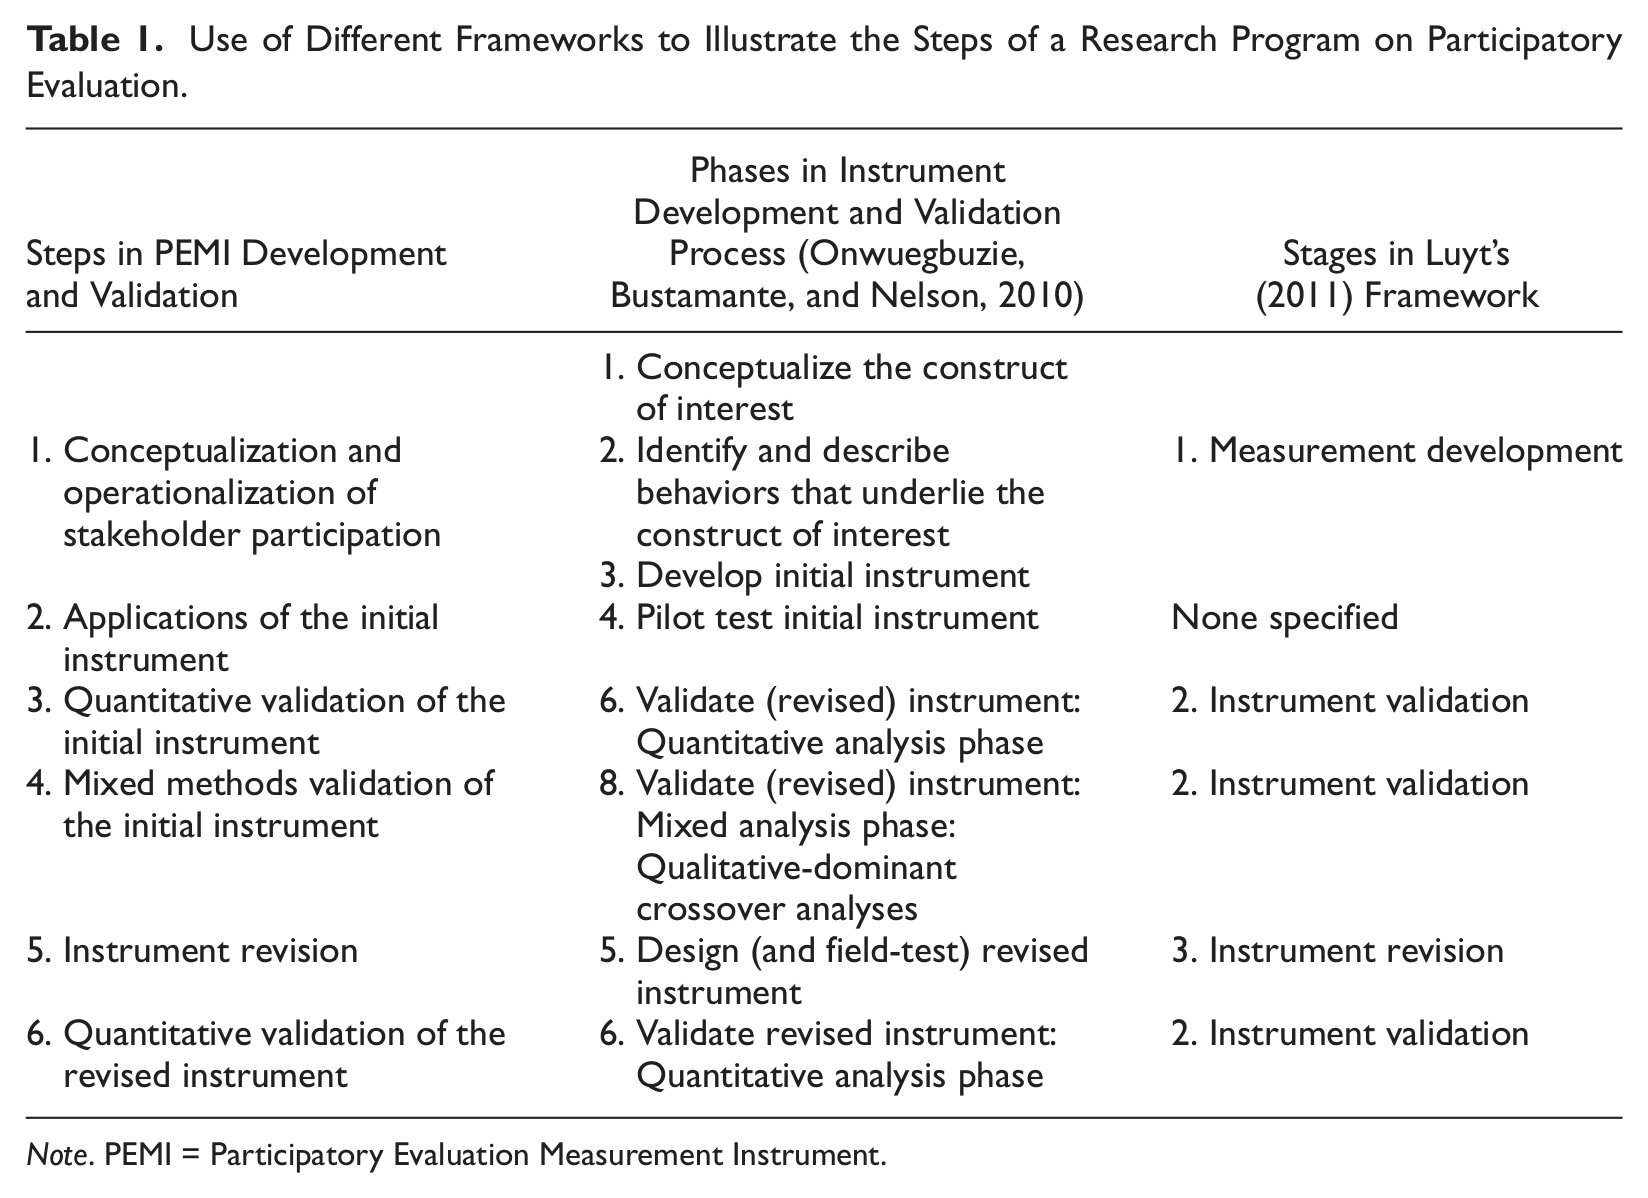
Note. PEMI = Participatory Evaluation Measurement Instrument.
Research Purpose
This article presents a case of empirical validation of the inferences generated by an instrument that purports to measure stakeholder participation in evaluation, namely the Participatory Evaluation Measurement Instrument (PEMI). The validation process was intended to be conducted almost exclusively within the quantitative, postpositivist research “paradigm” (see Johnson et al., 2007) and included procedures such as intercoder reliability analysis and convergent validation. However, a significant part of it—that is, open-ended comments and informal e-mail correspondence related to a participation score derived from respondents’ answers to a survey—unexpectedly turned into a mixed methods study. Indeed, the unexpected richness of the qualitative data has spurred on an unplanned cycle of thematic analysis, instrument revision, and further quantitative analysis. The purpose of this article is twofold. First, it reports substantive results pertaining to the validity of the inferences derived from the PEMI and proposes a revised version of this instrument that appears more in line with the data. Second, it shows and discusses how mixed methods research can play an unexpected but valuable role in a research program aimed at validating the inferences derived from a measurement instrument.
The Research Process: Phases, Methods, and Results
Conceptualization and Operationalization of Stakeholder Participation
In the field of program evaluation, participatory approaches such as utilization-focused, empowerment and democratic evaluation are clearly on the rise (see, e.g., Mark, 2001). The downside of this period of expansion is that the concept has been used inconsistently by theorists, researchers, and practitioners (Daigneault & Jacob, 2009). The meaning of participation is ambiguous, the terms used to designate it are multiplying and, in practice, the demarcation line between participatory and nonparticipatory evaluation is frequently blurred.
To remedy the lack of consistent conceptualization of participation, Daigneault and Jacob (2009) have proposed a “mixed methods conceptualization” of stakeholder participation which draws on and adapts the Cousins and Whitmore (1998) framework. The latter distinguished between forms of collaborative inquiry—including participatory evaluation—using three process dimensions: stakeholder selection for participation, depth of participation, and control of the evaluation process. The revised conceptualization was developed in two stages. First, the structure of the Cousins and Whitmore framework was improved and operationalized using the qualitative tools of classical logic (i.e., necessary and sufficient conditions) and the quantitative tools of fuzzy logic (i.e., quantification of membership to sets which represent constitutive dimensions and the concept itself; see Goertz, 2006) and a set of criteria for assessing concepts (Gerring, 1999). Second, an argument based on a qualitative literature review on stakeholder participation was developed to demonstrate the value of the new conceptualization of stakeholder participation/participatory evaluation.
The conceptualization developed by Daigneault and Jacob (2009) was operationalized in an instrument in which stakeholder participation is measured on an ordinal scale (.00 = no participation, .25 = limited participation, .50 = moderate participation, .75 = substantial participation, 1.00 = full participation). Two ideal types were also proposed for the negative and positive ends of the continuum, namely technocratic evaluation and self-managed democratic evaluation. A similar five-point scale was used to measure each of the three constitutive dimensions of participation: diversity of participants (i.e., Which nonevaluative stakeholders are involved in the evaluation?), extent of involvement (i.e., At which steps of the evaluation process does involvement occur?), and control of the evaluation process (i.e., What is the distribution of power between the evaluator and stakeholders?). Whereas the coding of the last dimension involves a subjective judgment as to the respective level of control of evaluators and participants, the other two dimensions’ scores are each determined by four dichotomous indicators. These indicators measure the presence/absence of four types of participating stakeholders and involvement/noninvolvement in four steps of the evaluation process. Since each of these dimensions is considered necessary to the concept of participation, the overall level of participation of an evaluation is determined by the dimensions’ minimum score (i.e., the lowest score; Goertz, 2006). For instance, if an evaluation is attributed a score of 1.00 for both diversity of participants and extent of involvement, as well as .00 for control, it is considered nonparticipatory (i.e., it has a score of .00 for the overall level of participation).
It is important to stress that this conceptualization/instrument does not have a normative orientation. It is a “neutral” instrument in the sense that empirical researchers can use it to test various hypotheses involving stakeholder participation. For instance, the instrument can be used to test the relationship between participation and various “negative” outcomes such as increased conflict between stakeholders or an evaluation of lower methodological quality. As such, the instrument neither favors nor opposes stakeholder participation.
The approach adopted during this conceptualization phase seems closer to Luyt (2011) than Onwuegbuzie et al. (2010). Although the language used differed, the steps involved in the conceptualization and operationalization of the stakeholder participation concept are similar to those prescribed by Adcock and Collier (2001, as cited in Luyt, 2011).
Applications of the Initial Instrument
The conceptualization developed by Daigneault and Jacob (2009) appears to rest on solid theoretical foundations and gave birth to a few promising applications (e.g., at the time of study: Connors & Magilvy, 2011; Jacob, Ouvrard & Bélanger, 2011; Laudon, 2010; e.g., at the time of going to press: Burford et al., 2013; Jacob & Desautels, 2013; Pietiläinen, 2012). Although not specifically intended for that purpose, these applications are somewhat equivalent to an informal, qualitative, pilot test of the initial instrument (see Table 1). The commonalities between these applications and the formal pilot test described by Onwuegbuzie et al. (2010) should not be overstated, however, as it involved no systematic effort aimed at empirical validation. Because this “step” generated exclusively positive comments about the instrument (see Connors & Magilvy, 2011), no need for instrument revision was felt. It was thus decided that the authors would pursue a full-scale quantitative validation of the inference derived from Daigneault and Jacob’s framework.
Quantitative Validation of the Initial Instrument
The next logical step was to assess whether the PEMI could produce reliable and valid inferences related to the concept of stakeholder participation. This was done by Daigneault, Jacob and Tremblay (2012) using a purposive sample of evaluation cases displaying various levels of participation published in peer-reviewed journals identified through a literature review. Relying on the secondary data contained in published material instead of primary data meant that data were easily accessible and in a convenient format for assessing intercoder reliability. In addition, it facilitated case selection on the basis of the following criteria: (a) sufficient information in articles about the evaluation process to allow for scoring, (b) diversity in terms of the theoretical approach used and the level of stakeholder participation (assessed informally), (c) authors’ contact information was available or could be easily be obtained. Other considerations for case selection included diversity in terms of policy domains, origins of authors, and journals. In addition, cases were rather diverse from a theoretical perspective with respect to their approach to evaluation and stakeholder involvement: labels such as participatory, collaborative, empowerment, stakeholder-based, utilization-focused, democratic-deliberative, community-based, and responsive were used by the authors to classify the cases. The final sample created for the purpose of this study contained 40 cases published between 1985 and 2010. After having being trained in the use of the instrument, two research assistants coded these cases independently using the PEMI. Intercoder reliability, measured using Cohen’s kappa and the intraclass correlation coefficient, was deemed fair to excellent. 1
The validation study then involved surveying the authors of the evaluation cases reported in the articles. The online survey had two sections. The first section focused on questions relative to the PEMI. Respondents had to check boxes about types of participants, steps in which they were involved, and their level of control on the evaluation process. On the next page of the online survey, five-point indices were automatically generated from respondents’ answers for each dimension and for the overall level of participation. These scores were presented to the authors of the evaluation cases for reactions in the first part of the survey. Respondents’ opinions were measured on an ordinal scale of agreement and an open-ended question asked respondents to justify their choice (i.e., “Why?”). The second part of the survey contained 11 four-point Likert-type questions from which the calculation of the Evaluation Involvement Scale (EIS) was derived (Toal, 2009). A total of 44 e-mail invitations were sent to the authors of the evaluation cases (the figure is more than 40 because second authors were contacted in cases of noncontacts and refusal to participate). After two rounds of follow-up e-mails, 25 fully completed questionnaires were received for a response rate of 56.8% calculated according to formula RR1 of the American Association for Public Opinion Research (2011). If one takes for denominator the number of evaluation cases in the sample instead of the number of attempted contacts, the response rate increases to 62.5%.
The inferences derived from the PEMI were validated using the EIS (for more information on the use of the EIS for validation purpose, see Daigneault, Jacob and Tremblay, 2012). The respondents’ scores on the PEMI were compared with those of the coders for agreement, on one hand, and with their scores on the EIS for correlation, on the other. Based on the results, the authors concluded that the evidence was strong for reliability and ranged from weak (but positive) to strong for convergent validation. The authors concluded that the PEMI appears to generate scores that are valid Daigneault, Jacob and Tremblay, 2012. 2
Turning to Mixed Methods for the Validation of the Initial Instrument
The validation study discussed above was entirely conducted from a postpositivist and quantitative perspective. Although the survey included one open-ended question, it was not exploited in the article that reported the results of this study (see Daigneault, Jacob and Tremblay, 2012) for reasons that will shortly become clearer. Including a few open-ended question in surveys that mainly contain closed items has been advocated to maintain respondents’ interest in the study, to refine questionnaire’s development, and “to illuminate complex patterns while preserving the strength in numbers that survey provide” (Ver Ploeg, Moffit, & Citro, 2002, p. 358). However, this rationale for adding open-ended questions is rarely justified within a coherent mixed methods framework. In retrospect, the purpose of including this qualitative question into a quantitative questionnaire was probably aimed at complementarity, which “seeks elaboration, enhancement, illustration, clarification of the results from one method with the results from the other method” (Greene, Caracelli, & Graham, 1989, p. 259). However, we expected that only a few respondents would answer the open-ended question since they could easily skip it and, for those who would choose to answer, expected only very brief comments. The fact that no sophisticated method had been planned beforehand to analyze open-ended answers also testifies to our low expectations toward the richness of data that would be collected from this question. Indeed, the importance of the open-ended question was exclusively envisioned in connection to the quantitative score of agreement. Provided that the open-ended question would have been exploited, this case would probably fit the “study employing minimum qualitative research” category according to the definitions of mixed methods research put forward by Creswell and Plano Clark (2007, p. 11). Although clearly a borderline case, it nevertheless satisfies the minimum criteria set by Creswell and Plano Park (2007) to be considered mixed methods research. In our opinion, this study would probably have fallen between the “Pure Quantitative” and “Quantitative Mixed” types on the continuum proposed by Johnson et al. (2007), but nearer the former than the latter. In fact, this design fits in the “concurrent nested” category (where priority is given to quantitative data) since qualitative data were collected at the same time than quantitative data used to validate the inferences derived from the initial instrument (Creswell, Plano Park, Guttman, & Hanson, 2003).
The “barely qualitative” component of this study unexpectedly 3 turned into a mixed methods study when it was decided to analyze thematically qualitative data. It must be stressed that the quantitative and qualitative components were not of equal status, however. Despite an expanded qualitative component, this study would now be located a bit to the left along the Johnson et al.’s (2007) continuum and now clearly considered of the “Quantitative Mixed” type. This decision, in turn, spurred a cycle of instrument revision and further quantitative validation of the inferences derived from the revised instrument. In that sense, the phase of the study that followed the quantitative validation of the inferences generated by the initial instrument can be best described as a sequential mixed methods design (Creswell et al., 2003).
Quantitative Score of Agreement
When questioned about the participation scores that were generated from their answers to the PEMI (1 = do not agree at all, 2 = agree to some extent, 3 = totally agree), 4 respondents indicated on average that they somewhat agree with it (M = 2.04, Mdn = 2, n = 24). Although not as strong as expected, this result still provides positive evidence with respect to the validity of the inferences derived from the PEMI. Agreement with the PEMI-generated score can indeed be interpreted as the fact that the instrument “truly” measures stakeholder participation.
Qualitative Analysis of Open-Ended Answers: Methods
The open-ended question (i.e., “Why?”) connected to the quantitative score of agreement and generated abundant qualitative data. Quantitatively, a strong majority of survey respondents (23 out of 25 or 91.6%) formulated comments. Two respondents also substantively supplemented their answers by e-mail. Taken together, these two sources of data generated about 1,400 words of data (M = 60 words; Min = 9; Max = 242). A first inspection clearly revealed that the data’s content was rich and varied; a superficial browse through the data would clearly prove insufficient to extract all the meaning out of it. It was thus decided that thematic analysis would be conducted. Indeed, this pragmatic approach which aimed at identifying patterns within qualitative data appeared to be a good fit in our situation: “Through its theoretical freedom, thematic analysis provides a flexible and useful research tool, which can potentially provide a rich and detailed, yet complex, account of data” (Braun & Clarke, 2006, p. 78). That being said, it must be stressed that a qualitative data corpus of 1,400 words, even if unexpected, is clearly limited with respect to drawing meaningful qualitative inferences.
The thematic analysis conducted here closely follows the guidelines and steps proposed by Braun and Clarke (2006): (a) familiarization with the data, (b) initial coding, (c) searching for themes, (d) reviewing themes, (e) defining and naming themes, and (f) reporting. Furthermore, we clarified our epistemological stance and analytical strategy before data analysis, as recommended by Braun and Clarke (2006). The analysis first followed an essentialist/realist stance according to which meaning and experience are assumed to be directly mediated by language. Second, the thematic analysis was primarily guided by a semantic approach which focused on the explicit meaning of the data (we say “primarily” because the analysis also identified a latent theme, namely, Participation as an influential norm). Third, the analysis was mainly conducted from a deductive (i.e., top-down) perspective but still let the door open for inductive (i.e., bottom-up) insights to develop.
Data from open-ended comments and e-mail correspondence were first transcribed in a single text document and edited. Weft QDA (Fenton, 2006), a free open-source software for qualitative analysis, was then used by the first author to analyze the data. Thematic analysis was conducted using codes, categories, and themes (O’Neill Green, 2008). First, a set of four simple, a priori, codes were developed to organize data in an analytically relevant manner in terms of (a) expression of agreement, (b) expression of disagreement, (c) justifications or reasons for agreement, (d) justifications or reasons for disagreement. Other codes were developed inductively during the process, namely (e) details on the evaluation process and (f) alternative conceptions of participation. Second, coded data were examined to identify categories, that is, conceptual units which are meaningfully related to stakeholder participation (see regular and rounded rectangles in Figure 1). The relationships between categories (illustrated by lines in Figure 1) were then examined to derive themes, which “captures something important about the data in relation to the research question, and represents some level of patterned response or meaning within the data set” (Braun & Clarke, 2006, p. 82). Themes—represented by ellipses in Figure 1—are significant and prevalent constructs about a phenomenon or experience that are derived from data (Firmin, 2008; O’Neill Green, 2008). It is important to stress, however, that the analysis could not reach the level of sophistication and depth in interpretation that is generally found in qualitative research, because of the limited size and diversity found in this qualitative corpus on one hand and of the mainly deductive approach used here (see Braun & Clarke, 2006).
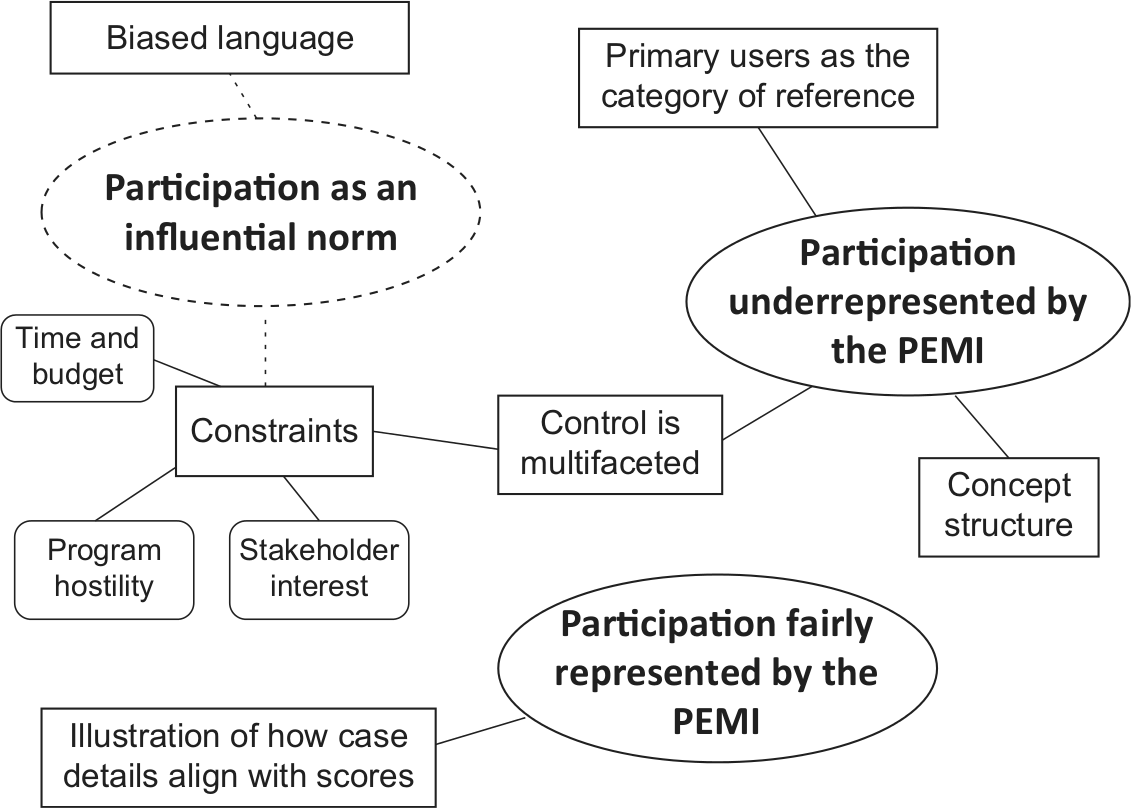
Final thematic map based on respondents’ reactions to Participatory Evaluation Measurement Instrument (PEMI) scores.
To ensure that the results from the thematic analysis were a faithful and complete representation of the data, the second author read through the data set and systematically reviewed the first author’s coding and interpretation. His thorough review contributed to clarify codes and brought refinements in the interpretation of categories and themes. This also stimulated discussion about data interpretation and led to a revised version of the thematic map (see Figure 1 for final version).
Qualitative Component: Results
Three themes were identified from the data: (a) participation fairly represented by the PEMI, (b) participation underrepresented by the PEMI, and (c) participation as an influential norm (Figure 1). These themes and their associated categories will be discussed sequentially.
Participation fairly represented by the PEMI
The first overarching theme clusters data that indicate a positive alignment between the respondents’ scores on the PEMI and their opinion about the level of stakeholder participation for their case. Explicit comments such as “I believe that the representation is quite accurate,”“The score feels right to me,” and “It’s about right” suggest that the measurement instrument faithfully reflects their opinion about stakeholder participation. However, these comments indicate partial rather than total agreement and thus corroborate the quantitative finding according to which agreement was good yet imperfect. Respondents whose answers relate to this theme justified their answers for the most part by citing details from their case which support the scores they obtained on the PEMI (see the category illustration of how case details align with scores in Figure 1). For instance, a respondent—whose evaluation was considered moderately participatory by the PEMI with respect to overall participation and the control dimension—commented, The process employed involved a deliberate sharing of control—stakeholders were the decision-makers regarding the substantive foci of the evaluation. The evaluators retained control over the technical and methodological aspects of the evaluation. The evaluators also planned and implemented the participatory processes.
Participation underrepresented by the PEMI
It is interesting to note that respondents who expressed disagreement with their participation score unanimously thought that the latter was too low. Comments such as “Participants more influential in outcomes than this scale indicates” and “I would tend to rate the participation higher through most of the evaluation process” are clear illustrations of this disagreement. To paraphrase the famous opening sentence from Leo Tolstoy’s Anna Karenina, happy respondents resemble one another, but each unhappy respondent is unhappy in his or her own way. Of course, all disagreeing respondents thought that the score somewhat underrepresents the “true” level of participation of their case but, beyond that, they gave significantly different reasons as to why this is so. These reasons coalesced around three categories (see Figure 1): concept structure, primary users as the category of reference, and control is multifaceted.
The first category, concept structure, highlights the counterintuitive nature of the scoring system associated with the PEMI. For example, a respondent could not understand why he or she got such a low overall score for participation when, at the same time, the scores obtained on other dimensions were so high: “I don’t get why the overall score was .25 with a 1 and a .75 in the mix.”
The second category derived from the data to justify the respondents’ disagreement, primary users as the category of reference, refers to the issue of whose participation is relevant in participatory evaluation. A respondent argued: “Stakeholder participation was limited to primary users. I don’t really think involving, for example, intended program beneficiaries makes the process more participatory.” Another respondent—who did not agree at all with the overall participation score obtained—explained: “Our evaluation was done with the full participation of those who were being evaluated.” These comments can be interpreted as calling for a reconceptualization of stakeholder participation that would not be based on all possible stakeholder types, but only on a more limited range of primary users such as program managers and staff.
Control is multifaceted is the last category of reasons given by respondents to justify their opinion regarding the PEMI’s underrepresentation of participation. This category brings attention on a conception of control that differs from the one underlying the measurement instrument. A first facet of control is the fact that the various steps of the evaluation process are not equally important to all respondents. Whereas the PEMI assumes equal weighting of each step of the process, a respondent argued that the potential for influence is greater at the beginning and at the end of the evaluation: Stakeholders had considerable input into framing questions that then directed the entire study. They also were involved in interpreting the results of the study. I give these evaluation components considerably more weight than the actual conduct of the study.
The concept of “critical junctures” raised by another respondent is also related to this idea of the disproportionate importance of some evaluation steps. Moreover, the influence exerted by people not directly involved in the evaluation as an important facet of control was raised as illustrated by the following comments by respondents: “Some of the decision-making was limited from the very beginning since the program was funded by the federal government and included a prescribed cross-site evaluation component” or “The external ‘technocratic’ evaluation was a political request.” This points to the importance of considering the other, less visible, face of control, that is what is decided before and after the evaluation by evaluation sponsors and institutional features.
Participation as an influential norm
This third theme is latent, which means that it goes beyond what has been said and “examine the underlying ideas, assumptions or conceptualizations” (Braun & Clarke, 2006, p. 84) contained in data (see dotted ellipse in Figure 1). Many respondents explicitly mentioned or alluded to the normative power of stakeholder participation, either to embrace or criticize it. Two categories were related to this latent theme: biased language and constraints. Biased language relates to data criticizing what is perceived as a democratic orientation in the PEMI: Having become familiar with [the measurement instrument], I need to emphasize that it does appear either to be biased in favor of complete or least very substantial participation by program offices. One even senses a democratic theme in the background. This is just too idealistic.
The second category underlines the constraints such as lack of time and resources faced by evaluators who want to put forward a participatory approach. Lack of interest or outright hostility by stakeholders was also considered as a significant constraint on participatory practices as is made clear by the comments of two respondents: I had originally envisioned that the consumers would take on more of an active role in designing, implementing, and reporting on the evaluation. The consumers were not very interested in the above, but they were very interested in expressing their opinions about the evaluand and in discussing and interpreting the results of the report. The score vastly—I emphasize vastly—underestimates the volatile and hostile nature of the relationship between the evaluation function and the program function. [ . . . ] Most often the program office being evaluated is exceedingly hostile. Not just a little. [ . . . ]. Your methodology in the first part classifies this part as not being very democratic or some such. Naive in the extreme. Thirty years ago this was radical.
What conclusions from the thematic analysis can be formulated with respect to the validity of the inferences derived from the measurement instrument? First, stakeholder participation seems to be somewhat underestimated by the PEMI in the opinion of many respondents. Second, the content of the stakeholder participation construct appears to be well represented by the dimensions of extent of involvement, diversity of participants, and control of the evaluation process. Indeed, the criticisms that were voiced did not fundamentally challenge the relevance of the dimensions themselves, only their calibration. Third, one cannot disregard the normative power of stakeholder participation; it represents a powerful norm that must be taken into account in a measurement instrument such as the PEMI. In the end, the thematic analysis suggested that the PEMI could be revised to better take into account certain limitations raised by respondents.
Instrument Revision
Compared with the Onwuegbuzie et al. (2010) framework in which instruments are revised after a pilot test, instrument revision occurred relatively late in the present study. It must be noted, however, that the process of instrument quantitative validation, mixed methods validation, and revision was not as linear as suggested by the order of presentation of the different sections. In fact, the issue of replacing the minimum rule for determining the overall level of participation had been raised earlier in the article in which the full results of the quantitative validation phase were reported (see Daigneault, Jacob and Tremblay, 2012). The two research assistants in charge of coding then suggested that averaging the three dimensions of the PEMI would better reflect their intuition about stakeholder participation than using the minimum which was overly restrictive. Yet the results generated in the mixed methods phase provide additional evidence of the necessity of revising the PEMI. Quantitative data indicated that the alignment between the scores derived from the PEMI and the respondents’ opinions with respect to the level of participation was only partial. Qualitative data revealed that an overarching theme derived from the respondents’ answers was the underrepresentation of stakeholder participation by the PEMI’s scores, thus suggesting the need to find a less conservative concept structure for the revised version of the instrument.
The PEMI was therefore revised with respect to how the overall level of participation is derived from the dimensions of diversity of participants, extent of involvement, and control of the evaluation process. In the original version, stakeholder participation is simply the minimum or lowest score of the three dimensions because each of the latter is considered a necessary condition for participation (for the full argument, see Daigneault and Jacob, 2009). In the revised version, determining the overall score is a two-step process which corresponds to a hybrid concept structure (see Goertz, 2006). First of all, each dimension is still considered a necessary condition for distinguishing participatory evaluation from nonparticipatory evaluation. This premise implies that if any dimension is missing (i.e., has a score of .00) in a case, this case is not an instance of participatory evaluation. Once this minimal criterion is satisfied, the overall participation score is simply derived from the average score on the three dimensions (and, if needed, rounded down to the nearest score). If we have, for instance, a case with full diversity and full involvement but limited control of the evaluation process by stakeholders (i.e., scores of 1.00, 1.00, and .25 respectively), the overall participation score would be .75 under the revised version instead of .25 under the original version. The revised rule of aggregation does not always affect the overall participation score, but it nevertheless mitigates the conservative bias of the PEMI. In fact, a similar rule had been suggested in the earlier work of Daigneault, Jacob and Tremblay (2012).
We have already mentioned that the PEMI is a nonnormative measurement instrument in the sense that it does not assume that stakeholder participation is desirable (or undesirable). Yet it seems that respondents have high expectations toward their score for overall participation that cannot only be explained by a conservative bias in the PEMI. The dominant discourse on stakeholder participation—which has even been qualified as “participatory orthodoxy” by some (i.e., Biggs, 1995, as cited in Gregory, 2000, p. 180)—might be an explanation for these expectations. In addition, a score less than 1.00 on the scale might naturally orient respondents toward reflexivity and self-improvement. That being said, we admit that the two ideal types that have been proposed for the negative and positive ends of the continuum (i.e., respectively technocratic evaluation and self-managed democratic evaluation) are strongly connotated and, as a result, should be abandoned. The language used in the PEMI will thus be more neutral and objective.
Other revisions to the PEMI were considered on the basis of the themes derived from the qualitative data but were rejected in the end. A first option was to refocus the conceptualization of the diversity of participants’ dimension exclusively on primary users instead of all potential types of users. This was rejected. For one thing, we argue that it is fundamental for an instrument that purports to measure participation (such as the PEMI) to be applicable to various evaluation contexts and rationales for participatory evaluation, whether political, pragmatic, or epistemological (Cousins & Whitmore, 1998). For another, defining primary users is context-specific and involves judgment. If primary users have to be identified on a case-by-case basis, this would significantly complicate the application of the instrument. In contrast, the objective and well-delineated typology of stakeholders that actually characterizes the instrument contributes, in our opinion, to a reliable and valid coding.
Other considered but rejected revisions were linked to the control dimension. We sympathize with respondents’ grievances about the operationalization of control but, at the same time, we feel that differential weighting of control based on which steps of the process control is exerted is unrealistic. The most important obstacle would be context since a specific step such as data collection and analysis may represent an opportunity to exert more control in one case and less in another. Besides, the actual operationalization of control is much simpler to use. Similarly, the idea of adjusting control to take into account the influence of evaluation sponsors and institutions is tempting but difficult to apply in practice. For these reasons, we argue that the actual operationalization of control is satisfactory.
Quantitative Validation of the Revised Instrument
The revised version of the PEMI was then subjected to a phase of “pure” quantitative validation (see Johnson et al., 2007). It must be stressed, however, that the validation evidence presented here is based on a small sample and is, as a result, rather modest. A first step was to examine how the original overall participation scores of respondents would be affected by the proposed revision to the instrument. For the 24 respondents who expressed an opinion on their scores, the revised version of the PEMI would leave 6 (20%) scores unchanged and would increase 18 (80%) of them. In the latter group, 17 respondents would see their score increase by one point on the scale whereas the other would see a two-point increase.
The original scores of these two groups of respondents, respectively those who would be affected by a revision and those who would not, can be compared before the actual revision of the PEMI to check if they are equally likely to agree with their scores. These two groups are formed retrospectively on the basis of the anticipated impact of a revision to the PEMI and the analysis was conducted on the original data. According to the qualitative findings of the mixed methods phase, the level of agreement is expected to be lower for the affected group than for the unaffected group. A Mann–Whitney U test was used to evaluate this hypothesis. The results of the test were in the expected direction and statistically significant (U = 28, p = .017, exact significance, one-tailed). The group that would not be affected by the PEMI’s revision (M = 2.5, Mdn = 3, n = 6) had an average rank of 16.83 whereas the authors in the “would-be affected” group (M = 1.88, Mdn = 2, n = 18) had an average rank of 11.06. This can be interpreted as evidence that respondents who would be affected by a revision of the PEMI (i.e., their participation score would increase) are significantly different from the respondents for whom their score would remain the same. This result appears to support the revision of the instrument.
A follow-up survey was conducted informally by e-mail from the 11th to the 21st of January 2012 (two reminders were sent to nonrespondents) to assess whether the respondents who would see their participation score increase with the revised version of the instrument would prefer the revised score over the original score. The 18 authors in the “would-be affected group” were contacted and presented with the new overall participation score for their case and were asked two questions
5
: (1) Does this new score correspond better, equally or less to your opinion about the level of stakeholder participation for this particular case? (2) Using the following scale (1 = Do not agree at all, 2 = Agree to some extent, 3 = Totally agree, 4 = Don’t know/Don’t want to answer), to what extent would you say the new score corresponds to your opinion about the level of stakeholder participation for this case?
The first two questions may look redundant but they actually played complementary roles. To maximize comparability, it was important to use the same ordinal scale of agreement as in the original study. However, the original scale was somewhat “crude,” that is, it could not capture as many nuances in the opinion of respondents as traditional 5-point or 7-point Likert-type scales. For instance, a respondent who “partly agrees” with both the original and the new scores could nevertheless prefer one score over the other. We hypothesized that respondents would prefer the revised score over the original score and would therefore be more likely to agree with it.
All contacted persons but one replied to this targeted follow-up survey. However, only 16 questionnaires were usable (i.e., one respondent chose the “don’t know/don’t want to answer” option. In a few cases, clarifications on respondents’ answers were sought by e-mail. In any case, the logic, type of data collected, and analysis strategy were all quantitative. The response rate (88.9%) for the follow-up subsample, which was calculated according to the American Association for Public Opinion Research’s (2011) Standard Definitions RR1, was high (although the number of participants was admittedly low).
The comparison of the original results and follow-up results conforms to a before-and-after, quasi-experimental logic. Whereas results go in the expected direction for both hypotheses, they fail to attain statistical significance. In terms of the direction of preference, 10 respondents indicated that they preferred the revised score to the original (+), 5 indicated that they preferred the original (−) and 2 said that they equally liked both scores (=). However, the result from a sign test on the hypothesis that respondents prefer the revised score over the original score was not statistically significant (p = .151, exact one-tailed).
Statistically, this could be interpreted as “no evidence of effect” rather than “evidence of no effect” (see Littell, Corcoran, & Pillai, 2008), especially as this result is based on a small sample size. In terms of the average intensity of preference, respondents seemed to agree more with the score derived from the revised version than with the original score on average (M = 2.21 vs. M = 1.89). A Wilcoxon signed-rank test was used to assess the hypothesis that respondents prefer the revised score over the original. Again, the results were not significant (z = −1.136, p = .17, exact one-tailed). The sum of the ranks in favor of the original score was 21.00 whereas the sum of the ranks in favor of the revised score was 45.00 (n = 11). 6 To sum up, the respondents seemed to favor the revised score over the original score on average, but it cannot be ruled out that this improvement could be because of chance (once again, this result should not necessarily be interpreted as evidence of no effect, see Littell et al., 2008). Indeed, there is a high probability that the limited sample size has prevented the attainment of a statistically significant result.
A last statistical test was conducted to check whether the level of agreement with the revised participation scores for the unaffected and affected groups was now equal. 7 The hypothesis was that there is no significant difference between the two groups with respect to their opinion of the scores derived from the revised version of the PEMI. A Mann–Whitney U test was used to evaluate this hypothesis. The results of the test confirmed that there is no statistically significant difference between the level of agreement of the two groups (U = 36.5, p = .304, exact significance, two-tailed). The group that would be unaffected by the PEMI’s revision (M = 2.5, Mdn = 3, n = 6) had an average rank of 14.42 whereas the affected group (M = 2.21, Mdn = 2, n = 17) had an average rank of 11.12. This result means that the revised version of the PEMI did not create two categories of respondents in terms of agreement level. As a result, it can be inferred that the revised version mitigates the conservative bias in the measurement instrument.
Discussion and Conclusion
Measuring Stakeholder Participation
This article has presented substantive results on the validation of the inferences drawn from the PEMI, an instrument that purports to measure stakeholder participation. In the end, is the validity of the evidence credible and convincing? We indeed think that the quantitative and qualitative evidence presented in this article lends some support as to the validity of the inferences derived from the original version of the instrument and therefore corroborates previous evidence (Daigneault, Jacob & Tremblay, 2012). The PEMI appears to adequately cover the content of the concept of participation and align with the respondents’ opinions about the level of participation of their evaluation. A thematic analysis of the qualitative data revealed that, while some respondents believed that the PEMI well represented the “true” level of stakeholder participation (i.e., their opinion of it), others thought that the PEMI was too conservative and thus underrepresented participation. Consequently, the measurement instrument was revised. The quantitative evidence, although modest, points to the fact that this revised version seems to offer an improved fit with the respondents’ opinions. We therefore recommend using the revised version in future endeavors involving the measurement of stakeholder participation in evaluation.
Limitations
It is important to stress that this study is not without limitations. The most important one is certainly the fact that it is based on a small, purposive sample of published evaluation cases and their authors. First of all, it is difficult to obtain statistically significant results with a sample size of about 20 respondents, even with nonparametric tests. Second, a qualitative data corpus of 1,400 words, even if unexpected, is clearly limited with respect to drawing meaningful qualitative inferences. Third, it is the inferences derived from the instrument for this particular sample that were validated, not the instrument itself. It is thus impossible to be certain that the findings derived from this study are generalizable to other respondents and settings (e.g., is the instrument more appropriate to measure stakeholder participation for certain evaluation approaches?). For instance, using the PEMI on a sample made of program staff might reveal that the instrument does not produce scores that align with respondents’ opinions (see Cousins, 2001). Similarly, there might be differences between respondents and nonrespondents (e.g., a greater interest in participation for the former compared with the latter) which could have implications for the external validity of the validation results. Another important limitation is related to the fact that some cases in the sample were published more than 25 years ago and, as a result, surveyed authors might not remember correctly the details of the case (some authors refused to participate in this study or could not complete the survey for that reason). A last limitation was the lack of sensitivity of the three-point quantitative scale used to measure agreement. In retrospect, it would have been desirable to use a more sophisticated scale. Thus, further empirical studies are certainly needed to establish the robustness of the findings presented in this article. This is especially so with respect to the validation of the revised version of the instrument. The quantitative evidence reported here—although going in the expected direction—remains quite modest.
The Value Added of Mixed Methods for Validation Purposes
This article has shown how mixed methods research can play an unexpected but significant role in a study aimed at validating the inferences derived from a measurement instrument. More specifically, the qualitative data that were collected through an open-ended question nested within a quantitative, postpositivist validation study proved richer than expected and was thus analyzed thematically. Although the qualitative component of this study was modest and apprehended through a postpositivist perspective—this study would fall in the “quantitative mixed” type (Johnson et al., 2007)—it nevertheless played a significant role in instrument revision. Indeed, while anecdotal evidence regarding PEMI’s conservative bias was identified in earlier work (Daigneault, Jacob & Tremblay, 2012), the quantitative data to the effect that survey respondents “partly agreed” on average with their participation score would probably not have been sufficient to trigger instrument revision. Qualitative data allowed investigating the reasons why respondents only partly agreed with their participation score. Moreover, results from thematic analysis triggered an unexpected round of quantitative data collection and analysis which provided (modest) validation evidence for the revised version of the PEMI.
To sum up, we feel that the fact of mixing qualitative data and analysis with quantitative data—even as the qualitative component was modest—significantly and positively contributed to the validation of the inferences drawn from the PEMI and its improvement through revision. This study has presented an original and explicit way to combine research methods for instrument development and, as such, has addressed the need outlined by Onwuegbuzie et al. (2010). To conclude, we humbly suggest that more researchers consider using mixed methods in their validation study. Further mixed methods validation studies—especially studies in which the qualitative data are dominant or have equal status with quantitative data—are needed. Even when the use of mixed methods is limited and not planned beforehand in a given quantitative validation research project, researchers should nevertheless attempt to collect minimal qualitative data and leave the door open for a possible expansion of the methodological scope of their work. Research does not always follow its intended course (some would even say it never does) but researchers can get the most of it by keeping a pragmatic and open-minded epistemological attitude. As such, the sequential frameworks put forward by Onwuegbuzie et al. (2010) and Luyt (2011) are useful guides to the mixed methods researcher who carefully plans a validation study. That being said, the steps put forward in those frameworks should be adapted to the particular purpose, constraints, and opportunities of a given validation project.
Footnotes
Acknowledgements
We first wish to thank all our respondents for their generosity and interest in this study. We also wish to thank Marvin C. Alkin and Marie Gervais for their help in pilot-testing the questionnaire for readability as well as Nathalie Loye for having introduced us to the concept of mixed methods validation. We also wish to thank Jennifer Greene, the journal’s editors, and anonymous reviewers for their useful and thorough critique of this article. Last but not least, we acknowledge the precious help of Geoffroy Desautels and Marylie Roger with coding the cases for the quantitative validation of the initial instrument and Kristen Leppington for linguistic revision.
Declaration of Conflicting Interests
The author(s) declared no potential conflicts of interest with respect to the research, authorship, and/or publication of this article.
Funding
The author(s) disclosed receipt of the following financial support for the research, authorship, and/or publication of this article: The first author gratefully acknowledges a doctoral grant from the Canadian Social Sciences and Humanities Research Council (SSHRC). Funding to carry out this study was provided to the second author by the SSHRC.