
Abstract
The use of qualitative data has so far received relatively little attention in methodological discussions on qualitative comparative analysis (QCA). This article addresses this lacuna by discussing the challenges researchers face when transforming qualitative data into quantitative data in QCA. By reviewing 29 empirical studies using qualitative data for QCA, we explore common practices related to data calibration, data presentation, and sensitivity testing. Based on these three issues, we provide considerations when using qualitative data for QCA, which are relevant both for QCA scholars working with qualitative data and the wider mixed methods research community involved in quantitizing.
Keywords
Qualitative comparative analysis (QCA) is an approach that combines quantitative and qualitative research (Ragin, 1987, 2008; Rihoux & Ragin, 2009). Its “hybrid” nature (Cragun et al., 2016) adheres to the definition of mixed methods research (MMR) by Johnson, Onwuegbuzie, and Turner (2007, p. 129) as “an intellectual and practical synthesis based on qualitative and quantitative research.” QCA is a set-theoretical approach that identifies the (minimally) necessary and (minimally) sufficient (combinations of) conditions for an outcome. It does so by using Boolean and/or fuzzy-set algebra to treat cases as configurations of causal conditions and an outcome and by analyzing whether a given (combination of) condition(s) stand(s) in a subset or superset relationship to the outcome (Schneider & Wagemann, 2012). To this end, a study’s so-called raw data—either quantitative, qualitative, or both—need to be transformed, a process called calibration in QCA (Ragin, 2008, chaps. 4 and 5). Calibration of qualitative data resembles what in the mixed methods literature is known as quantitizing, that is “the numerical translation, transformation, or conversion of qualitative data,” a process that “has become a staple of mixed methods research” (Sandelowski, Voils, & Knafl, 2009, p. 208).
Thirty years after Ragin (1987) introduced the approach in the social sciences, QCA is becoming a “mainstream” approach in several fields, such as sociology and political science (Rihoux, Álamos-Concha, Bol, Marx, & Rezsöhazy, 2013); in other (sub)fields, such as health services research (Summers Holtrop, Potworowski, Green, & Fetters, 2016), it remains relatively novel, however. As an approach, QCA is still in development. Several of the current methodological discussions relate to MMR, such as the discussion regarding the (in)compatibility of regression analysis and QCA (Fiss, Sharapov, & Cronqvist, 2013; Thiem, Baumgartner, & Bol, 2016; Vis, 2012).
This article’s three objectives focus on a series of related issues that so far have received relatively little attention in methodological discussions about QCA and that may be particularly relevant for readers of Journal of Mixed Methods Research (JMMR). Our first objective is to explore how researchers currently use qualitative data in QCA. 1 Hereby, we focus on three key issues: (a) data calibration, (b) data presentation, and (c) sensitivity tests. To achieve the first objective, we review 29 QCA studies that use various types of qualitative data. Appendix A details the selection procedure of the included studies. The second objective is to contribute to the standards of good practice in QCA (Schneider & Wagemann, 2010). Therefore, we critically examine how the 29 articles deal with the three key issues (i.e., calibration, presentation, and sensitivity testing) and provide considerations for researchers using qualitative data in QCA. Our third objective is to place our findings in the context of MMR. We focus particularly on the discussion about quantitizing, showing that our considerations provide relevant lessons for the wider mixed methods research community.
How to Calibrate Qualitative Data in QCA?
An important issue in QCA is the calibration of the raw data. When using crisp-set QCA (csQCA), all cases are either “in” (1) or “out” (0) of the sets. In fuzzy-set QCA (fsQCA), the raw data are calibrated from “fully in” (1) and “fully out” (0) of the sets, with additional gradations of set membership (e.g., “almost fully in” [.83] or “more out than in” [.40]). The 1 and the 0 are two of the so-called qualitative thresholds; the crossover point at 0.5 is the third.
The literature on calibration is mainly concentrated on quantitative data. For example, Ragin (2008, chap. 5) focuses exclusively on this issue, while providing no practical advice for researchers on how to calibrate qualitative data. The same holds for Schneider and Wagemann (2012, pp. 32-41).
The only two studies offering explicit methodological advice on how to calibrate qualitative data in QCA are Basurto and Speer (2012) and Tóth, Henneberg, and Naudé (2017) (see De Block & Vis, 2017 for a more extensive discussion). Basurto and Speer (2012) propose a stepwise procedure to calibrate qualitative (interview) data into qualitative classifications with associated fuzzy-set values (see Appendix B). Tóth et al. (2017) introduce the so-called Generic Membership Evaluation Template (GMET) to assign membership scores to conditions based on qualitative data 2 (see Appendix C).
Yet although Basurto and Speer (2012) and Tóth et al. (2017) provide valuable guidelines on how to calibrate qualitative data, some important questions remain. It remains unclear, for example, how qualitative data can properly inform and justify the determination of the qualitative thresholds—especially regarding the crossover point. What is more, while filling in the GMET is rather straightforward, decisions about how to attribute the final fuzzy-set score remain somewhat subjective.
Both Basurto and Speer (2012, p. 169) and Tóth et al. (2017, p. 195) note that existing studies using qualitative data in QCA are typically unclear about how exactly they calibrated their data. The studies usually are not transparent about (1) where they placed the thresholds for inclusion and exclusion of a set (respectively, the 1 and the 0) and (2) how they established the degree to which a case is “in” (0.5 < x≤ 1) or “out” of the set (0 ≤x < 0.5), that is, the degree of set membership. Since results of a QCA analysis can differ substantively depending on researchers’ specific choices on these issues, such transparency is important.
Determining the Thresholds for Inclusion and Exclusion of a Set
How did the studies we reviewed determine where to place the thresholds for inclusion and exclusion of a set? Table 1 summarizes the five main strategies employed, while Appendix D provides additional details for all reviewed studies.
Different Strategies to Determine the Thresholds for Inclusion and Exclusion of a Set.
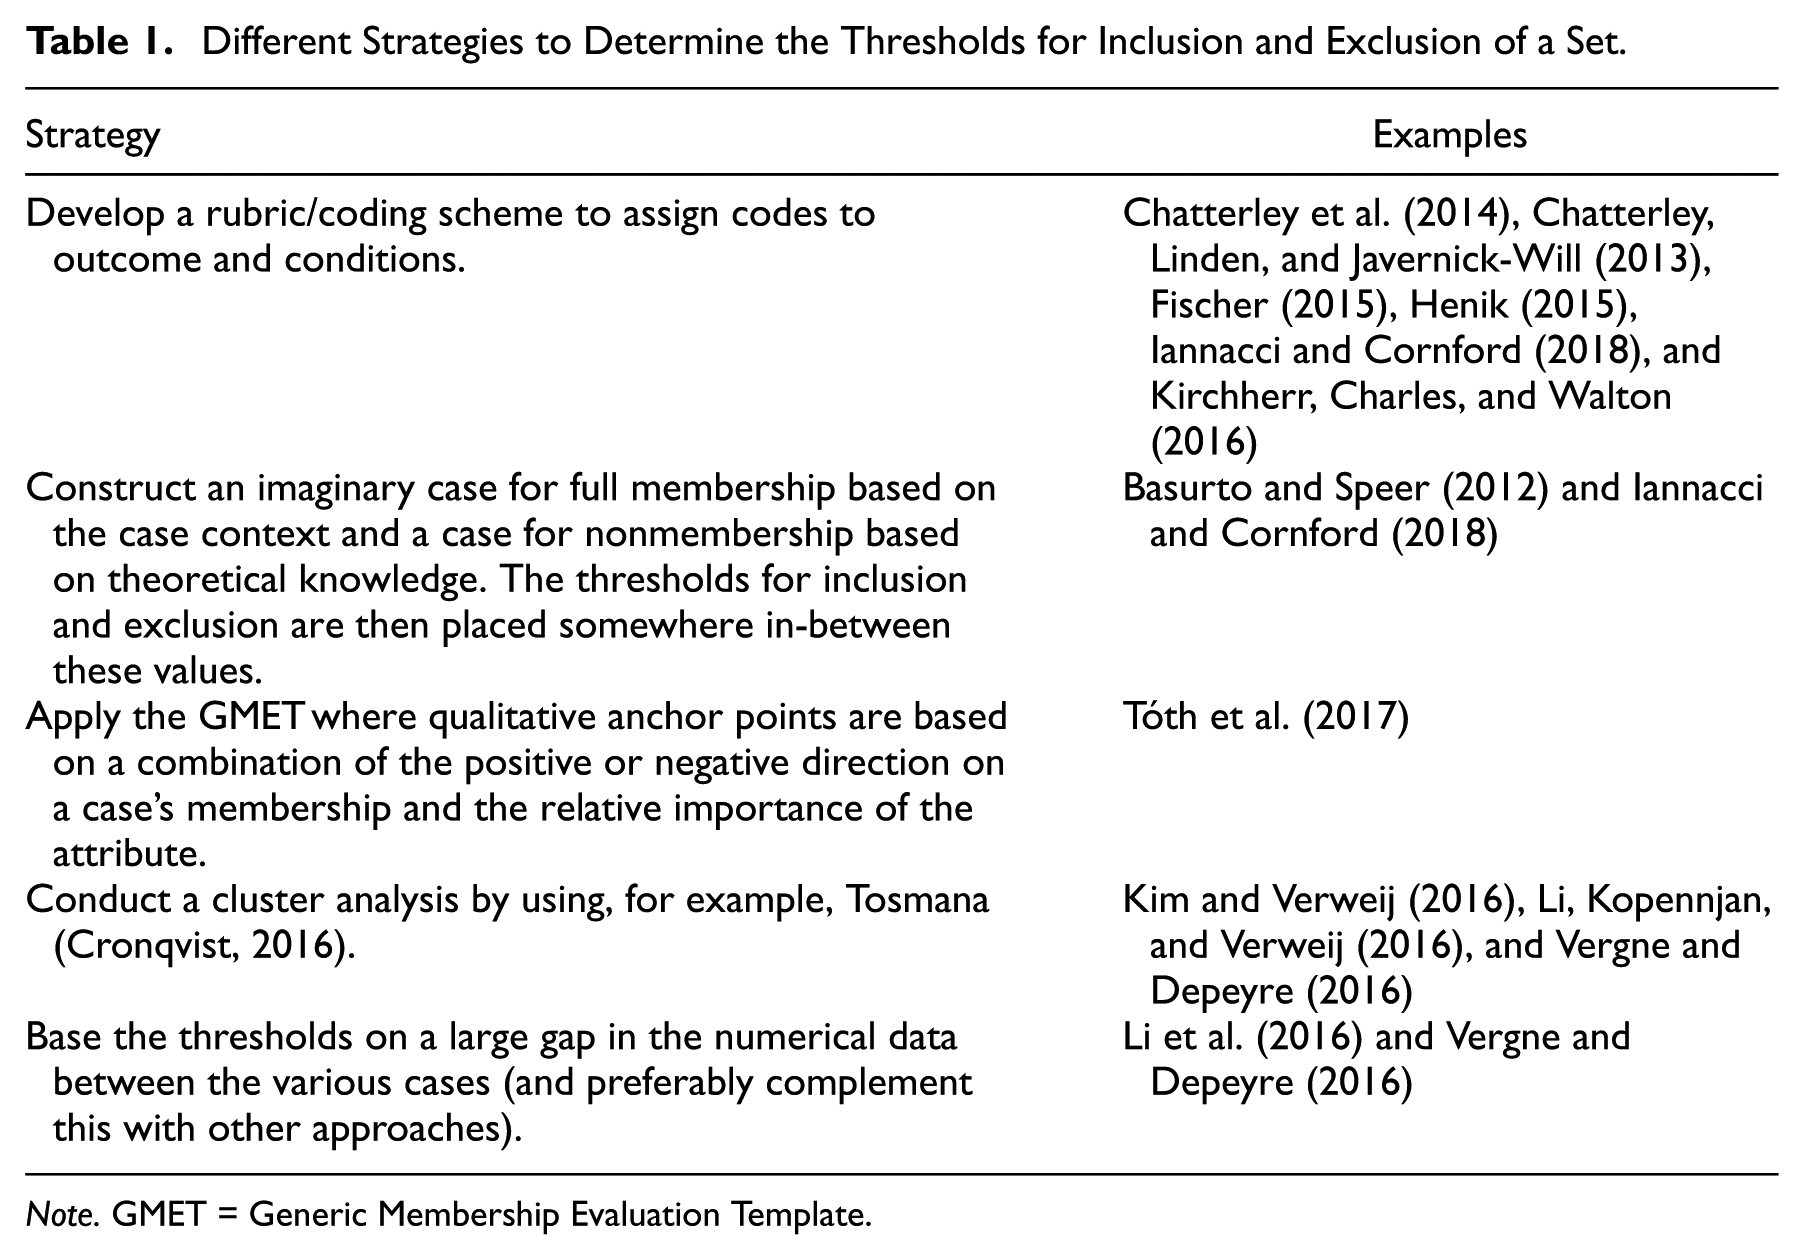
Note. GMET = Generic Membership Evaluation Template.
A first strategy is developing a rubric or coding scheme to assign codes for the outcome and the conditions. Chatterley et al. (2014), for example, develop a rubric to assign codes based on their data from interviews, focus groups, and observations (see Appendix E for an overview of the types of qualitative data used in all the reviewed studies). Whereas these codes are useful to rate the conditions and outcome for each case, Chatterley et al. (2014) do not provide a justification for assigning the thresholds for inclusion and exclusion of a set. Kirchherr et al. (2016) base the calibration of some fuzzy-set values on existing quantitative indices and of other values on an iterative process of multiple semistructured expert interviews and an online survey. While the thresholds for inclusion and exclusion of a set are rather straightforward for data based on indices (e.g., when a ranking is used), it is unclear how Kirchherr et al. (2016) determined thresholds based on the qualitative data.
A second strategy is suggested by Basurto and Speer (2012, see Iannacci & Cornford, 2018, for an application). Basurto and Speer (2012) construct two imaginary ideal cases, one representing full membership in a set (1) and one representing full nonmembership (0). The thresholds for inclusion and exclusion of the set, then, are put in-between the two “extreme” values.
A third—inductive—strategy that several studies adopt is to set the thresholds using QCA software, particularly the threshold setter in Tosmana (Cronqvist, 2016). 3 Exploring the possibly large gaps in the data is another inductive strategy. Note that these inductive strategies are applicable only when the raw data are already numerical. Yet for a study based exclusively on qualitative data, these strategies are not an option; as a result, researchers are restricted in these cases to applying Tóth et al.’s (2017) GMET or using one of the first two strategies listed above.
Establishing the Degree of Set Membership
While the overview in Appendix D shows that almost all fsQCA studies are careful about establishing the degree of set membership, 4 it also reveals that many studies are not fully transparent regarding how the qualitative data were used to this end.
For example, Verweij (2015) used both qualitative and quantitative data to calibrate the outcome and the conditions. As with studies using a similar approach (e.g., Vis, 2010), the quantitative material “dominated” the calibration (i.e., it was the benchmark that could be adjusted based on the qualitative material). One of Verweij’s (2015) conditions was calibrated based on various qualitative documents, with codes assigned using qualitative data analysis software. The few small coding contradictions were then recalibrated in a final step (Verweij, 2015, p. 1883). While the latter is common practice in QCA—as well as in many qualitative studies—it is not clear exactly how and why this recalibration was done. As a consequence, it is difficult to replicate studies that employ this approach. The same holds for Verweij, Klijn, Edelenbos, and Van Buuren’s (2013) study, which used various qualitative sources to calibrate their outcome and conditions. In line with good QCA practice, Verweij et al. (2013) published their coding scheme and the resulting scores in an appendix, allowing other researchers to assess whether “the observations meaningfully capture the ideas contained in the concepts” (Adcock & Collier, 2001, p. 529) and thereby are “valid” (i.e., that a given value makes sense given existing empirical and theoretical knowledge). Yet these tables do not include the reasoning behind the coding decisions and, therefore, cannot be reproduced fully.
Similarly, Van der Heijden (2015) used a systematic coding scheme and qualitative data analysis software to explore data on voluntary environmental programs systematically and gain insights “into the ‘repetitiveness’ and ‘rarity’ of experiences shared by the interviewees, and those reported in the existing information studied” (p. 581). However, Van der Heijden (2015) did not discuss how this information was subsequently used to code cases as “in” or “out” of the set. Other studies go over the coding decisions only briefly (e.g., Chatterley et al., 2014) or provide no information on how the interview data were translated into the fuzzy-set values (e.g., Basurto, 2013). To varying degrees, this lack of transparency inhibits the studies’ replicability.
Some studies use multiple coders to establish the degree of set membership. In Henik (2015), for example, two coders applied a coding rubric on transcribed interviews, with the average of these coders’ scores constituting the final set attribute. Henik (2015) notes that the coders “agreed within 0.25 set membership points on more than 90% of the 960 items” (p. 445). However, it is unclear how qualitatively important differences across coders were addressed, existing when one coder codes an item as being “in” the set and the other as “out.” In this regard, a discrepancy of 0.15 (e.g., 0.45 vs. 0.6) can be more relevant than one of 0.3 (e.g., 0.6 vs. 0.9).
Regarding which values to assign to qualitative data (i.e., the quantitizing), the studies we reviewed offer some suggestions. Table 2 lists the strategies, while Appendix D provides a more comprehensive overview.
Different Strategies to Determine the Degree of Set Membership.
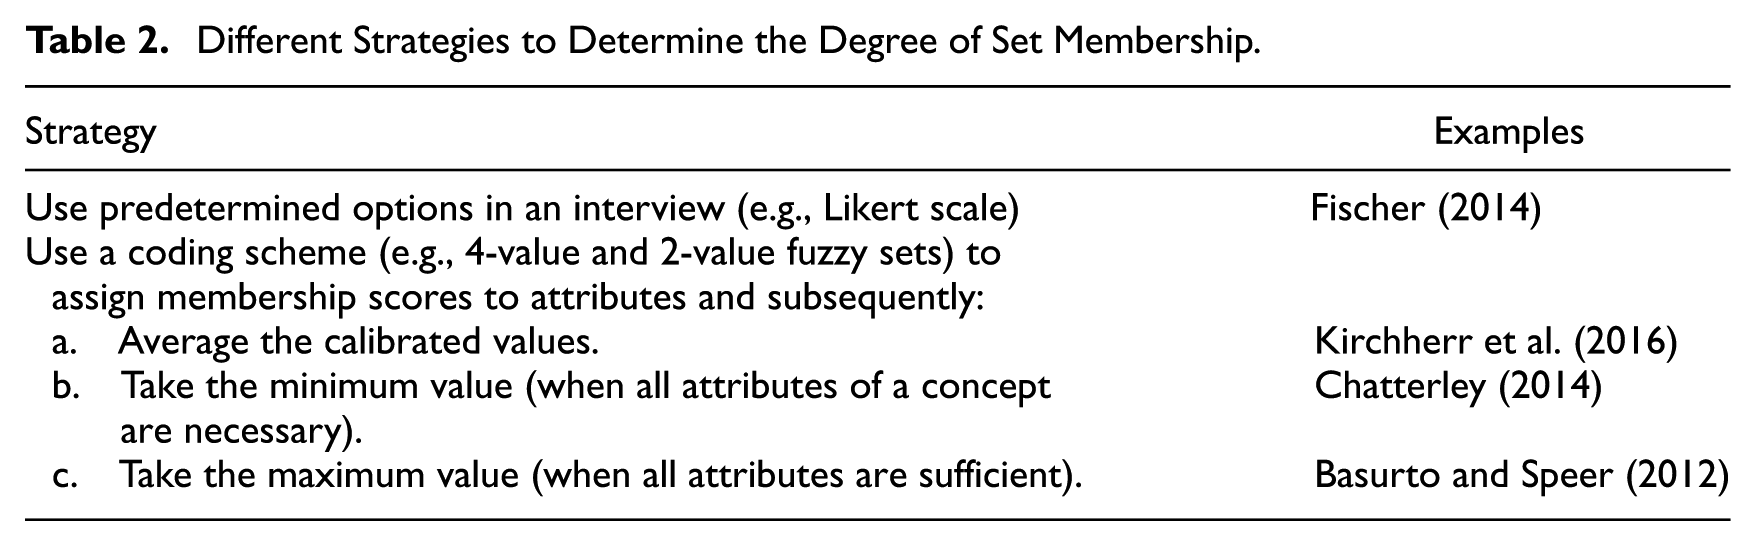
One strategy is to directly ask interviewees to provide answers on a Likert-type scale (or one based on other predetermined options). This strategy is applied by Fischer (2014), who calibrated his outcome (policy change) by asking approximately 250 interviewees to rate their perception of policy change from 1 to 5. Next, Fischer (2014, pp. 350-351) averaged the perceptions of actors and subsequently calibrated these data into fuzzy sets by rescaling the average value to a 0 to 1 scale. 5 Another strategy is adopted by Kirchherr et al. (2016), who used a 4-value and 2-value coding scheme to assign set-membership scores to the attributes. Subsequently, Kirchherr et al. (2016) averaged the calibrated values for the different attributes of the conditions. They addressed this strategy’s potential weakness, as it “could introduce misfits between the verbal meaning of a concept and its operationalization” (Kirchherr et al., 2016, p. 39), by reviewing all averaged calibrations of the conditions and changing or recalibrating the attributes when they found that the conditions’ values did not correspond to their averaged operationalization. Alternatives for taking the average value are substitutability (i.e., taking their maximum value) or taking the weakest link (i.e., the minimum value of the attributes of the concept; Ragin, 2000, see Basurto & Speer, 2012; Chatterley et al., 2014, for examples).
The Meaning of a Zero
A third challenge relating to calibration concerns the zero (0). Conceptually, in QCA, the meaning of a zero is clear: fully out of a set. However, discussions among QCA scholars reveal a challenge when coding qualitative data: How can one differentiate between concepts that are truly absent (i.e., where the concept is indeed absent), and which should thus be coded 0, and those concepts that are simply not mentioned in, for example, an interview? This question relates to Sandelowski et al.’s (2009) observation in the context of quantitizing in MMR that absent may refer to different things in interview data: “it” (a) did not come up; (b) was not seen by the analyst; (c) was forgotten as a factor by the participant; (d) was thought by the participant to be so understood as to not require bringing it up; (e) was a factor, but the participant did not want to bring “it” up; (f) was not brought up because the conversation veered away from “it”; and (g) truly was not a dimension of experience. (p. 217)
This challenge holds not only for other types of qualitative data, such as existing documents or archive material, but also for quantitative data. If a concept is not mentioned in a document, does that mean that it is absent, or just that no information on it is included in the document? Data triangulation is one way to assess the likelihood of these two possibilities. In a QCA analysis, it will oftentimes be useful to explore the zeros in more detail to find out why the condition was absent or why the information was missing.
The large majority of the reviewed studies (n = 25) do not discuss the meaning of the zero. There can be several reasons for this. First, sufficient information was available to assign “truly absent zeros” to cases. For example, Van der Heijden (2015) reported that he ensured sufficient information on all attributes by first gathering information from websites and reports and then filling in gaps using interview data (Crowley, 2012, is another example). A second reason may be that researchers did not differentiate between “truly absent” and “not mentioned.” For example, when calibrating their outcome “American states’ levels of environmental justice policy,”Kim and Verweij (2016) assigned a zero both to states with either “no action” or “no information,” which is conceptually problematic. 6 Vergne and Depeyre (2016) decided to ask people to not complete their survey when they were not knowledgeable enough, thus circumventing the problem of missing data; however, they also reported that they turned to additional databases when data about a specific attribute was missing but also noted that sometimes they did not find more information.
How to Present the Calibration Process and the Data?
To make studies replicable, the data sources and calibration process need to be presented transparently and comprehensively (Gerring, 2012). Ideally, this should also be done concisely to make the material easily accessible. These goals—transparency and comprehensiveness versus conciseness—often conflict. What is more, even transparency and comprehensiveness may conflict, as researchers aiming to be comprehensive risk burying their readers in details, thereby hindering transparency. How QCA scholars present the calibration process, and hence the actual possibility for replication, varies strongly across the reviewed studies. Table 3 summarizes the material from Appendix D on this.
Different Strategies to Present the Calibration Procedure.
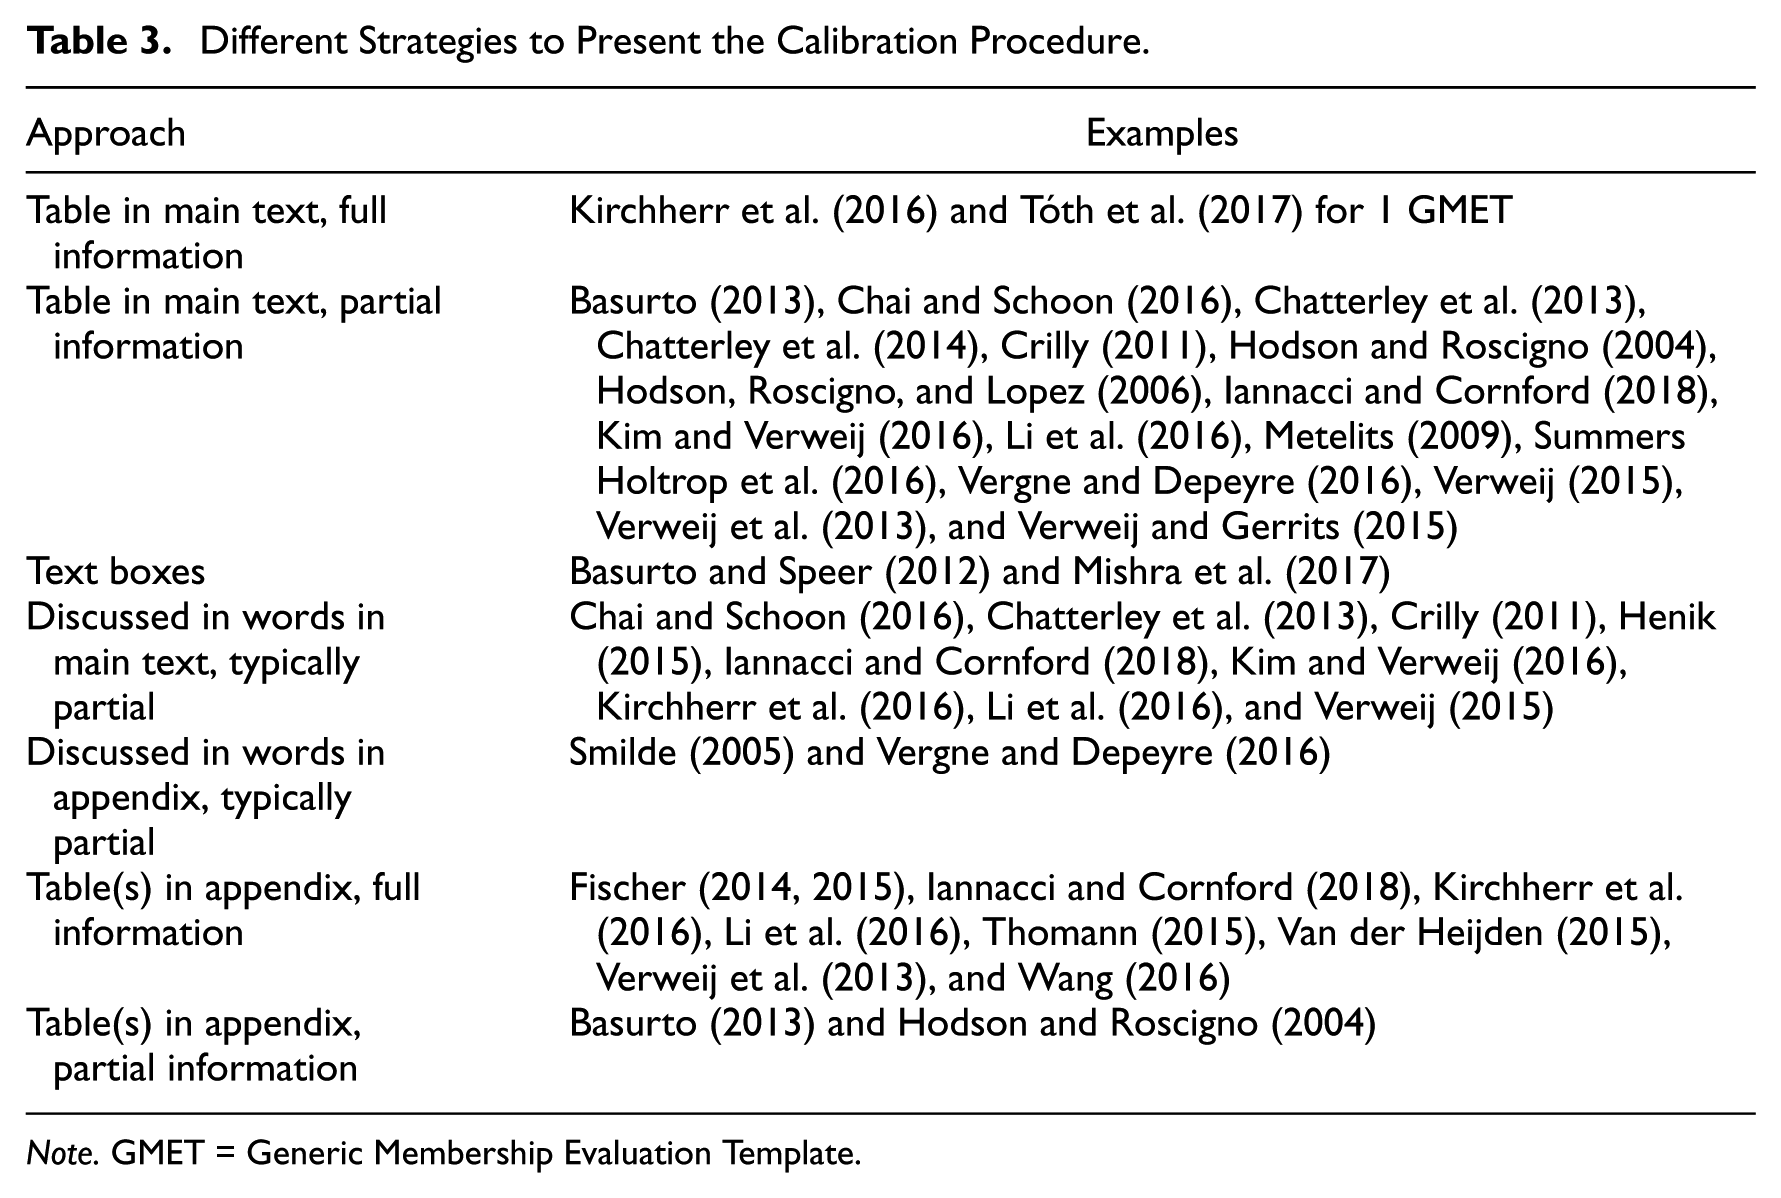
Note. GMET = Generic Membership Evaluation Template.
Table 3 demonstrates that most reviewed studies (n = 27) provide some information on the calibration procedure (Aversa, Furnari, & Haefliger, 2015; Crowley, 2012, provide too little information). Numerous studies provide substantial information, but not all that would be required for full transparency.
Some studies’ data calibration procedures make them easier to replicate than others. Kim and Verweij (2016), for example, included a table with the motivation of the assignment of U.S. states to a specific category based on a combination of descriptions and secondary survey data. Fischer (2014) presented the calibration of outcome and conditions in tables in appendices. Both studies use a rather straightforward approach to calibration by, respectively, referring to survey results and directly asking interviewees to “score” their outcome and conditions, subsequently taking the average. Hence, replicating these findings is also rather straightforward.
Arriving at similar results becomes more complicated when the data needed for a specific attribute cannot be directly derived from interviewees’ answers. While journal space limitations often make the disclosure of all details of the calibration process challenging, using (online) appendices, an option available at a growing number of journals, is one way to give more insight in the argumentation of researchers (Basurto & Speer, 2012). This suggestion is taken up by a variety of the reviewed studies (Basurto, 2013; Fischer, 2014; Kirchherr et al., 2016; Thomann, 2015).
Which Sensitivity Tests to Conduct?
Testing findings’ robustness by means of sensitivity analyses should be part of a good QCA study (Schneider & Wagemann, 2012). The methodological literature on QCA pays increasing attention to sensitivity tests (Baumgartner & Thiem, 2017a; Marx, 2010; Skaaning, 2011; Thiem, 2014; Thiem, Baumgartner, et al., 2016), including how to deal with different types of errors (Maggetti & Levi-Faur, 2013). In addition, the literature criticizing QCA (e.g., Hug, 2013; Lucas & Szatrowski, 2014; Paine, 2016) regularly indicates that the alleged lack of findings’ robustness is a key problem (but see Baumgartner & Thiem, 2017b).
The QCA literature provides several suggestions on how to assess the robustness of QCA findings using sensitivity tests. A nonexhaustive list includes (1) dropping or adding cases and conditions, (2) changing fuzzy-set membership functions, (3) altering consistency thresholds (Schneider & Wagemann, 2012; Thiem, 2014; Thiem, Spöhel, & Duşa, 2016), (4) changing the definitions of the set values, (5) using alternative measures for a concept (Basurto & Speer, 2012), (6) changing the calibration thresholds of raw data into set membership, and (7) altering the frequency of cases linked to configurations (Skaaning, 2011). These suggestions are not specific to qualitative data. Changing the consistency thresholds, for example, can be done irrespective of whether the data used are qualitative, quantitative, or both (see for examples with qualitative data Kim & Verweij, 2016; Tóth et al., 2017). Similarly, changing the frequency of cases linked to the configuration can be done irrespective of the kind of data used. Still, the higher the number of cases, the more appropriate this sensitivity test becomes. Since studies using qualitative data often—though not always—have a relatively low number of cases, this will in many cases not be the most important sensitivity test to conduct. Some researchers conduct additional statistical analyses to assess the robustness of their findings, despite criticism about the comparability of the two methods (e.g., Thiem, Spöhel, et al., 2016). For example, Hodson et al. (2006) investigated whether their QCA-generated configurations were associated with the outcome and whether the association was statistically significant. Hodson et al. (2006) also introduced multivariate controls by creating dummy variables specifying key configurations and including them in a linear model. Note that while combining QCA and statistical analyses might be of interest to the readership of JMMR, we do not discuss this further since it is not specific to QCA studies using qualitative data.
Based on the reviewed literature, we selected those sensitivity tests that are relevant for QCA studies using qualitative data. We list these in Table 4. Appendix D provides a more detailed overview for all reviewed studies.
Relevant Sensitivity Tests for Assessing the Robustness of Qualitative Comparative Analysis Findings Based on Qualitative Data.
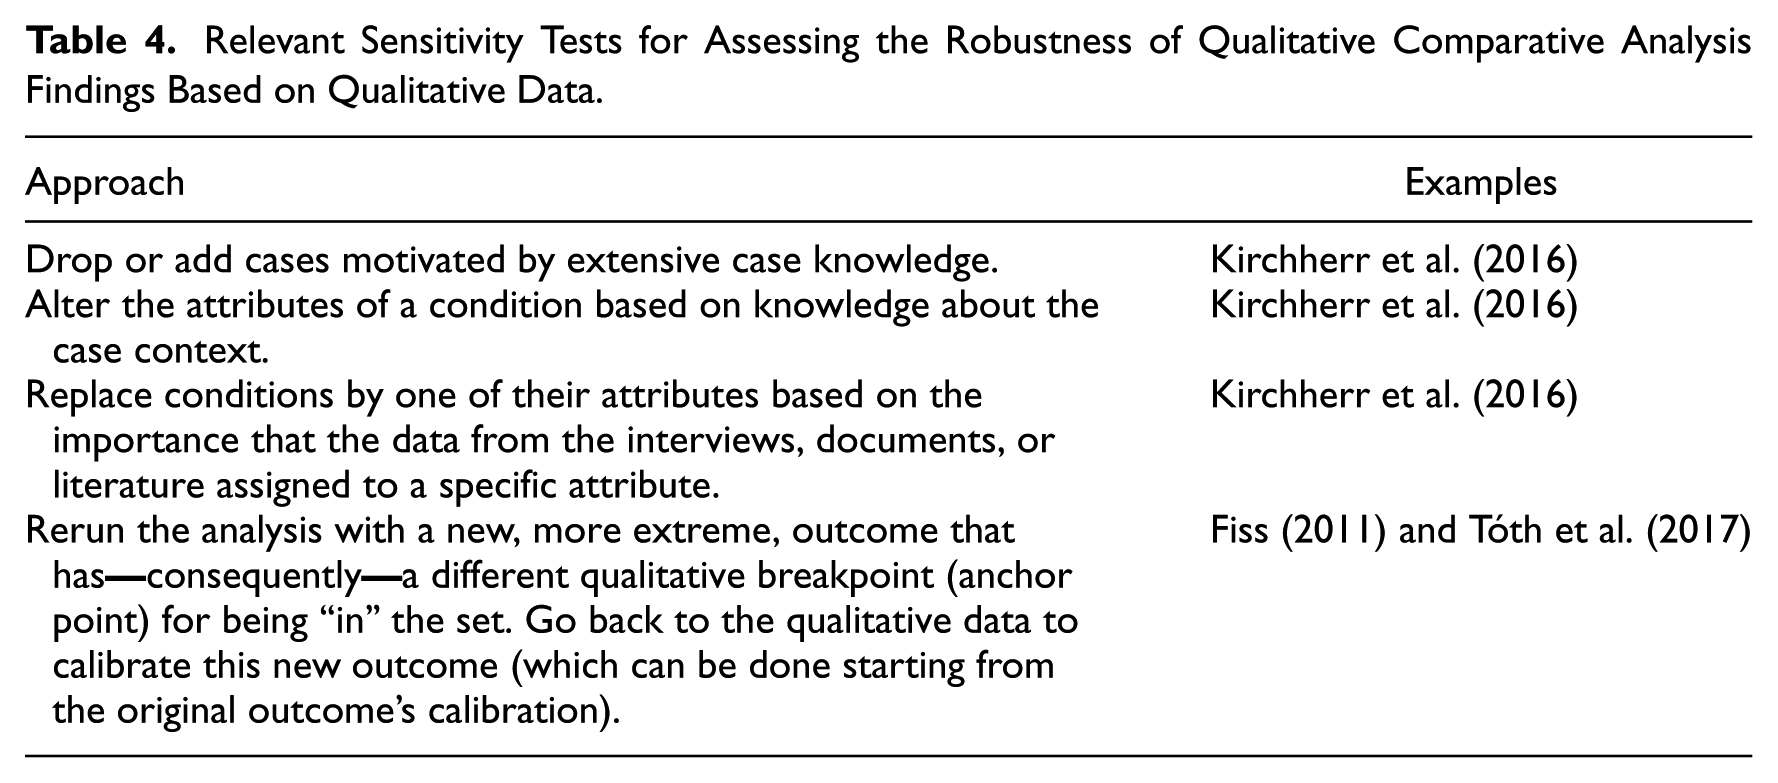
First, the available qualitative data can be a strong motivator to decide which cases to drop or add in the sensitivity analysis. Dropping cases can be a useful way to assess findings’ robustness. Kirchherr et al. (2016), for example, included an extensive section on robustness in which they tailor their choices to exclude certain cases based on case descriptions presented in an appendix. However, when dropping cases, it is important to make sure that the cases-to-conditions ratio is still acceptable—typically one condition to three cases (Marx, 2010). If this ratio becomes too low, the results become unreliable.
A second type of sensitivity test is conducted by altering the different attributes of the condition (Kirchherr et al., 2016)—for example, to base the membership score on only one attribute rather than on multiple ones. Here as well, the motivation for such choices must be based on knowledge about case context (e.g., that the now omitted attributes introduced noise to the condition’s operationalization). Another related option is to replace the condition by one of its attributes, a decision that can, for example, be based on the importance assigned to the specific attribute in the interviews, relevant documents, or literature.
Another type of test, which we subsume here under the heading of sensitivity tests but which is technically a test to better determine which factors or mechanisms “drive” the outcome, is conducted by Tóth et al. (2017, p. 202), who follow Fiss (2011). A new outcome is introduced that is more extreme than the original (in Tóth et al., 2017: very high relational attractiveness of the customer [RAC]). The qualitative threshold (the “anchor point,” in Tóth et al.’s (2017) terminology) for being “in the set” is higher for “very high RAC” than it was for “RAC,” meaning that some cases will no longer be “in” the set of this new outcome. The calibration of the outcome requires returning to the qualitative data and assigning appropriate (fuzzy) set values, where the calibration of the original outcome can be used as a starting point.
Considerations When Using Qualitative Data in QCA
Based on the studies we reviewed, we highlight five considerations for using qualitative data for QCA (summarized in Appendix F). First, QCA researchers should be more explicit about how they arrive at certain thresholds for inclusion and exclusion of a set. Depending on the type of data (to be) collected, these thresholds might, for example, be determined by constructing an imaginary ideal case or be based on a classification of interview responses.
Second, researchers should be more explicit about how they determined the degree of set membership. More specifically, the reasoning behind the coding of qualitative data and the subsequent translation of qualitative codes into fuzzy-set scores should be more clearly communicated in articles or (online) appendices (see also the fourth point below). Qualitative data or codes can be linked to values on a Likert-type or other predetermined numerical scale (potentially based on quantitative material) and subsequently translated into fuzzy-set values. Moreover, rubrics or coding schemes (e.g., with two or four values) or predetermined qualitative classifications can be used as an intermediate step for assigning fuzzy-set values to qualitative data.
Third, QCA researchers should pay more attention to the zeros in their calibrated data. Crucially, they must be careful about distinguishing between cases whose condition(s) or outcomes are coded zero because they are “not mentioned” (or not identified in, e.g., documents) versus cases whose condition(s) or outcomes are coded zero because they are “truly absent.” To avoid this ambiguity when using interview data, researchers should attempt to construct their interview scheme such that all concepts are addressed during the interview (although Sandelowski et al.’s (2009) option—that the analyst did not see “it,” even though it was there—would then still be a possibility). Creating a separate section for each condition and the outcome in the interview guideline, as proposed by Basurto and Speer (2012), is one possibility to doing so. The same holds for Tóth et al.’s (2017) suggestion to draw up an initial template based on previous literature. When all concepts are addressed in an interview, a value of “0” would then be assigned only to attributes or conditions that are truly absent. However, due to the iterative nature of QCA, which allows for the inclusion and exclusion of conditions during the process, a lack of data about one or more attributes or conditions cannot always be avoided.
A similar data deficiency can also occur when analyzing preexisting data for QCA. We provide two options to deal with such data gaps. First, in cases where such an approach is possible, interviewees can be recontacted about the attributes or conditions for which information is missing. This is the ideal solution, since it allows researchers to establish whether it was indeed absent, or whether it was just not mentioned in the initial interview. When it is not possible to go back to the interviewees however—for example, because of practical constraints—a second-best option is to conduct sensitivity analyses. Three sensitivity analyses are particularly apt for addressing the zero issue: (1) removing the conditions where this problem occurs and assessing the effect, (2) assigning the value “0.51” (i.e., just “in” the set) to cases of which the researcher is not sure whether the condition is “truly” absent to differentiate between the two findings, and (3) excluding the cases where the concept is “not mentioned” from the analysis.
Fourth, to increase a study’s transparency and comprehensiveness, and hence its replicability, QCA researchers should explicitly delineate the choices they made (to the extent that this is possible given issues of, e.g., confidentiality). We agree with Schneider and Wagemann’s (2010) advice to publish the raw data matrix in addition to a detailed discussion of the calibration of the set membership scores. When a data set is too large to be published, the original data should be made available on the Internet or, if that is impossible, on demand. Large data sets, including transcribed interviews and reports, often exist when using qualitative data for QCA. To present the data in a transparent yet concise way, a balance should be sought in giving brief explanations and/or illustrations in the main text and using tables in the main text and/or in (online) appendices.
Finally, our review showed that although conducting sensitivity tests in (qualitative) QCA should be common practice, this is still not the case. Various tests are particularly suited to dealing with qualitative data, such as changing the number of cases, altering the conditions, or rerunning the analysis with a more extreme outcome.
Transforming Qualitative Into Quantitative Data in QCA: What Lessons for Mixed Methods Research?
The considerations in the previous section are first and foremost meant for QCA researchers using qualitative data. However, as Cragun et al. (2016) show, QCA’s hybrid nature offers several advantages over other methods and is therefore interesting for mixed methods researchers more generally.
Our considerations regarding calibration specifically relate to the discussions in JMMR on quantitizing. Discussions have been held about “the foundational assumptions, judgments, and compromises involved in converting qualitative into quantitative data” (Sandelowski et al. 2009, p. 208)—for example, on what and how to count. Debates about how to quantitize qualitative data are not new to MMR (e.g., Boyatzis, 1998), and the topic is usually included in MMR text books (e.g., Miles, Huberman, & Saldaña, 2014). Typically, as in Teddlie and Tashakkori (2009, pp. 270-271), examples are presented as to how qualitative data have been quantitized or on how researchers have generally proceeded—for instance, by Sandelowski et al. (2009): A common approach to quantitizing is to use the results of a prior quantitative analysis of quantitative data as the framework for the conversion of qualitative into quantitative data. This framework provides the decision rules for a directed form of content analysis whereby a priori codes are derived from a quantitative data set and applied to a qualitative data set. (p. 218)
However, as with the studies reviewed above, the more detailed choices made by researchers frequently go undiscussed, alongside their underlying reasoning. Consequently, the methodological MMR literature provides little guidance for researchers seeking to quantitize their qualitative data. Since such choices may also influence the substantive results of an MMR study, they must be clearly communicated. What is more, the transparency and hence replicability of MMR studies would increase if they were more explicit about the choices made and the reasoning underlying these choices regarding quantitizing.
Conversions from qualitative into quantitative data “are by no means transparent and uncontentious” (Love, Pritchard, Maguire, McCarthy, & Paddock, 2005, p. 287, in Sandelowski et al., 2009). Our considerations regarding the presentation of the calibration process increase the transparency and replicability of studies where quantitization is used.
Given that quantitizing in MMR is to some extent subjective, it is relevant for MMR to conduct sensitivity tests to assess the robustness of the findings. Some of the sensitivity tests that we identified as relevant for QCA using qualitative data are also relevant for MMR that includes quantitizing; this is especially the case for studies in which the (in)dependent variables (conditions) include several subdimensions (attributes). Specifically, three of the sensitivity tests mentioned above are particularly appropriate to MMR: (1) dropping or adding cases based on extensive case knowledge, (2) altering the attributes of a condition based on knowledge of the case context, (3) and replacing conditions by one of their attributes.
Considerations on Quantitizing Beyond the QCA Literature
Although this article focused on QCA studies, research using methodologies other than QCA also provide valuable insights about quantitization. This can be illustrated using examples from various scientific fields. In education research, the study of Gilmore, Maher, Feldon, and Timmerman (2014) quantitized data from 65 interviews to assess the relationship of participants’ teaching experiences and teaching support systems with changes in their teaching orientation over time. They covered this longitudinal aspect by calculating the changes in coding scores between pre- and postinterviews. Moyer-Packenham et al. (2016) conducted pre- and postassessments of quantitized video data when studying the role of affordances in children’s learning performance. As their study makes clear, using quantitized codes derived from sources based on different points in time is a useful consideration when investigating developments over time.
When considering on how to deal with zeros in the data, Gilmore et al. (2014) suggest using multiple imputation procedures to fill the missing data. In the area of health research, Chang, Voils, Sandelowski, Hasselblad, and Crandell (2009) describe how qualitative labels for the number of respondents per specific finding on antiretroviral adherence—such as “few” or “many”—can be transformed in exact numbers—such as 2 or 50. They conducted an online survey at nursing school faculty to obtain lower and upper limits for specific verbal labels and, subsequently, used the responses in regression analyses to estimate a plausible range of respondents in a given study. Sandelowski (2000), in turn, uses the study of Borkan, Quirk, and Sullivan (1991) as an example of quantitizing. In this study, the researchers use narrative analysis to determine the main categories of how elderly people viewed the hip fractures from which they suffered. A series of reliability tests were then conducted to ensure the consistency of the categories. Both studies provide additional insights on the issue of how to establish the degree of set membership.
An example from economics comes from Vaitkevicius (2013), who suggests a systematic coding procedure based on hermeneutics to code qualitative data and subsequently analyze these data quantitatively. This procedure is, for instance, applicable to code and analyze closed-ended and open-ended questions. A final example also proposes a procedure for open-ended—qualitative—survey questions. Rohrer, Brummer, Schmukle, Goebel, and Wagner (2017) suggest the employment of tools from natural language processing to process and analyze potentially large numbers of answers to open-ended questions. They demonstrate their procedure by analyzing the more than 35,000 answers to the question “What else are you worried about?” from the participants of a German socioeconomic panel study. These examples can be used as a starting point for expanding the list of considerations to be reflected on in MMR.
Conclusion
This article addressed the challenges that researchers face when using qualitative data in QCA, especially when it comes to transforming it into quantitative data. Although QCA training courses are offered worldwide and several textbooks and journal articles that include hands-on instructions have been published, specific guidance for the use of qualitative data in QCA has been largely absent. We addressed this lacuna by exploring the various ways in which researchers currently use qualitative data in QCA and by laying considerations on three key issues: (1) the calibration of qualitative data (known as quantitization in MMR), (2) the presentation of the calibration process and the data, and (3) sensitivity testing. Overall, our study demonstrates that many QCA studies using qualitative data are not as transparent in their procedures as would be required to enable proper replicability.
We thus presented five main considerations for QCA researchers aiming to enhance their studies’ transparency: first, researchers should be more explicit as to how they arrive at the thresholds for inclusion and exclusion of a set; second, they should be clear about how they determined the degree of set membership; third, more attention should be paid to the “zeros” in the calibrated data; fourth, researchers should make more explicit and present clearly the choices they made during the calibration process; and finally, conducting sensitivity tests should become common practice. These considerations contribute to the methodological discussions on data calibration and quantitization. Moreover, our study provides QCA users, and readers of JMMR more generally, with ideas about how to transform qualitative data into quantitative form in their empirical studies. Which consideration(s) a given researcher ultimately takes into account will depend, among other things, on the specific research question, the type of data, and available time and resources.
Footnotes
Appendix A
Appendix B
Appendix C
Appendix D
Overview of the Studies Using Qualitative Data for QCA Based on Our Literature Review.
| Calibration |
Presentation |
Sensitivity |
|||
|---|---|---|---|---|---|
| Author(s) | How is the threshold for inclusion and exclusion of a set determined? | How is the degree of set membership established? | How is differentiation between “truly absent” and “not mentioned” indicated? | How is the calibration procedure presented? | Which sensitivity tests are conducted? |
| Aversa et al. (2015) | The authors use csQCA. They use their qualitative data to code the cases as being “in” (1.0) or “out” (0) of a set. However, it is not clear what are the sets (conditions). Probably the ones listed in tables 5 and 6 in Aversa et al. (2015), but the calibration of these conditions is not discussed. | NA (csQCA) | Not discussed | Besides some information on the calibration of the outcome, calibration of the conditions is not discussed and/ or presented. | None |
| Basurto (2013) | Some conditions have continuous values based on percentages, others are dichotomous (presence/absence or many/few). The conditions with semicontinuous values have a 5-point scale and the threshold lies between “more often than not” (0.6) and “less often than not” (0.4). | Either based on the assigned value (expressed in percentages) or, in case of multiple measures constituting one condition, on averaging the measures | Not discussed | A table in the main text states the types of states per condition (e.g., four-value) and defines them. No information is given on how the interview data translate into the values. The appendix contains tables with fuzzy-set values of all conditions and the outcome. | None |
| Basurto and Speer (2012) | Full membership and nonmembership are determined by constructing imaginary cases. The crossover point is set in-between. All values are based on theoretical and case knowledge. | The relevant interview codes for each case are matched with a predetermined qualitative classification and related (four-value) fuzzy sets. Values for one condition obtained by taking the maximum value of the submeasures, since they are substitutable. | Not discussed | The article contains text boxes with examples on how the data are calibrated. The empirical data are merely used to illustrate the proposed calibration procedure. | None |
| Chai and Schoon (2016) | A software program is used to divide the outcome into four segments with related fuzzy values. The conditions are coded either present or absent, whereby the reasoning is at times not that straightforward. NB: With only crisp conditions, there is no point in having a fuzzy outcome. |
NA (csQCA) | Not discussed | The authors state that they use the approach by Basurto and Speer (2012) but do not state how. The dichotomized data are presented in a table in the main text. | None |
| Chatterley et al. (2013) | A coding scheme is presented with qualitative descriptions (derived from literature) representing the membership (1) and nonmembership (0) values for the conditions and the outcome. | NA (csQCA) | Not discussed | A detailed coding scheme is included in the main text. The dichotomized data are also presented, whereby some values are supported by quotes in the text. | None |
| Chatterley et al. (2014) | No information is provided on how the thresholds are determined. | Values for outcome and conditions are obtained by taking the minimum value of the submeasures. | Not discussed | A coding rubric is presented with qualitative descriptions representing the four-value fuzzy set for each condition and the outcome. Some of the values are supported by quotes in the text. | None |
| Crilly (2011) | The outcome’s thresholds are based on interviews, as are the values in-between (four-value fuzzy set). The decision is explained clearly and illustrated with an example from the interviews. | The calibration of the seven conditions in four fuzzy values is mostly done by using “external,” typically quantitative or quantified standards (e.g., human development report, or the amount of corporate revenues). The author discusses clearly how these measures are “translated” into the fuzzy values. One condition (local government influence) is calibrated based on the interview data, which is also clearly explained. NB: Not a best practice is that the conditions are void of a direction (e.g., strategic orientation or local government influence). |
Not discussed | A table with the calibrated data per case is provided (fuzzy set data table). For the calibration of the outcome, illustrative examples from the interviews are provided; the calibration of the conditions is explained clearly in the main text. |
The author followed Epstein, Duerr, Kenworthy, and Ragin (2008) and reran the analysis with a reduced consistency threshold of 0.85 (p. 712). |
| Crowley (2012) | A coding instrument for the workplace ethnographies is developed by four researchers and adjusted on the basis of eight (out of 154) workplace ethnographies. The codes for the >10 conditions and outcomes are displayed in a table and include Likert-type scales (1 = none, 2 = little, 3 = average, 4 = high, and 5 = very high) and present/absent scoring. How the thresholds have been established for the dichotomous conditions and outcomes is clear; for the Likert-type ones, there is no information. |
It is not clear what type of QCA has been used. In any case, there is no information on how the Likert-type conditions and outcomes (see previous column) have been calibrated into fuzzy or crisp sets. A link to additional information is mentioned in a note, but this link does not work. |
NA (information on all conditions and the outcome available) | There is no information on this in the main text or in an appendix. | None |
| Fischer (2014) | For two of the three conditions, Fischer takes the observed maximum (1.0) and observed minimum values (0) and uses the median observed value as crossover point (0.5). For the third condition, he takes the theoretical maximum (1.0) and minimum (0). | Calibration of outcome and conditions by asking interviewees directly to express their perception using either a 5-point scale or predetermined categories. Then converting the average of the actors involved into a fuzzy value using the direct method of calibration. | Not discussed | Tables with how the outcome and conditions were calibrated and what were the resulting membership scores are presented in an appendix. The main text includes a table with the fuzzy-set data. | None |
| Fischer (2015) | The thresholds are determined using the substantive knowledge from the qualitative material. A coding rubric, including a description for determining the three thresholds, is presented in the appendix. | For assigning values to one of the conditions, the author uses the direct method of calibration. For the other two conditions, he uses a 7-value fuzzy set, whereby he avoids assigning the score 0.5 to cases. | Not discussed | Tables with how the outcome and conditions were calibrated and what were the resulting membership scores are presented in an appendix. The main text includes a table with the fuzzy-set data. | None |
| Henik (2015) | A coding rubric is presented with qualitative descriptions representing the four or two fuzzy values for each condition and the outcome. NB: The calibration scheme includes 0.5, which should be avoided. |
A coding rubric is applied on the interview transcripts by two coders. The averages of their scores are the final set attribute. The author notes that the coders “agreed within 0.25 set membership points on more than 90% of the 960 items” (p. 445). In a few cases, this seemed to depend also on quantified measures (e.g., the anger scale). | Not discussed | The coding rubric is included in the main text. | None |
| Hodson and Roscigno (2004) | The authors use csQCA. They use their qualitative data to code the cases as being “in” (1.0) or “out” (0) of a set using different categories for the concepts, e.g., average or less versus more than average, or no versus yes. | NA (csQCA) | Not discussed | The binary coding categories for the concepts and outcome are presented in tables in the main text and appendix. A footnote in the main text indicates that the code sheet, coding protocol, and data are available on a website, but this link is no longer valid. As such, it is unclear how the qualitative data are assigned to the categories. | The authors only discuss how they addressed the sensitivity of the coding exercise (i.e., by recoding a 10% sample of cases as a reliability check) and not the QCA analysis. |
| Hodson et al. (2006) | The authors use csQCA. They use their qualitative data to code the cases as being “in” (1.0) or “out” (0) of a set using different categories for the concepts and outcome, e.g., adequate or less versus good or exceptional. | NA (csQCA) | Not discussed | The binary coding categories for the concepts and outcome are presented in tables in the main text. A note indicates that the code sheet, coding protocol, and data are available on a website, but this link is not/no longer valid. As such, it is unclear how the qualitative data are assigned to the categories. | The authors ask whether each QCA-generated configuration is associated with the outcome and whether the association is statistically significant. They also introduce multivariate controls. This is accomplished by creating dummy variables specifying key configurations and entering these into a general linear model with appropriate controls. This multivariate analysis assists in evaluating the robustness of the configurational findings and also in evaluating possible alternative explanations for the outcome. |
| Iannacci and Cornford (2018) | Using the proposal by Basurto and Speer (2012) to formulate ideal cases or types at the extremes, to determine the (1) and the (0). | As “deviations” from the ideal type (see column 2), based on a coding rubric and summary statements based on the collected material. | Not discussed | Calibration of the outcome and the conditions is presented in the main text (both in words and in tables) and in the appendix in a comprehensive fashion (e.g., coding rubric, summary statements, coding exemplars). The fuzzy-set data are presented in a table in the main text. | None. Still, by applying also process tracing, the authors can assess the relevance of the QCA findings. |
| Li et al. (2016) | csQCA is used. The outcome is expressed as project relocations or cancellations (1) and project continuations (0). The threshold for the condition “scale of protests” is based on a big gap in the data (i.e., number of participants) combined with a value derived through cluster analysis using Tosmana QCA software. | NA (csQCA) | Not discussed | Calibration of the outcome and the conditions is presented in a table in the main text and the raw data are summarized in a table in the appendix. Justification for assigning the set membership scores can partially be derived from the case descriptions in another table in the main text. | The authors make two comments about the robustness and validity. First, that a different crossover point based on Tosmana cluster analysis does not influence the calibration. Second, that the “symmetric nature of this finding strengthens the validity of the results of the respective analyses for the occurrence and non-occurrence of the outcome” (p. 819). |
| Kim and Verweij (2016) | The qualitative anchors are determined based on existing indices and by using the Tosmana threshold setter (i.e., cluster analysis). | Mainly from existing indices and by using the Tosmana software | For calibrating their outcome, the authors assigned a zero both to “no action” or “no information”, which is conceptually not fully clear. | The three qualitative thresholds are presented in a table. The argumentation for these scores are discussed in the main text. | Sensitivity analysis based on different consistency cutoffs. |
| Kirchherr et al. (2016) | The authors used a four-value and two-value coding scheme to assign fuzzy-set values to either conditions or outcome, or to their attributes. Some of the fuzzy-set values were based on existing quantitative indices, whereas others were based on interview and survey data. | The authors averaged the calibrated values for the condition’s different subdimensions to derive at the fuzzy-set value of the condition. Subsequently, they reviewed all averaged calibrations of the conditions and changed or recalibrated the subdimensions when the conditions’ values were not face valid. | Not discussed | Calibration of each condition and the outcome is presented in the text, tables, and an online appendix. The online appendix also provides information on the raw data, sensitivity analysis, and calibration of conditions using various qualitative data sources. | Three types of sensitivity analyses were conducted—(1) dropping cases; (2) introduction of additional conditions; and (3) alternative measures for a concept—yielding a total of 11 sensitivity analyses, which are explained both in writing and in a table. |
| Metelits (2009) | The interview material is used to establish the qualitative breakpoints, as well as the other values of the six-value fuzzy set for the outcome and the three conditions. How exactly the author has used the interview material to this end is not spelled out. | By means of the interview material. The author discusses per case the fuzzy-set scores for the outcome and the conditions, even though it is not always clear how she has made this judgment. | Not discussed | Tables with fuzzy values for the nine cases are provided per group of cases (i.e., three groups) and jointly in the main text. | None |
| Mishra et al. (2017) | The authors use four-value fuzzy sets. Most of their data are qualitative. They develop coding schemes for the conditions (or their submeasures) and the outcome and illustrate this for one of their conditions in a table. | See also column 2. The authors finalized their calibration process with a final triangulation of the scores with field notes/observations and secondary data. | Not discussed | The authors present an example in a table in the main text. The calibrated data are not included in the article or in an appendix. | None |
| Smilde (2005) | The author uses csQCA. He uses his qualitative (life history interview) data to code the cases as being “in” (1.0) or “out” (0) of a set (e.g., the condition “life problems”). He discusses his coding rules in an appendix and offers examples of cases that would be coded out of a set and that would be coded in a set. | NA (csQCA) | Not discussed | The author discusses his coding rules in an appendix and offers examples. The calibrated data are not included in the article or in an appendix. | None |
| Summers Holtropet al. (2016) | No information is provided on how the thresholds are determined. Moreover, the qualitative descriptions representing the fuzzy values for each condition (table 6) sometimes span values both “in” and “out” of the set (e.g., 0.2-0.8), which is confusing. | First, a scoring system was created using a 1-5 Likert-type scale to assign values to a list of attributes, based on qualitative information. The resulting quantitative scores were then analyzed using basic descriptive statistics to determine which attributes would be used for the QCA analysis. Then, the quotations and codes were taken together to determine how the interviewees discussed each selected attribute, resulting in a score from 1 to 5. These were then converted into fuzzy-set scores, which were based on “in-depth analysis and thematic analysis of features and context” (p. 20). | Not discussed | A table in the main text describes two case examples of how the qualitative information and the quantitative Likert-type assessment ratings informed the fsQCA values for the five conditions and the outcome. A second table in the main text presents the list of conditions, an overall explanation of each condition, and the calibrated score given for each condition with an explanation of the various categories for the calibration values. | None |
| Thomann (2015) | For the outcome, the author uses the theoretical maximum of the developed customization index (1.0) and its theoretical minimum (0), with 1.5 (on a scale of 4) as crossover point (0.5). For the conditions, the author uses a combination of existing indices that constitute the attributes of an index that was calibrated indirectly, and conditions that were calibrated using the qualitative material, typically the interviews. The author clearly states the reasoning behind the thresholds. For one condition, the thresholds are based on the sample range (1.0 and 0) and its mean (0.5), so as to avoid unrealistic scenarios. |
See column 2. | Not discussed | The calibration procedure is discussed in an appendix. This appendix also presents the raw data matrix and the fuzzy membership scores. | The author conducted an analysis of the negation of the outcome. |
| Tóth et al. (2017) | The thresholds are based on the GMET. Full membership (1.0) is given when overall intense and various positive dimensions; full nonmembership (0) is given when overall intense and various negative dimensions. | The value of each attribute is determined by both its intensity/relative importance and by the positive or negative direction on the membership (see Appendix D). The “more in than out” category is characterized by mostly, but not exclusively, positive dimensions, whereas the “more out than in” value is described by mostly but not exclusively negative dimensions in relation to the case’s condition membership. |
Not discussed | The GMET is used to assign fuzzy values to conditions and outcome. The GMET is filled in for one condition as an example. The GMET for the remaining conditions is neither presented in the article nor in an appendix. | Sensitivity analysis based on different consistency cutoffs. |
| Van der Heijden (2015) | The author describes the assignment of the three thresholds for the outcomes and the conditions in the appendix. He has used the empirical material to inform this assignment but does not discuss how exactly he has used the material to this end. | The author uses a four-value fuzzy set for the outcomes and conditions. | The author makes sure he receives enough information on all indicators to obtain a valid measurement. To this end, he starts by using information from websites, existing reports, and other sources. Novel data on the cases are subsequently obtained through a series of interviews to fill in the gaps in the data from other sources. | The calibration of the data, including the setting of the thresholds, is discussed in an online appendix. | None |
| Vergne and Depeyre (2016) | The threshold for the outcome is based on an expert survey giving answers on a scale from 1 to 7. Value 4 indicates the crossover point, and intended to capture the average. The threshold for one of the conditions is based on a clear gap in the data around the 0.5 qualitative anchor, allowing to use the raw measure of the condition. | For the outcome, the scores of five experts (see column 2) are averaged into the final set membership scores. The authors indicate that in 59% of the cases, experts were in agreement (p. 1662). Then using the average scoring “averages out” the qualitative differences across the experts (e.g., one scoring 3, which would be out of the set, and another scoring 5, that is out of the set), but this may not result in a valid measurement. Calibration of one condition is based on letters to shareholders. Based on these letters, four values are given to each case (e.g., 0 indicating “not paying any attention” and 0.33 indicating “paying some attention”). |
The option “I don’t know” is deliberately excluded in the expert survey. When someone was insufficiently knowledgeable, the authors ask that person not to complete the survey at all (p. 1661, note 8). When data about a specific indicator are missing, the authors turn to additional databases for information (but report that they sometimes did not find more information) (p. 1679). |
The calibrated sets are presented in a table in the main text. Further details about the calibration are presented in an appendix. Figures in the main text provide qualitative illustrations of set memberships based on the letters to shareholders. | The authors conduct an additional analysis in which they did include directional expectations. Additionally, they conduct robustness analyses using alternative measures for one indicator and the outcome. |
| Verweij (2015) | Determined based on existing indicators (e.g., project size), qualitative data (e.g., summaries by managers), and by using the Tosmana threshold setter (i.e., cluster analysis). | To establish the degree of membership in the 4-value fuzzy sets, the author uses mainly existing indicators (e.g., project size), qualitative data (e.g., management summaries), and the Tosmana software. | Not discussed | The “raw” data and membership scores are provided in a table in the main text. The reasoning behind this is discussed in the main text. | The author conducts an analysis of the negation of the outcome. |
| Verweij and Gerrits (2015) | The qualitative data are used to determine the multivalue scores (0, 1, or 2) and the Boolean ones (0 and 1). These scores are recalibrated in a second round because they yield too many logical contradictions. | The conditions are broken down into categories. A value is assigned to each category, which is then used for the mvQCA. Summaries in a table provide some justification for why specific values are assigned to certain categories. | Not discussed | Three tables in the main text, respectively, present a qualitative description of each case, the category assigned to each case, and the value assigned to each category as part of the mvQCA. | None |
| Verweij et al. (2013) | The qualitative anchors are determined based on existing indicators (e.g., the number of actors involved) and by the interview and secondary data. | Quantitative and/ or qualitative case description for each condition are translated into fuzzy-set scores. The authors first score the cases individually. A subsequent iterative dialogue of several rounds between researchers’ theoretical and substantive case knowledge is used to amend each other’s scores. This results in the assignment of case membership scores on each condition (based on averaging the indicators). | Not discussed | The scores on each separate indicator are presented in tables in the appendices. Some scores are based on quantitative data (e.g., number of actors involved). A qualitative description with corresponding qualitative scores (e.g., high–moderate–low) is given for the other indicators. | None |
| Wang (2016) | Based on the existing “raw” data (see column 3), whereby the coding decision is not explained very clearly (e.g., why are neighborhoods below the 27% percentile clearly poorly governed, i.e., fuzzy value 0)? | The author discusses in much detail how he measured the outcome and the causal conditions. The result hereof are the “raw” data, which are also used in a network analysis and in a linear regression. How these “raw” data are translated into fuzzy values is discussed in an appendix. Some choices are explained well, but others less so (see also column 2). NB: The score of 0.5 is given, which is problematic. |
Not discussed | In an appendix. There is no table summarizing the calibration procedure. | Alternative specifications of the calibration thresholds, specifically—following Fiss (2011)—of two new crossover points for the fuzzy conditions. The new crossover points are provided in a table, as are the changes (or lack therefore) in the causal paths and the biggest change in coverage or consistency. |
Note. QCA = qualitative comparative analysis; NA = not applicable; csQCA = crisp-set QCA; fsQCA = fuzzy-set QCA; GMET = Generic Membership Evaluation Template; mvQCA=multivalue QCA.
Appendix E
Summary of the Types of Qualitative Data Used.
Appendix F
Checklist of Considerations When Using Qualitative Data in QCA.
| No. | Consideration | Examples |
|---|---|---|
| 1 | Be more explicit about how the thresholds for inclusion and exclusion of a set are established | a. Determine the threshold by constructing an imaginary ideal case b. Base the thresholds on a classification of interview responses |
| 2 | Be more explicit about how the degree of set membership is established | a. Link qualitative data or codes to values on a Likert-type or other pre-determined numerical scale and subsequently translate it into fuzzy-set values b. Use rubrics, coding schemes, or pre-determined qualitative classifications to assign fuzzy-set values |
| 3 | Pay more attention to the zeros in calibrated date | a. Construct the interview scheme such that all concepts are addressed during the interview b. Approach interviewees again with questions about the missing data c. Conduct sensitivity analyses |
| 4 | Explicitly delineate the choices made and present them clearly | a. Publish the raw data matrix b. Make large data sets available on the Internet or on demand c. Use a combination of explanations, illustrations and tables in the main text and (online) appendices |
| 5 | Conduct sensitivity analyses | a. Change the number of cases b. Change the conditions c. Rerun the analysis with a more extreme outcome |
Note. QCA = qualitative comparative analysis.
Acknowledgements
Some of the ideas in this article have been presented at the Fourth International QCA Expert Workshop in Zurich, Switzerland, in 2016. We would like to thank all participants for their useful comments and suggestions. Additionally, we thank Claude Rubinson, Federico Iannacci, Eva Thomann, Zsofia Tóth, and Peter Feindt for their constructive feedback.
Declaration of Conflicting Interests
The author(s) declared no potential conflicts of interest with respect to the research, authorship, and/or publication of this article.
Funding
The author(s) disclosed receipt of the following financial support for the research, authorship, and/or publication of this article: Barbara Vis’ research was funded by a VIDI grant from the Netherlands Organization for Scientific Research (NWO, Grant no. 452-11-005). Debora de Block’s research was funded by Climate-KIC. Climate-KIC is supported by the European Institute of Innovation and Technology (EIT), a body of the European Union.