
Abstract
Onwuegbuzie and Hitchcock (2015) provided an initial framework for conceptualizing and conducting advanced-level mixed analysis approaches. In the present article, we build on these efforts by altering the framework to focus on crossover analyses, which might help analysts see the various component steps that can go into crossover analyses and innovate their own forms of crossover work. In applying the framework, we specify three advanced-level crossover mixed analysis approaches: ethnographic crossover analyses, missing data crossover analyses, and nonverbal communication crossover analyses. The ideas presented here might inspire others to apply these crossover analysis approaches in their own work and/or to use the framework to innovate yet more crossover approaches.
This article expands on the mixed analysis literature by describing a conceptual framework based on Onwuegbuzie and Hitchcock’s (2015) work on developing crossover mixed analyses. The title crossover (Onwuegbuzie & Combs, 2010) come from using techniques from one tradition (e.g., quantitative) to analyse data associated with the other tradition (qualitative). Alternatively, a crossover analysis might entail using qualitative analytic techniques via what are essentially quantitative data and vice versa (Combs & Onwuegbuzie, 2010; Greene, 2008; Onwuegbuzie & Combs, 2010; Onwuegbuzie, Leech, & Collins, 2011; Onwuegbuzie & Teddlie, 2003). Crossover analyses could represent the primary analytic strategy for a study or could be used as part of component steps; this is because the degree of crossover analysis use should be dictated by the underlying research question. Because crossover analyses can be dynamic and entail multiple component steps, the purpose of this article is to introduce and to describe a framework for how these analyses can be conceptualized. We refer to it as the crossover analysis framework (CAF). This framework is captured by two tables and three figures presented later in this article. The CAF has the potential to help draw out the potential of crossover analyses and might help others innovate other types of crossover analyses. After presenting this framework, we describe three examples of crossover analysis approaches that represent what we deem to be novel and advanced ideas and that the CAF has helped us conceptualize. This represents a potentially important advancement to mixed methods analyses because using crossover analyses can support advanced and multilayered inquiry into social phenomena.
Having outlined our purpose, there are three caveats that permeate this article:
Readers who are unfamiliar with the mixed methods literature should consider reviewing some of the aforementioned citations; due to space constraints, this is not an introductory presentation.
The CAF promotes crossover analysis innovation; it is not a data analysis classification scheme and is not meant to be a unifying way of thinking about all forms of quantitative, qualitative, and mixed analyses.
There is reference to analytic complexity throughout this work, and some ideas, steps, and assumptions are described as being noncomplex, highly complex, and so on. It is critical to avoid conflating complexity with quality. Quality should be judged by whether a research question at hand can be adequately addressed by the analytic steps that have been taken.
The remainder of this article is structured into two parts. Part 1 entails describing the aforementioned framework for conceptualizing crossover analyses. Part 2 offers three examples of crossover mixed analysis approaches. Two of these approaches entail morphing longstanding analytic approaches (i.e., ethnography and missing data analyses) into crossover analyses. The third approach, nonverbal communication analyses, represents a more novel kind of crossover analysis that might be useful to the mixed methods research community. Taken as a whole, the framework and these three crossover analyses have the potential to expand further a mixed methods way of thinking (Greene, 2007, p. 20) into the realm of data analysis.
Part 1: A Framework for Conceptualizing Crossover Analyses
We developed the CAF based on Onwuegbuzie and Hitchcock’s (2015) work to promote crossover analysis conceptualization. This framework entails distinguishing (a) among analytical approaches, methods, and techniques; (b) consideration of the complexity of an analytic step (e.g., number of actions required), and (c) whether analyses represent a qualitative-dominant, a quantitative-dominant, or an (approximately) equal-status emphasis between the quantitative and the qualitative components. Crossover analyses inherently entail the mixing of multiple analytic steps, and we found it helpful to rely on framework-specific vocabulary to simplify conceptualization. Borrowing from Onwuegbuzie and Frels (2016), approaches, methods, and techniques represent different levels of analyses (with approaches being at the highest level, followed by methods and then techniques that fall within a given approach). Thus, these terms are not interchangeable within CAF, and their distinctions can be useful with respect to considering crossover analysis steps and features. When using this framework, whole systems of data analyses should be conceptualized as approaches. Such systems can be intermingled, especially in quantitative inquiry, but are generally used in isolation within qualitative work. This is because, in the field of qualitative research, most approaches are linked to specific research designs. For example, in ethnography, broad systems of analysis are domain analysis, theme analysis, taxonomic analysis, and componential analysis (Spradley, 1979). In grounded theory, constant comparison analysis (Glaser & Strauss, 1967) 1 can be thought of as an approach. In the field of quantitative research, approaches represent broad systems of analyses that include descriptive, exploratory, confirmatory, and inferential analyses. In quantitative research, it is common to use more than one approach within one study, but it is also possible to use, for example, descriptive analyses in isolation. That is, descriptive analyses typically are relegated to a component step in pursuit of an inferential question (e.g., one normally calculates means and standard deviations before applying parametric, inferential tests). There are, however, examples of studies of state-level data sets that include census-level information (e.g., teacher turnover analyses for a whole state; Lochmiller, Sugimoto, & Muller, 2016) wherein descriptive quantitative analyses are used as an overall approach because doing so is sufficient for addressing the research questions at hand.
In the field of mixed research, approaches tend to represent broad analytic systems such as concurrent mixed analyses (i.e., the qualitative and quantitative analyses are conducted independently but interpretations stemming from each set of analyses yield combined inferences, or what Tashakkori and Teddlie [1998] referred to as meta-inferences), sequential mixed analyses (i.e., mixing of qualitative and quantitative analyses occur in chronological order and are dependent on each other), conversion mixed analyses (i.e., one type of data is transformed into two types of data that can be analyzed using both in such a way that the original and the transformed data between them can be subjected to both qualitative and quantitative analyses), multilevel mixed analysis (i.e., qualitative and quantitative analyses are conducted at different levels of aggregation to address two or more interrelated research questions), fully integrated mixed analyses (i.e., mixing of quantitative and qualitative analyses are conducted in an interactive manner such that each set of findings inform one another; Teddlie & Tashakkori, 2009), and, of course, crossover mixed analyses (Onwuegbuzie & Combs, 2010).
Having reviewed what is meant by approaches in this framework, we turn to another term—methods. Methods represent the next level in the conceptual framework hierarchy, which are data analyses that represent part of an approach (or system). In qualitative research, analytical methods include Miles and Huberman’s (1994) array of within-case analyses and cross-case analyses. In quantitative research, measuring central tendency, dispersion/variability, distribution shape, analysis of variance, regression, factor analysis, and spatial analysis all represent types of methods. In mixed research, analytic methods include methods such as quantitizing, which entails transforming qualitative data into numerical codes that can, in turn, be subject to statistical analyses (Miles & Huberman, 1994; Sandelowski, Voils, Knafl, 2009; Tashakkori & Teddlie, 1998). Qualitizing, in contrast, entails transforming numerical data into narrative form, and then, these data can be subject to qualitative analyses (Tashakkori & Teddlie, 1998).
Finally, in the CAF, techniques represent a single step (or procedure) in the data analysis process. In quantitative research, techniques include the calculation of a mean, median, range, standard deviation, and so on. Typically, one or more quantitative analysis techniques and methods are essential components of a quantitative data analysis approach. For instance, calculation of a mean and standard deviation are common components of descriptive analysis approaches. Saldaňa (2016) describes 33 coding strategies (e.g., emotions coding, which is done to make inferences about participants’ underlying affects). These 33 strategies can each be considered as a technique. It is possible to use qualitative analysis techniques and methods with a different qualitative data analysis approach. For example, constant comparison analysis could involve emotion coding, and the analyst could still reasonably report that the constant comparison analysis was undertaken. Conversely, if any one qualitative data analysis approach—which, again, are whole systems (e.g., constant comparison analysis)—is used as part of another qualitative data analysis approach (e.g., domain analysis), then the integrity of the dominant qualitative data analysis approach could be compromised, at least to some degree.
In mixed research, techniques include (a) frequency analysis of themes (Miles & Huberman, 1994; Sandelowski et al., 2009; Tashakkori & Teddlie, 1998), (b) modal profile formation (i.e., these profiles should be thorough narrative descriptions and tend to describe groups of people using frequencies of different attributes), (c) average profile formation (i.e., these profiles rely on some average description of a context and/or group), (d) holistic profile formation (i.e., profiles based on the analyst’s overall impression), (e) comparative profile formation (i.e., comparing profiles against each other), and (f) normative profile formation (i.e., comparing some individual or group profile against a normative standard) (cf. Tashakkori & Teddlie, 1998). Typically, one or more mixed analysis techniques and methods are essential components of a mixed analysis approach. For example, the mixed analysis technique of frequency analysis of themes (i.e., representing a quantitizing method) is a component of conversion within mixed analysis approaches. Thus, in qualitative, quantitative, and mixed research, with respect to data analysis, techniques are nested within methods, which, in turn, are nested within approaches.
We contend that consideration of techniques, methods, and approaches; their overall complexity; and how they interact can inform the conceptualization and innovation of crossover analysis approaches. This is because when conceptualizing an approach, there are several components to consider, and it can help specify these components when attempting to develop a clear roadmap, which, in turn, can lay out steps that analysts might want to be aware of when planning and conducting their mixed methods research studies and associated analytic plans. Mapping out component steps might further inform future mixed analysis innovations.
To explain these ideas further, we present a matrix that merges our conceptualization of techniques, methods, and approaches with the complexity of related analytic steps so as to help analysts be prepared for and think through crossover analyses. Table 1 presents this matrix. This table is not designed to categorize all analytic approaches in the mixed, quantitative, and qualitative research traditions. For this reason, the cells in the matrix are not exhaustive and represent only examples.
Examples of Analytic Techniques, Methods, and Approaches Across Degree of Complexity.
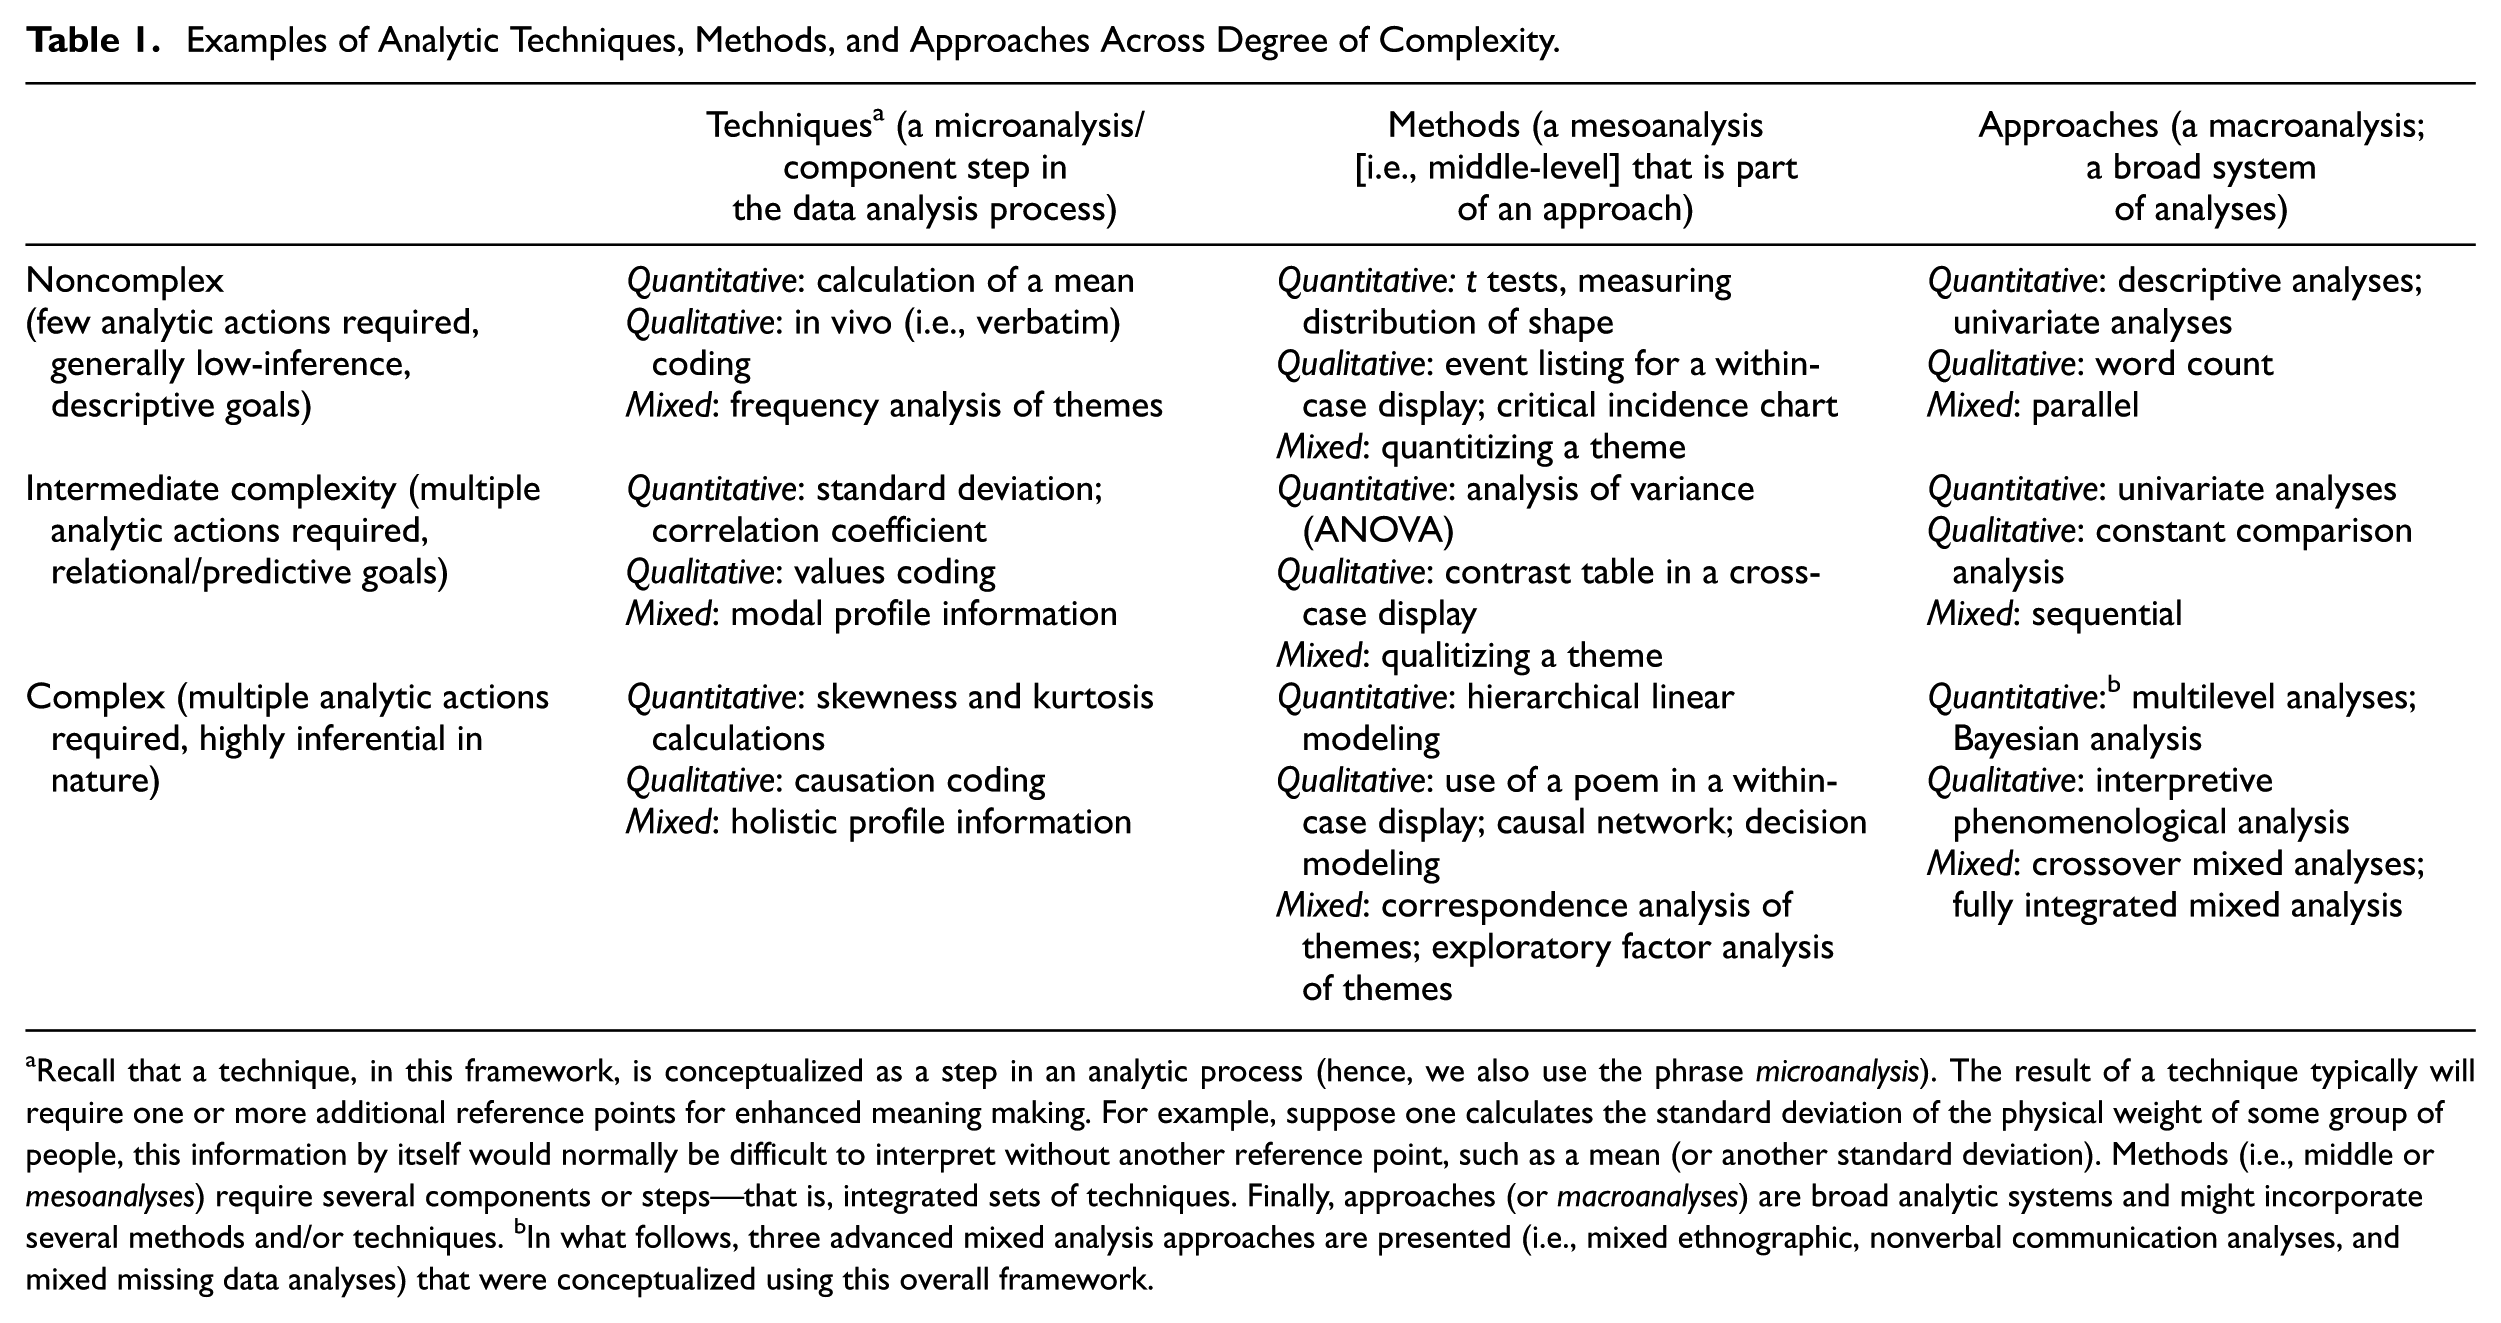
Recall that a technique, in this framework, is conceptualized as a step in an analytic process (hence, we also use the phrase microanalysis). The result of a technique typically will require one or more additional reference points for enhanced meaning making. For example, suppose one calculates the standard deviation of the physical weight of some group of people, this information by itself would normally be difficult to interpret without another reference point, such as a mean (or another standard deviation). Methods (i.e., middle or mesoanalyses) require several components or steps—that is, integrated sets of techniques. Finally, approaches (or macroanalyses) are broad analytic systems and might incorporate several methods and/or techniques. bIn what follows, three advanced mixed analysis approaches are presented (i.e., mixed ethnographic, nonverbal communication analyses, and mixed missing data analyses) that were conceptualized using this overall framework.
The framework also encompasses degree of integration, which is the degree to which qualitative and quantitative analytical assumptions are combined (i.e., mixed). The less that these assumptions are combined, the more likely that the overall analysis will represent a parallel analysis (i.e., with no or minimal mixing), which, arguably, will mean that the study is not a mixed methods one. In contrast, the more that these assumptions can be combined, the more likely that the overall analysis will represent some form of crossover mixed analysis. The level of complexity also distinguishes analysis approaches from each other. That is, one can conceptualize quantitative analysis and qualitative analysis as lying on a continuum of complexity, but this differs for qualitative and quantitative research. With respect to qualitative analysis approaches, level of complexity in CAF refers to the extent to which the analysis approach connects to an underlying qualitative research design and the related issue of the kinds of assumptions required to carry out the analyses. Figure 1 presents the qualitative analysis continuum (adapted from Onwuegbuzie et al., 2011) and provides some perspective on the notion of qualitative complexity based on assumptions of associated analytic work. As can be seen in this figure, the left side of the continuum captures approaches that reflect a weak use of qualitative analysis assumptions (e.g., word count). On the right side of the continuum are approaches that entail strong use of qualitative analysis assumptions. These assumptions can be thought of as qualitative conventions and expectations, such as the idea that understanding social phenomena might require capturing different, contradictory accounts that are nevertheless equally valid. This is consistent with a constructivist perspective. As another example, there is a subjective-objective reality that is co-created by researcher and participant(s), which is consistent with a participatory assumption that can inform qualitative analyses such as constant comparison analysis, discourse analysis, and conversation analysis. In the middle of the figure are qualitative analyses that entail the use of both quantitative and qualitative analysis assumptions, which are generally consistent with mixed research–based assumptions that include meaning is subjective, objective, and intersubjective; meaning is tentative and changing; justification comes from warranted assertability; and meaning is based on a physical reality interwoven with social constructions. Examples depicted in the figure that are listed here are qualitative comparative analysis and classical content analysis.
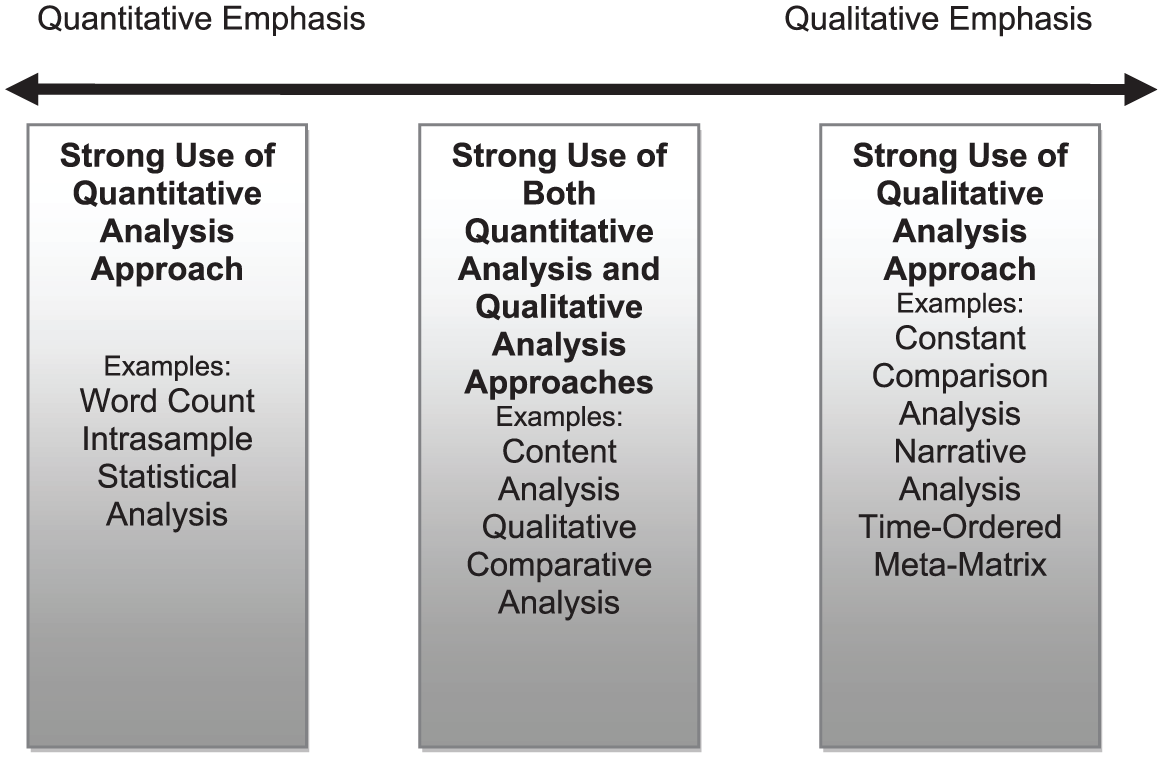
Qualitative analysis continuum.
Returning to Table 1, this table presents word count as a noncomplex qualitative analysis (cf. Miles & Huberman, 1994). This is because word count is not tied specifically to a qualitative research design. Although word count has been used to analyze qualitative data since at least 323 BCE (Onwuegbuzie & Denham, 2014), some researchers might argue that word count is a descriptive quantitative technique. In any case, there is nothing inherently problematic if readers would utilize the table and reach different conclusions about how they categorize different analyses. For our purposes, we see word count as a basic system for addressing questions that stem from talk data (e.g., interviews, focus groups). In contrast, ethnographic analysis and constant comparison analysis originated from specific qualitative research designs, namely, ethnography and grounded theory, respectively. Both analytic approaches require more complex considerations of objectivity, subjectivity, and intersubjectivity; yet, such analyses routinely are used to analyze data extracted via another qualitative research design. Consider, for example, that case study data could be analyzed using constant comparison analysis (Stake, 2005), suggesting a level of flexibility and limited need for highly specialized thinking. These approaches to analyses tend not to be as complex as are those analyses that tend only to be used to analyze data that have been extracted via the qualitative research design for which they were originally developed, such as interpretative phenomenological analysis (e.g., Larkin, Watts, & Clifton, 2006) used in interpretive phenomenological research (Heidegger, 1962), which require in-depth reading and specialized application.
With regard to quantitative analysis approaches, level of complexity in this framework refers to the number and type of underlying statistically oriented assumptions, including the following: population, sampling, distributional, general linear model, structural, and cross-validation assumptions. For instance, population assumptions and sampling assumptions yield lower levels of complexity than do other assumptions, such as cross-validation assumptions. Figure 2, adapted from Onwuegbuzie et al. (2011), presents the quantitative analysis continuum. As can be seen in this figure, descriptive statistics techniques that do not entail statistical modeling assumptions are on the left side of the figure. The next class of analyses, including exploratory analyses (e.g., exploratory factor analysis, multidimensional scaling, cluster analysis) are placed further to the right in the figure. This is because these analyses are exploratory and do not involve the direct testing of null hypotheses and, thus, do not yield p values. To the far right of the figure are more complex analyses that entail statistical modeling assumptions. These analysis types (i.e., descriptive, exploratory, inferential) increase in level of complexity from left to right in Figure 3, yielding eight levels of complexity as originally described by Onwuegbuzie et al. (2011) and Ross and Onwuegbuzie (2011). Within the set of inferential analyses, there is also an increase in the level of complexity based on the number of (a) actions to be taken, (b) independent and dependent variables involved, (c) levels (e.g., multilevel), and (d) whether variables have a bidirectional relationship. 2
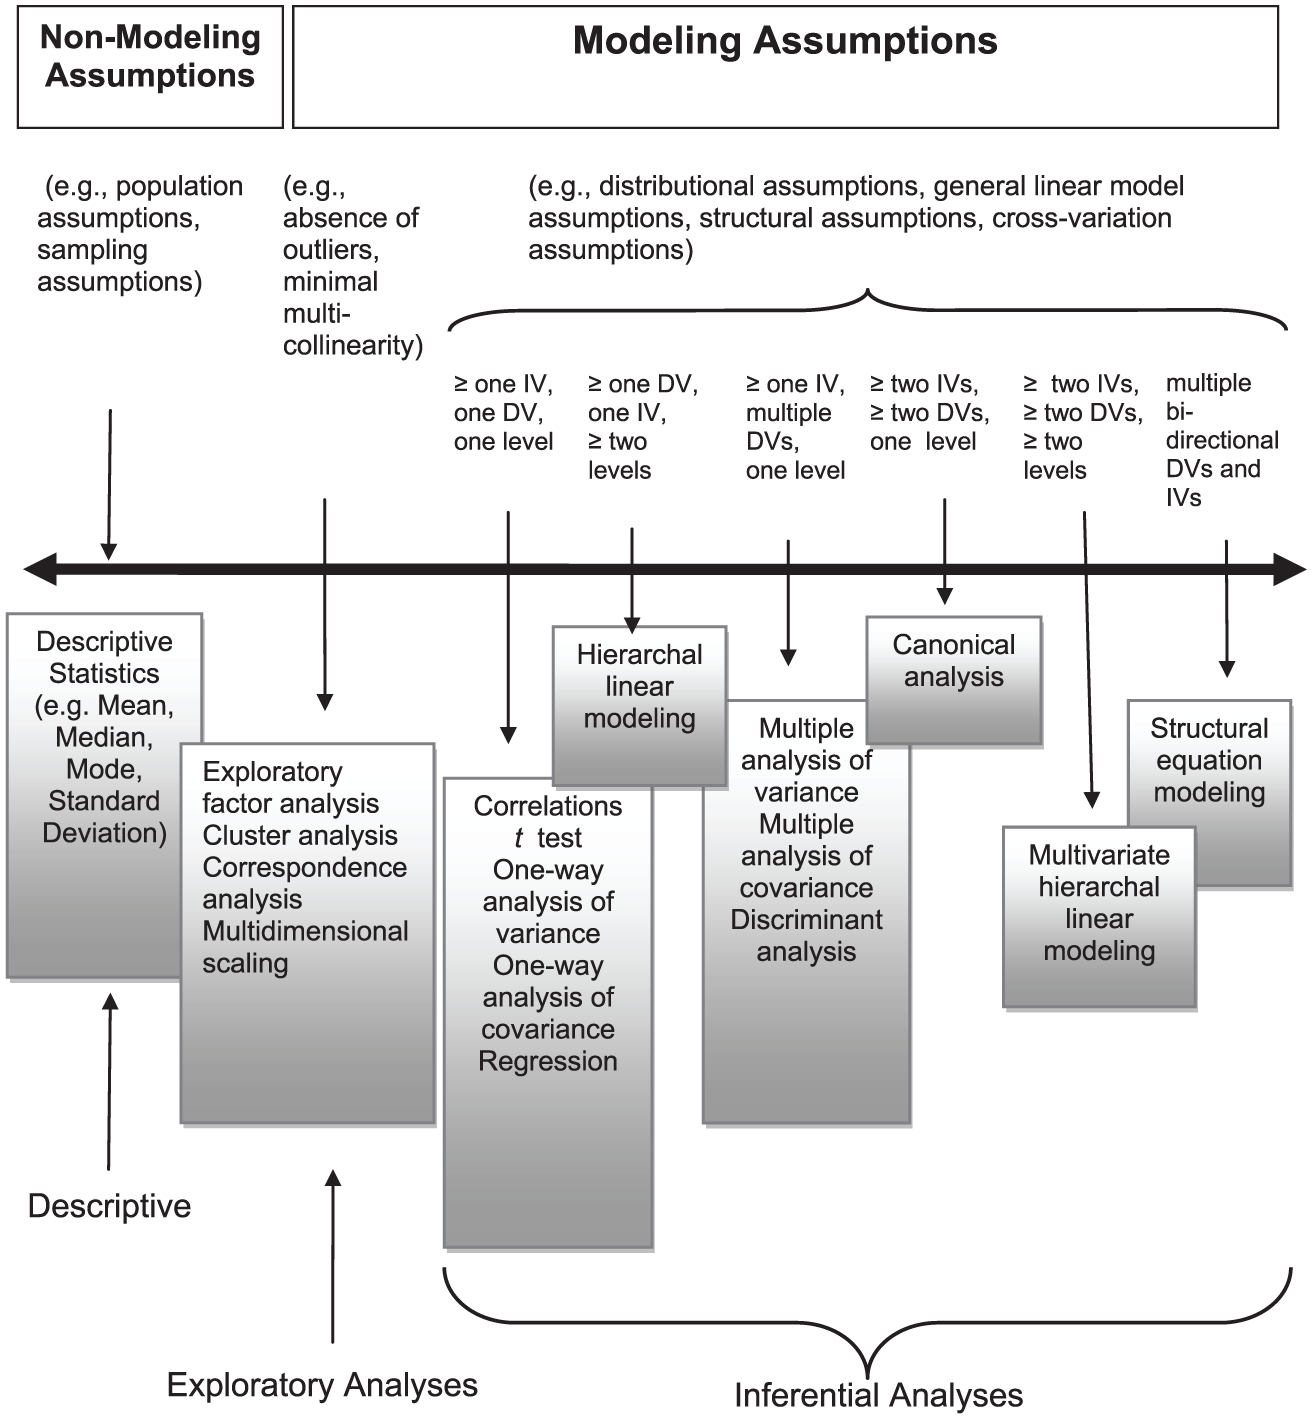
Quantitative analysis continuum.
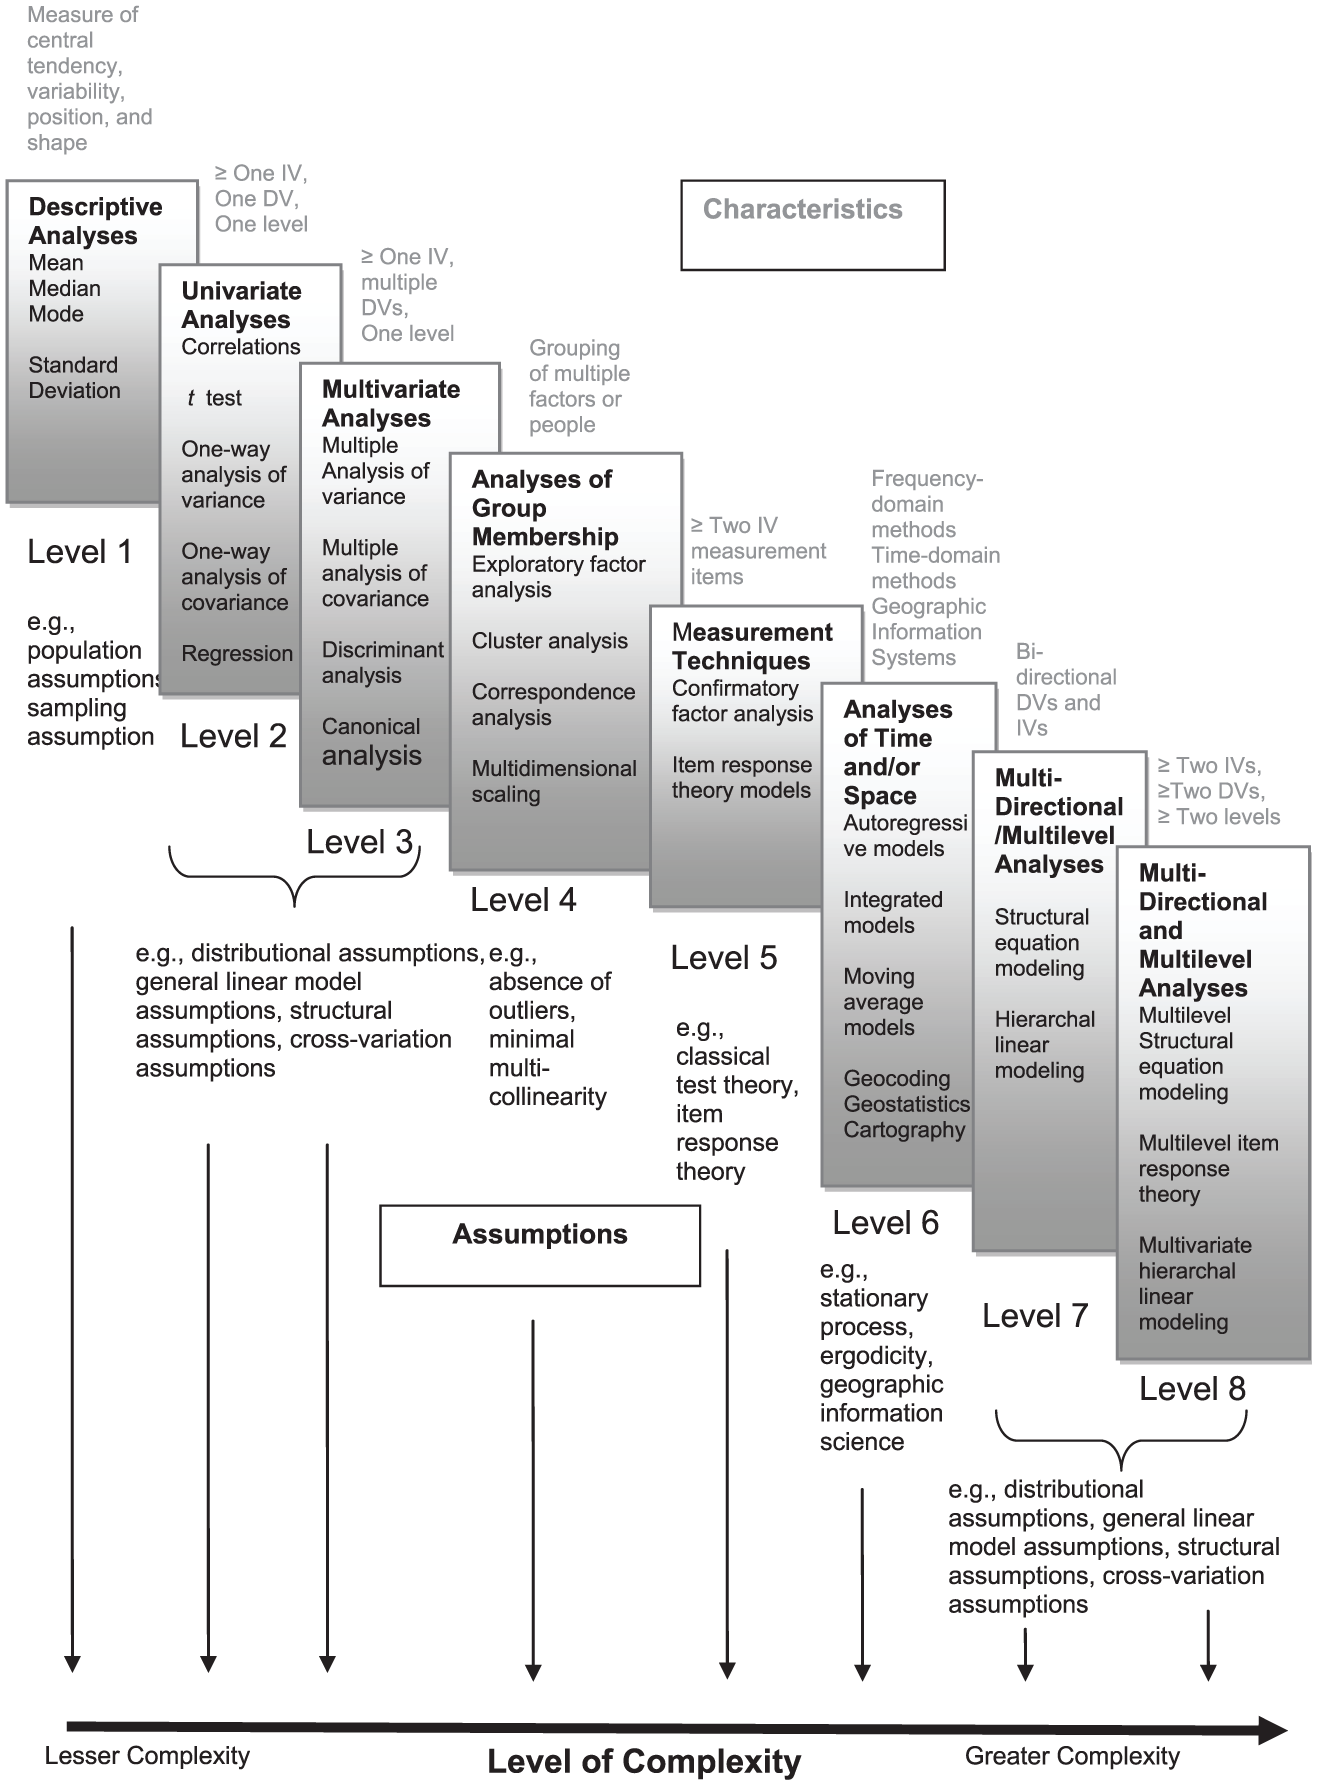
Quantitative analysis complexity continuum.
Crossover Nature of Mixed Analyses
Noncrossover Mixed Analyses
Understanding crossover mixed analyses can be facilitated by first reviewing noncrossover analyses. Onwuegbuzie and Combs (2010) describe how noncrossover mixed analyses—which can represent an effective way of conducting mixed analyses, depending on the research question—involve collecting both types of data (i.e., quantitative data and qualitative data) and the analysis of each data type using an analysis that represents the same research tradition—what we refer to as a within-tradition analyses. Simply put, a noncrossover mixed analysis represents a traditional mixed analysis that involves quantitative analysis of quantitative data and qualitative analysis of qualitative data. As such, mixed methodology researchers who exclusively conduct noncrossover mixed analyses maintain a conventional binary distinction between qualitative and quantitative analysis, which may be based on the assumptions that (a) qualitative and quantitative analyses are unique and discernable from each other, (b) qualitative and quantitative analyses are different and thus should be conducted separately, (c) quantitative data require exclusively quantitative analyses, (d) qualitative data require exclusively qualitative analyses, (e) inferences stemming from the quantitative data stem from the quantitative analysis, and (f) inferences stemming from the qualitative data stem from the qualitative analysis (Onwuegbuzie et al., 2011). Thus, only after inferences from the quantitative analyses and inferences from the qualitative analyses have been obtained can meta-inferences be obtained. Meta-inferences require that qualitative and quantitative findings be integrated into either two distinct sets of findings or an overall, coherent whole (Tashakkori & Teddlie, 1998).
Although, in general, noncrossover mixed analyses are less complex than are crossover mixed analyses, which we describe later, they are still typically going to be more complicated than analyses in quantitative-only or qualitative-only studies (i.e., monoanalysis; Onwuegbuzie, Slate, Leech, & Collins, 2007; Onwuegbuzie, Slate, Leech, & Collins, 2009). To demonstrate this point, noncrossover analyses require competencies in different research traditions, and there is a multitude of various combinations of analyses that can lead to noncrossover analyses. For example, consider the number of options identified in related literature:
Onwuegbuzie et al. (2011) documented 58 classes of quantitative data analysis techniques
Onwuegbuzie and Denham (2014) identified 34 qualitative data analysis approaches
Miles and Huberman (1994) described 19 within-case analysis methods and 18 cross-case analysis methods
Saldaňa (2016) outlined 33 coding techniques.
This can all lead to an impressive number of combinations that can be further increased when mixed research studies use at least two or more quantitative data/qualitative analysis approaches, methods, or techniques. As Johnson and Onwuegbuzie (2004) stated, “Ultimately, the possible number of ways that studies can involve mixing is very large because of the many potential classification dimensions” (p. 20). On this basis alone, there can be value in frameworks for conceptualizing and conducting advanced-level mixed analysis approaches.
Crossover Mixed Analyses
As noted previously, in a crossover mixed analysis, qualitative data can be analyzed utilizing techniques traditionally associated with the quantitative tradition and vice versa. This between-tradition analysis yields a higher degree of quantitative and qualitative integration (although such higher integration is not necessarily superior) than would be the case if a mixed researcher uses noncrossover analyses (Onwuegbuzie & Combs, 2010). Examples of crossover analyses include (a) conducting an exploratory factor analysis (i.e., quantitative analysis) of themes or even words emerging from a qualitative analysis (e.g., constant comparison analysis) and (b) constructing narrative profiles (i.e., qualitative analysis) from quantitative data. Indeed, crossover mixed analyses can be used to address the nine purposes of analysis described by Onwuegbuzie and Combs (2010): reduce, display, transform, correlate/associate, consolidate, compare, integrate, assert, and/or import data.
As seen in Table 1, we consider crossover analyses to represent a complex form of mixed analyses, and we see them as approaches that will generally include several component methods and techniques. Their complexity is derived, in part, from assumptions that differ from those that would seem to be associated with noncrossover analyses, namely,
qualitative and quantitative analyses are not necessarily distinguishable from each other
any differences between the two traditions (i.e., quantitative and qualitative) do not necessarily require exclusive quantitative analysis of quantitative data and qualitative analysis of qualitative data
the two traditions can address similar research questions (Onwuegbuzie et al., 2011)
An implication here is that crossover mixed analyses necessitate the mixing or combining of paradigmatic assumptions and stances with each tradition. Thus, crossover analyses are more integrated than are non-crossover analyses, leading Teddlie and Tashakkori (2009) to declare that “we believe that this is one of the more fruitful areas for the further development of MM [mixed methods] analytical strategies” (p. 281).
Dimensions of Crossover Mixed Analyses
Crossover mixed analyses can be thought of as being quantitative-dominant, qualitative-dominant, or equal-status (Onwuegbuzie & Combs, 2010; Onwuegbuzie & Hitchcock, 2015). Each of these types of crossover mixed analyses is described in the following sections. These ideas are summarized in Table 2.
Linking Techniques, Methods, and Approaches With Quantitative-Dominant, Qualitative-Dominant, and Equal-Status Inquiry.
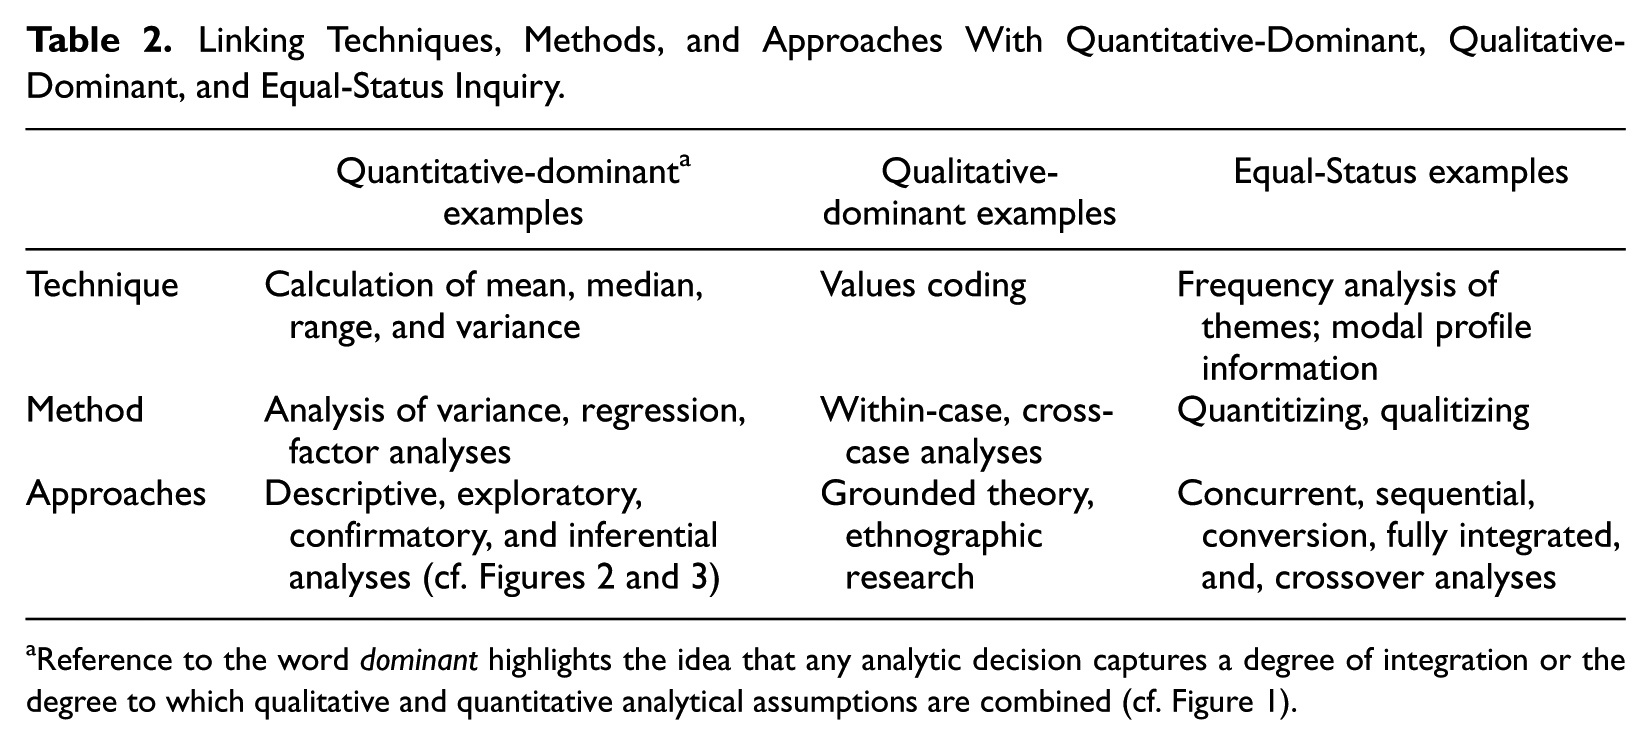
Reference to the word dominant highlights the idea that any analytic decision captures a degree of integration or the degree to which qualitative and quantitative analytical assumptions are combined (cf. Figure 1).
Qualitative-dominant crossover analyses
Qualitative-dominant crossover mixed analyses may involve the researcher taking a stance that is constructivist, critical theorist, or participatory—or any other stance associated with the qualitative research tradition—in terms of the research process in general and the analysis process in particular. Researchers simultaneously operate under the belief that including quantitative inquiry can help them better address the research question(s) at hand. The lowest degree of analysis integration would involve combining descriptive statistics with one or more sets of qualitative analyses (i.e., Level-1 quantitative analysis [see Figure 3] and noncomplex analyses [cf. Table 1]). A higher degree of integration could involve, for example, using exploratory analysis techniques (i.e., Level-4 quantitative analysis) with one or more sets of quantitized emergent themes 3 (see, e.g., Onwuegbuzie, 2003). At the highest degree of integration in the CAF, the qualitative-dominant crossover mixed analysis would involve combining inferential statistics with one or more sets of qualitative analyses (i.e., Levels 2-3, 5-8).
Quantitative-dominant crossover analyses
Quantitative-dominant crossover mixed analyses may involve the analyst adopting a postpositivist stance (recall the explanation for Figure 1) while, at the same time, operating under the belief that the inclusion of qualitative inquiry can better address the research question(s) at hand. The most basic analysis integration would involve combining qualitative analyses that generate some type of frequency data (e.g., word count associated with an interview transcript; frequency of times a respondent produced words captured by a code) with one or more sets of inferential analyses (e.g., a t test). In contrast, higher degrees of analysis integration involve mixing one or more sets of Level-8 inferential analyses with the more complex types of qualitative analyses such as interpretative phenomenological analysis, which would entail complex integration.
Equal-status crossover analyses
As Onwuegbuzie and Hitchcock (2015) described, these forms of analyses may entail the researcher adopting a flexible stance (e.g., pragmatism [cf. Biesta, 2010], pragmatism of the middle [Johnson & Onwuegbuzie, 2004], pragmatism of the right [Rescher, 2000], pragmatism of the left [Maxcy, 2003], and dialectical [Johnson, 2017]/critical dialectical pluralism [Onwuegbuzie & Frels, 2013]). The researcher also would believe that using both qualitative and quantitative data analyses can optimally address the research question(s) at hand. Equal-status crossover analyses could combine complex inferential and qualitative analyses (i.e., Levels 5-8). This approach to analysis, of course, would require philosophical clarity (i.e., “the degree that the researcher is aware of and articulates her/his philosophical proclivities in terms of philosophical assumptions and stances in relation to all components, claims, actions, and uses in a mixed research study”; Collins, Onwuegbuzie, & Johnson, 2012, p. 855). A lack of such clarity could lead an analyst to adopt poor analytical practices such as by ignoring assumptions associated with the qualitative and quantitative analyses. Onwuegbuzie and Hitchcock (2015) argue that spatial analysis can be conceptualized as a form of equal-status crossover mixed analysis because geographic information systems involve the use of spatial data (quantitative information about distance, trend, dimension) to inform a qualitative understanding of context. A qualitative perspective could be used when applying a nonnumeric perspective for interpreting space (e.g., stakeholders’ aesthetic perception of a space). In the second part of this article, we introduce a detailed example of an equal-status crossover analysis.
Part 2: Framework Use for Identifying and Advancing Crossover Approaches
Recall that the mixed methods framework that we described entails the following overall considerations: (a) whether an aspect of the analysis should be conceptualized as an approach, method, or technique; (b) the level of complexity (which we list as noncomplex, intermediate, and complex; see also Figures 2 and 3); and (c) paradigmatic emphasis—be it qualitative dominant, quantitative dominant, or equal status. Having described these three elements, we outline three different crossover approaches in the remainder of this article. Specifically, we outline how ethnographic analyses can, through this framework, be conceptualized as a qualitative-dominant crossover mixed analysis approach, the handling of missing data as a quantitative-dominant crossover mixed analysis approach, and nonverbal communication analysis (NVCA) as an equal-status crossover mixed analysis approach. Potential applications of these approaches are described throughout the remainder of this article and summarized in the conclusion section.
Ethnographic Analysis
Ethnographic work—which we believe has realist and constructivist roots—has been conceptualized as mixed methods investigations in the past (e.g., Nastasi & Hitchcock, 2016); yet our interpretation of the social science research literature is that ethnographic work is generally classified as a form of qualitative inquiry. This designation perhaps occurs because so many questions tend to be emergent, interpretive, and pursued in naturalistic settings. However, we do think of it as a broad approach that involves the use of almost any number of methods and techniques, providing the analyst with an opportunity to apply CAF. This is because ethnographic work can be viewed in terms of its goals, which, ultimately, entail systematically studying cultural circumstances (Nastasi & Hitchcock, 2016), rather than as a distinct methodology or a set of methods. In this sense, any combination of methods and techniques, such as surveys, interviews, focus groups, archival analyses, observations, and mapping strategies, may be used by ethnographers, and any application of these can be a mixed methods variant. Indeed, even a randomized controlled trial (RCT) can be used in ethnographic pursuits in the context of a program of research that includes multiple substudies. As an example, Nastasi et al. (2010) used a series of qualitative research techniques (interviews, observations, archival analyses) across several stakeholder groups (school staff, students, parents) to identify sources of stress among adolescents in Sri Lanka. Then, they developed a mental health program that could be delivered in schools to address student needs. In addition, they used qualitative research methods to generate a series of culturally relevant measures of stress and coping. This effort led to the capacity to develop an RCT to test the causal impacts of the mental health program. Hence, ethnography could be conceptualized as a broad approach, distinguished by a focus on culture that can be used by a broad array of methods and techniques, which is made possible via a mixed research tradition. With that stated, ethnography does not presuppose the use of mixed research approaches, and therefore, ethnographic researchers would not necessarily use crossover analyses. With CAF, however, we argue that it is easier to see how to engage in mixed methods thinking when involved in ethnographic inquiry and then more readily to use crossover analyses.
To provide an example of a kind of qualitative-dominant crossover mixed analyses that can be used in ethnographic work, consider elicitation techniques (Borgatti, 1999; Spradley, 1979), which are typically undertaken to understand how members of a culture conceptualize a given construct. Familiar procedures are freelists and pilesorts wherein participants are asked to share their thoughts about a construct and to categorize its different elements, respectively. Interestingly, this suggests a high degree of quantitative and qualitative integration and a natural point for crossover analysis methods (with at least two techniques) because one could typically quantify what participants share about their culture during elicitation. There is a variant of the elicitation technique that can be subjected to mixed analyses, called the ecomap (Nastasi et al., 2010; Nastasi & Hitchcock, 2016). The ecomap, or life ecomap, activity in this line of research elicited information from Sri Lankan children about their familial, school, and other personal relationships. Children drew pictures of themselves and then figures of other people such as parents, teachers, friends, and others with whom they believed that they had important relationships within given contexts (e.g., schools, home). Then, the children were asked to depict whether they perceived the relationship to be stressful by using a line with a series of X marks (i.e., XXXXX); supportive, using a solid line (—); or both. Children’s production of ecomaps was viewed to be both developmentally and culturally appropriate, allowing for the description of relationships that entail complex wording.
These elicitation techniques could be used as a basis for obtaining additional qualitative data (one can interview children about their drawings and the reasons why they depicted a relationship as being stressful, supportive, or both), allowing for a kind of sequential mixed approach. But there is a crossover analysis opportunity here. Current plans are to use quantitative analyses by generating ecomap scores (i.e., a form of quantitizing) based on the number of relationships depicted and their valance (i.e., stressful, supportive, ambivalent). Therefore, crossover analyses can entail quantifying an ecomap score (representing a technique) and correlational methods to understand whether certain types of child characteristics are associated with ecomap scores and in what context (e.g., school, family, peer group) statistical associations were generated. Furthermore, ecomap scores can serve as dependent variables in statistical investigations to determine whether interventions have influence over the number of relationships that children consider to be important and the number that they perceive to be stressful. Findings might inform future efforts to facilitate coping skills to help children navigate these relationships.
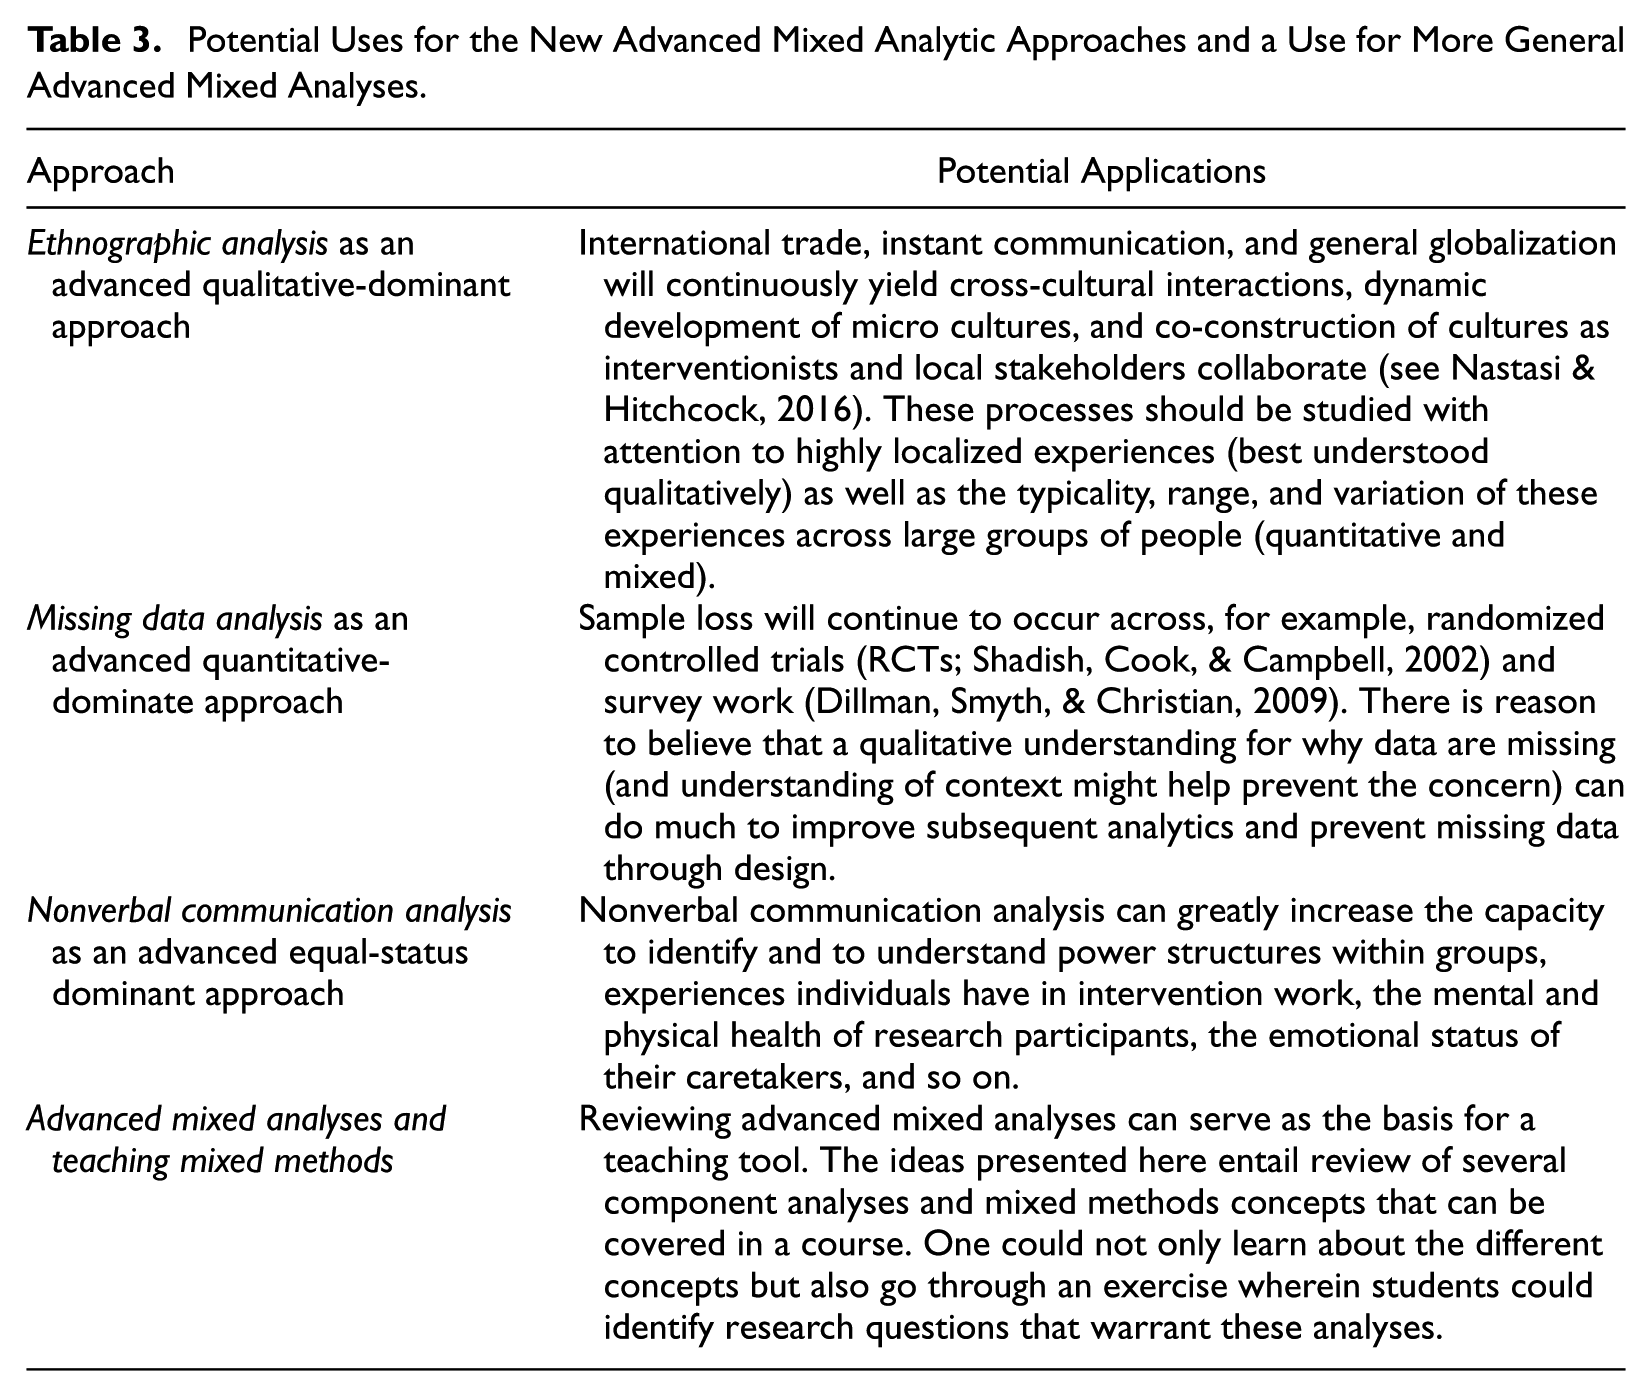
A key point is that quantitative analyses can be used to help understand ecomap scores that carry elements of emergent, flexible, and interpretive inquiry that is characteristic of general elicitation techniques, yielding one of many examples of a crossover analysis within the overall approach. This, of course, requires integration of qualitative and quantitative thinking, and related component analyses are not easily distinguishable from each other. In other words, ethnography can be recast as a crossover analysis approach with several component methods and techniques. We think that the general goals and history of ethnographic work would make this crossover analysis approach to be of the qualitative-dominant variety. Seeing ethnographic work through such a lens might encourage continued use of both quantitative and mixed analyses better to understand questions of culture and the dynamic co-construction of culture over time. Of course, we do not suggest that ethnographic work represents a new approach; rather, CAF has the potential to push ethnographic analyses in new directions. Related ideas might be to innovate crossover application in, for example, network maps and social network analyses (e.g., Edwards, 2010; Herz, Peters, & Truschkat, 2014), a process that we hope can be facilitated by CAF. See Table 3 (above) for thoughts on other applications that have become more easily pursued when thinking along the lines of crossover analyses.
Potential Uses for the New Advanced Mixed Analytic Approaches and a Use for More General Advanced Mixed Analyses.
Missing Data
Now, we turn to the idea of conceptualizing missing data as a problem to be handled as a quantitative-dominant crossover mixed analysis approach. The loss of data, either from sample attrition or failing to collect one or more data points, yields two problems: (a) lower statistical power and (b) potentially biasing analytic estimates. Considerable advances have been made in the degree to which studies can handle missing data (Enders, 2010), as long as researchers can diagnose the mechanism behind the missing data. As is the case with ethnography, missing data analyses normally include several component methods and techniques, including description (Where is there missingness and with whom?), interpretation (Why are there missing observations?), and prediction (What might the missing scores be?).
In the statistical realm, missing data mechanisms generally are classified as (a) missing completely at random (MCAR), (b) missing at random (MAR), and (c) missing not at random (MNAR). MCAR is the most desirable of these mechanisms because there is no systematic process underlying the missingness (Enders, 2010) so that the likelihood of missing data on any given variable cannot be predicted by another variable. Data would be MCAR when, for example, only a random subsample of all research participants are measured to reduce study costs. In the absence of random sampling, MCAR can be difficult to justify. However, MAR is a more tenable assumption that can be invoked when the likelihood of missing data is not related to the variable with missing data itself, after controlling for given observed variables. For example, suppose that in the context of a study dealing with some reading intervention, there are missing posttest scores. MAR can be invoked if there is reason to believe that the missingness is unrelated to reading achievement itself but still might be related to other observed variables such as gender or socioeconomic status. MAR and MCAR yield missing data scenarios in which modern methods of missing data analyses often can be used to estimate the value of missing information. MNAR occurs when missing data are related to missing data from the variable itself. If, for example, higher achieving children were more likely to complete a reading posttest than were others, then the data are MNAR. With respect to estimating the values of missing information, MNAR is the most problematic (holding equal other considerations, e.g., the amount of missing data).
Through CAF, we think that the handling of missing data could be enhanced by deploying a multiparadigmatic lens. Conceptualizing the identification, diagnosis, and treatment of missing data as a kind of approach (i.e., system that includes several methods and techniques) can promote vigilance and inquiry into reasons for why data are missing. If so, qualitative methods may be used to yield more informed conceptualization of the reasons for attrition and other forms of missing data (e.g., study participants not responding to given survey items). Suppose data are missing in the context of an RCT. The key question would be ascertaining whether participants attrited for reasons related to treatment assignment or whether standard mobility (e.g., students left a district because of a change in a parent’s job) was at work. It would also help know whether the treatment itself might have contributed to sample loss (Shadish et al., 2002). A primary but noncomplex quantitative technique is to analyze how much data are missing and where (e.g., with what groups). At a method level, one can use regression to predict and to explain where missingness occurs, and one can use missing data procedures to impute likely missing values before moving on to other analyses.
At an approach level, we think that the handling of missing data can be further enhanced via a crossover analysis, wherein qualitative understanding of the reason for why data are missing can be useful. Shadish et al. (2002) argued that it can be valuable to conduct interviews with research participants when they leave a study to understand why. We envision expanding on this advice by using a crossover analysis approach that blurs a strict quantitative-qualitative dichotomy. Recall Table 1. For example, not only might one use a word count with exploratory interview data to help understand the most commonly stated reasons for attrition but also one could statistically analyze text data for associations among words to gain greater insight into rationales for leaving or remaining in a study. Furthermore, any associations found might be moderated by different participant characteristics. The trustworthiness of such work could be bolstered by member checks of not only the accuracy of transcribed interview data, but sample members might also help researchers interpret statistical associations that help explain the reasons for study attrition. In this sense, qualitative techniques are used to help us interpret quantitative information (e.g., use interviews to understand better why most females provided dependent variable data but a significant proportion of males failed to do so).
Modern methods for handling missing data might be enhanced from in-depth understanding of which variables predict study dropout. Furthermore, if missing data occur at the item level on a measure (not unit attrition but still a missing data problem), qualitative research approaches might offer effective methods for understanding the problem by interviewing a subset of respondents to determine why some items tended to be completed and others not (e.g., perhaps measures were too long, asked invasive questions, respondents did not know answers). These are tasks that can be handled after a study, but it seems desirable to attempt to obtain related information when study participants might be more available, responsive, and have better memories. Furthermore, by adopting the notion of emergent design, a detailed understanding of the reasons for missing data might open the door to new forms of inquiry. Phenomena, constructs, and interventions should, in principle, be better understood if researchers understand why research participants leave a study (or not), why participants refuse to respond to a survey item, and if certain characteristics predict whether information is missing.
Adopting a mixed methods perspective to missing data analysis also can inform qualitative-dominant crossover analysis. In qualitative inquiry, there is value in specifying and dealing with data that were meant to be collected but were not. For example, how many participants missed interviews? Were certain questions avoided or yield evasive answers? What documents cannot be located (and why)? Frequency analyses of these issues might inform the conduct of and interpretation of ongoing qualitative inquiry. Perhaps CAF can help other innovators work out a mixed analysis approach. With that point in mind, we see the modern use of the diagnosis and treatment of missing data, paired with qualitative methods and techniques, as a quantitative-dominant crossover approach that can strengthen how researchers handle missing data.
Nonverbal Communication Analysis
The analysis of nonverbal communication—in both off-line and online spaces—can be thought of as an approach with several component methods and techniques (Onwuegbuzie & Abrams, in press). Surprisingly, this analysis is underutilized by many researchers across the social, behavioral, and health science fields. This might be due, in part, to matters of data collection logistics and potential for voluminous amounts of data that could be gained from these approaches. Nevertheless, as we will demonstrate, there is utility in using this mixed analysis approach.
A common goal of many qualitative researchers is to capture the voice of the participants (e.g., Bleakley, 2005). However, in so doing, it appears that the nonverbal communication of study participants is not captured by the vast majority of qualitative researchers. In support of our contention, Denham and Onwuegbuzie (2013) conducted a prevalence study of the use of nonverbal communication data in The Qualitative Report over a 22-year period. They reported that only 24% of articles mentioned nonverbal communication, and in most cases, related information was offered in only one or two sentences. Alongside qualitative researchers, quantitative researchers and mixed researchers also underutilize the analysis of nonverbal communication data. With respect to quantitative research, for example, for the journal of Educational and Psychological Measurement, an exclusively quantitative-based journal devoted to the study of measurement theory, problems, and issues, in among the more than 1,000 articles published over its 73-year history, only 117 articles (less than 10%) discuss nonverbal communication. With regard to the Journal of Mixed Methods Research, of the 237 (noneditorial and media review) articles published from its inception through the first issue of 2019—the current issue at the time of writing—only 17 works (7.17%) discuss nonverbal communication to any degree.
Lack of Guidance for Attending to Nonverbal Communication
This lack of attention given to nonverbal communication likely stems from the lack of guidance from scholars in positions of authority (e.g., editors, writers of publication manuals) who rarely advocate the analysis of such data. For instance, in the sixth edition of the Publication Manual of the American Psychological Association (American Psychological Association, 2010), the word nonverbal does not appear once. Similarly, there is no mention of nonverbal communication in the “Standards for Reporting on Empirical Social Science Research in AERA Publications” (American Educational Research Association, 2006). 4
Thus, because the analysis of nonverbal data has the potential to increase meaning, Onwuegbuzie (2016) conceptualized NVCA, and we further promote understanding of this analysis approach via CAF. NVCA involves the analysis of numerous nonverbal cues. For example, the following nonverbal cues, each of which can be seen as a kind of method via CAF, can be examined using both quantitative and qualitative analyses:
Proxemics includes the physical distance between researcher and participant(s), or among participants (e.g., quantitative analysis, including measuring the physical distance; and qualitative analysis, including identifying the antecedents to any changes in proxemics or examining the reaction to changes in proxemics).
Chronemics includes the use of pacing of speech (e.g., quantitative analysis, e.g., measuring the number of words spoken per minute; and qualitative analysis, e.g., the effect of the speakers’ rate of speech on the listener’s ability to understand what is being stated) and length of silence in conversation (e.g., quantitative analysis, e.g., measuring the time that elapses between the utterances of a participant, or between the researcher’s question and the participant’s response; and qualitative analysis, e.g., observing how the participant acts during moments of silence).
Kinesics involves body movements or postures (e.g., quantitative analysis, e.g., the angle of the participant’s torso when talking; and qualitative analysis, e.g., the types of body movements displayed by the participant).
Haptics involves the use of touch (e.g., quantitative analysis, e.g., counting the number of times the participant touches herself or himself or another person; and qualitative analysis, e.g., assessing the reaction of a participant to touching or being touched by someone else).
Paralinguistics includes all changes in pitch, volume, and quality of voice (e.g., quantitative analysis, e.g., measuring the noise level of a location in decibels; and qualitative analysis, e.g., evaluating the tone of a participant’s voice).
Oculesics involves the use of eyes by a participant (e.g., quantitative analysis, e.g., measuring the number of times the participant blinks per minute as an indicator of levels of stress during an interview; and qualitative analysis, e.g., observing the tendency for gaze aversion of a participant as an indicator of shyness).
Olfaction involves the kind and degree of smell detected (e.g., quantitative analysis, e.g., determining the number or proportion of participants who appear to be affected by a certain smell; and qualitative analysis, e.g., observing the reaction of participants to a certain smell).
Gestation involves taste (e.g., quantitative analysis, e.g., determining the number or proportion of participants who appear to like the taste of a certain food or drink; and qualitative analysis, e.g., observing the reaction of participants after tasting a certain food or drink).
For example, take how a researcher conducted an interview wherein a respondent engaged in a fast rate of speech (chronemics), maintained what seemed to be distant physical spacing (proxemics), and indicated stress by blinking often and averting gaze (oculesics). These features of an interview experience are ones that qualitative researchers should be trained to observe because they could otherwise miss subtle cues and possibly over- or underemphasize them depending on the psychological state of the interviewer, familiarity with context, and so on. However, if an interview were videotaped and such cues were tracked and coded, then nonverbal communication data might yield a number of new interpretations and even findings.
In our own work, we have engaged in a number of cross-cultural experiences and learned to appreciate how smell, observations about food and drink consumed by a participant, behaviors expressed during meals, and emoticons or emojis used in online communication can yield rich information about one’s status within her or his community and the like (Onwuegbuzie & Abrams, in press). Also, we have learned that a change in a researcher’s familiarity with the local research participants can inform the next steps in the research process such as in the case of grounded theory that is characterized by theoretical sampling, which involves “the sampling of additional incidents, events, activities, populations, and so on [that] are directed by the evolving theoretical constructs” (Schwandt, 2007, pp. 131-132). It would be interesting to use observational codes to attempt to quantify nonverbal communication information, should such data be particularly relevant to a research endeavor. Learning to look for cues like the number of people present at a meal, or whether a large number of people in a study appear to be indifferent to a specific smell, can potentially yield some insights in a number of research studies.
Analyzing Emotions
An NVCA also might involve analyzing the emotions of study participants (Onwuegbuzie, 2016). For example, a researcher could use Ekman’s (1999)Neurocultural Model of Facial Expression to examine which of the following Ekman’s 15 emotions associated with innate facial expressions that are distinguishable from each other across cultures are displayed: relief, sadness/distress, amusement, guilt, anger, contempt, contentment, disgust, embarrassment, excitement, fear, sensory pleasure, pride in achievement, satisfaction, and shame. NVCA also might involve using McNeill’s (1992) classification scheme of five gestures:
Iconics, gestures (likely hand gestures but not necessarily) that depict movements or the movements of objects
Metaphorics, visual gestures that are meant to help express thoughts and ideas
Beats, gestures that are meant to help convey abstract ideas by distinguishing words or phrases from each other
Deictics, which entail some abstract level of pointing)
Emblems, which are gestures that indicate specific linguistic labels
NVCA also can involve using Krauss, Chen, and Chawla’s (1996)Typology of Nonverbal Behaviors that represent nonverbal communication that lie on a continuum of lexicalization—specifically, adapters (which, typically, do not depict meaningful gestures, e.g., scratching of an arm), symbolic gestures (e.g., hand gestures like a thumbs up or overt facial expressions), and conversational gestures (which are behaviors that accompany utterances).
If reliably captured, all these aspects of nonverbal information can be captured using techniques (e.g., frequency) and analyzed via quantitative approaches that can represent complexity. However, NVCA also can be accomplished using qualitative or mixed analyses, although this last option might be optimal (Onwuegbuzie, 2016). Moreover, Denham and Onwuegbuzie (2013) demonstrated that mixed analysis techniques could be used to combine the analysis of nonverbal and verbal data for one or more of the following five purposes: (a) corroborate speech narrative (i.e., triangulation), (b) capture underlying messages (i.e., complementarity), (c) discover nonverbal behaviors that contradict the verbal communication (i.e., initiation), (d) broaden the scope of the understanding (i.e., expansion), and (e) create new directions based on additional insights (i.e., development). Furthermore, nonverbal communication data can be collected a priori (e.g., looking for contradictions between the nonverbal and the verbal data from the onset), a posteriori (i.e., determining how the nonverbal and the verbal communication data relate to each other as the data analysis emerges), or iteratively (i.e., combining a priori and a posteriori analyses) (Denham & Onwuegbuzie, 2013). In this sense, NVCA can be a powerful equal-status crossover mixed analysis approach because in these examples there is reasonably equivalent weight given to quantitative (e.g., how many nonverbal behaviors are found, for whom, and when) and qualitative (interpreting why) information, with a mixed methods lens permeating the analyses. Again, Table 3 lists a few potential uses for these new crossover analysis approaches.
Conclusions
Onwuegbuzie and Hitchcock (2015) used a CAF for classifying and outlining three qualitative-dominant, three quantitative-dominant, and one equal-status crossover mixed analysis approaches. This article updates this work by specifying a CAF and then outlining how ethnographic analysis can be conceptualized as a qualitative-dominant approach, how missing data analysis can be viewed as quantitative-dominant crossover mixed analysis, and how NVCA can be framed as an equal-status crossover mixed analysis.
Our purpose has been to offer a framework that might help others conceptualize crossover analyses, to present three crossover analyses, and, more broadly, to demonstrate the versatility of mixed research and to inspire others to identify and to use crossover analyses. In particular, the utility of using CAF for classifying these crossover analyses as qualitative dominant, quantitative dominant, or equal status is that it provides a basis that allows researchers to select the analysis approach that is most compatible with their philosophical assumptions and stance. Furthermore, it might be of use to consider component methods, techniques, and their complexity so as to plan out crossover analyses. We hope that examination of Table 3 demonstrates the kinds of advances that might be possible from crossover analyses.
This table also can be used as a basis for initial categorization of crossover analyses purposes. Consistent with traditional mixed research purposes, ethnographic crossover analysis should lead to a fuller, richer, and more complete understanding of phenomena. Crossover missing data have, in contrast, a more methodological aim, and NVCA entails using mixed research to study what might otherwise be overlooked phenomena. When allowing ourselves to be ambitious, we wonder whether use of such approaches could, over time, potentially push mixed methods thinking as a sine qua non of research. But more immediately, these approaches further could establish the mixed methods field as offering indisputable value when engaged in research inquiry.
Of course, drawbacks to these mixed approaches come with the need to consider how researchers might be trained in their use, and the draw on intellectual, financial, and time resources, for the most part, would not be trivial. Understanding how much this is the case is facilitated by thinking about the complexity of component techniques and methods. Doing so might show that some crossover analyses are reasonably feasible without a highly specialized research team. Some applications might entail relatively modest advancement in research practice (e.g., applying NVCA in surgery studies), and some approaches might be realized not within single studies but across programs of research, which can reduce some resource pressures. We close by pointing out that these approaches represent aspirational thinking, and it will take time fully to realize how to take advantage of mixed methods research approaches such as these. However, because of the potential implications that these types of innovations hold for advancing mixed research, we hope that other researchers will continue to develop new crossover analysis ideas.
Footnotes
Authors’ Note
John H. Hitchcock is now affiliated with Abt Associates, Cambridge, MA, USA and Anthony J. Onwuegbuzie is now affiliated with The University of Cambridge, Cambridge, England.
Declaration of Conflicting Interests
The author(s) declared no potential conflicts of interest with respect to the research, authorship, and/or publication of this article.
Funding
The author(s) received no financial support for the research, authorship, and/or publication of this article.