
Abstract
The strength of the seam is one of the most important factors in determining the garment’s durability, structural soundness, and useful life. Conventional experimental-based assessment techniques are robust, but ineffective in cases where different sewing parameters interact non-linearly. This work is focused on the formulation and validation of an Artificial Neural Network (ANN) model for predicting seam strength associated with superimposed and lapped seams under different sewing conditions. These seam classes are commonly used in woven apparel products such as shirts, trousers, denim garments, sportswear, and workwear, where seam durability and structural integrity are important performance requirements. 60 samples of seam were prepared from plain cotton fabrics. Five sewing thread linear densities (21-59 tex), six stitch densities (5-11 SPI), and two seam classes were systematically used in combination. The seam strength according to ASTM D 1683-04 was tested with a calibrated Universal Testing Machine. A feed-forward ANN with one hidden layer was implemented in MATLAB and trained using the Levenberg-Marquardt backpropagation algorithm. The performance of the model was assessed using mean square error (MSE), root mean square error (RMSE), mean absolute percentage error (MAPE), and correlation coefficient. For training, validation, testing, and independent datasets, the ANN exhibited very good prediction capability with correlation coefficients greater than 0.99. Independent verification exhibited an RMSE of 2.38 N and a MAPE of 6.96%, indicating improved prediction accuracy compared to earlier ANN-based seam strength models with an approximately 15-30% lower prediction error. The model was successful in capturing the non-linear relationships between stitch density, thread linear density, and seam geometry. The developed model may assist garment manufacturers and textile engineers in rapid sewing parameter selection, reduction of trial-and-error, minimization of material wastage, and optimization of seam quality during apparel product development.
Keywords
1 Introduction
Seams play a significant role in garment construction and technical textiles as they are used to join two or more pieces of fabric together and to transmit forces during use, washing, and handling.1–3 In other words, seam failure always precedes fabric failure, although the fabric has enough strength to withstand the forces involved in use or handling. Therefore, seam strength has been considered to be one of the major factors in defining garment durability and service life.1,2,4 It is important to ensure that garments have enough seam quality since it plays a critical role in defining garment integrity, consumer satisfaction, and quality standards in the garment industry.
Among the different seam classes used in apparel manufacturing, superimposed seams are widely applied in shirts, T-shirts, dresses, and lightweight woven garments because of their simple construction and production efficiency. In contrast, lapped seams are commonly used in trousers, denim garments, sportswear, and workwear applications where higher seam durability and improved load-bearing capability are required.
The strength of a seam depends upon numerous interrelated factors, including fabric construction, yarn properties, thread linear density, stitch density or SPI, type of stitch used, seam geometry, and machine settings during sewing operations.1–3 Of all the seam types used in garment construction, superimposed and lapped seams have been found to be commonly used in garment manufacturing due to ease of use, flexibility, uniqueness, and applicability to mass production techniques. Despite this similarity, these two classes of seams exhibit markedly different behavior under mechanical stress.5,6 Lapped seams usually show higher tensile strength than those reported for superimposed seams due to the interlocking seam construction and better stress distribution, whereas local stress concentration and yarn slippage are more pronounced in the case of superimposed seams.2,5 Research indicates that lapped seams can maintain a quantitative strength advantage of approximately 5-10% over superimposed counterparts under identical conditions. 7
Several experimental studies have attempted to study the effect of sewing parameters on seam performance. It has been reported in the literature that coarser sewing thread is more effective in increasing seam strength by increasing the load-bearing capacity of the seam, whereas an increased stitch density also improves strength as a result of load sharing among stitches.1,2,8,9 However, these improvements are not linear, and excessive stitch density can damage the fabric or distort the yarn, as well as result in marginal increments with respect to strength.2,3,10 These various nonlinear and interacting phenomena collectively render it difficult to predict seam strength behavior using simple analytical or empirical approaches.
Standardized testing methods, such as ASTM D1683, 11 provide reliable and repeatable measurements of seam strength and are indispensable for product evaluation and benchmarking. Nevertheless, there are some drawbacks to depending on experimental screening alone. Performing many physical tests on a variety of sewing parameters, seam types, and material combinations is expensive, labor-intensive, and time-consuming.1,12 Also, experiments can hardly stimulate predictive analysis or quick optimization, which are increasingly demanded in modern apparel manufacturing environments where production timelines are short, and material costs are significant.2,4
Several modelling techniques have been proposed to address these limitations. Classical statistical approaches, like multiple linear regression and response surface methodologies, have been used for seam and fabric performance prediction, but their effectiveness is often limited when the relationship between variables is highly nonlinear or when interactions dominate.13–15 On the other hand, soft computing methods have shown to be more flexible in dealing with complex nonlinear systems, such as textile processing.1,16,17
Artificial neural networks (ANNs) have been recognised as one of the most popular soft computing techniques in textile property prediction18,19 to model the nonlinear input-output relationship directly from experimental data17,20 without any physical equations.21,22 ANNs have been successfully used for predicting fabric tensile strength, bursting strength, seam strength, seam elongation, water uptake, and other performance-related properties.15,17,23,24 Comparative studies indicate that the ANN-based models are generally more accurate for the prediction of multi-parameter textile systems compared with traditional regression approaches in some cases.15,17–19
Although these algorithms have their own merits, other soft computing approaches like fuzzy logic and adaptive neuro-fuzzy inference systems (ANFIS) were also found to provide such high-level prediction accuracy for seam-related properties, especially when expert knowledge can be expressed as rule-based representation devices. 17 However, these methods may be subjective in the formulation of rules and potentially too complicated when an increasing number of input variables are involved. In fact, hybrid methods can be more interpretable but often do not lead to large gains in accuracy if the numerical prediction on a predefined parameter range is the main goal.17,19
As a result, by considering the pros and cons of various predictive models, in this present study, ANN has been chosen as the main tool for modeling due to its established properties, such as robustness and scalability,17,18 and the capability of dealing with nonlinear interactions amongst sewing parameters.19,21,25 ANN, in contrast to the purely statistical methods, does not implicitly assume linearity or a priori functional forms, and unlike fuzzy systems, it is not based on subjective rule bases. This renders ANN especially suitable for seam strength prediction, as various physical mechanisms (such as thread breakage, yarn slippage, and fabric damage) interact in a complex manner.2,3,9 Besides, successful generalization of ANN models could be achieved even with a relatively small dataset, under the condition that suitable training and validation methods are performed.15,17,25
Although ANNs have been used before for seam strength modelling, in several case studies, focus on a certain class of seams or very constrained sewing conditions are considered, or only aggregate performance measures (without detailed value-based comparison and robustness analysis) are provided. In addition, few studies explore how experimental trends correspond to model-predicted behavior, outlier detection, and class-dependent performance within a unified framework.
The sewing thread linear densities and stitch densities selected in this study were based on commercially relevant sewing conditions commonly used in lightweight and medium-weight woven apparel manufacturing. The selected seam classes were chosen because they represent two of the most frequently used seam constructions in industrial garment production. In this context, the objective of this work is to develop and assess an ANN-based predictive model with the input parameters being the linear density of sewing thread, stitch density, and seam class for predicting seam strength. The study aims to overcome existing challenges of the literature by considering both superimposed and lapped seams within a single framework, and focusing on a value comparison approach between experimental and predicted data. Although the scope of work is deliberately narrow in considering only one woven cotton fabric and lockstitch configuration to facilitate controlled interpretation, the findings form a systematic foundation for systematic prediction of seam strength evaluation and potential generalisation into other broader material and sewing fields. From an industrial perspective, the proposed ANN-based predictive model may help reduce repetitive experimental sewing trials, support rapid optimization of sewing parameters, improve seam quality consistency, and assist decision-making during apparel product development and manufacturing.
2 Materials and methods
2.1 Materials
2.1.1 Fabric
Fabric specification.

2.1.2 Sewing threads
Sewing thread specification.

Two-ply spun polyester sewing threads were used throughout the study. A sufficient length was used for each thread for trial sewing, waste, and specimen preparation to avoid or minimize sewing thread variability across similar seams.
2.2 Sample preparation
The superimposed and lapped seams were prepared in a controlled and systematic way, so as to ensure reproducibility and also to isolate the influence of sewing thread linear density, stitch density, and seam class on the tensile strength of the seams. The selected superimposed and lapped seam constructions were chosen because they are among the most frequently used seam classes in woven apparel manufacturing. All specimens were prepared at standard specimen size and sewing conditions as per ASTM D1683-04. Figure 1 represents the schematic diagram of superimposed and lapped seams. The superimposed seam used in this study was prepared according to Figure 1(a) (i), whereas the lapped seam was prepared according to Figure 1(b). The superimposed seam samples were prepared using a single stitch-line configuration, whereas the lapped seam samples were prepared using two parallel stitch lines according to their commonly used industrial seam constructions. Schematic diagram
6
of a) superimposed and b) lapped seam.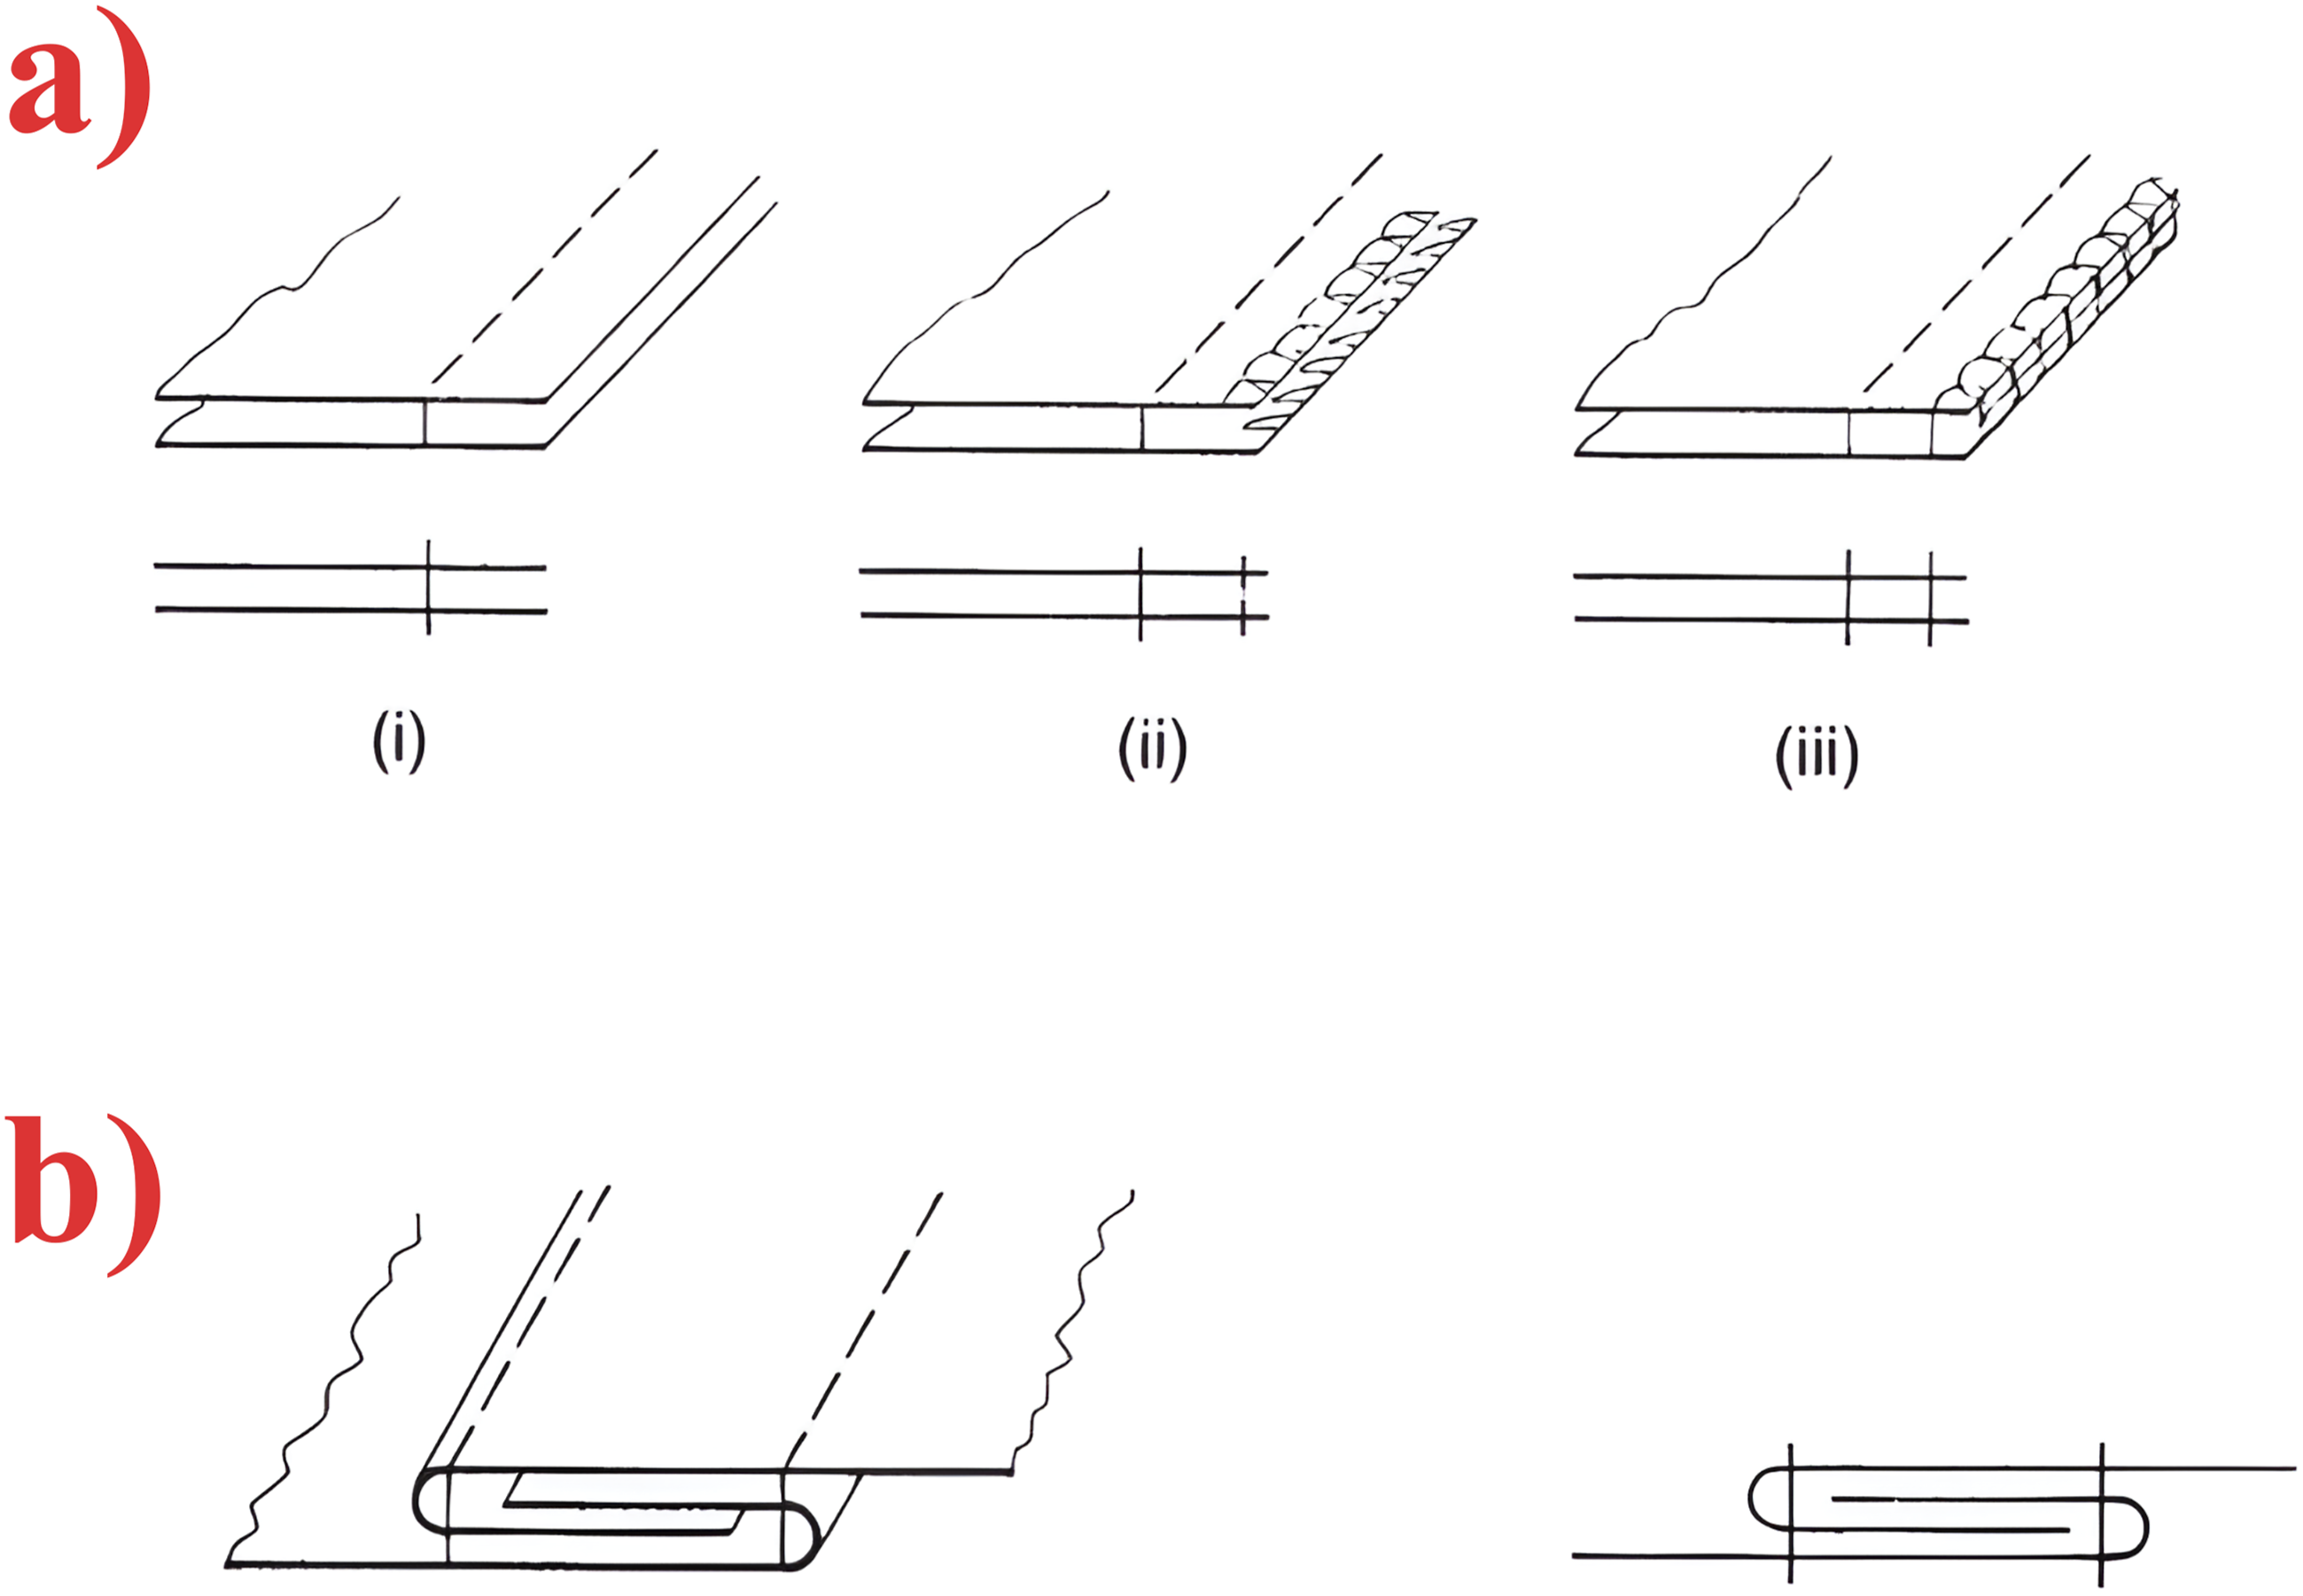
Sample combination variables.

All seams were sewn with a single-needle industrial lockstitch sewing machine (Nisho, China) corresponding to stitch class 301. Before the preparation of samples, the sewing machine was checked and adjusted in order to produce uniform stitching. The stitch density was accurately controlled by changing the feed mechanism, and all other sewing variables, including needle size, needle type, thread path, and machine operating speed, were kept constant during the sample preparation. This allowed to decouple any difference in seam strength arising only due to the differences in thread linear density, stitch density, and type of seam rather than any other external factors.
Superimposed seams were prepared by aligning two plies of fabric on top of each other and stitching along the seam line; it is a standard seam construction in general garment assembly. Lapped seams were constructed by folding and interlocking the edges of fabric plies, thereby increasing the seam thickness and the area over which force could be distributed by the stitch. Both types of seams were fabricated in the same sewing condition, for a fair and direct comparison of their mechanical behaviour.
After sewing, all samples were cut to a standardized length of 200 mm x 50 mm according to ASTM D1683-04. The samples were then conditioned for 24 h at standard atmosphere (20 ± 2 °C temperature and 65 ± 2 % relative humidity) 1 to minimize the impact of environmental variability on seam strength measurements. After conditioning, the specimens were tested for seam strength with a Universal Testing Machine (Testometric, UK), and test results were used for training, validation, and independent performance analysis.
2.3 Seam strength testing
The seam strength of the prepared samples was tested according to ASTM D1683-04 test standard. 1 This technique is a very common technique for the evaluation of seam performance with apparel and can provide a good comparison across distinct seam constructions and sewing parameters.
Testing was conducted on a calibrated universal testing machine (UTM) (Testometric, UK) with a constant rate of extension control system, and the data was collected using an integrated software system. The machine was checked for load accuracy before testing to ensure that the force measurements were consistent. The specimen was accurately positioned in the middle of the upper and lower grips of the testing machine so that its stitched line would be equidistant to each grip line and parallel to the direction of the applied tensile force. Great care was taken to prevent slippage or pre-damage during specimen clamping. Figure 2 shows the image of the prepared samples, samples being tested, and the failed samples after the test. Samples in various stages: a) prepared superimposed seam, b) prepared lapped seam, c) sample in testing machine, and d) failed sample.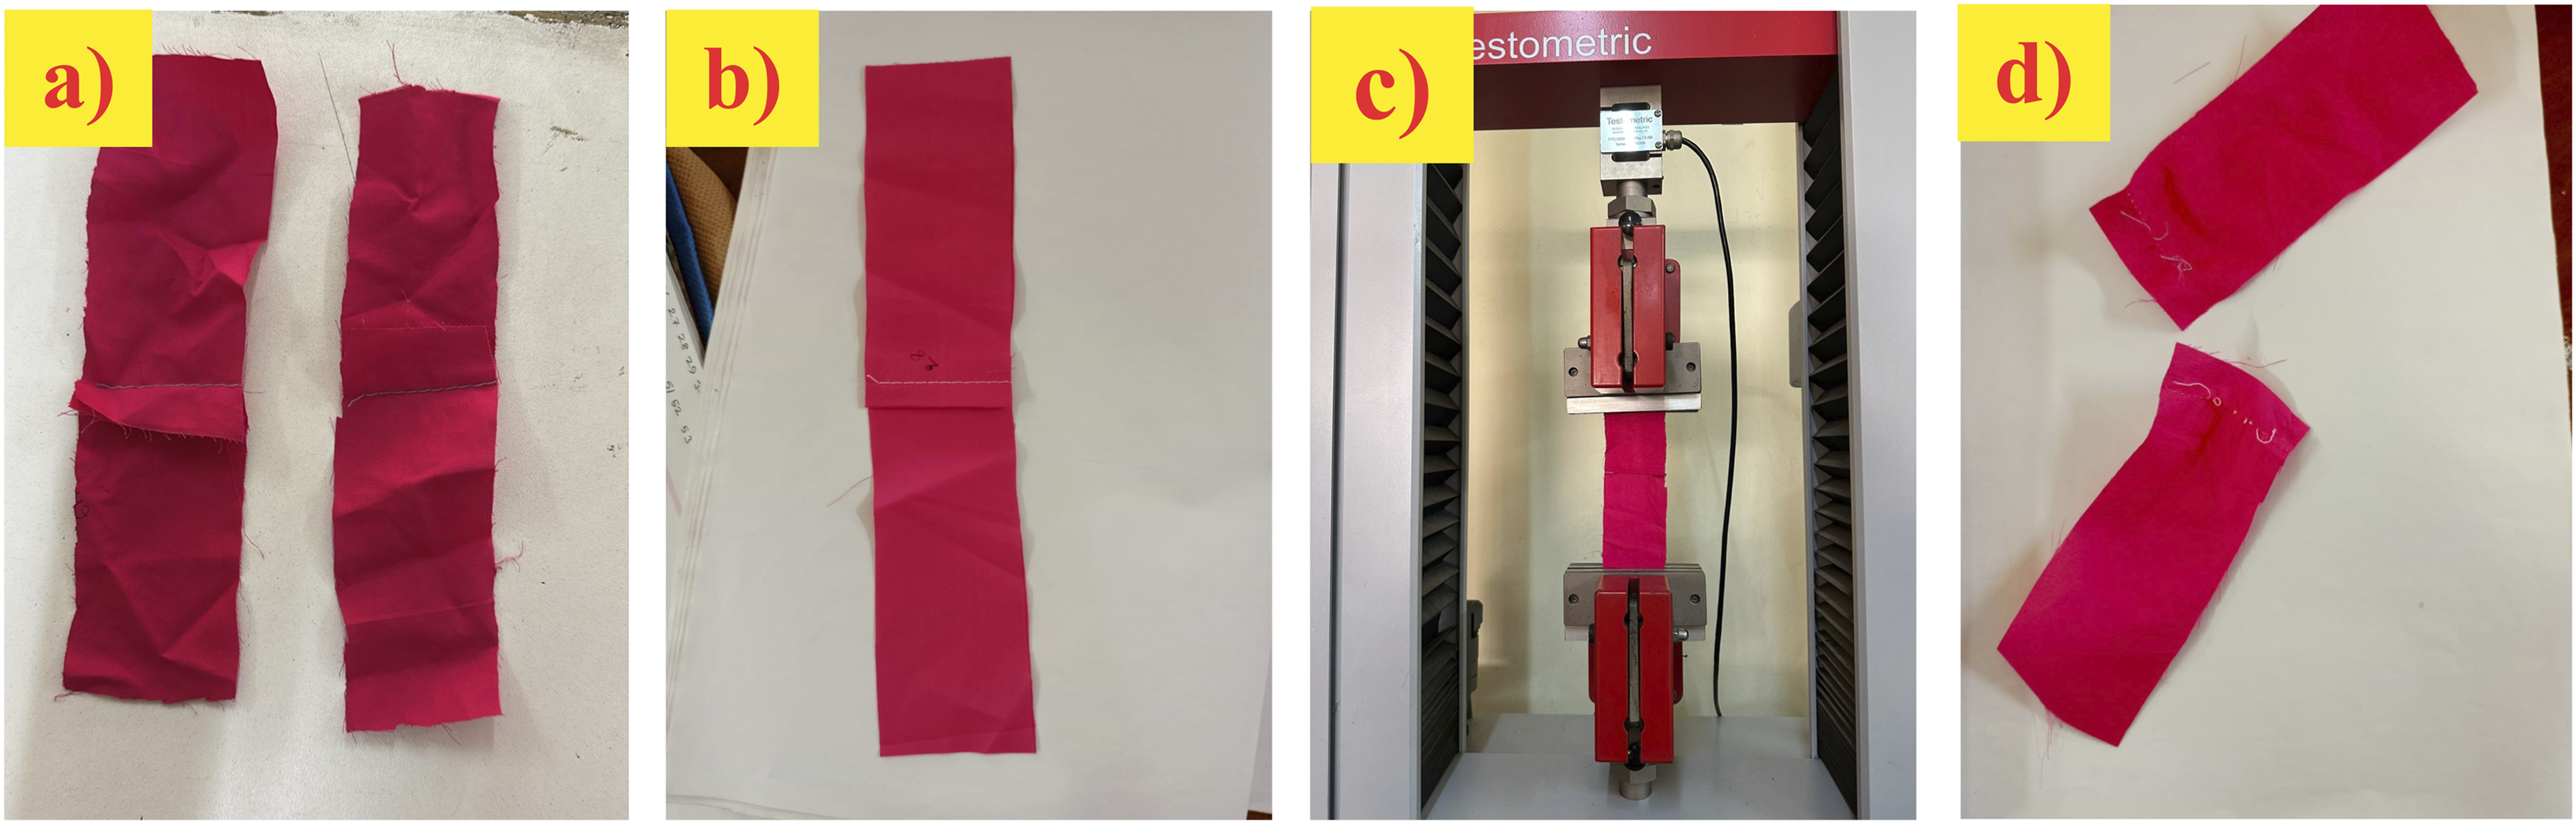
All tests were carried out under standard atmospheric conditions (temperature of 20 ± 2 °C and relative humidity of 65 ± 2 %), similar to those used during specimen conditioning, so as to reduce the effects of possible environmental variations on mechanical performances. The gauge length and sample dimensions were kept as per ASTM D1683-04.
The tensile load was applied at a constant crosshead speed of 500 mm/min until seam failure occurred. No pretension was applied before the testing procedure. The force at the point of rupture was recorded as the seam strength and expressed in newtons (N). For lapped seam specimens containing two parallel stitch lines, both stitch lines were engaged in the grips and loaded simultaneously. The rupture point was defined as the failure of the first stitch line, as this represents the onset of seam functional failure. During testing, the failure mode was visually checked to ensure rupture in the seam region rather than caused by grip slippage or fabric edge failure.
A single test value was recorded for each combination of sewing parameters that served as the input data in the subsequent analysis. The seam strength values were reported according to the precision of the calibrated Universal Testing Machine while considering the practical measurement variability associated with textile tensile testing. Moreover, since predictive modeling was the main focus of the study rather than the statistical variation estimation, only one test value was recorded for each test combination. The compiled seam strength value was used as the experimental data for developing the Artificial Neural Network model.
2.4 Model development
The Artificial Neural Network (ANN) model was developed to represent the nonlinear relationship between sewing parameters and seam strength of superimposed or lapped seam, based on an experimental data set as the learning basis. The holistic modeling approach, the protocol for handling data and training, are in accordance with established ANN practices from textile engineering-related literature and adhere to the methodology used in earlier studies of seam strength modeling.
The input data were composed of three factors, which affect seam performance: sewing thread linear density (Tex), stitch density in terms of stitches per inch (SPI), and class of seam. The seam class was coded as numerical and used as a categorical input in the network. Seam strength, the maximum breaking force derived from standardized tensile testing of the samples, was modelled as a single output neuron. All datasets for input and output were arranged as double-precision arrays and scaled with a normalization factor inside MATLAB before training to ensure numerical stability, as well as to prevent variables from being dominated by larger magnitude variables, which is recommended for gradient-based learning algorithms.22,26,27
A feed-forward backpropagation type of neural network model has been chosen since such a type of configuration proves to be successful in the prediction of textile properties like seam strength, fabric tensile behavior, and water absorption behavior.15,17,19,22,28 The topology of the network was an input layer, a hidden layer, and an output layer. The hidden layer contained 10 neurons, based on a set of prior experiments to balance learning capability and avoidance of overfitting. A similar single-hidden-layer structure has been found adequate to model nonlinear sewing and fabric interactions under a moderately sized dataset.21,22,29
The Levenberg-Marquardt backpropagation algorithm was selected as the training function due to its rapid convergence and robustness for small-to-medium datasets. This method has been frequently used in textile-related ANN studies and has consistently outperformed the traditional gradient descent-based optimization methods in minimizing mean squared error.15,17,30,31 The hyperbolic tangent sigmoid function was chosen as the activation function in the hidden layer to introduce nonlinearity into the model. The linear transfer function was applied to the output layer to incorporate the continuous seam strength output values.
In order to ensure unbiased learning, the full dataset of 60 experimental observations was randomly separated into three subsets. The 70% subset of the data, containing 42 samples, was used for training. The 15% set with 9 samples was utilized for validation, and the other 15% subset was left for testing. The random separation method was employed to minimize systematic bias and for proper representation of all seam types and sewing parameters across the subsets. The validation set was utilized to monitor model performance during training. The early stopping technique was applied when the validation error reached a minimum, thus preventing overfitting. 32
Model accuracy and generalization performance were assessed through the following statistical indicators: mean squared error (MSE), root mean squared error (RMSE), mean absolute deviation (MAD), mean absolute percentage error (MAPE), and the correlation coefficient (R). These performance evaluation metrics have been commonly used in textile-related artificial neural network studies and provide a general overview of the actual and relative prediction errors.17,19,21
2.5 Statistical analysis
The predictive performance of the Artificial Neural Network (ANN) model was evaluated by comparing the experimental seam strength values with the model-predicted values using standard statistical error indices by using the following equations (1-5). The assessment focused on quantifying prediction accuracy, goodness of fit, and model reliability.
The mean squared error (MSE) was used as the training performance function and is expressed as
The mean absolute deviation (MAD) was calculated as
To express the prediction error in the same unit as seam strength, the root mean squared error (RMSE) was calculated as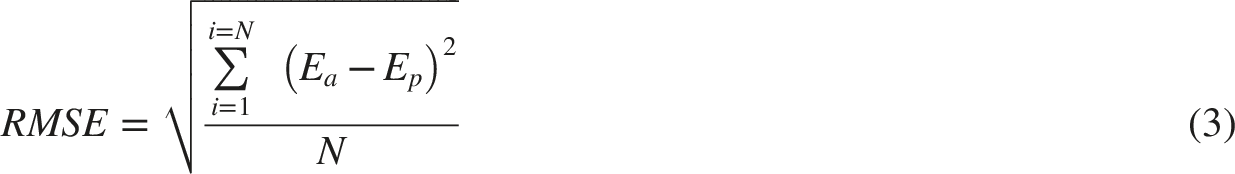
The mean absolute percentage error (MAPE) was used to evaluate relative prediction accuracy and is defined as
The strength of the linear relationship between experimental and predicted values was quantified using the correlation coefficient (R) and the coefficient of determination (R2). The coefficient of determination was calculated as-
These statistical indices were computed for the training, validation, testing, and independent datasets to ensure consistent model performance and to verify the generalization capability of the ANN model.
3 Results and discussion
3.1 Detection of outliers from actual and predicted data
The distributional stability of input parameters and seam strength outputs was assessed by outlier detection using box-whisker plots, as shown in Figure 4, before detailed model analysis. Such a method is appropriate for sewn textile data, where experimental variation is controlled, and normality assumptions are not always valid.
The box-whisker plots of sewing thread linear density (Figure 3(a)) and stitch density (SPI) (Figure 3(b)) present values with relatively short interquartile ranges, in which the conventional 1.5×IQR limits for all measurements are apparent. Larger thread linear density values are situated around the upper whisker, but they represent intentionally chosen coarse threads and not invalid outlier data. A similar distributional trend with the absence of extreme outliers has been observed in controlled seam strength experiments for a comparable sewing parameter realm.
1
No isolated extreme values were found in the stitch density distribution of 5-11 SPI, which is also consistent with other previous findings of seam mechanics under standardized sewing conditions.2–4 Seam class, a categorical variable, does not receive any outliers by definition, verifying the consistent numeric representation Figure 3(c)). Box whisker plot for detection of outliers, a) thread count, b) SPI, c) seam class, d) experimental value, and e) model-predicted value.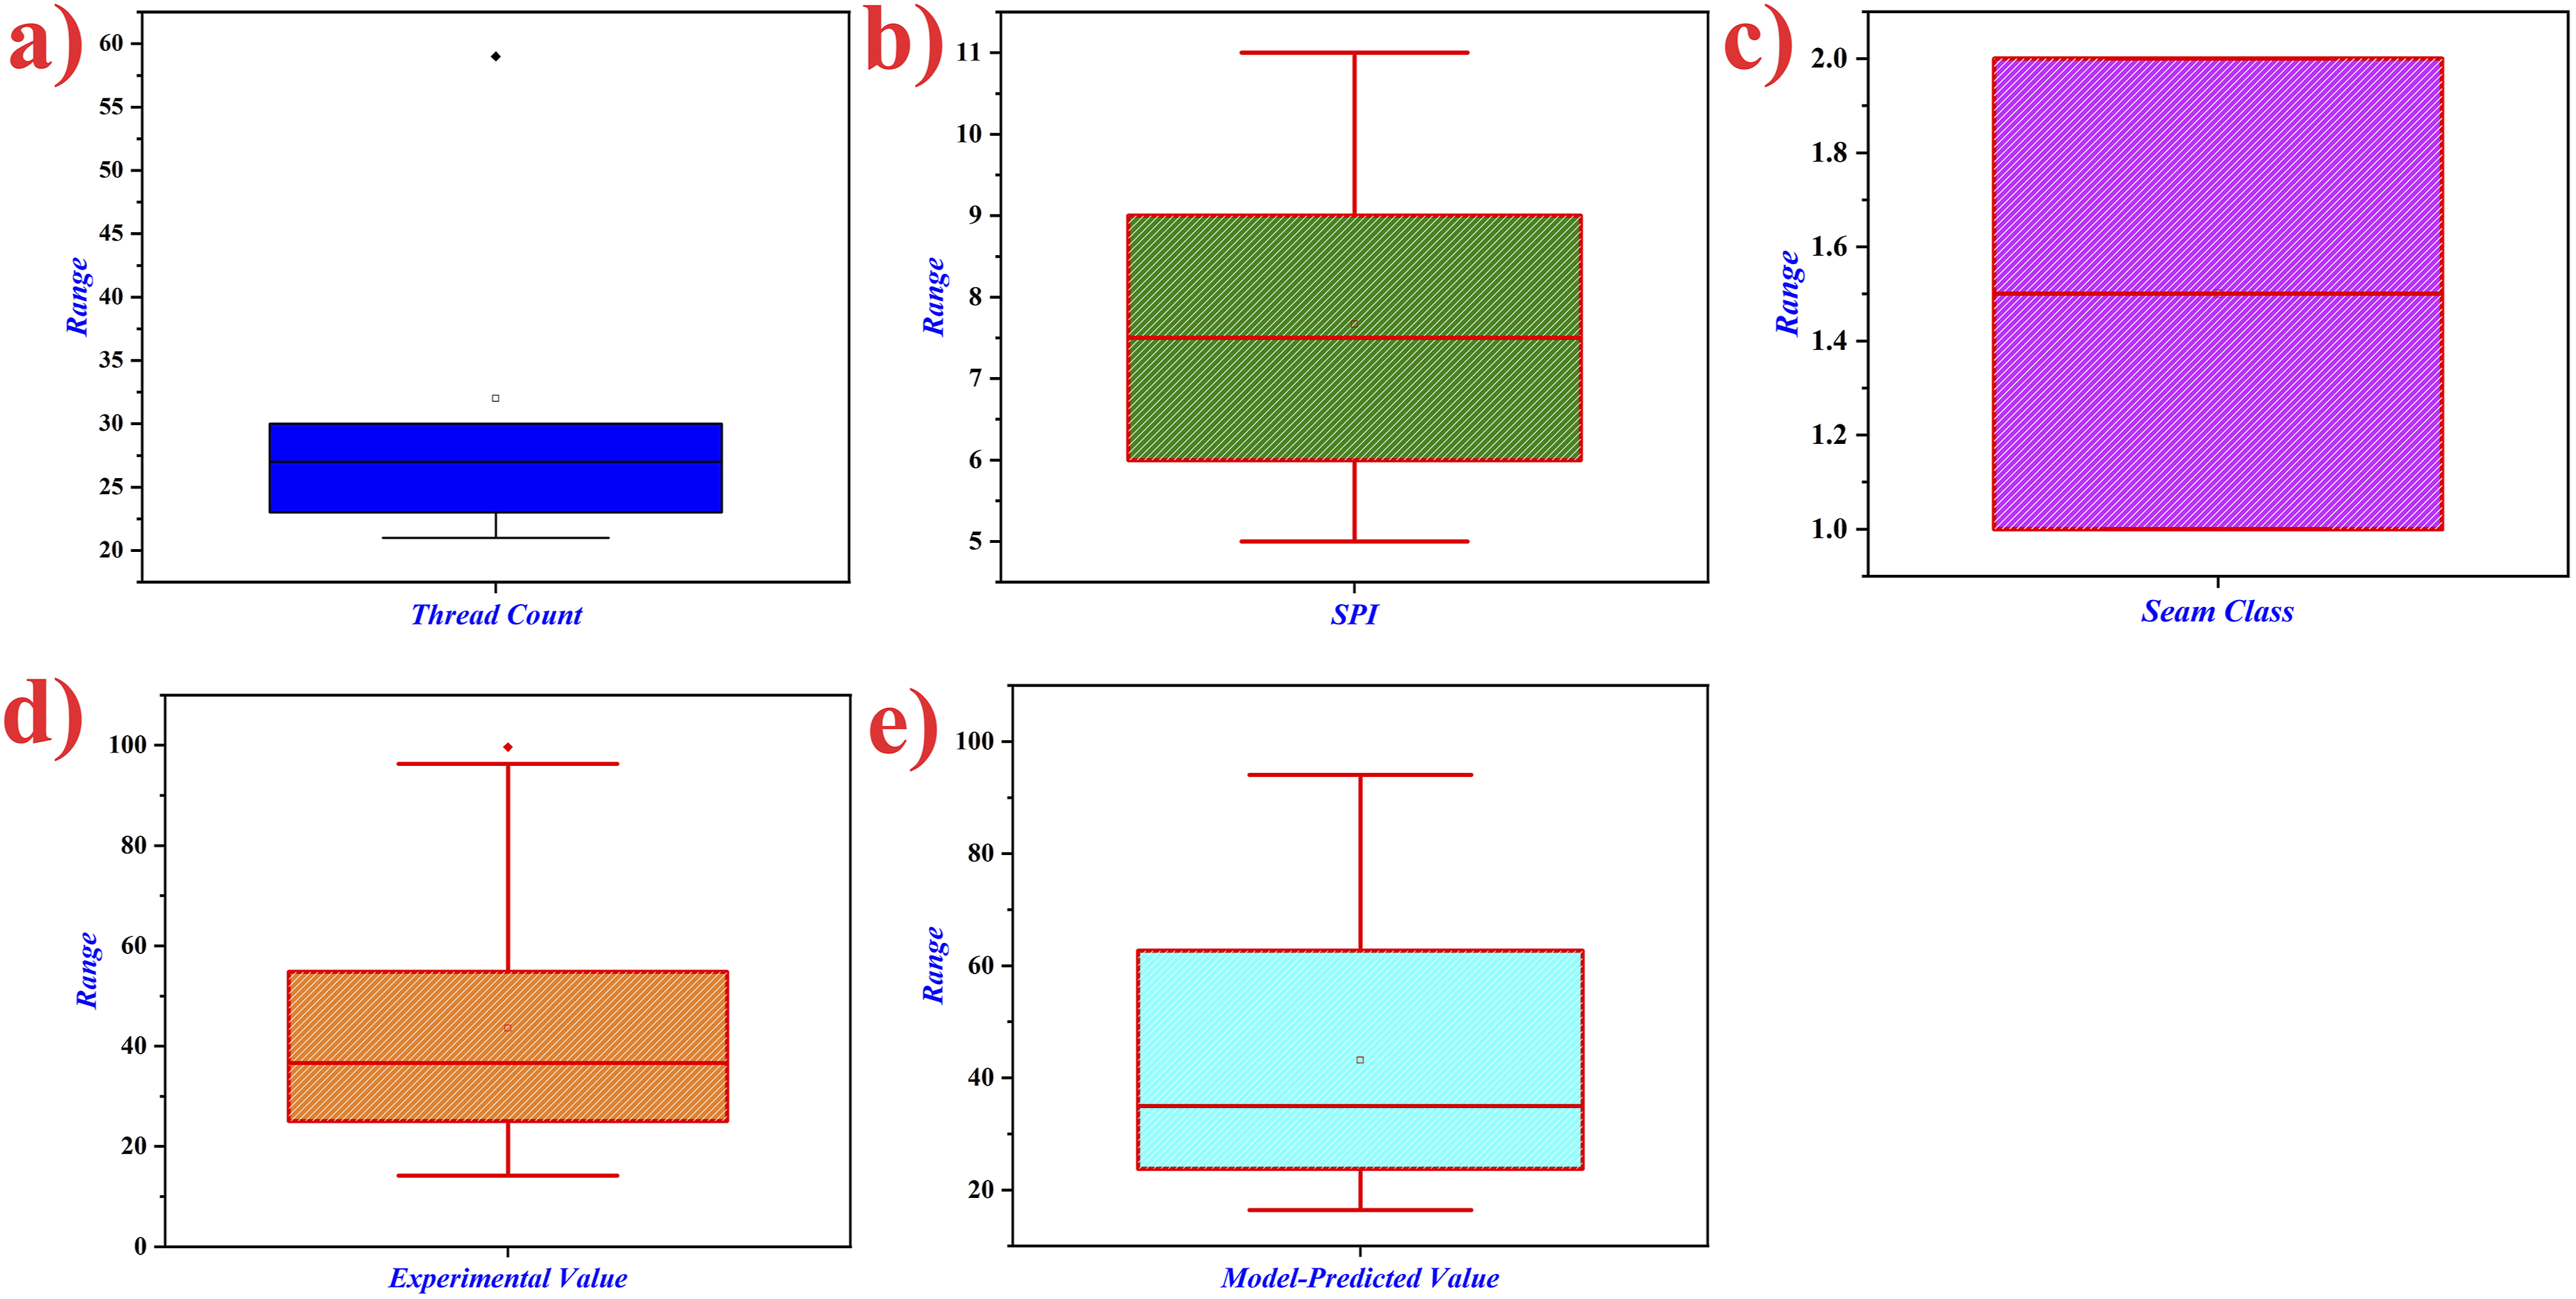
The experimental seam strength measurements (Figure 3(d)) are quite evenly spread with a clearly defined median, and none of the observations fall outside the whisker limits, thereby ruling out spurious measurements. Similar sorts of experimental distributions have also been observed with no such extreme outliers for controlled sewing conditions in accordance with ASTM D1683. 1 , 4 ANN-predicted seam strength values (Figure 3(e)) were similar to the experimental distribution in terms of median position and interquartile range, without any predicted values outside the whisker limits. This phenomenon is in tight agreement with previous ANN-based textile modeling studies, where well-trained networks retained natural data variability and suppression of the random noise.17,19
Therefore, it is evident that the absence of substantial outliers in both experimental and predicted data demonstrates the statistical integrity of the data and ensures that there is no major statistical atypicality with the input and output data. Moreover, it is also apparent that the data are consistent with the trends reported in the seam strength literature. This provides a reliable foundation for comparisons to be made through regression and quantitative performance of the ANN model.
3.2 Analysis of experimental data
Experimental values.

In the case of superimposed seams, load capacity increased from 14.16 N at 21 tex and an SPI of 5 to 86.26 N at a sewing thread linear density of 59 tex and an SPI of 11. On the same condition, the lapped seam showed even higher seam strength value comparatively, increasing from 17.14 N to 99.65 N, which was an approximately 480% increment. The relative seam strength increase in percentage terms for superimposed and lapped seams was found to be roughly 510% and 480%, respectively, implying that the effect of seam geometry on strength improvement is nearly in line with optimization in sewing parameters. This increase further supports the dominant influence of seam geometry on tensile performance. It should be noted that the superimposed and lapped seam configurations used in this study differed not only in seam geometry but also in stitch-line arrangement. The superimposed seam employed a single stitch-line configuration, whereas the lapped seam employed two parallel stitch lines that were loaded simultaneously during tensile testing, with seam failure defined as rupture of the first stitch line. Therefore, the observed seam strength differences are associated with the combined effects of seam class geometry and stitch reinforcement characteristics.
The trend of increased strength with increasing stitch density observed in this study is in good agreement to the studies reported for cotton and denim fabrics, which had 3-5 times increases by Yıldız and Pamuk (2020) 2 and Mandal (2008) 4 However, the absolute strength values presented in this study are higher due to the use of 2-ply spun polyester sewing threads along with controlled stitch formation. In comparison to the previously reported maximum seam strength values of about 60-75 N, the results of the present study exhibit an absolute higher-strength improvement of around 15-30%, as a consequence of the combination of enhanced stitch density and high-strength polyester sewing threads. For most thread linear densities, between 9 and 11 SPI, the strength increment was less than 10-15%, while for 5 and 7 SPI, the strength often exceeded 40%, implying a significant nonlinear response. The same saturation response beyond the optimal stitch density reported by Hui et al. (2007) 10 and Yıldız and Pamuk (2020) 2 when the fabric had reduced integrity as a result of excessive needle penetration.
For lapped seams, experimental seam strengths were consistently higher than for the superimposed seams at the same stitching conditions. The difference between lapped and superimposed seam types was observed throughout the whole dataset, with lapped seams exhibiting visibly higher median and maximum seam strength values in the box-whisker plots. This enhancement is due to the interlocking construction of the fabric plies in the seam area that minimizes localized stress concentrations. For all the sewing conditions, it can be observed that the seam strength of lapped seams was around 10-35% higher than that of corresponding superimposed seams, depending on the stitch density and thread linear density. Comparable quantitative advantage of the lapped seams has been reported for denim and woven apparel fabrics as well.2,5
The experimental results also suggest that the marginal improvements of seam strength are reduced with higher stitch densities, especially when they are above 9 SPI. Even though seam strength further increased up to 11 SPI, the increasing rate was lower than that between 5 and 7 SPI. This is indicative of the formation of fabric damage and yarn distortions generated with the repetitive penetration of the needle, which restrains further strength improvement, even at higher stitch frequency.2,4,10 Crucially, no sudden loss or spikes in seam strength were seen between parameter pairs of adjacent sequences, indicating stable experimental control and absence of measurement atypicality.
In general, the experimental data exhibit internally consistent numerical trends without sudden deviations and hence are considered suitable for subsequent ANN modelling and predictive analysis.
3.3 Analysis of model-predicted data
The ANN-predicted seam strength results were in good adherence to the numerical trends prevailing in the experimental dataset, showing a consistent dependence on sewing thread linear density, stitch density, and seam class. The predicted seam strength increased linearly as the thread linear density increased from 21 to 59 tex and stitch density increased from 5 to 11 SPI for both seam classes, and there were no non-physical oscillations, discontinuities, or abrupt deviations observed across the prediction domain.
In case of superimposed seams, ANN predicted minimum values of seam strength for low thread linear density and low stitch density combinations and gradually higher values toward the upper parameter range. The expected increase in seam strength for a constant thread linear density, from 5 to 11 SPI, was gradual and continuous, implying that the ANNs well captured this nonlinear but monotonic functional relationship between stitch density and seam strength. For the majority of the superimposed seam samples, the predicted improvement in seam strength at 5 and 7 SPI was seen to be higher than 35-45%, whereas that at 9 and 11 SPIs lay typically below 15%, closely mimicking the non-linear response observed in experimental seam strength datasets.
The mean difference between ANN-predicted and experimental seam strength was less than ±4 N for most of the samples, indicating excellent numerical integrity. In all independent validation samples, absolute prediction errors were within 3 N in the majority of cases, corresponding to relative errors usually below 7%. For instance, at 27 tex and 11 SPI, the experimental seam strength of lapped seams was 89.95 N, whereas the model-predicted value was 89.43 N, resulting in an absolute error of only 0.52 N, which is equal to approximately 0.58% of the measured value. This close agreement is indicative of the model’s success in describing coupled nonlinear interactions between sewing parameters and seam geometry.
For lapped seams, the model-predicted seam strength was consistently superior to that of superimposed seams with the same sewing conditions. ANN maintained the numerical distance among seam classes all over the data set, showing a good learning of seam-geometry-dependent behavior. The predicted seam strength in the lapped seams exceeded the seam strength of superimposed seams roughly by 10-30%, depending on the stitch density and thread linear density, close to what is actually observed experimentally for class-dependent strength improvement. The estimated median values for lapped seams were also more apparent in the box-whisker plots, which had smaller interquartile ranges as compared to superimposed seams, indicating less variability and higher structural stability of lapped seam constructions.
The model-predicted data further reproduced the experimentally observed saturation trend in higher stitch densities. However, the ANN also estimated a decreasing gradual increase in seam strength above 9 SPI, indicating the physical constraints of fabric damage and yarn distortion due to repetitive needle penetration. Interestingly, the ANN did not extrapolate linearly, as evidenced by a small increase in predicted incremental gain past 9 SPI (rarely below 10-15% for the majority of thread counts), instead verifying that it had learned the nonlinear relationship between sewing parameters.
Similar value-consistent predictive behavior has also been recorded for previous ANN-based seam and fabric models, as the predicted values not only matched experimental response surfaces in magnitude but also had parallel curvatures rather than just linear fits.17,18 The current findings show similar or better numerical precision, especially at higher stitch densities, where prediction accuracy is typically more challenging.10,19
3.4 Comparison between actual and predicted data
Quantitative comparison between experimental and ANN predictive seam strength results confirms a high degree of numerical match for all the considered datasets. The regression analysis between the actual and predicted values showed a good correlation (R = 0.997 for training; R > 0.99 for both validation and test), indicating a strong linear relationship and good generalization of the ANN model.
Comparison of the experimental and model-predicted seam strength values.

The combined statistical parameters also corroborate the good agreement between predicted and experimental data. Quantitative validation is also given by error-based performance metrics. For the independent dataset, mean absolute deviation (MAD) was 2.16 N, mean squared error (MSE) was 5.66 N2, and root mean square error (RMSE) amounted to 2.38 N; MAPE was found to be 6.96%, which indicated that the average prediction error did not exceed over 7% of the measured seam strength. These error levels are also lower than those observed in several previous ANN models for seam strength, which commonly had RMSE values over 3-4 N and percentage errors between 8 and 12%.15,19 Lower levels of error reported in this study are indicative of enhanced numerical accuracy and stability. 21
The comparative trends of experimental and model-predicted seam strength values for selected samples are shown in Figure 4. The close proximity of the predicted values to experimental measurements for different thread linear density and stitch densities, as well as seam classes, indicates that the ANN effectively replicates not only the magnitude but also the trend of variation in seam strength rather than simply fitting average performance. Trends of experimental and model-predicted seam strength for various samples.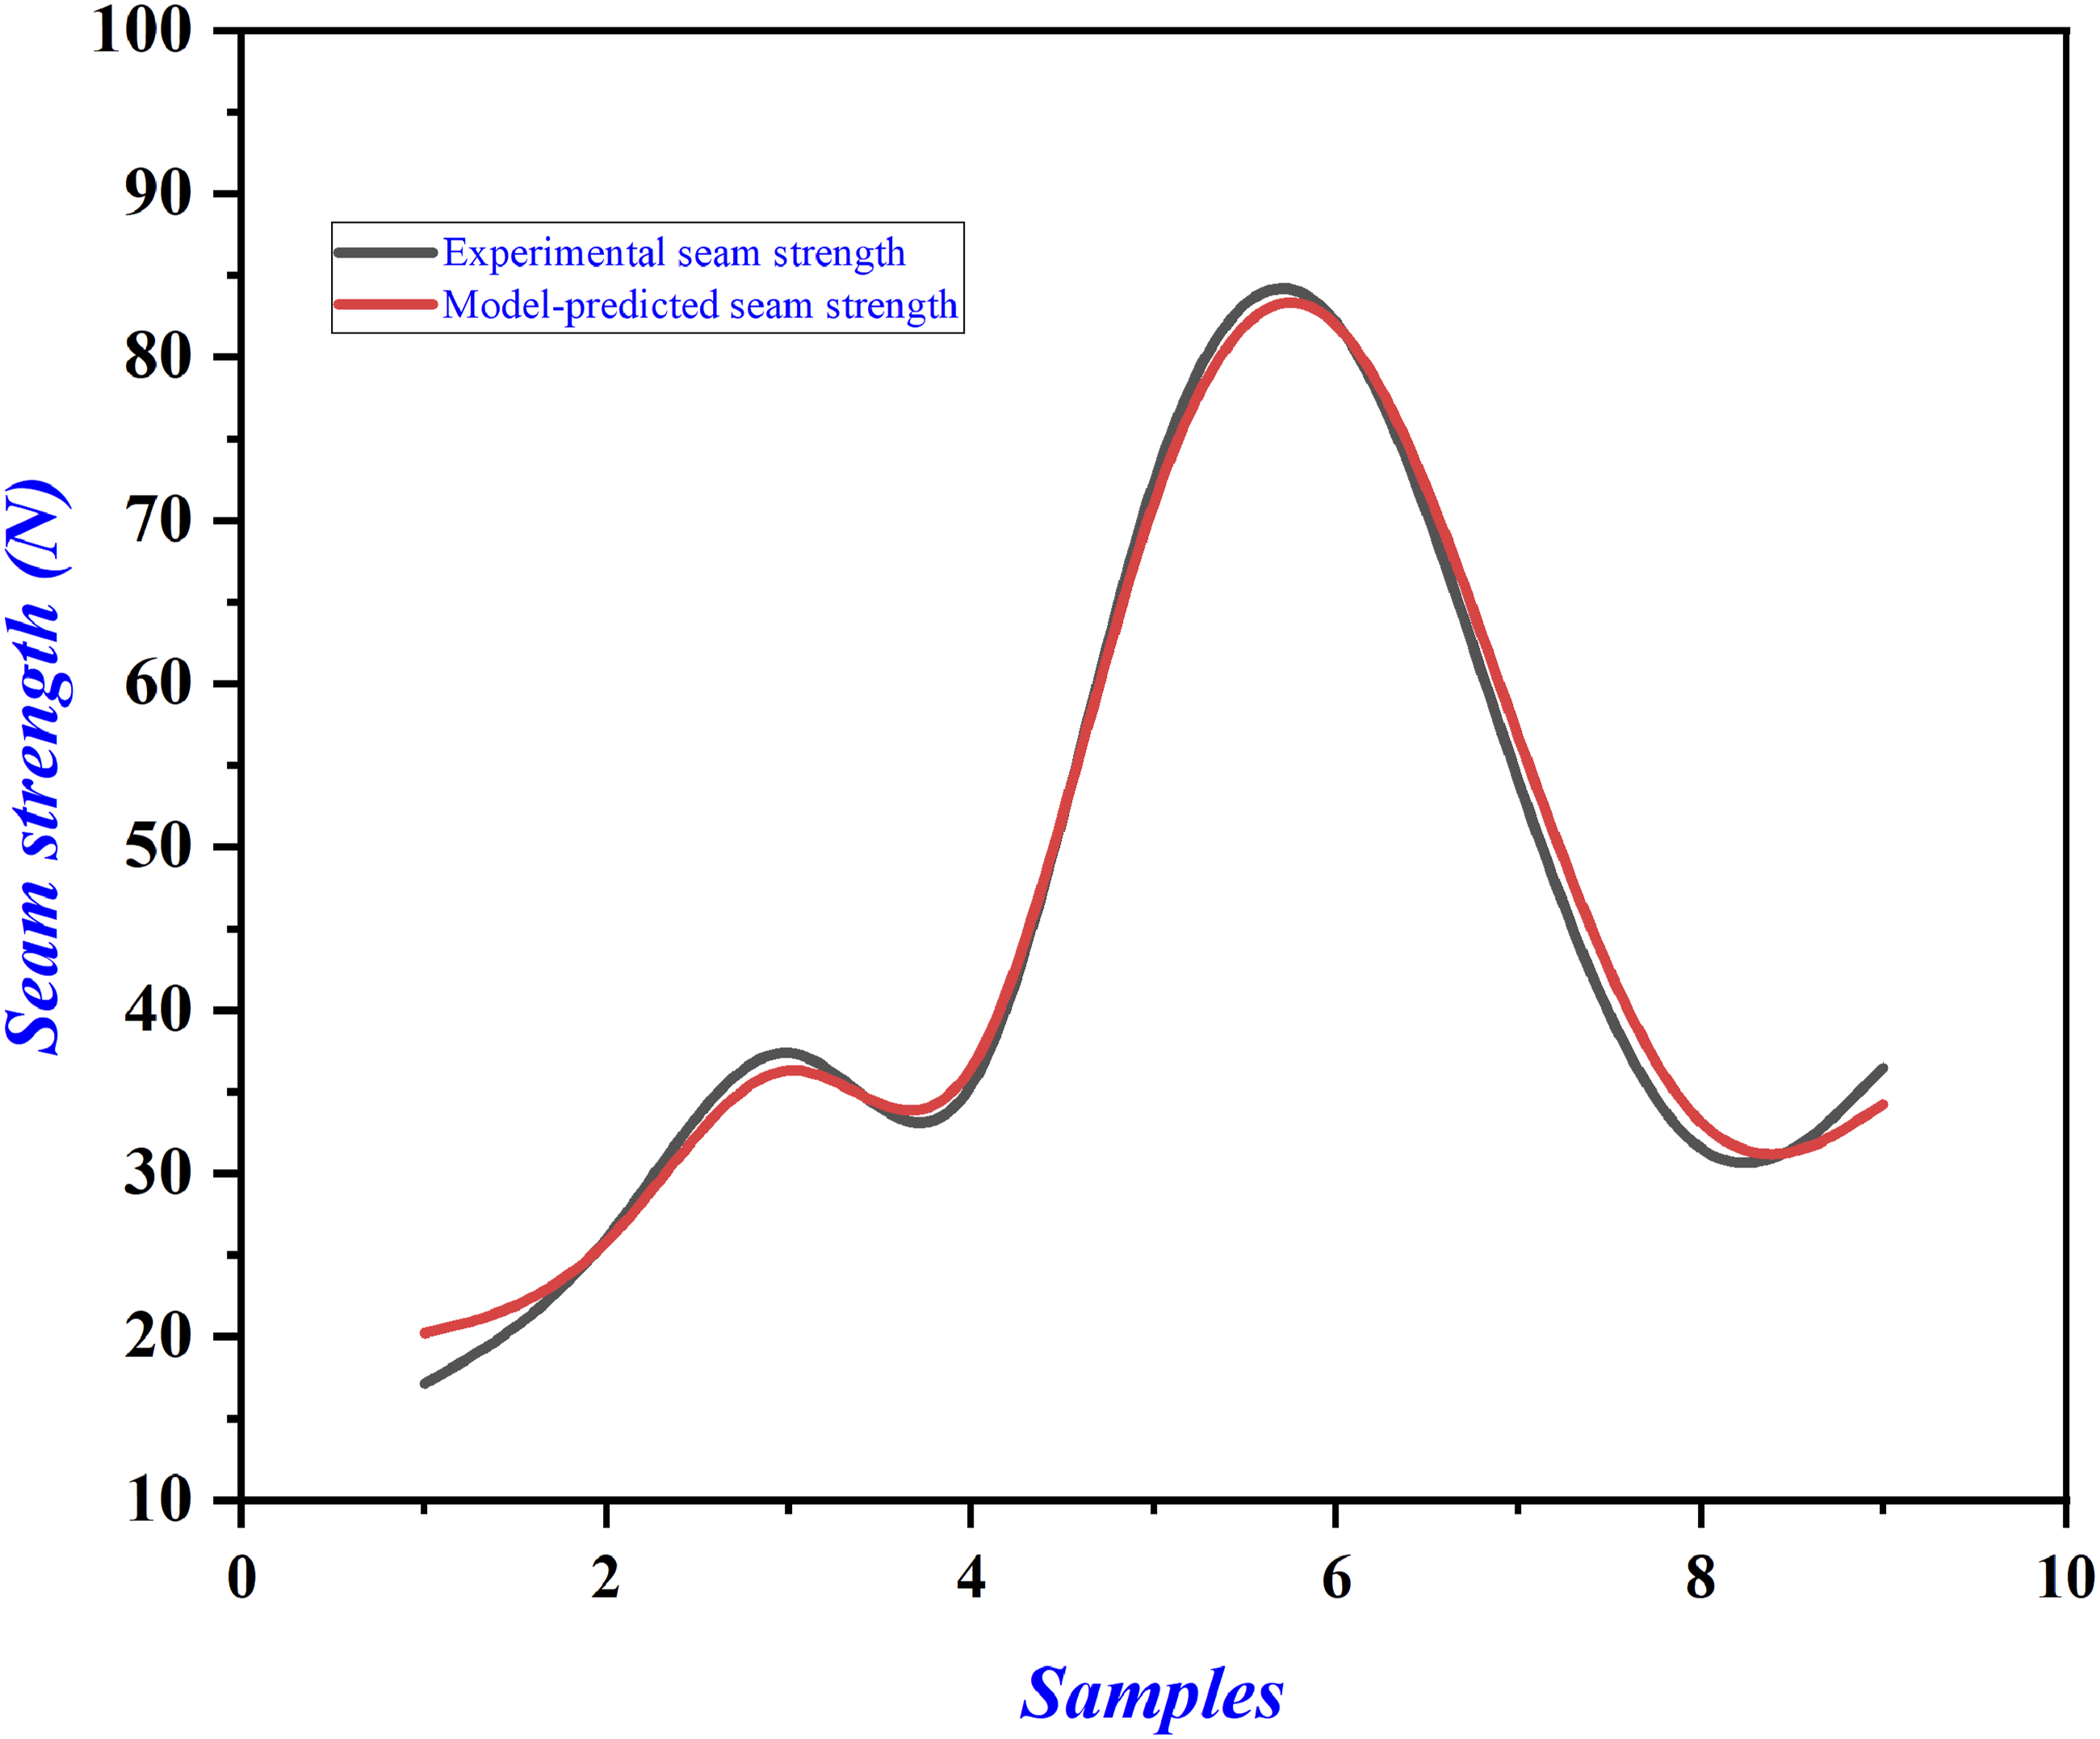
Additional comparative box-whisker plots (Figure 3) indicated a close correlation in the distributions of experimentally and predicted seam strength for superimposed and lapped seams. Both the medians and interquartile ranges of the predicted data were well overlapped with those of the experimental data, while no point representing a prediction overreached the experimental extrema. This ensured that the ANN respected physical limits of seam strength and did not produce unrealistic predictions.
In general, the good regression fit, low prediction error, and close distributional similarity of experimental and predicted seam strength values indicate that this generated ANN model is able to predict with very high accuracy and precision over the range of sewing parameters investigated.
3.5 Assessment of model performance
The performance of the developed ANN model was extensively assessed in terms of correlation analysis, convergence behavior, residual distribution, and standard error indicators for prediction accuracy, robustness, and generalization properties. The evaluation was performed on the training, validation, testing, and independent datasets to ensure that the predictive performance was not limited to the training phase.
The regression analysis of ANN outputs with the experimental seam strength values, as shown in Figure 5 demonstrates a high predictive reliability for all data partitions. A correlation coefficient, R = 0.99736, was obtained, which demonstrates successful learning of the nonlinear relationship between sewing parameters and seam strength. The correlation coefficients observed in the validation and testing sets were R = 0.99214 and.99642, respectively, averaged over all correlation coefficients, R = 0.99608 for the combined dataset. The uniform high correlation values further serve as evidence of good generalization capacity and absence of overfitting.32,33 Similar ANN-based models for seam strength reported in the literature generally report correlation coefficients ranging from 0.96 to 0.99,18,19 indicating the current model operates at or above the upper limit of previously achieved accuracies.
17
Regression analysis of the developed model.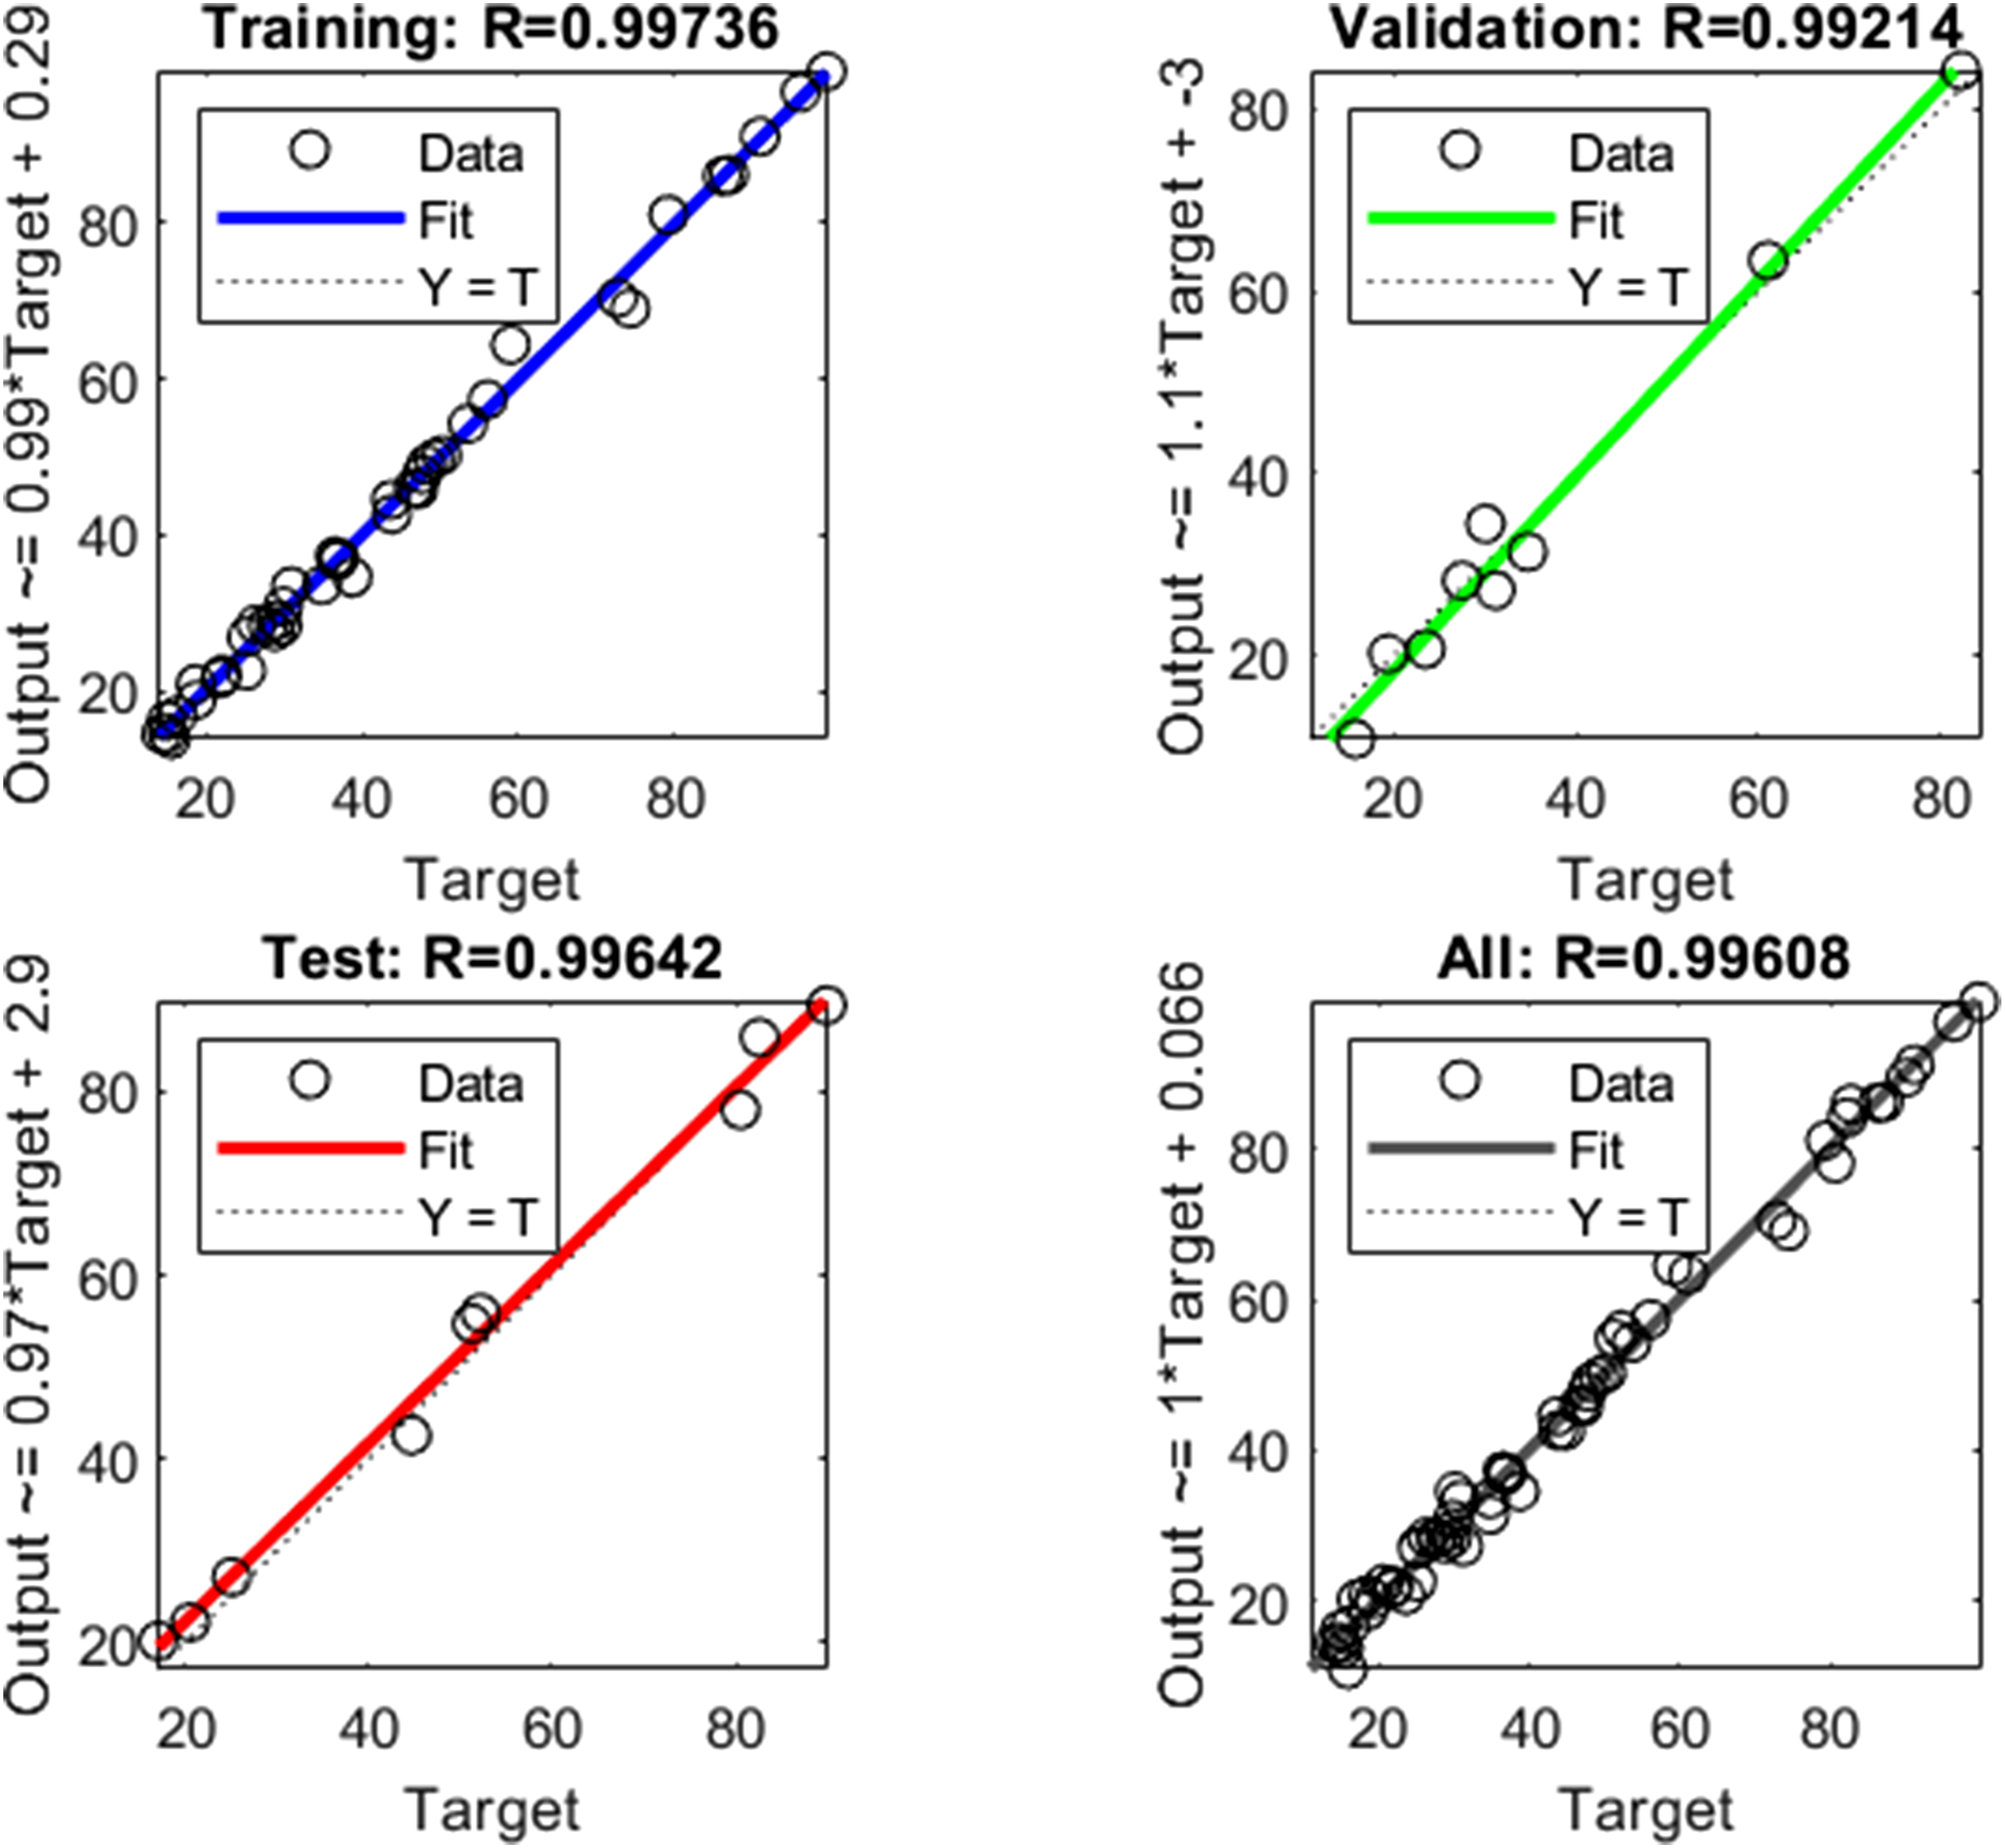
The overall regression plot (Figure 5) further confirms the reliability of the ANN predictions. It can further be observed that the predicted seam strength values fall close to the identity line for all measurement conditions (covering an experimental range of about 14-100 N), and no systematic shifts are visible at low or high strength. The high coefficient of determination (R2=0.992) of the developed model (Figure 6) explains and predicts more than 99% of the variance in experimental seam strength, suggesting a good predictive capability of the model. Correlation between experimental and model-predicted seam strength.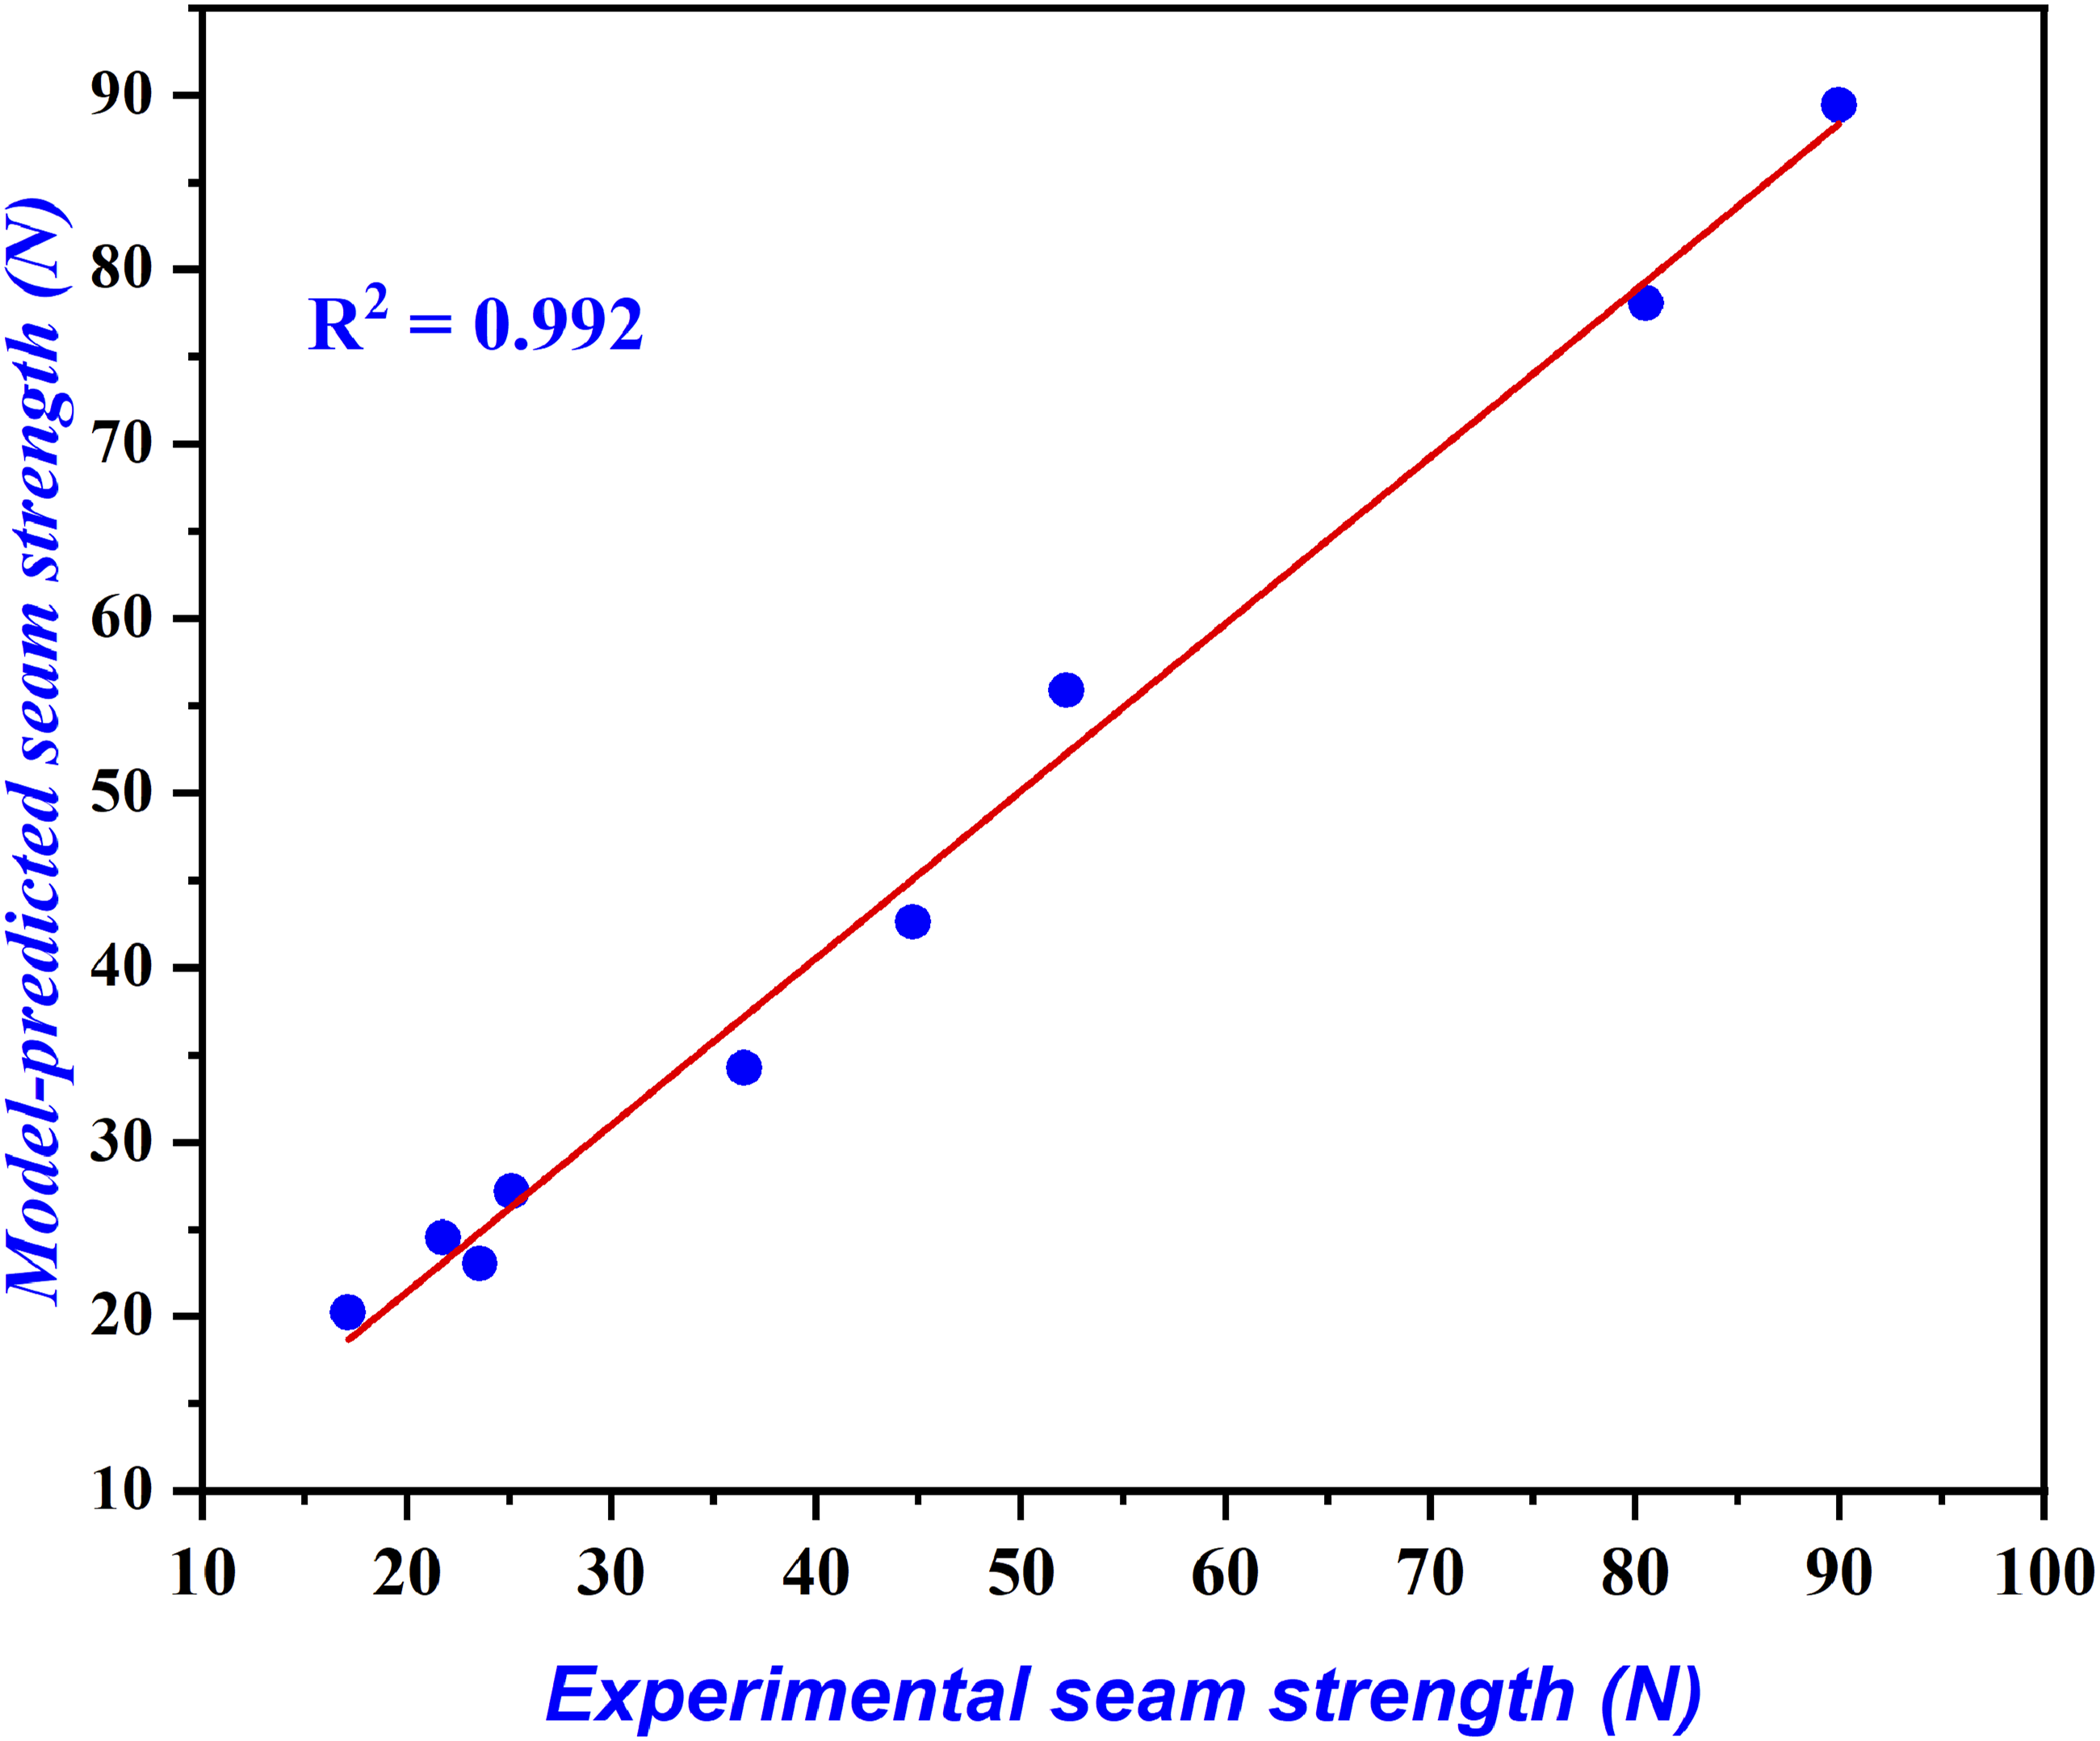
Analysis of the training performance plot, as presented in Figure 7 reveals smooth and steady convergence of the mean squared error with respect to an increase in the number of training epochs. There was no oscillation nor divergence between training and validation curves for learning dynamics, which suggested that the choice of network architecture and learning parameters was reasonable. It is also noteworthy that training, validation, and testing errors are very close apart, advocating the fact that the model complexity was well matched to the dataset size and overtraining was effectively avoided. Analysis of training performance.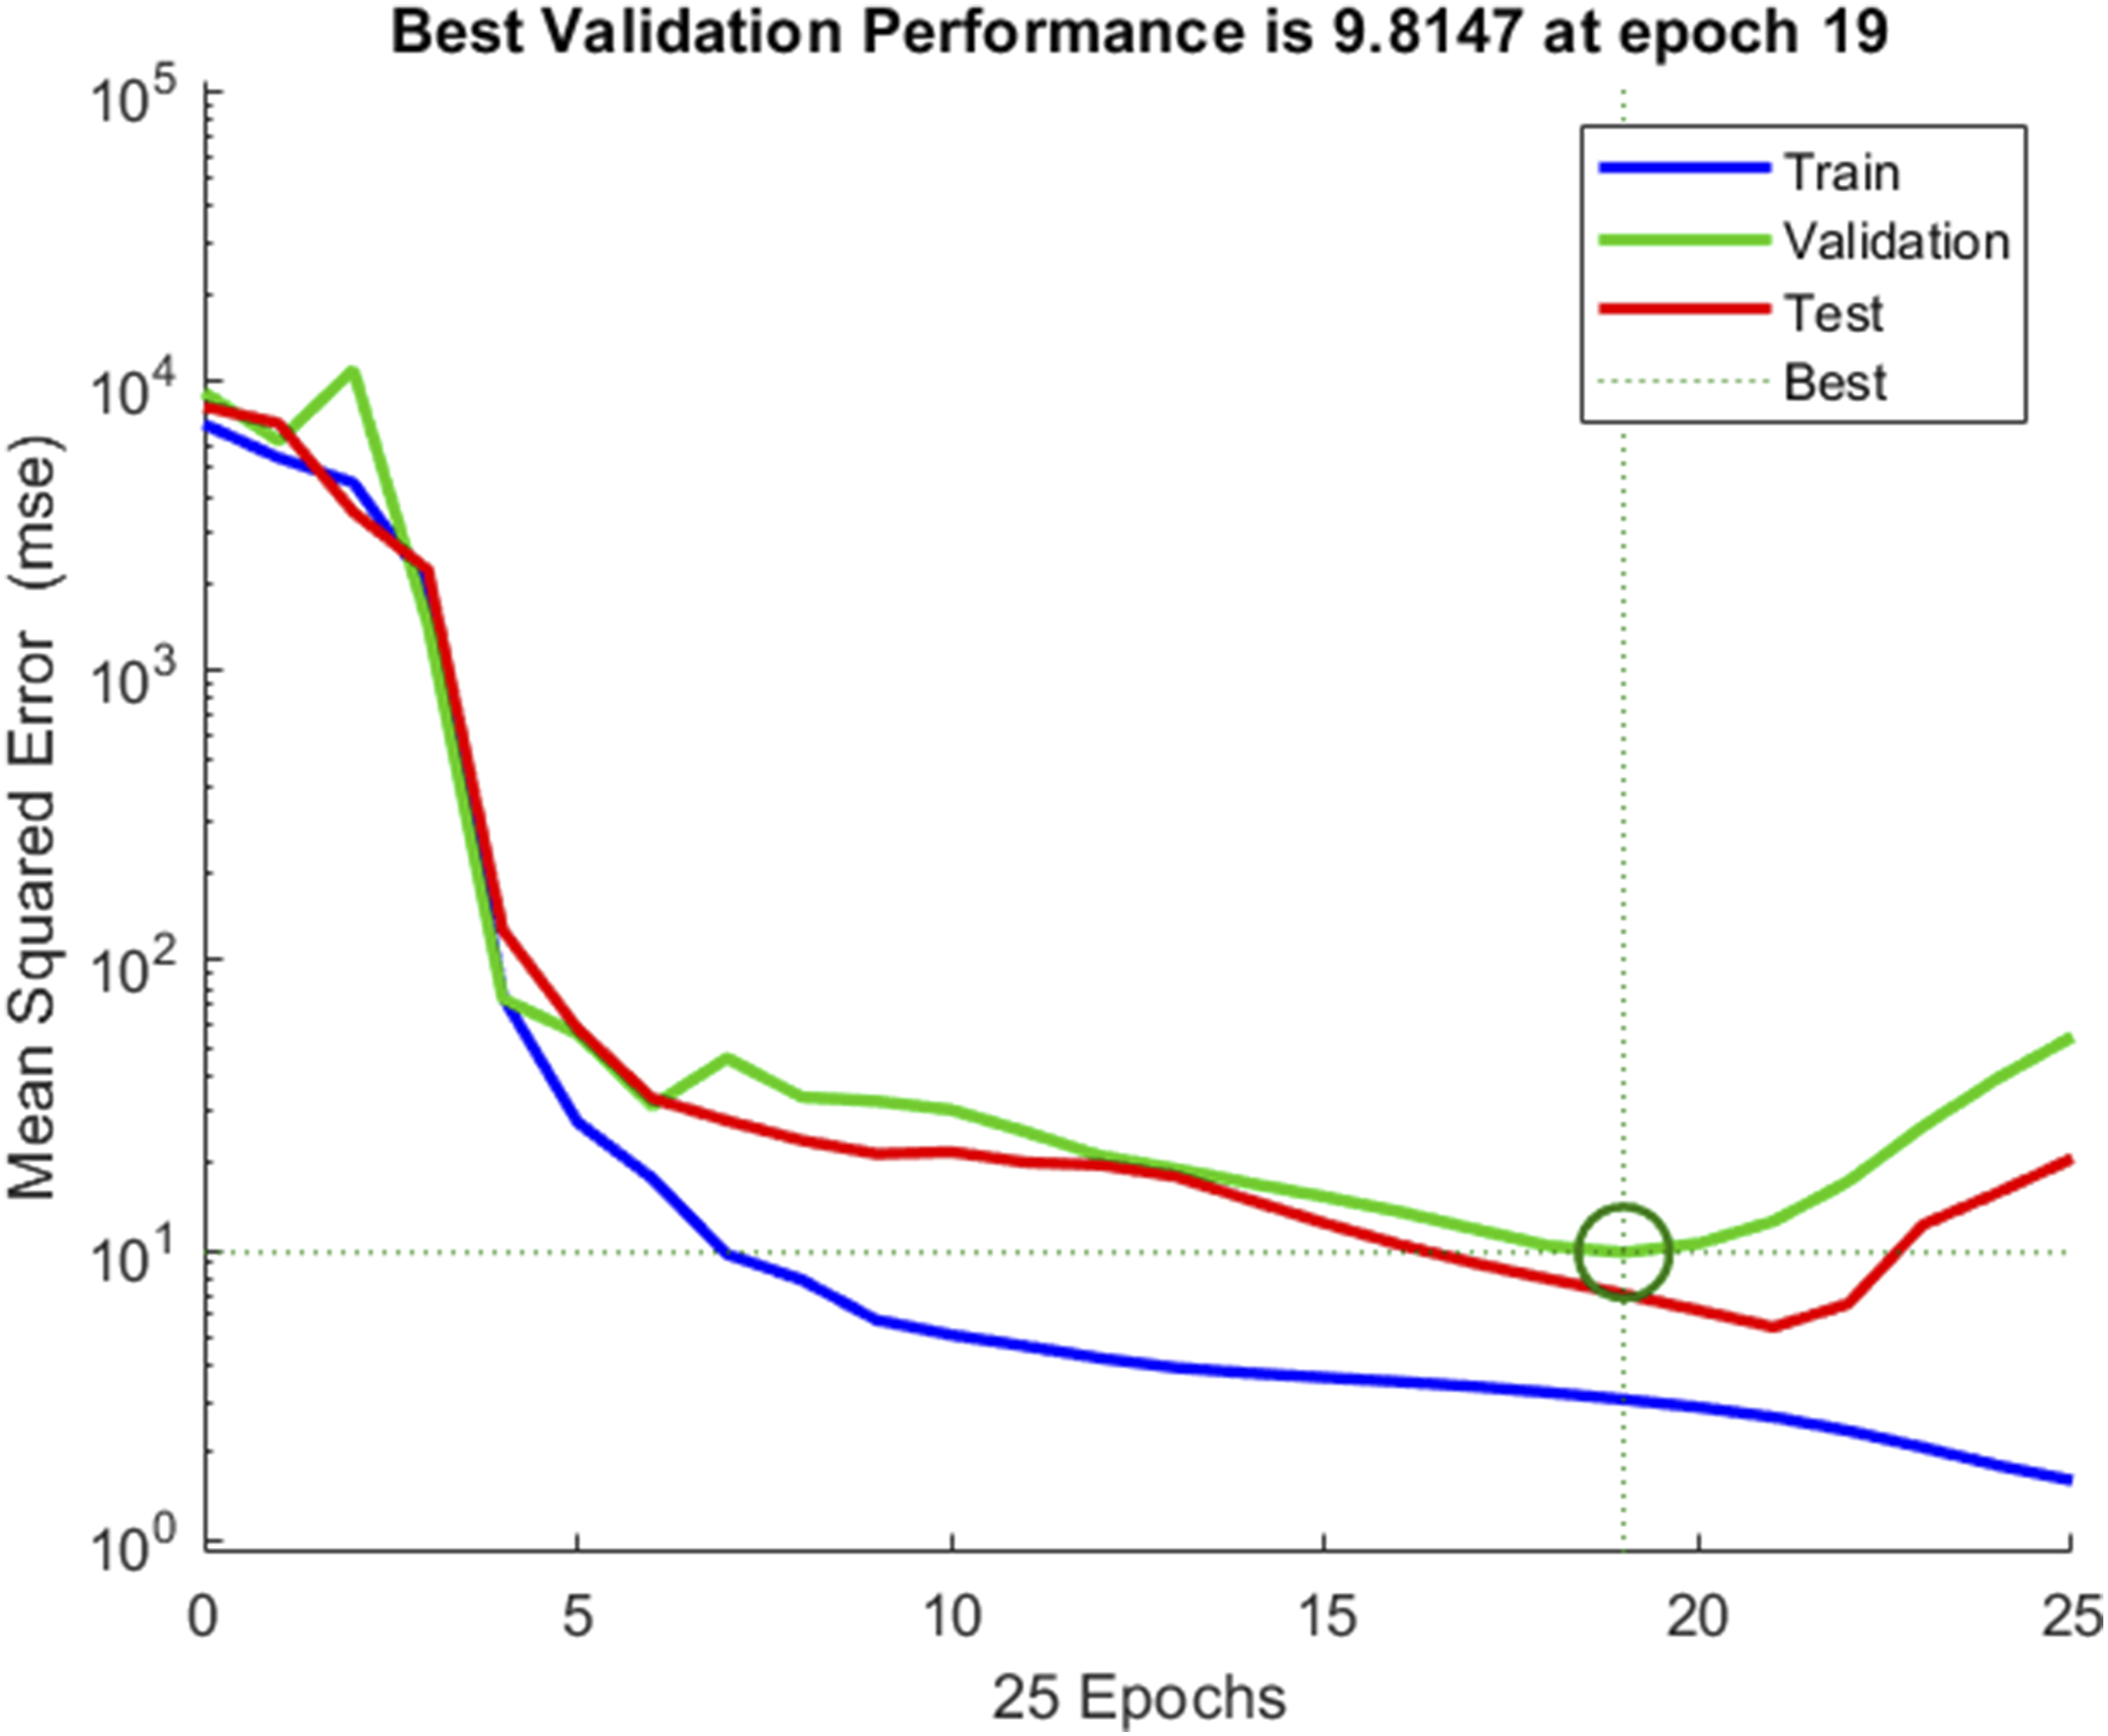
It can be observed from Figure 8 that training, validation, and test errors were high when the epochs were lower (0-5), meaning that the weights of the network had not been fully optimized, and the dataset was underfit by the model. There was a large decrease in the mean squared error between epochs 6 and 19 for all 3 datasets; the validation and test curves followed the training curve, indicating effective learning of generalizable features. The lowest validation error was achieved in epoch 19; as a result, this epoch is selected as the optimal training point. By the end of this epoch, the training error continued to decrease while the validation and test errors increased, a sign of the onset of overfitting because of pattern- specific memorization rather than improved generalization. Accordingly, early stopping at epoch 19 ensured optimal predictive performance and prevented overfitting. Error histogram of the developed model.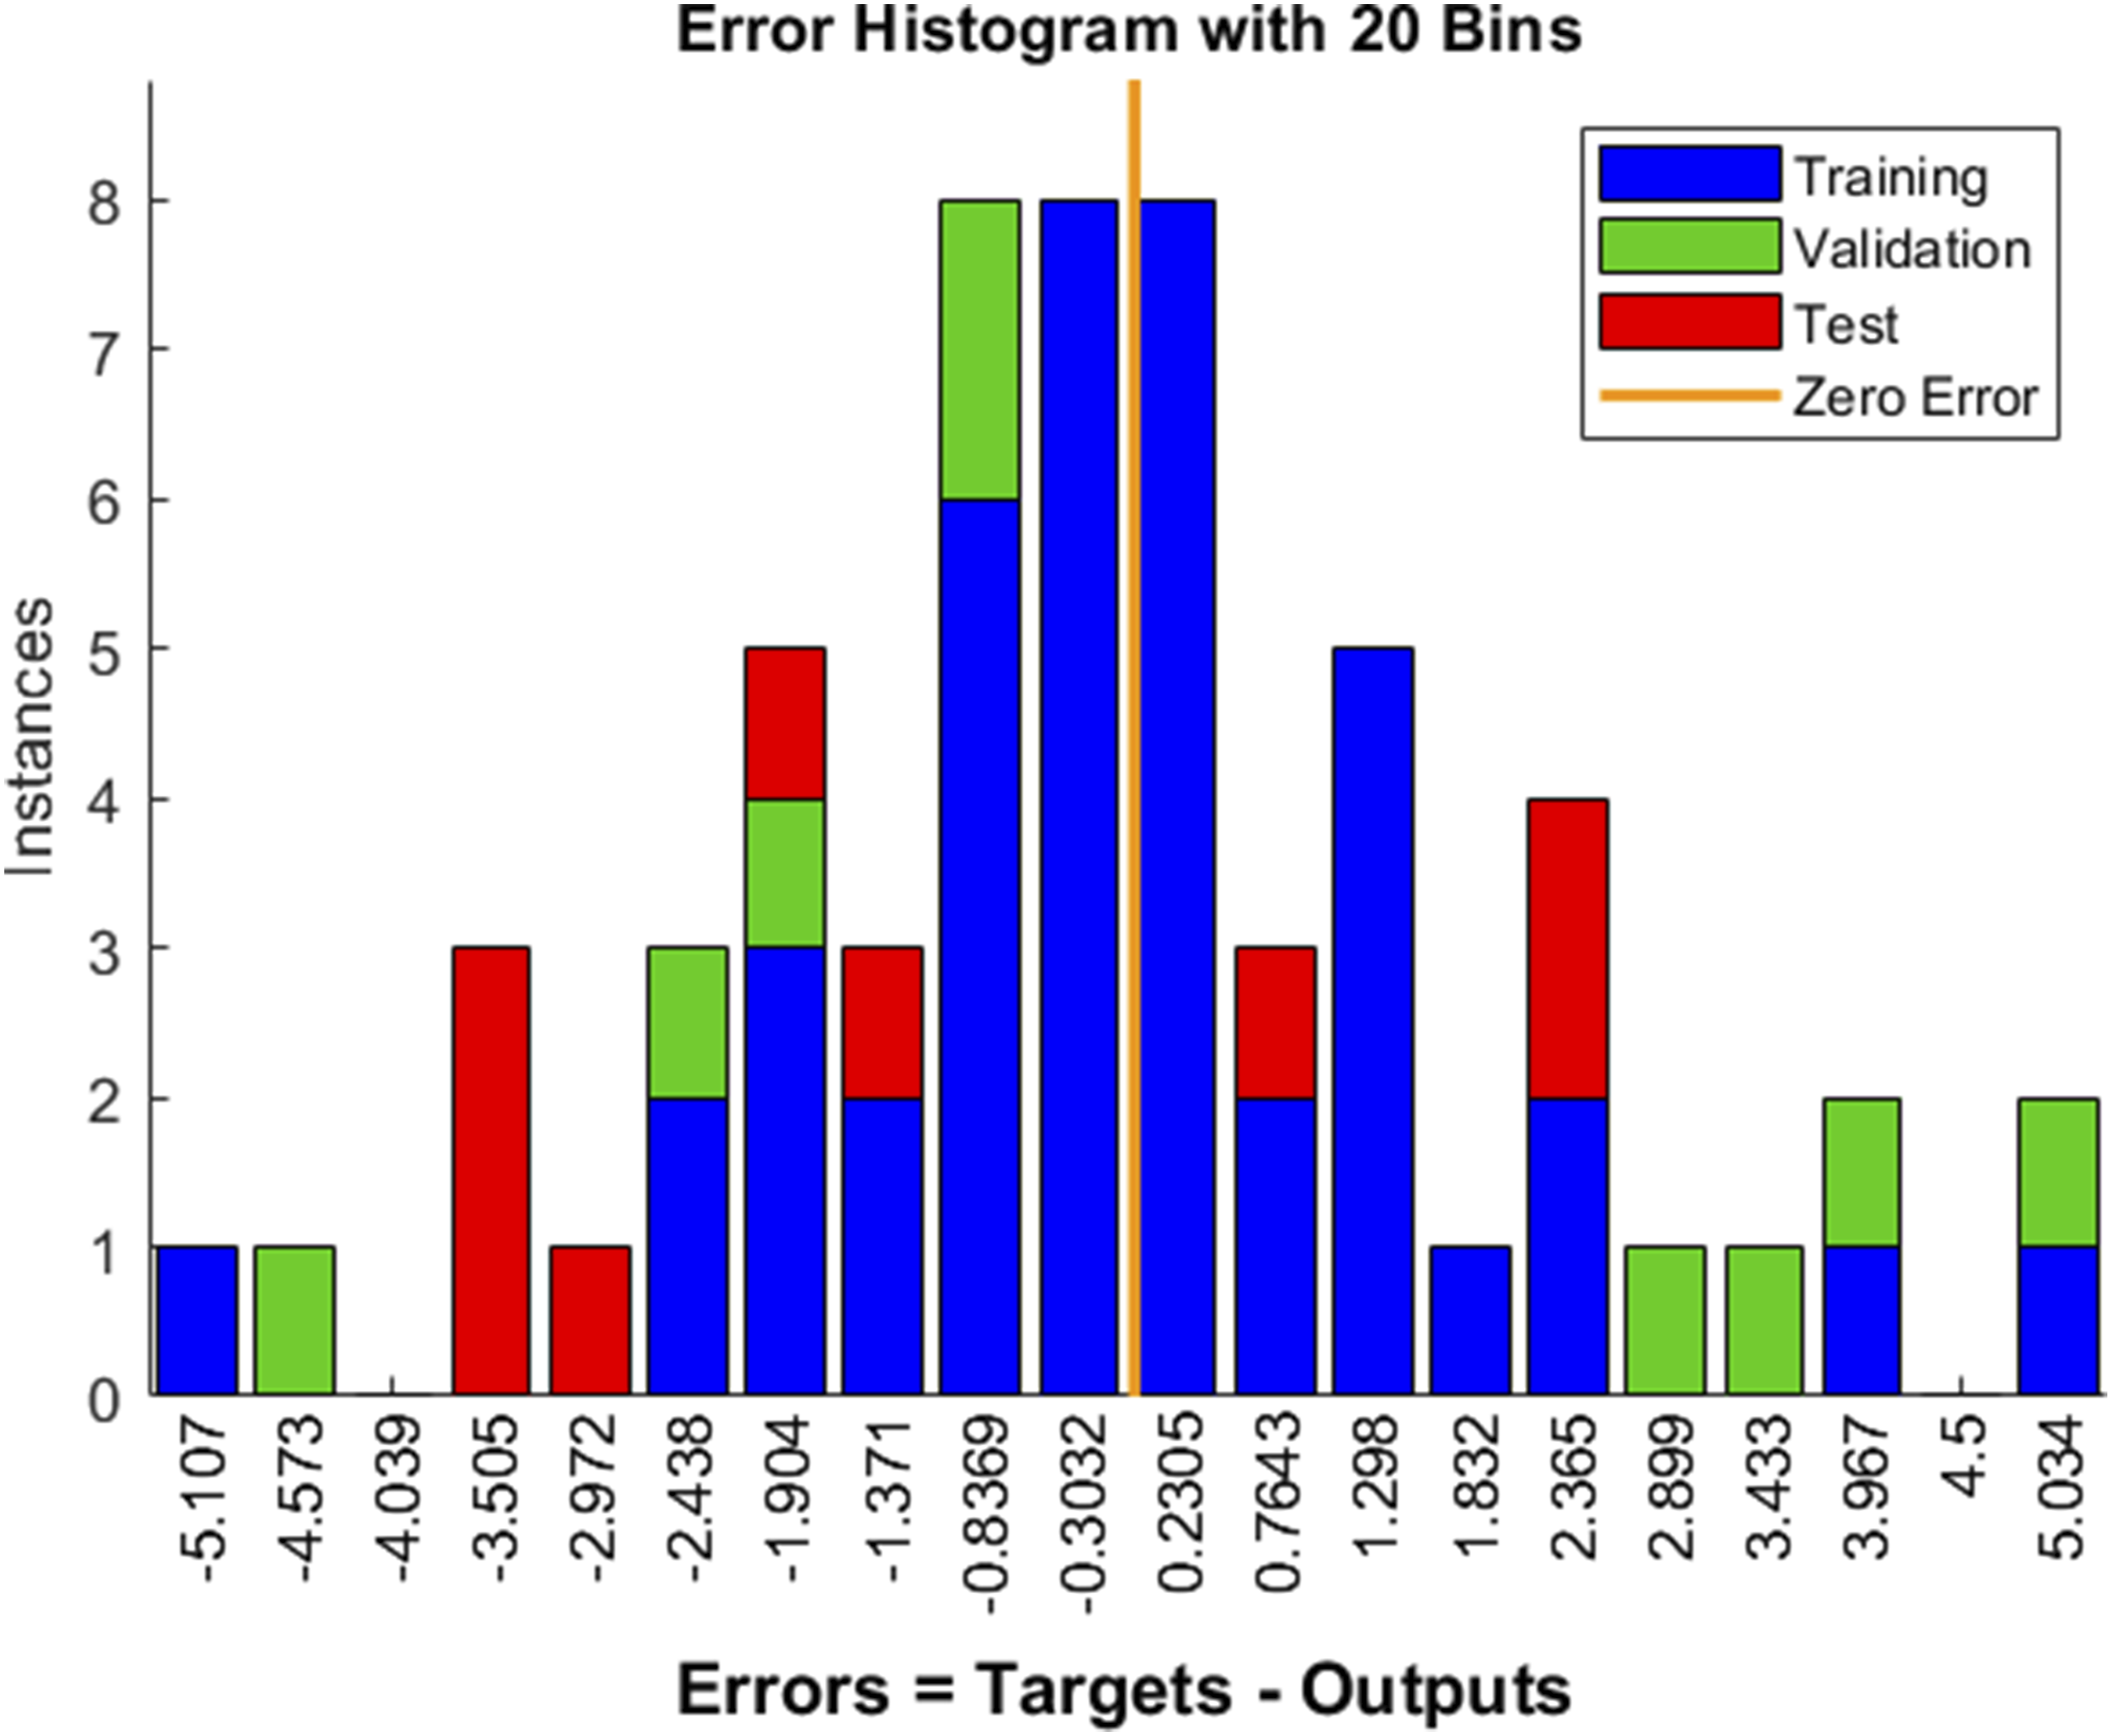
Residual behavior was analyzed using the error histogram of predicted errors (Figure 8). It has been found that the error distribution is symmetric, narrowly concentrated around 0, with both positive and negative errors occurring with similar frequency. There were no outliers grossly beyond the experimental variability. The symmetrical distribution of this residual dispersion demonstrates that the ANN does not systematically over- or under-predict seam strength and that random experimental noise was well averaged out by the model. 31 Identical error distribution properties have been found to be an important factor for the reliable performance of an ANN in textile property prediction applications.17,31
The holistic evidence of regression analysis results, high R2 values, low values of error magnitude, and also stable convergence dispersion behavior and unbiased distribution of residue confirms that the proposed ANN model is a precise, robust, and reliable approach for predicting seam strength value in all tested sewing parameter levels. Therefore, the model accuracy is also satisfactory for predictive analysis and sewing parameter optimization in the garment industry.
4 Novelty and limitations
In this work, a systematic and rigorously validated application of the ANN framework to predict the seam strengths of both superimposed and lapped seams is presented based on experimentally verified data. The primary novelty of this research lies in incorporating multiple seam classes within a single predictive ANN model, enabling direct comparison and unified prediction of seam strength across different seam geometries. In contrast to most existing seam strength modelling studies, which are developed under the assumption that only one type of seam is being sewn or are restricted to a limited range of input parameters, both sewing thread linear density and stitch density, along with seam class, have been incorporated into the present model explicitly, with its associated mechanical behaviors related to the seam geometry. An additional contribution is the value-consistent validation approach, in which the model performance was validated effectively through diverse statistics and global error indices. The use of distribution-based analysis, including box-whisker plots and error histograms, in conjunction with the use of different validation methods, improves validation confidence by providing information on prediction reliability and resistance to experimental noise. Furthermore, the capability of the ANN model not only to predict the overall trend but also to replicate the magnitude and saturation at high stitch densities enhances the application relevance of this model in data-driven optimization of sewing parameters in apparel manufacturing. In addition to predictive accuracy, the present framework also provides practical industrial relevance by supporting data-driven sewing parameter optimization for woven apparel manufacturing.
However, the following limitations should be recognized despite these contributions. The experimental dataset was limited to one woven cotton fabric construction and fiber type, which limits the direct generalization of model results to other fabric structures, yarn types, or finishing conditions. Only one stitch type (lockstitch 301) and a fixed machine setup were used in sewing, hindering the study regarding the influence of variables, including needle size, thread tension, sewing speed, and other stitch types, on seam strength. Furthermore, given the size of the dataset, which is adequate to draw valid trends and expect high predictive ability, it still remains relatively small for a broader ANN generalization in a wider framework. Although the model is suitable to interpolate within the given parameter range, it cannot guarantee its extrapolative prediction for application under untested sewing conditions. Lastly, as the ANN is a data-driven black-box model, it does not provide an explicit representation of the physics relating to seam failure. Therefore, there is a need for future investigations using larger datasets and either hybrid or physics-informed models to improve interpretability without sacrificing predictive efficacy.
5 Conclusion and future works
The work systematically studied the effects of sewing thread linear density, stitch density, and seam class on seam strength, as well as confirmed the suitability of an ANN-based model for accurately predicting seam strengths. Experimental results demonstrated that the seam strength of both superimposed and lapped seams increases with thread linear density and stitch density in a smooth way; the lapped seams are found to be stronger than the superimposed counterparts at a given sewing condition. Seam strength, in quantitative terms, ranged broadly (14-100 N) across the investigated parameter space, with an improvement of over 480%, and less incremental gain beyond 9 SPI. These nonlinear trends and saturation behaviour were well represented by the trained ANN model, where a satisfactory correspondence between experimental and predicted values is described with a high R2 value (0.992), low RMSE (2.38 N), and MAPE (6.96%). Additional distributional and diagnostic analyses supported reliable learning, unbiased residual behavior, and solid generalization. Taken together, these results indicate that the developed ANN model offers an accurate and data-efficient tool for seam strength prediction as well as informed sewing parameter selection within the investigated domain.
From an industrial application perspective, the developed ANN model may reduce repetitive physical seam testing, shorten product development time, support sewing parameter optimization, and improve seam quality consistency in apparel manufacturing environments. Future investigations may include comparative analysis between equivalent stitch-line configurations of different seam classes, such as multi-row superimposed seams and lapped seams, to isolate the individual effects of seam geometry and stitch-line reinforcement on seam strength behavior. In addition, future work will need to be focused on broadening the scope and interpretable value of this modeling framework. The experimental databases need to be extended to different types of fabric constructions, fiber contents, and finishing conditions, and other seam and stitch classes to make it more applicable. Integration of other sewing parameters, such as needle size, thread tension, the speed of the sewing operation, and machine settings, would provide a more complete representation of industrial sewing processes. Long-term performance characteristics, such as washing durability, cyclic loading, and environmental aging of the seam, should also be considered. From a modeling perspective, interdisciplinary ANN hybrid or physics-based methods that combine ANN with fuzzy logic or mechanistic constraints may enhance interpretability without sacrificing predictive performance. Such developments would expand the application of data-based seam strength prediction in a wider range of apparel and technical textiles applications.
Footnotes
Acknowledgments
The authors acknowledge the technical support provided by the Laboratory facilities at Khulna University of Engineering & Technology for sample preparation and characterization purposes. Special appreciation is extended to laboratory personnel for their assistance with experimental procedures and safety protocols.
Funding
The authors received no financial support for the research, authorship, and/or publication of this article.
Declaration of conflicting interests
The authors declare that there are no conflicts of interest related to the research, authorship, or publication of this article.
Data Availability Statement
The data that support the findings of this study are available from the corresponding author upon reasonable request.