
Abstract
In this article, we study how civilian victimization in civil war co-evolves with shifting territorial overlap among armed actors, focusing on the Colombian conflict between 1978 and 2007. We represent armed group presence and civilian targeting as bipartite municipality–actor networks and analyze municipality projection networks whose edge weights count shared armed structures. Combining topological diagnostics with Poisson stochastic block models for weighted projections, we identify a clear regime-based dynamic. Early periods exhibit localized and segmented overlap, with fragmented projections and weak coupling across municipal communities. As the conflict expands, overlap becomes corridorized and then consolidates into a highly redundant national backbone by 2000–2004, with dense cores and multiple alternative paths that distribute intermediation across several hubs. After 2004, the system contracts and thins, reducing core depth and weakening community separation, yet a giant connected component persists, producing fuzzier community boundaries. These results provide a compact and reproducible characterization of how territorial overlap in civilian targeting shifts from fragmentation, to corridor-based consolidation, to post-peak contraction.
Keywords
Introduction
During internal armed conflicts or civil wars, sovereignty becomes fragmented as the use of force is no longer monopolized by the State. Various actors compete for territorial control not only through direct military confrontations but also by targeting noncombatants, leading to territorial disputes that disproportionately affect civilians. Because irregular armies often face constraints in sustaining prolonged warfare, they may resort to violence against civilian populations, among other strategies, to consolidate regional power (Kalyvas, 2006, p. 87).
Population control is crucial for armed groups, since communities provide key resources such as shelter, supplies, and information. An armed group’s capacity to challenge rivals for control and to impose an alternative order depends largely on the effectiveness of its strategies of subjugation over the population. Through intimidation, these groups secure obedience, punish infractions, and deter collaboration with adversaries. Accordingly, the type and intensity of violence they employ become instruments to establish and maintain control (Arjona, 2016).
Kalyvas (2006) examines how attacks on civilians vary with the degree of territorial control exercised by an armed actor. When control is limited or contested, violence tends to be indiscriminate and extensive, as armed groups use it to secure their position and neutralize potential support for the enemy. By contrast, under exclusive control, selective violence is more effective and is typically associated with substantially lower levels of victimization. In such settings, exploiting the resources that the population can provide, including recruitment through forced enlistment, becomes more advantageous than relying on widespread coercion.
According to Kalyvas, civil wars are marked by high levels of territorial fragmentation during peaks of armed confrontation. Armed groups form “corridors” and induce relationships between noncontiguous regions by expanding their spheres of influence, establishing cooperative or competitive ties with other groups, or generating divisions that segment space. Rather than being fixed or absent, the boundaries separating locations in irregular war are diffuse and fluid. When disputes are intense, fragmentation becomes apparent as actors intermittently converge across multiple locations. Irregular warfare thus reshapes sovereignty, and the resulting spatial and territorial fragmentation reflects this shift. By contrast, when an actor consolidates territorial control, clearly delineated zones of influence tend to emerge.
Graphs provide a natural representation of complex relationships between ar med actors and regions during an armed conflict. This perspective supports the visualization of how interactions are configured and evolve within fragmented territories, where presence and control vary over time with the dynamics of the conflict. Statistical network analysis (e.g., Kolaczyk & Csárdi, 2014; Luke, 2015; Menzel, 2010) offers suitable tools for describing these relationships. In particular, stochastic block models (Aicher et al., 2014; Holland et al., 1983; Karrer & Newman, 2011; Nowicki & Snijders, 2001) can reveal fragmentation or segmentation by identifying communities of nodes with similar connectivity patterns.
In Colombia, a salient feature of recent internal armed conflicts is the systematic victimization of civilians as a strategy for contesting territorial control, as documented by the Centro Nacional de Memoria Histórica (CNMH, 2013). This study uses network analysis to examine how the relationships between the most prominent irregular armed groups and the municipalities they occupied evolved between 1978 and 2007. In addition, by employing stochastic block models for count data, we assess whether municipalities within the zones of influence of these armed actors formed clearly differentiated communities or whether these territories were highly interconnected, consistent with the fragmented and fluid nature of the conflict.
Based on information collected by the CNMH on the most impactful acts of victimization against noncombatants, including massacres, selective assassinations, forced disappearances, kidnappings, and forced recruitment, we define ten bipartite networks linking municipalities and armed structures between 1978 and 2007, together with their corresponding projections. Our analysis focuses on the most prominent irregular armies in the conflict, the Fuerzas Armadas Revolucionarias de Colombia (FARC) and the Autodefensas Unidas de Colombia (AUC). Although the AUC existed nominally from 1997 to 2005, it had clear antecedents in the early 1980s, so we include the paramilitary structures that preceded the AUC.
The paper is organized as follows. Section 2 introduces the graph framework, the municipality projections, and stochastic block models for weighted networks. Section 3 describes the data sources, periodization, and the construction of the bipartite incidence matrices and municipal projection networks, together with descriptive network features across periods. Section 4 fits Poisson stochastic block models to each projected network and summarizes the evolution of community structure over time. Section 5 concludes with a discussion of substantive implications and limitations.
Methodology
In this section, we present the main methodological elements of community detection. We first provide a concise characterization of graphs and bipartite graphs, and then discuss clustering and stochastic block models for count data. For an accessible introduction, see Menzel (2010), Kolaczyk and Csárdi (2014), and Luke (2015), among others.
Graphs and Bipartite Graphs
A graph is a mathematical structure composed of vertices (nodes or actors) and edges (links or connections) that join pairs of vertices, and it is widely used to represent relational data. Formally, a graph
A graph can be undirected, where
A bipartite graph is a type of graph where the vertex set can be partitioned into two disjoint sets, usually denoted by
For each period
When projecting onto municipalities, we obtain an undirected weighted graph
The municipal projection
Stochastic Block Models
A stochastic block model (SBM) is a random graph framework for inferring groups or communities in a network. Following Kolaczyk and Csárdi (2014), consider a set of
In an SBM, each vertex
Class membership is commonly modeled as independent draws from a categorical distribution on
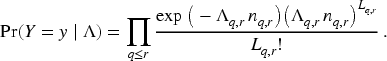
For networks with count valued weights, a Poisson SBM assumes that each entry
Network Construction and Processing
Given that violence has taken multiple forms and levels of severity, this research focuses on the most serious human rights violations, specifically those related to the rights to life, physical integrity, liberty, and personal security (Consejo de Estado, 2019). Accordingly, we use data on massacres, enforced disappearances, targeted killings, kidnappings, and illegal recruitment attributed to FARC substructures and to paramilitary groups that operated between 1978 and 2007.
Direct military engagements between armed actors are not considered, since they reflect different dimensions of armed group behavior in civil wars. According to Kalyvas (2006), confrontation among belligerents aims to defeat the adversary and involves military strategies and combat tactics directed primarily at armed opponents. By contrast, violence against civilians follows a different logic. It does not necessarily seek immediate military advantage, instead it aims to consolidate territorial control, undermine support for rival actors, and secure local resources. This violence is typically selective and intended to shape civilian behavior in line with the perpetrator’s interests, through intimidation, retaliation, or cooptation.
To reconstruct the territorial presence of FARC and paramilitary structures, we rely on event level data compiled by the Observatorio de Memoria y Conflicto (OMC), an initiative of Colombia’s Centro Nacional de Memoria Histórica (CNMH). The OMC systematically documents human rights violations, breaches of international humanitarian law, and other forms of political violence associated with the armed conflict. For each repertoire of violence, the dataset includes two relational tables. One records individual cases and another identifies victims. Both provide anonymized information on the year and municipality of occurrence and on the armed group held responsible. These data are used to construct bipartite networks linking municipalities and armed structures, from which we derive municipal projections for subsequent analysis.
The OMC documented the victimization of 318,826 individuals for the types of violence considered in this study. Of these, 217,629 have records for the variables used to attribute responsibility. We identify 85,166 individuals whose victimization can be attributed to armed structures of the FARC, paramilitary groups, and organized crime, excluding groups formed after the demobilization of the AUC. The information by event type is reported in Table 1.
Number of Victims by Type of Violence. He Row “Armed Group and Year of Occurrence Available” Reports the Number of Victims for Whom the Dataset Contains Both the Responsible Armed Group and the Year of Occurrence, Which are Needed to Assign Events to Periods and to Build the Bipartite Networks.
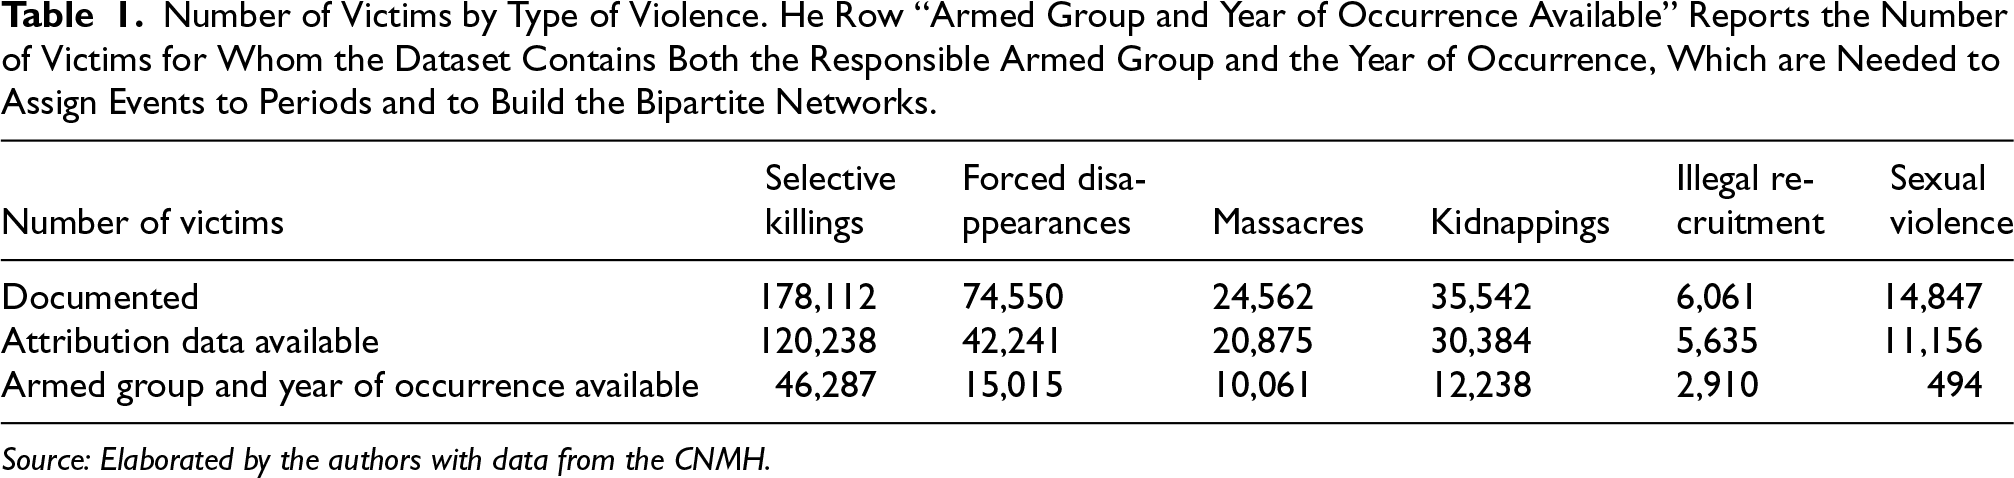
Number of Victims by Type of Violence. He Row “Armed Group and Year of Occurrence Available” Reports the Number of Victims for Whom the Dataset Contains Both the Responsible Armed Group and the Year of Occurrence, Which are Needed to Assign Events to Periods and to Build the Bipartite Networks.
Source: Elaborated by the authors with data from the CNMH.
Moreover, the OMC dataset does not systematically report the specific military unit responsible for each event attributed to the FARC or paramilitary organizations. To address this limitation and ensure spatial and temporal consistency in the networks, we consulted additional sources to identify the armed structures active in each period and to reconstruct their geographic scope of influence over time. This reconstruction is based on the historiographic series produced by the CNMH (2013; 2017a; 2017b; 2018a; 2018b; 2019a; 2019b; 2020a; 2020b; 2021a; 2021b; 2021c; 2021d; 2021e; 2022a; 2022b; 2022c; 2022d; 2022e; 2022f; 2022g; 2022h; 2022i; 2023a; 2023b; 2023c; 2023d; 2023e; 2023f), the Commission for the Clarification of Truth, Coexistence and Non-Repetition (CEV) (CEV, 2022a, 2022b, 2022c, 2022d, 2022e, 2022f, 2022g, 2022h, 2022i), and a systematic review of Noche y Niebla, the human rights bulletin published by the Centro de Investigación y Educación Popular/Programa por la Paz, covering volumes 1 through 36 from 1996 to 2008, available at https://www.nocheyniebla.org. We also follow Medina Gallego et al. (2011) and Vélez (2001) to recover regional information on FARC EP operations. Taken together, these sources provide a more reliable basis for reconstructing the spatial distribution of armed group presence and activity.
Based on the recovered information, we build an incidence matrix for each period in the analysis. Rows correspond to municipalities and columns to armed units. Entries are binary, with a value of 1 indicating civilian targeting by a given armed structure in a municipality during period t, and 0 otherwise. From each incidence matrix, we construct a municipal projection network as a weighted undirected graph, where an edge links two municipalities if they were jointly targeted by one or more armed structures during the same period. Edge weights equal the number of distinct armed units that carried out civilian targeting in both municipalities. These matrices form the basis of the network analysis presented in the subsequent sections.
This research is organized into periods defined by major political and institutional developments that reshaped the strategies, structures, and territorial presence of armed actors. Instead of imposing evenly spaced intervals, we define periods around critical turning points that altered the dynamics of the conflict. These include shifts in state doctrine and security policy, strategic decisions on territorial expansion by insurgent organizations, and the evolution of paramilitary structures. This division supports a historically grounded approach to modeling changes in the spatial distribution of armed group activity.
The first period begins with the FARC Sixth Conference in 1978, which reaffirmed the group’s military strategy and set the stage for territorial expansion. This phase also coincides with the implementation of the Estatuto de Seguridad, associated with increased repression and human rights violations committed by actors linked to state security forces, including La Mano Negra and Los Escuadrones de la Muerte.
Between 1982 and 1984, the FARC held the Seventh Conference, where it adopted a more explicitly political military strategy, launched its Plan Estratégico, and began forming its first mobile columns. At the same time, a fragile truce between insurgent groups and drug trafficking networks began to fracture. Armed confrontation between the FARC and public forces escalated, and the first paramilitary groups, including Los Escopeteros, Los Sanjuaneros, Los Tiznados, and Las Autodefensas Campesinas del Magdalena Medio, began to emerge.
The third period, 1985 to 1987, includes the founding of the political party Unión Patriótica (UP) and the subsequent wave of selective violence targeting its members. The convergence of armed conflict and narcotrafficking intensified, culminating in the 1985 Palacio de Justicia siege by M 19 and the violent state response. These events marked a deepening militarization of the conflict and the erosion of legal political alternatives for the left.
The period from 1988 to 1990 was defined by intensified political violence and a deeper entanglement between armed conflict and organized crime. The assassinations of multiple presidential candidates, together with the systematic targeting of judges, journalists, and local officials, underscored the vulnerability of democratic institutions and the deterioration of public security. During this time, paramilitary activity expanded in rural areas with growing impunity, while guerrilla insurgencies intensified attacks on military and police installations as part of a broader strategy to pressure the State into negotiation. The period closes with the initiation of peace talks involving several guerrilla factions, laying the groundwork for the demobilization processes of the early 1990s.
Between 1991 and 1993, the conflict entered a transitional phase. Several guerrilla and paramilitary groups, such as M 19, the EPL, the PRT, Quintín Lame, the ACMM, and Los Tangueros, demobilized. The 1990 capture of Casa Verde, the FARC main headquarters, signaled a shift in the State’s military posture toward the insurgency. During this time, the FARC strengthened its organizational capacity, while the paramilitary movement began to reorganize after the deaths of key leaders.
The period 1994 to 1996 was marked by the consolidation and expansion of paramilitary forces, often facilitated by elements within the State. The spread of paramilitary violence across several regions coincided with heightened competition over control of drug trafficking routes. These years were characterized by escalating violence and deepening state complicity, which further undermined official efforts to contain the conflict.
From 1997 to 1999, paramilitary groups unified under the banner of Autodefensas Unidas de Colombia (AUC), centralizing operations and intensifying counterinsurgency efforts. The AUC territorial expansion coincided with a marked increase in violence against civilians, while peace negotiations with the FARC began, leading to the demilitarization of five municipalities in southern Meta and northern Caquetá.
The 2000 and 2001 period marked the peak of the armed conflict. Violence intensified during ongoing peace talks with the FARC, as the group consolidated a rebel order in territories it had historically held, while paramilitary groups, often operating with the tacit support of public forces, expanded the territorial dispute. In parallel, the national government, backed by US funding, launched a state building strategy known as Plan Colombia, focused on military assistance and the dismantling of drug trafficking networks. These dynamics contributed to widespread massacres and forced displacement, severely affecting civilian populations and disrupting local governance.
Between 2002 and 2004, the breakdown of peace negotiations with the FARC, the opening of talks with the AUC, and the implementation of the Política de Seguridad Democrática under President Uribe redefined the conflict’s trajectory. Although overall levels of violence began to decline, new intra paramilitary rivalries emerged, particularly in regions where factions split from the AUC. In 2002, the Bloque Central Bolívar asserted its autonomy, foreshadowing further fragmentation.
Finally, the 2005 to 2007 period encompasses the formal demobilization of the AUC. Although the process dismantled major paramilitary blocs, it did not end violence. Many former combatants regrouped into emerging criminal organizations, often referred to as bandas criminales or BACRIM, which rapidly moved to occupy territories previously held by the AUC.
Characterization of Bipartite Networks
This subsection characterizes the bipartite networks over time by examining global graph properties and their relevance to the dynamics of the armed conflict.
Figures 1 and 2 trace the evolution of order, size, and density in the bipartite networks across periods. Overall, nodes and edges increase steadily, reflecting the organizational and territorial expansion of armed groups. Growth is especially pronounced in the study’s first decade: FARC units nearly quadruple, rising from 14 fronts in 1978–1981 to 51 by 1988–1990, consistent with the strategic shifts initiated at the 1982 Seventh Conference. Paramilitary growth follows a similar but slightly delayed trajectory, increasing from 8 documented units to 30 by 1988–1990 due to the proliferation of regional self-defense groups and counterinsurgency projects. Although some right-wing structures demobilized between 1991 and 1993, their numbers continued rising until 1996, when a national paramilitary project consolidated. During this same period, the FARC also expanded, ending the decade with 35% more fronts and mobile columns.
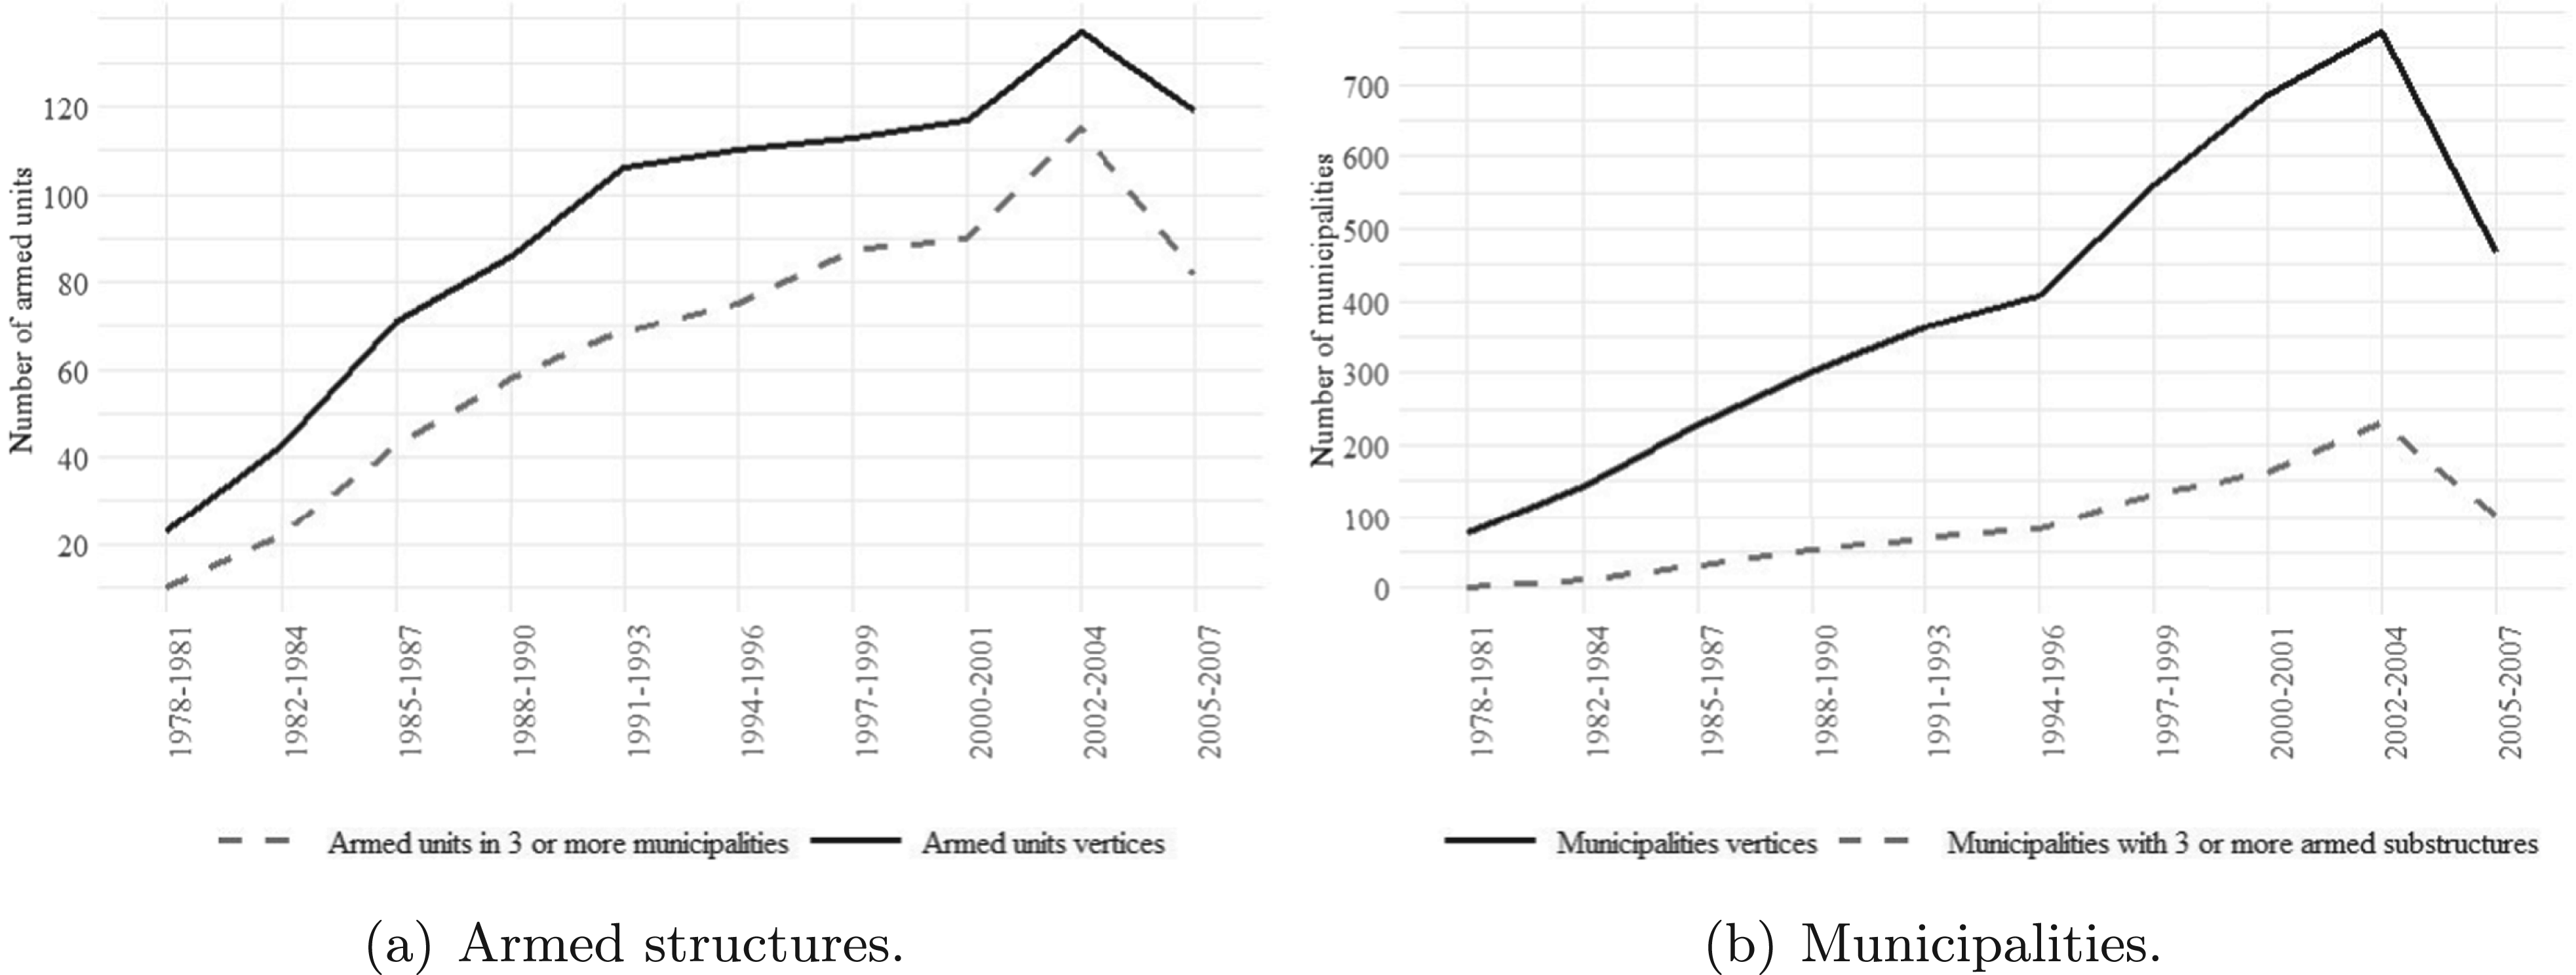
Order of bipartite networks, 1978–2007. (a) Armed structures.; (b) Municipalities.
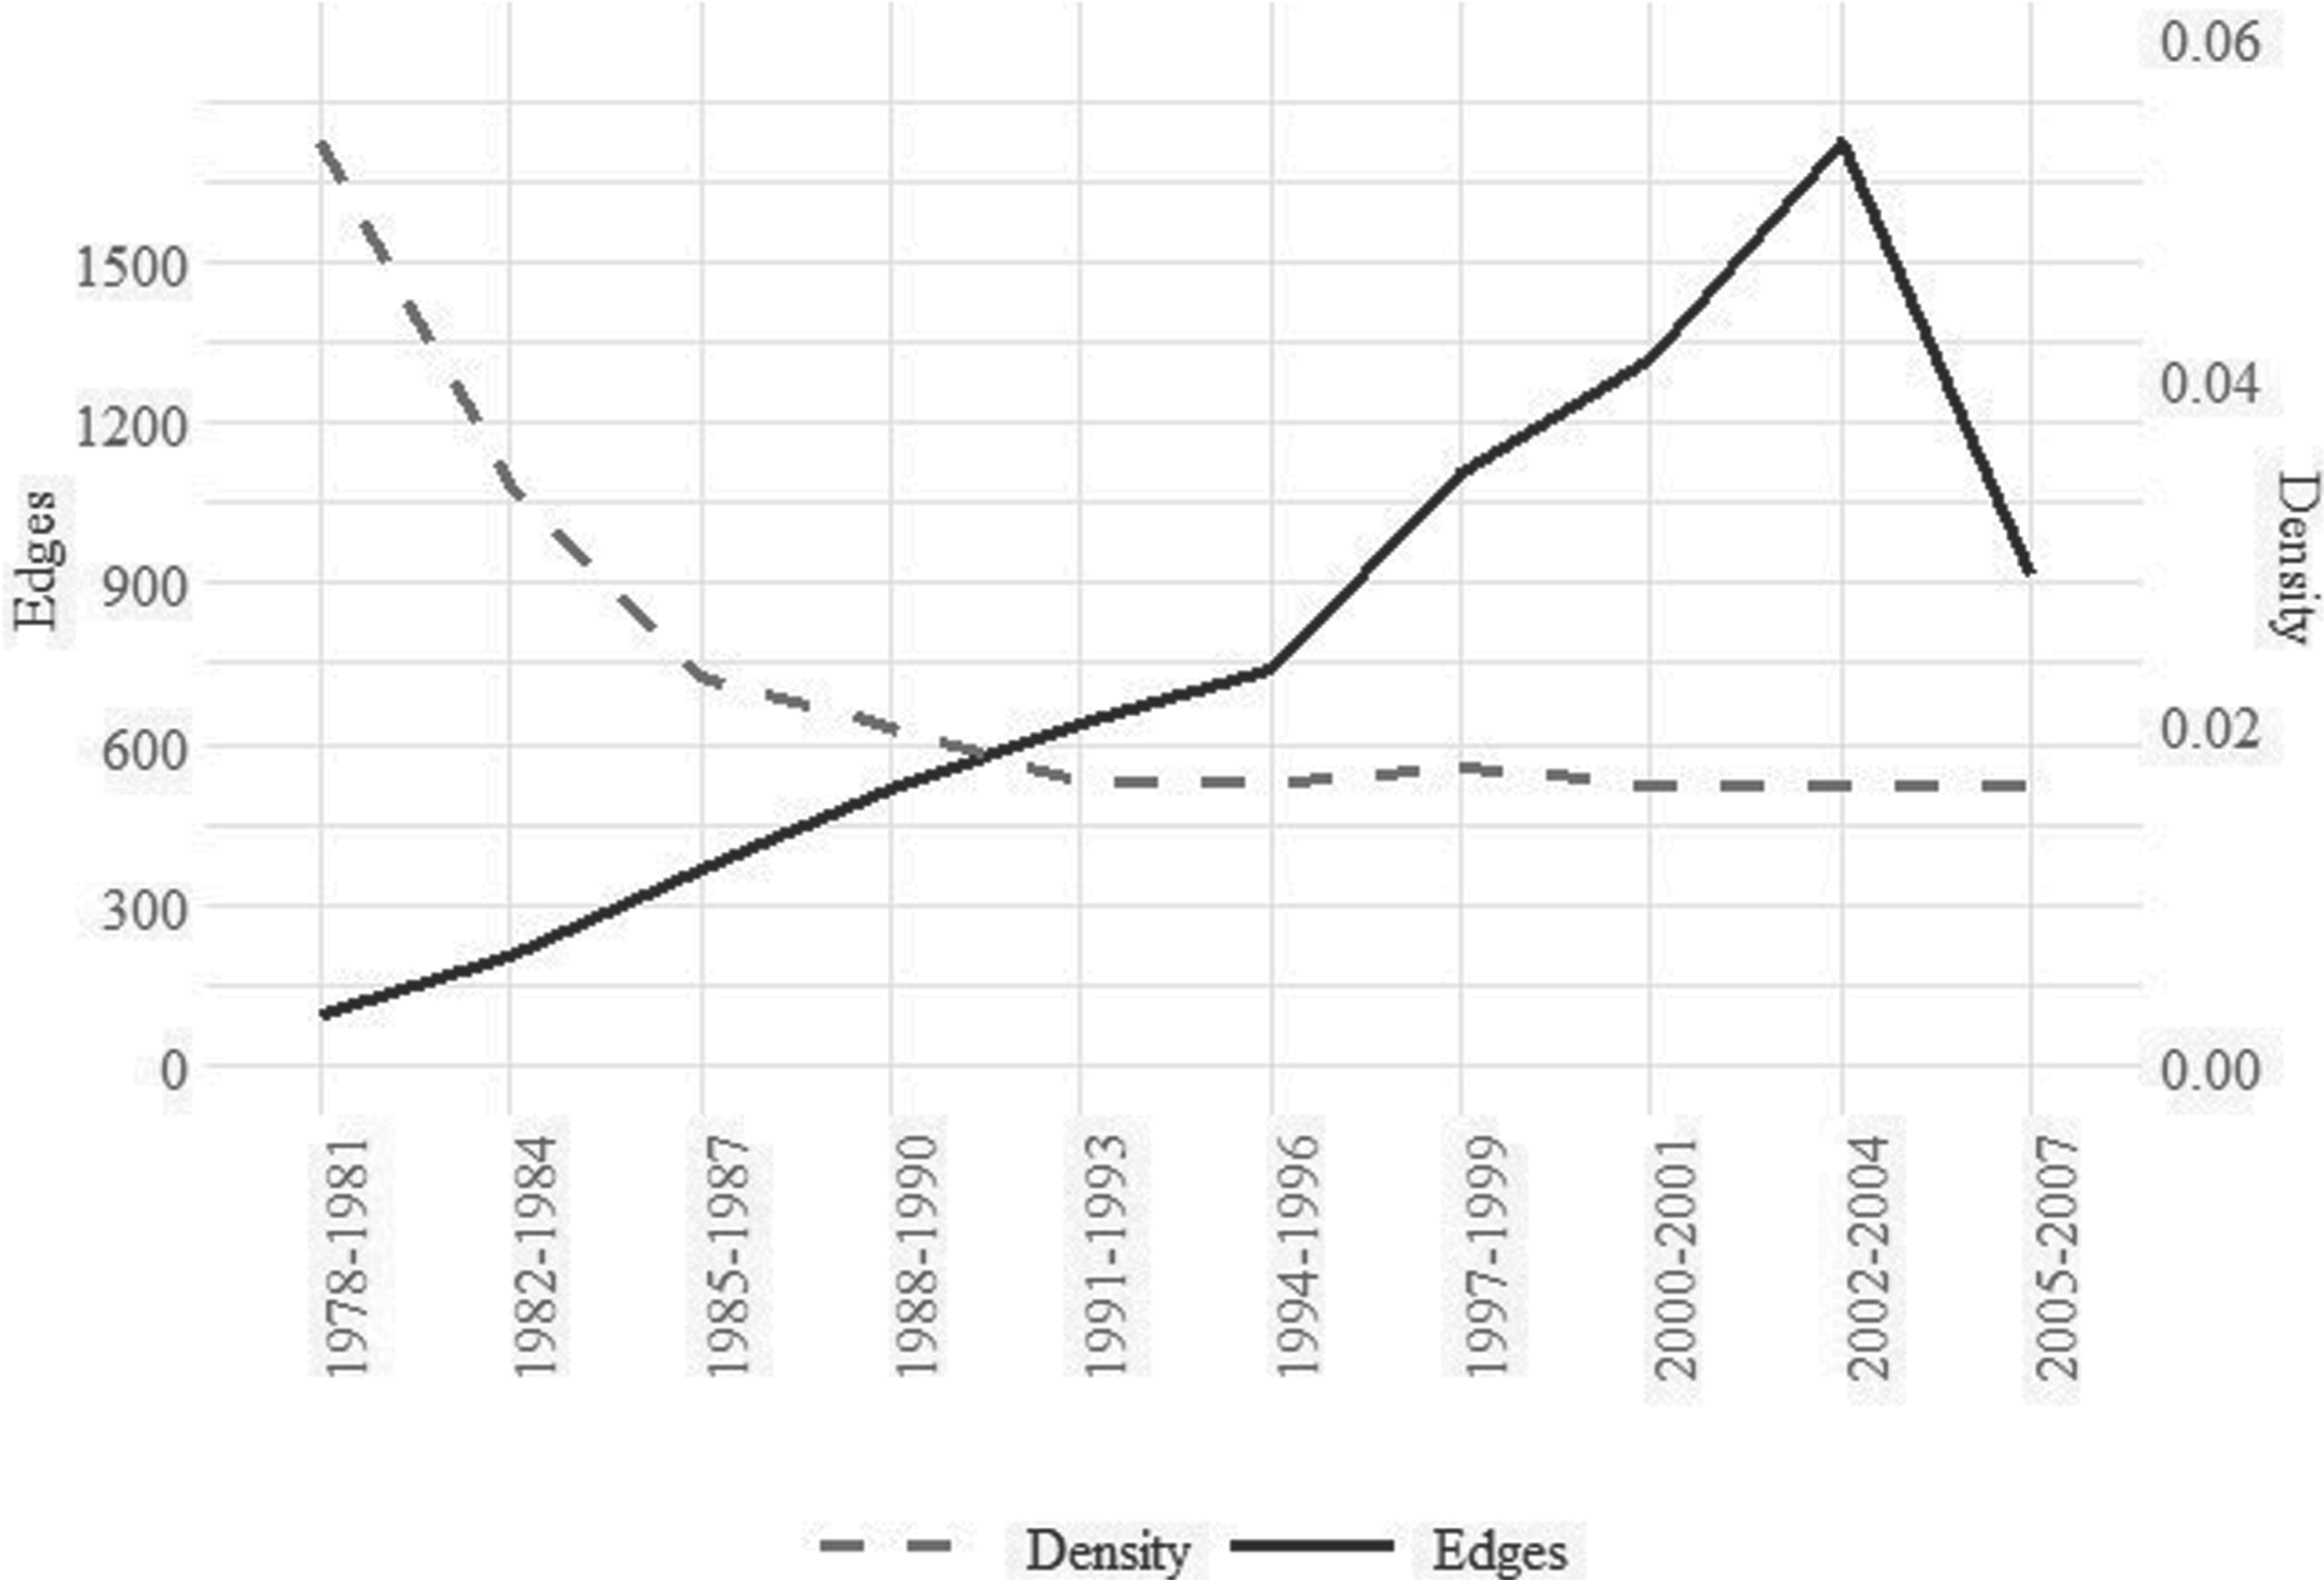
Size and density of bipartite networks, 1978–2007.
The number of armed units reached its peak in 2002–2004, corresponding to the FARC’s largest organizational expansion. At this point, the group—especially its Bloque Oriental—recorded the highest number of combatants in its history. On the paramilitary side, the rise in structures reflected internal splits during the peace negotiations advanced under President Uribe. The Bloque Central Bolívar and allied substructures declared autonomy, forming a separate organization with its own command, contributing to the proliferation of paramilitary units. A sharp decline followed in 2005–2007 as several AUC substructures demobilized. Meanwhile, the FARC suffered a major setback with Plan Patriota, a large-scale military operation that dismantled eleven fronts around the capital and reduced the group’s overall structure. Although the FARC remained able to sustain the conflict, its strategy of besieging the national government was no longer viable.
Similarly, the number of municipalities affected by victimization rose steadily until 2002–2004, after which the territorial presence of both actors declined, especially in the central region. Network density remained low, decreasing until 1997 and stabilizing thereafter. Although nodes and edges increased, the network became more dispersed as interactions spread across a wider set of municipalities and substructures. Territorial overlap also grew, but municipalities with three or more substructures increased more slowly than those with one or two. Thus, while armed presence expanded nationally, intense overlap widened more gradually, indicating that the most complex territorial disputes remained concentrated in specific regions even as the overall number of affected municipalities continued to grow.
The degree distribution for armed structures and municipalities in the bipartite systems shows that the average number of municipalities in which an armed group operated rose from 1978 to 1993, with the mean increasing from 4.09 to 6.03 and the third quartile from 4 to 8. A clear structural shift appears in 1994 with the formation of Las Autodefensas Campesinas de Córdoba y Urabá, which expanded to 175 municipalities—well above the range of most organizations, 75% of which operated in no more than seven. This highlights the ACCU’s territorial reach relative to other actors. From then on, degree asymmetry intensifies, producing more extreme outliers, especially in 2002–2004, when the AUC’s Bloque Norte emerges as the most expansive substructure. In later periods, the number of highly expansive units declines, consistent with growing fragmentation during and after demobilization.
A similar pattern emerges for the municipal side of the bipartite network. The average vertex degree increased from 1978 to 2004, rising from 1.24 to 2.23, while the maximum increased from 3 to 17. This growing asymmetry suggests increasing centralization, where a small number of highly connected municipalities acted as territorial hubs. In the early periods, the municipalities concentrating most connections were small cities clustered mainly in the Magdalena Medio region. Between 2002 and 2004, the highest degree vertices correspond to the country’s largest cities, consistent with the expansion of the conflict from rural areas to urban centers.
To assess territorial overlap among armed groups, it is useful to examine changes in the number of connected components in the bipartite networks. A larger component count indicates more spatially isolated operations, whereas a smaller count reflects greater interconnection. The number of components and the size of the giant component across periods shows that in the first period, most armed groups, particularly FARC units, occupied small disconnected clusters. By the second period, some components began to centralize around paramilitary structures linked to multiple municipalities. This was followed by expansion driven by the FARC Seventh Conference, which promoted the creation of new fronts by splitting existing ones, extending presence into additional territories with limited competition. As the conflict intensified, the number of separate clusters declined steadily and the giant component grew continuously, reaching by 2004 a pattern consistent with increasing structural integration. This trend reverses in the final period, when paramilitary groups undergo substantial fragmentation.
To analyze territorial configurations shaped by interactions among armed actors, we examine the municipal projections of the bipartite system. The strength distributions for these networks shows that from a low-connectivity system in 1978, where vertices are only weakly linked, the topology shifts toward a left-skewed distribution. Beginning in 1985, extreme outliers increase and the median strength doubles between the third and fifth periods. This pattern later reverses as a subset of actors becomes dominant, generating dense and overlapping subgraphs. These cohesive clusters follow directly from the projection: the broader an actor’s territorial scope, the larger the interconnected municipal grouping in the one-mode projection. Thus, in periods of high territorial mobility, network strength rises, reflecting stronger structural integration across conflict-affected regions. Between 1997 and 2007, however, the distribution becomes increasingly right-skewed: although the median continues to grow, upper quartiles and outliers expand faster, with a small number of municipalities concentrating most ties while many remain sparsely connected.
We assess the plausibility of power law behavior in the strength distributions, of the form
For each period, we estimate the lower bound
As shown in Table 2, the power law hypothesis cannot be rejected in four of the seven periods, 1988 to 1990, 1991 to 1993, 1997 to 1999, and 2002 to 2004, where
Power-law fit parameters for strength distributions.
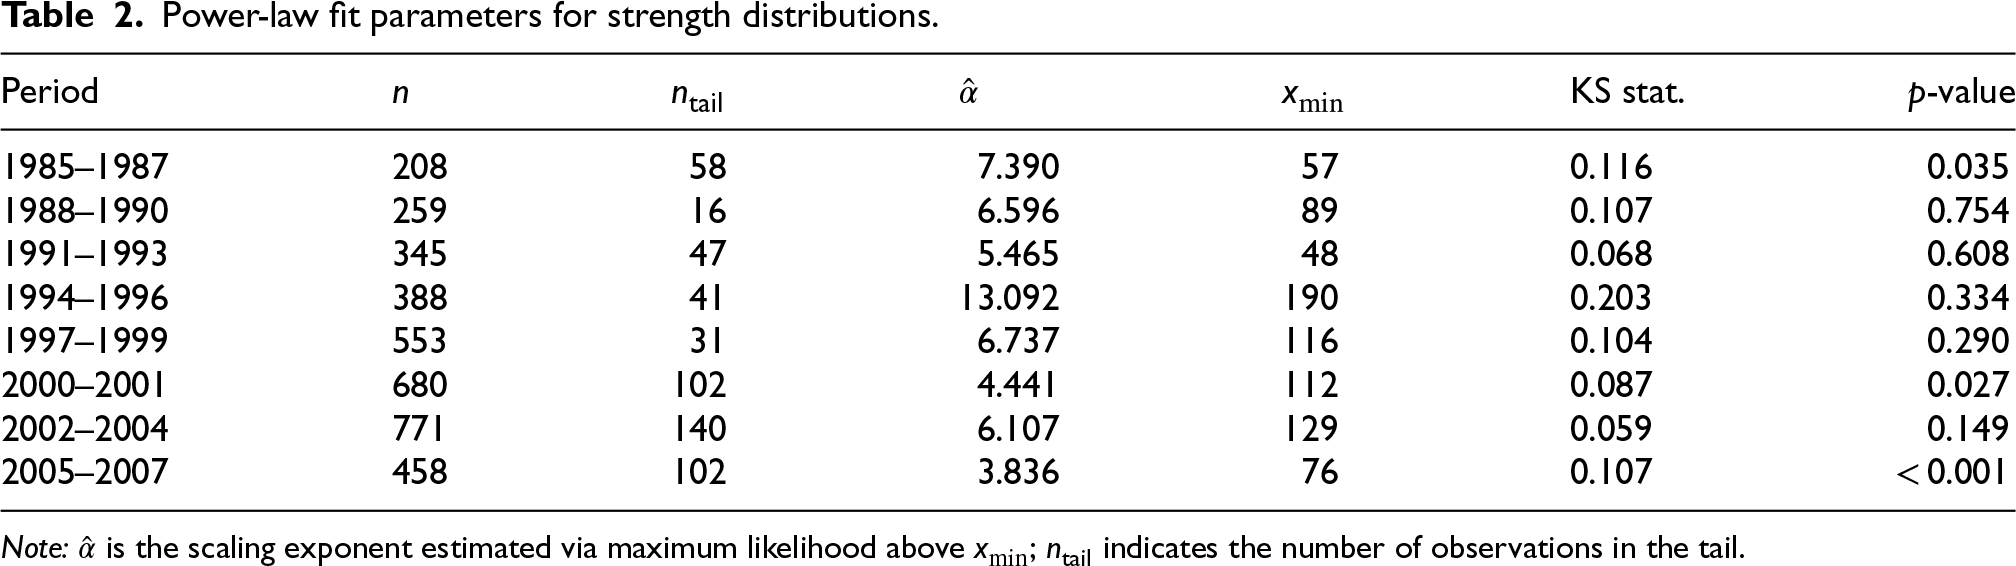
Power-law fit parameters for strength distributions.
Note:
To assess whether the power law fits better than plausible alternatives, we use Vuong’s likelihood ratio test to compare it with log normal, exponential, and Poisson models (Table 3). Recall that Vuong’s test relies on the normalized log likelihood ratio between two competing models. The statistic is computed as the average of the pointwise log likelihood ratios divided by their standard deviation,
Likelihood ratio tests comparing the power-law fit to alternative distributions.

Note: LR denotes the normalized log-likelihood ratio statistic from Vuong’s test comparing the power-law model to the alternative. Positive values favor the power-law; negative values favor the alternative. The
The Vuong tests indicate that a Poisson model is strongly disfavored in every period as a single–parameter description of the marginal strength distribution, which is consistent with the pronounced heavy–tailed heterogeneity observed across municipalities. A small number of municipalities emerge as hubs in which multiple armed structures overlap, plausibly reflecting persistent asymmetries in territorial control and dispute intensity together with path-dependent connectivity, rather than ties forming at random. Importantly, this evidence against a marginal Poisson for node strengths does not preclude the use of a Poisson SBM for the edge weights, since conditional on block structure the SBM induces heterogeneous interaction rates across community pairs and can accommodate substantial variability in expected tie intensities, while the log-normal and exponential specifications remain competitive alternatives for the marginal strength distribution.
The Poisson model is strongly disfavored as a one parameter model for the marginal strength distribution in every period, consistent with heavy tailed heterogeneity across municipalities; this does not rule out Poisson modeling for edge weights conditional on block structure, since an SBM allows heterogeneous interaction rates across community pairs.
When examining density and transitivity in the municipal networks, we observe a marked gap between them. Transitivity ranges from moderate to high, between 0.3 and 0.95, while density remains below 0.2 across the ten periods. This pattern suggests a structure dominated by cohesive groups that are weakly connected to one another, except in 1994 and 1996. As noted above, this interval corresponds to the expansion of a small subset of armed structures, whose induced municipal cliques subsume those associated with the zones of influence of other actors. Both indicators reach their maximum during this period.
We observe moderate to high closeness centralization and consistently low betweenness centralization across periods. This pattern reflects a structure where a few municipalities lie at short topological distance from many others, yet do not serve as essential bridges. It emerges when large and overlapping zones of influence—each forming cliques in the projection—converge in specific municipalities, turning them into hubs where expansive actors coincide. These municipalities connect to many others within each actor’s zone, covering a large share of the network. At the same time, because actor-induced cliques are densely connected, the network provides numerous alternative paths as overlap increases. The persistently low betweenness centralization across periods indicates that territorial contestation does not depend on a small set of strategic municipalities; instead, overlap is widely distributed, revealing a diffuse pattern of dispute.
The number of components and the size of the giant component in the municipal networks shows that during the first decade of the study, the large number of components indicates that actors operated in largely separate subgraphs. From 1991 onward, isolated components decline rapidly and the giant component expands, reinforcing the view that territorial convergence increased over time.
We also observe changes in clique size across periods, which reveal a clear pattern of territorial expansion by armed structures (Table 4). In 1978 to 1984, cliques were relatively small, with an average size of 4.303 municipalities and a maximum of 49, suggesting a limited and localized presence. Over time, especially from the late 1980s onward, both the median and the maximum clique size increase. This growth becomes particularly pronounced in 1994 to 1996, when the average clique size reaches 11.17 municipalities and the maximum rises to 241. As noted above, this aligns with the expansion of a dominant structure.
Proportion of municipalities in multiple cliques.
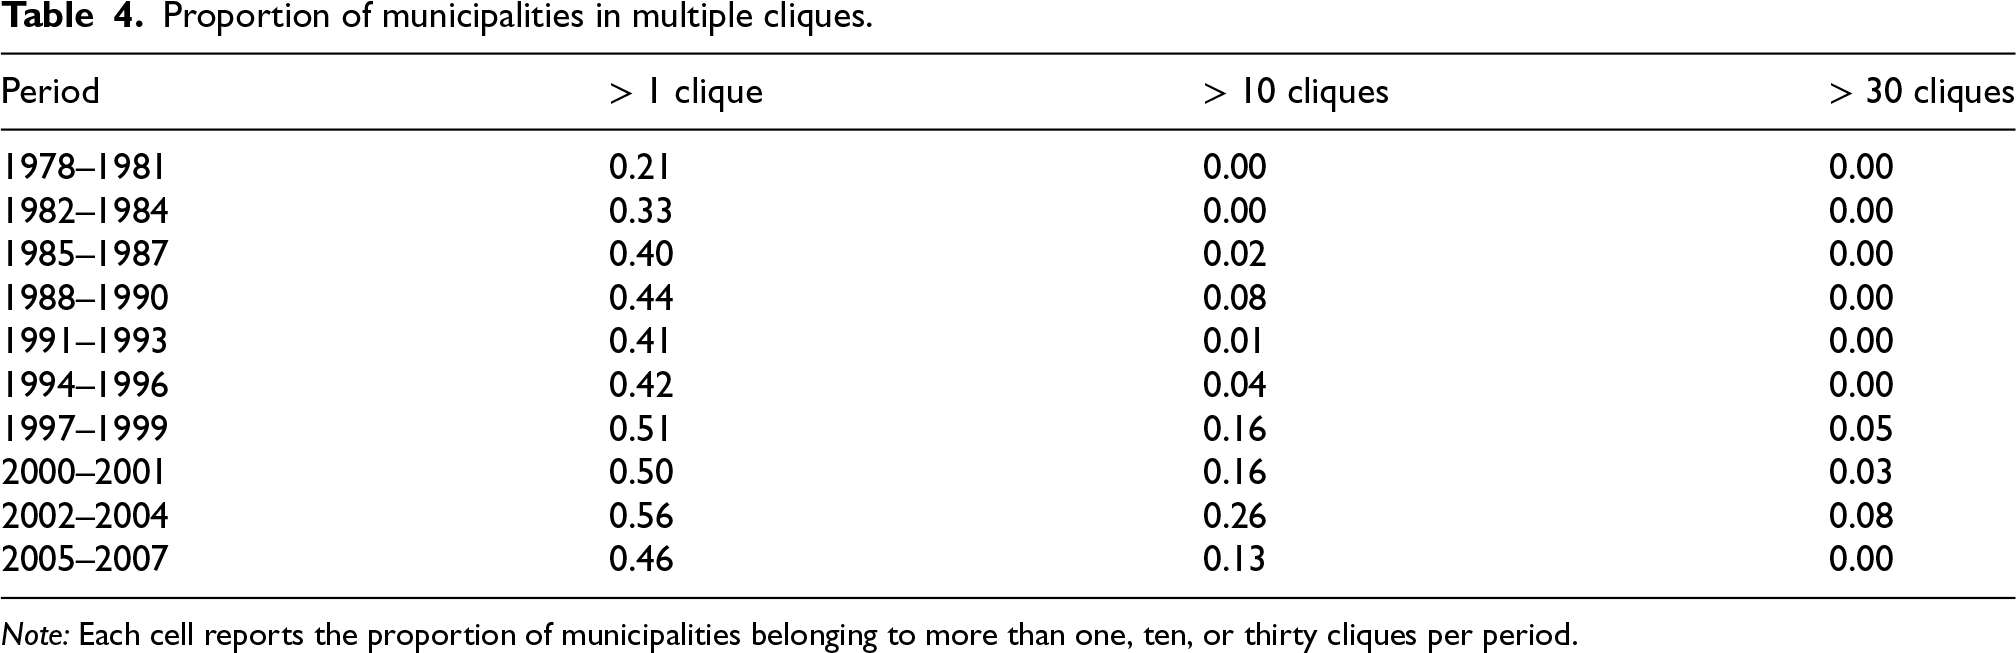
Note: Each cell reports the proportion of municipalities belonging to more than one, ten, or thirty cliques per period.
The long tail of the maximal clique size distribution shows that large cliques are not rare, implying that several armed structures maintain extensive zones of influence. This reflects a broader set of influential actors and reduced concentration of territorial reach in any single group. Such outliers become more common in later periods—especially 1997–1999 and 2002–2004—consistent with intensified territorial disputes. By 2005–2007, the average clique size declines slightly to 10.71, though the maximum remains high at 105 municipalities, indicating that even as overall expansion slowed with demobilization, some structures continued to operate across many municipalities.
In earlier periods, when cliques were small and few municipalities belonged to more than one, the conflict displayed a segmented territorial structure in which armed actors operated in discrete, non-overlapping zones of influence. This reflected spatial partitioning with exclusive control and minimal local competition. Over time, however, the landscape became more fragmented. From the mid
This section summarizes the temporal evolution of territorial overlap in civilian targeting using municipality projection networks. In a municipality projection, two municipalities are connected whenever at least one armed structure is active in both, and the resulting projections typically feature a large number of complete subgraphs. Overlapping cliques identify areas in which multiple armed structures co-occur across municipalities, a pattern consistent with contested territorial control and multi-actor competition. In contrast, disjoint cliques and disconnected components indicate segmented configurations in which targeting remains largely confined to local areas and cross-municipality overlap is limited. Because these projections can rapidly become dense and visually complex, the analysis concentrates on a parsimonious set of dynamic patterns illustrated by a small number of representative figures.
Community Detection with a Poisson Stochastic Block Model
For each period 
Community Evolution
A Sankey visualization (not shown here) provides a compact summary of the evolution of community structure across periods. Each column corresponds to a period, each block represents an SBM community, and the flows track municipality transitions between consecutive periods, with widths proportional to the number of municipalities. The visualization is used only to convey large scale partition dynamics, while the substantive interpretation relies on the regime synthesis presented below. Two quantitative patterns motivate a regime based interpretation. First, the selected number of communities increases over time and peaks in the early 2000s, consistent with diversification of overlap configurations as conflict expands across the national territory. Second, after this peak the number of communities declines and the flows become more consolidated, consistent with reconfiguration and partial contraction during the demobilization period. For transparency, maximizing the Integrated Classification Likelihood selects
Regime Synthesis of Temporal Dynamics
To emphasize temporal dynamics rather than period-by-period detail, we synthesize the results into three regimes. The objective is to characterize how the projection evolves from early fragmentation, to an intermediate phase with corridor-like organization and a consolidated center, and finally to a late phase marked by thinning connectivity and weaker community separation.
In the earliest period, the municipality projection is highly fragmented, comprising thirteen disconnected components. The SBM aggregates these components into a small number of communities with a pronounced within-community versus between-community contrast, a pattern consistent with localized armed structures operating in bounded territories with limited overlap. In this regime, within-community intensities are low and between-community intensities are close to zero, so the inferred partition primarily reflects segmentation rather than an integrated national system.
As the conflict expands, the projection transitions from scattered components to a configuration dominated by a large connected component. By 1982–1984, most municipalities belong to a giant component, indicating that overlap structures begin to link previously separated regions. Figure 3 presents a representative early snapshot. The intensity panel summarizes the distribution of within-community cohesion and between-community coupling across the estimated communities, while the map panel shows that the communities correspond to geographically interpretable overlap configurations rather than purely graph-theoretic artifacts.
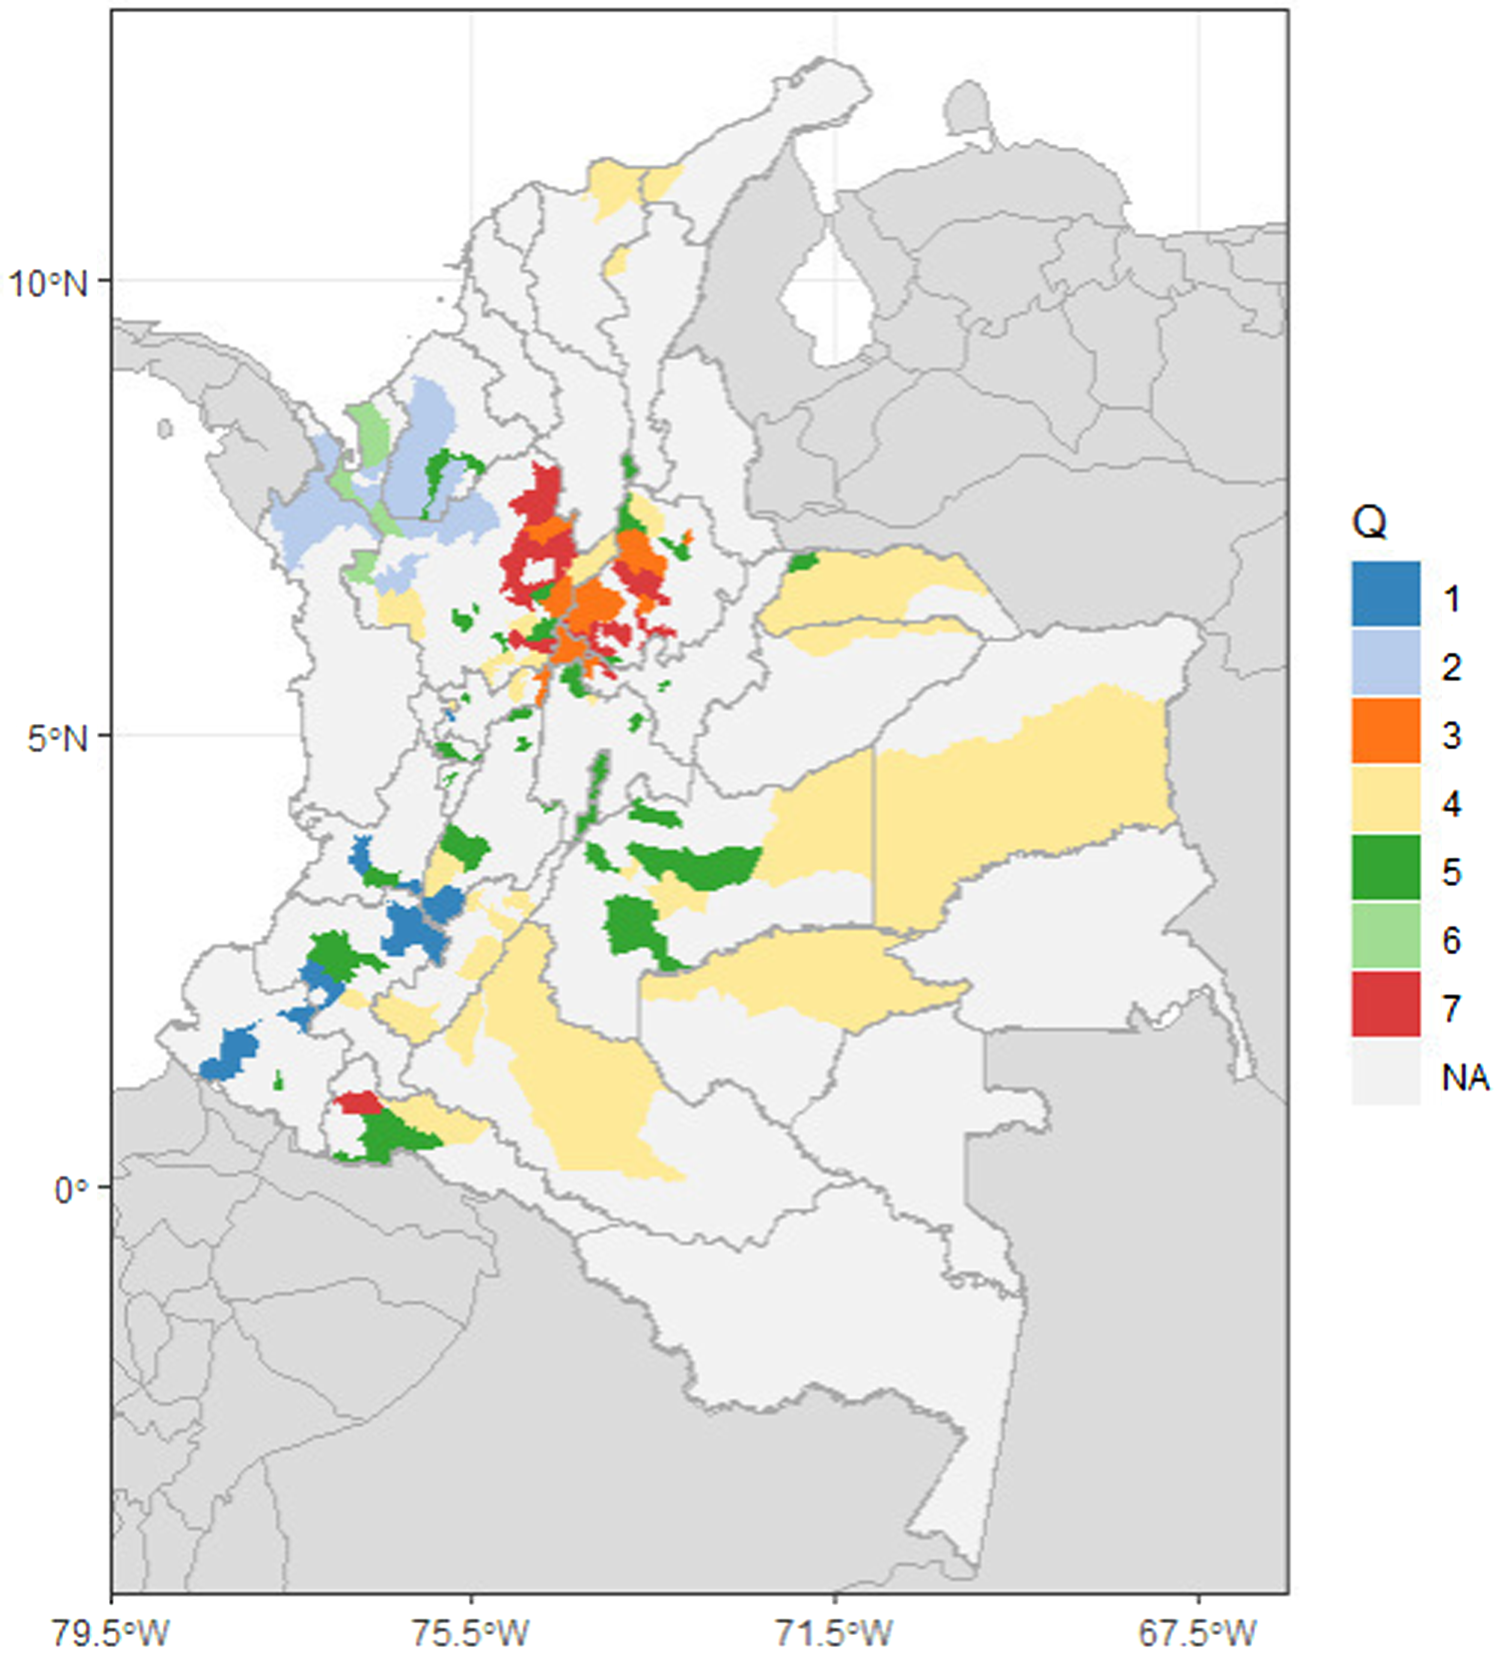
Geographical distribution of communities. Representative early snapshot for 1982–1984.
As armed structures expand and coordination increases, community structure becomes more differentiated, and interregional connectivity increasingly depends on a limited set of interfaces. In the late 1990s, the partition displays a corridor-like organization in which a dense subsystem is coupled to other regions through a small number of interface communities. This regime is characterized by increasing inequality in between-community exchange, in the sense that a small number of community pairs account for a disproportionate share of cross-community overlap, while most other between-community ties remain weak. Substantively, this pattern is consistent with selective coupling, whereby interregional overlap is routed through strategic corridors rather than emerging through broad-based national integration.
In 2000–2001, the projection reorganizes toward a more consolidated center. Several network diagnostics support this interpretation. The
In 2002–2004, the municipality projection exhibits the joint presence of strong integration and heightened differentiation. Integration is extreme. The network contains only three biconnected components, and the largest includes 769 of 772 municipalities, that is, 99%. Coreness is also high, with first quartile 19, median 46, and maximum 127. Nearly all municipalities in the largest component lie in the
After 2004, the structure shifts again. In 2005–2007, the projection thins and becomes more segmented as the set of affected municipalities contracts and overlap becomes less redundant. The number of municipalities decreases from 772 to 468. The number of biconnected components increases from three to fifteen, indicating greater reliance on articulation points and smaller two-connected blocks. Coreness declines sharply, with the median dropping from 46 to 16 and the maximum from 127 to 81. Importantly, a giant component persists, and most municipalities within it remain in the
Overall, the SBM results support a regime-based interpretation of territorial overlap in civilian targeting. The early phase is characterized by fragmentation and weak coupling across regions. The intermediate phase exhibits a corridor-like organization and an increasingly structured center, with intermediation progressively shared across multiple hubs as redundant paths proliferate. The late phase combines peak differentiation under strong integration in the early 2000s with a subsequent contraction that thins the projection and produces less sharply separated communities.
The municipality projection networks show that territorial overlap in civilian targeting is not stationary, it evolves through three clear structural regimes that track the expansion and reconfiguration of armed activity between 1978 and 2007. In the early regime, overlap is localized and segmented. The projection is highly fragmented and the Poisson SBM detects a small number of weakly coupled communities with near-zero between-community intensities, indicating that co-presence across municipalities remains bounded and does not yet form a national system. As the conflict expands, a connected backbone rapidly emerges. By 1982–1984 most municipalities fall into a giant component and the inferred communities align with geographically interpretable overlap configurations, showing that territorial co-presence begins to link previously separate regions.
The intermediate regime is characterized by corridorization and the consolidation of a structured center. In the late 1990s, connectivity across regions becomes selective and is routed through a limited set of interface communities, so a small number of community pairs account for most cross-community overlap. By 2000–2001, the projection reorganizes toward a highly redundant center in which intermediation is shared across multiple hubs rather than concentrated on a few bridges. This shift is supported by sharp increases in core depth and two-connectedness, including a largest biconnected component covering 97.5% of municipalities, consistent with the proliferation of alternative paths and widespread multi-actor overlap that stabilizes the connected structure.
The late regime combines peak integration with maximal differentiation followed by contraction and fuzzier separation. In 2002–2004 the projection is almost fully two-connected and extremely core-dense, with 99% of municipalities in the largest biconnected component and high coreness throughout, while the SBM partition becomes highly differentiated, producing a patchwork of overlap patterns whose boundaries are present but less isolating. After 2004, the system contracts and thins. The number of affected municipalities drops sharply, biconnected components proliferate, and coreness declines, implying reduced redundancy and greater reliance on articulation points. A giant component persists, but the reduction in core depth and tie redundancy weakens community separation, yielding a fuzzier clustering regime driven by contraction and reconfiguration. Together, these results deliver a single main finding, territorial overlap in civilian targeting shifts from early fragmentation, to corridor-based selective coupling and a consolidated center, to a post-peak contraction in which connectivity remains but community boundaries become less sharply separated.
Future research can extend this framework in three complementary directions. First, the projection model can be enriched to better represent higher-order concentration, for example by incorporating mechanisms that directly affect triadic closure or core depth, or by using degree-corrected and mixed-membership variants that allow municipalities to participate in multiple overlap configurations within a period. Second, the empirical scope can be broadened by incorporating additional armed actors and state forces once attribution fields are harmonized, and by moving from period-wise fitting to explicitly dynamic models that borrow strength across time and quantify persistence and switching of communities. Third, missingness and measurement error in victimization records can be modeled directly, allowing sensitivity analyses that clarify how underreporting and unknown perpetrator attribution affect the inferred regimes and the identification of contested corridors, thus improving the value of the results for comparative research and for policy and transitional justice applications.
Footnotes
Acknowledgements
The authors thank the Centro Nacional de Memoria Histórica for providing access to historical violence datasets and documentation that supported the reconstruction of armed actor presence over time.
Ethics Approval and Informed Consent
This study analyzes anonymized, secondary data on human rights violations obtained from publicly accessible sources, including the Observatorio de Memoria y Conflicto of the Centro Nacional de Memoria Histórica (CNMH). No identifiable personal information was used, and no intervention involving human participants was conducted. In accordance with institutional and journal standards, formal ethics approval and informed consent were not required.
Funding
The authors received no financial support for the research, authorship and/or publication of this article.
Declaration of Conflicting Interests
The authors declared no potential conflicts of interest with respect to the research, authorship, and/or publication of this article.
Data Availability
The dataset used in this study is derived from publicly accessible CNMH repositories. Processed data and analytic scripts supporting the findings of this article are available from the authors upon reasonable request.
Code Availability
The code used for data processing, network construction, and stochastic block model estimation (implemented in