
Abstract
This article presents the analysis of the noise characteristics for the planar switched reluctance motor to enrich performance evaluation of the planar switched reluctance motor. The mechanical structure, electromagnetic force, and control scheme are first presented. An analytical mathematical model of sound intensity is then proposed to characterize the relationship between the mechanical structure and the noise. An improved mechanical structure is further designed and analyzed to decrease the deformation by using ANSYS Workbench. Furthermore, an experimental setup of noise measurement is built based on the developed planar switched reluctance motor. In addition, the noise is measured experimentally under the open-loop and closed-loop motions after performing the experimental measurement of ambient noise. The experimental results demonstrate that the planar switched reluctance motor is capable of achieving low-noise motion.
Introduction
Planar motors are particularly attractive in precision positioning application because of their direct drive, no backlash, simple structure, low friction, and high reliability.1–4 The planar switched reluctance motor (PSRM) is a promising candidate among planar motors, owing to its easy manufacture, low cost, low heat loss, long stroke, high precision, and strong resilience to harsh environment. 5
The research of the PSRM mainly consists of the following: (1) motor design, an optimization design of the PSRM has been performed to reduce electromagnetic force ripple; 6 (2) mathematical model, a nonlinear electromagnetic force model 7 and a nonlinear inverse force function have been proposed for the PSRM; 8 (3) electromagnetic performance, electromagnetic force, flux linkage, and inductance have been measured and analyzed;5,7 (4) motor efficiency, the core loss of the PSRM has been discussed 9 and a maximum-force-per-ampere strategy of current distribution has been proposed for efficiency improvement of the PSRM; 10 and (5) position control, the proportional–integral–derivative (PID) controller, 11 auto-disturbance rejection controller (ADRC), 12 adaptive controller, 13 sliding mode controller (SMC), 14 and so on have been designed for the PSRM to realize high-precision motion. So far, no referred literature has been reported on the noise characteristics of the PSRM. However, the noise characteristics are one of the key performances of motors concerned by the users;15,16 the switched reluctance motor (SRM) is generally considered as a large-noise motor due to its double-salient structure and nonlinear magnetic characteristic.17–20 The improved motor design and effective control strategy can decrease the noise of SRM. The noise negatively affects the positioning accuracy of the PSRM. In addition, the physical mechanism of the PSRM and SRM is not identical. Thus, it is an issue whether the noise of the PSRM could be reduced by applying the improved motor design and effective control strategy to achieve its low-noise motion.
To enrich the performance evaluation of the PSRM, the noise characteristics of the PSRM are presented in this article. The remaining of this article is organized as follows. The mechanical structure, electromagnetic force, and control scheme are clarified in section “System Formulation.” Section “Noise modeling with respect to the mechanical structure” proposes an analytical mathematical model of sound intensity for the PSRM. The mechanical structure of the PSRM is designed and analyzed to decrease the deformation in section “Mechanical structural analysis.” In section “Experimental results and discussion,” the experiment is performed to assess the noise performance. Finally, concluding remarks are given in section “Conclusion.”
System formulation
Mechanical structure
The PSRM follows the minimum reluctance principle, which can be seen as two linear switched reluctance motors (LSRMs) of orthogonal magnetic circuits. The specifications of the PSRM are listed in Table 1. The mechanical structure of the PSRM developed in our laboratory is shown in Figure 1. The PSRM is mainly composed of the base, stator sets, x- and y-axes moving platforms, and x- and y-axes linear guides. The y-axis moving platform consists of the x-axis moving platform and a sliding plate. Six identical movers with winding, which are perpendicular to each other, constitute the x-axis moving platform. The six-phase movers are used to energize the PSRM. The three-phase movers xa, xb, and xc are responsible for x-axis motion. The three-phase movers ya, yb, and yc are responsible for y-axis motion.
Specifications of the PSRM.

PSRM: planar switched reluctance motor.

Structure of the PSRM.
Electromagnetic force
The thrust force is expressed as
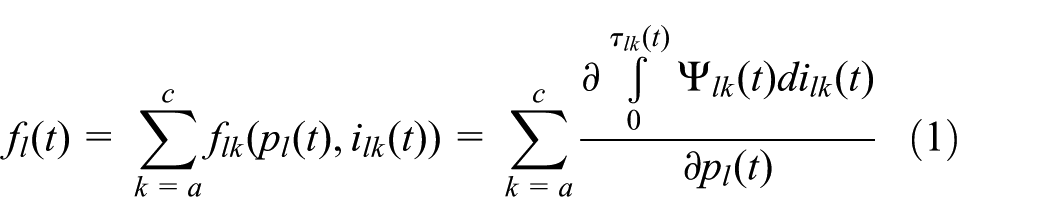
where pl is the l-axis position, and ilk, τlk, flk, and Ψlk are phase current, constant phase current, thrust force, and flux linkage of phase lk (l = x, y; k = a, b, c), respectively.
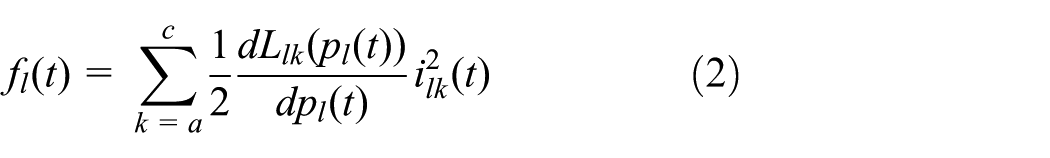
If the inductance is linearly varying with position under a given phase current, the thrust force is represented as
The normal force is given as
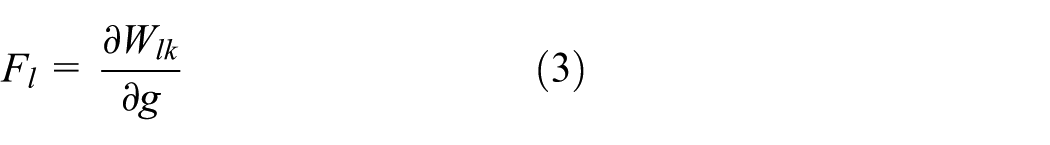
where g is the air gap length and Wlk is the magnetic energy which is expressed as

Based on ANSYS Maxwell software, the three-dimensional (3D) finite element analysis of the PSRM is performed. A 3D nonlinear finite element model (FEM) of the PSRM with practical geometric dimension and material is built. The silicon steel sheet B35AR300 from Baosteel, China 21 is used as the material for the mover and stator. The nonlinear B-H curve of the silicon steel sheet B35AR300 is set as the material attribute of the mover and stator. With the determined geometric dimension and magnetic material, the nonlinear magnetism is determined for the PSRM. The high nonlinearity of the PSRM mainly results from the structure of doubly salient. The nonlinear electromagnetic force from FEM versus position in the range of 0–7.2 mm versus current in the range of 1–10 A is shown in Figure 2.

Electromagnetic force from FEM: (a) thrust force and (b) normal force.
An experimental setup is built to measure the electromagnetic force. The thrust force is directly measured through a digital dynamometer. The deformative signal, which is measured through the strain gage, is detected by the sensor interface amplifier and then is collected with the data acquisition software. The normal force is calculated via data processing by using the detected deformative signals. 7 The nonlinear electromagnetic force from experiment versus position ranging of 0–7.2 mm versus current ranging of 1–10 A is presented in Figure 3. From Figures 2 and 3, the thrust force ranges from 0 to 34.2 N and 0 to 35.4 N for simulation and experiment, respectively; the normal force ranges from 4.1 to 380.1 N and 4.1 to 427.4 N for the simulation and experiment, respectively; the electromagnetic force of the simulation is consistent with that of the experiment. The normal force is generally 10 times larger than the thrust force. The large normal force is acted on y-axis moving platform resulting in the deformation, which leads to the increased vibration and noise.

Electromagnetic force from experiment: (a) thrust force and (b) normal force.
Control scheme
The block diagram of the PSRM closed-loop system is depicted in Figure 4(a). For l-axis linear motion, the actual position pl_real is detected and transformed into the position signal pl via l-axis linear encoder. The position signal pl is compared with the reference position pl_ref, and their corresponding position error el is processed through l-axis position controller to produce l-axis thrust force command

Block diagram of the PSRM control system: (a) the PSRM closed-loop system and (b) the PSRM open-loop system.
Figure 4(b) shows the block diagram of the PSRM open-loop system. For l-axis linear motion, the actual position pl_real is detected and transformed into the position signal pl via l-axis linear encoder. The position signal pl is processed through l-axis current distribution module to determine the energized phases. The l-axis energized phase current commands have a constant value. l-axis three-phase current commands
Noise modeling with respect to the mechanical structure
The mechanical noise is one of the main components of the noise for the PSRM, which mainly results from manufacturing and assembly. The noise of the PSRM is related to its mechanical structure. The relationship between the noise and the mechanical structure is analyzed based on the noise radiation for the PSRM. The component with the largest dimension is generally regarded as the sound source for the noise radiation. According to Figure 1 and Table 1, it is clear that the dimension of the base is the largest one among all components of the PSRM. The actual shape of the base is a rectangle with a dimension of 600 mm × 600 mm. Therefore, the analysis of the noise radiation mainly focuses on the base, such that the base is regarded as the sound source. The acoustic waves generated by the vibration of the PSRM radiate randomly in all directions in the air, and thus, the source of noise can be regarded as a non-directional rectangular-surface sound source for the PSRM. The sound source of rectangular surface is shown in Figure 5. The length and width of the base are a and b, respectively.
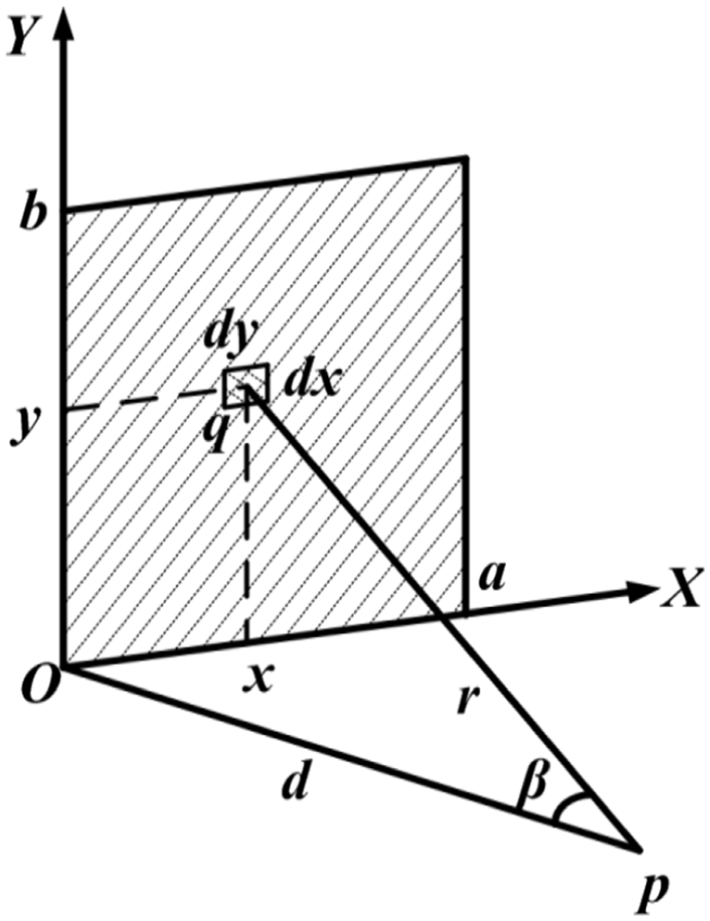
Sound source of the rectangular surface.
Each micro rectangular surface of sound source is mutually independent. Each sound wave of micro rectangular surface is mutually decoupled. The noise power of the micro rectangle is given by

where w is the constant noise power of the PSRM and dx and dy are the length and width of the micro rectangle, respectively.
For the PSRM operating in the free sound filed without regard to the reflection of sound, the sound energy density of a specific position p is
where r is the distance between the position p and micro rectangle, c is the velocity of the propagation of sound wave in air, σ is the area of the micro rectangle, and d is the distance between the position p and sound source of rectangular surface.
Sound intensity of the position p is

where β is the angle between the straight line op and the straight line qp, and cos β is represented as

Combining equations (7) and (8), the sound intensity of the position p is derived as

In terms of equation (9), the sound intensity of the position p is deduced as

Because the length and width of the base are generally equal (a = b), equation (10) can be rewritten as

where x is given as

The derivative of I with respect to x is expressed as

Equations (12) and (13) indicate that if w > 0 and d > 0, then dI/dx > 0. Because of dI/dx > 0, I is an increasing function with respect to x. x is increased with the larger a from equation (12). Thus, I is an increasing function with respect to a as ω > 0 and d > 0. In practice, w > 0 and d > 0, and thus, I is increased with the larger a.
Based upon the aforementioned analysis, the sound intensity under a specific position is related with the dimension of the base. The sound intensity in the free sound filed under a specific position is increased as the dimension of the base increased.
Mechanical structural analysis
In order to reduce the mechanical damage, vibration, and noise caused by the deformation, the mechanical structure of the PSRM is designed and analyzed to decrease the deformation by using ANSYS Workbench Software.
The x-axis moving platform consists of six-phase movers. When the movers are energized, the generated normal forces are acted on the x-axis moving platform. The y-axis moving platform is composed of the x-axis moving platform and sliding plate. In addition, the x-axis moving platform is hung on the sliding plate of the y-axis moving platform. Thus, the generated normal forces are also acted on the sliding plate. The deformation of the x-axis moving platform results from the normal forces and its gravity. The normal forces and the gravities of the sliding plate and x-axis moving platform result in the deformation of the sliding plate. Therefore, the larger deformation is located in the sliding plate, that is, in the y-axis moving platform. Thus, the structure design mainly focuses on the y-axis moving platform.
With the material attributes of the y-axis moving platform listed in Table 2, a FEM of the platform is built based on ANSYS Workbench software. The overall procedure to build the FEM consists of geometry creation, material attribute definition, mesh generation, load and constraint condition addition, and simulation execution. Two types of element type are applied to the FEM: a mesh with size of 2.5 mm is used to mesh the body sizing and a mesh with size of 5.0 mm is used to mesh the face sizing. The number of nodes and elements are larger than 100,000 and 250,000, respectively. In consideration of the extreme condition for the PSRM, four 400 N normal forces, which are slightly larger than the 380.1 N maximum normal force obtained from FEM, are acted on four movers. Four normal forces are acted on four movers in the extreme condition, because the maximum number of energized movers is four. The load and constraint conditions acting on four movers are shown in Figure 6.
Material attributes of y-axis moving platform.
Stators and movers: silicon steel B35AR300; linear guide way and slider: stainless steel; sliding plate and other components: aluminum alloy.

Load and constraint conditions acting on four movers.
The design of the y-axis moving platform mainly focuses on the sliding plate. The previous structure of the y-axis moving platform is shown in Figure 7(a). The mass of the platform is 7.22 kg. The maximum deformation of the platform is 0.12636 mm, which results in the air gap length decreased by 42.0%. The larger deformation of the sliding plate is located in the middle of the sliding plate. The stiffener is applied to the sliding plate to improve the stiffness of the sliding plate, especially the middle of the sliding plate. Seven y-axis moving platforms with differently shaped stiffeners are thus designed. The mass of the seven platforms are 7.66, 8.41, 8.66, 9.25, 10.82, 10.82, and 10.16 kg, respectively. The total deformation of the seven platforms from the static structural analysis under the extreme condition is manifested in Figure 7. The larger deformation is in the adjacent region of the four energized movers. For the y-axis moving platforms 1 to 7, the maximum deformations are 0.08803, 0.06805, 0.05675, 0.04352, 0.03097, 0.02914, and 0.03418 mm, respectively, which results in the air gap length decreased by 29.3%, 22.6%, 19%, 14.3%, 10.3%, 9.7%, and 11.3%, respectively.
Total deformation of y-axis moving platform for different structures: (a) total deformation of previous structure, (b) total deformation of the designed structure 1, (c) total deformation of the designed structure 2, (d) total deformation of the designed structure 3, (e) total deformation of the designed structure 4, (f) total deformation of the designed structure 5, (g) total deformation of the designed structure 6, and (h) total deformation of the designed structure 7.
The improved stiffness of the sliding plate of the y-axis moving platform results in the decreased deformation. In comprehensive consideration of the mass of the y-axis platform and the machining of components, the y-axis moving platform 7 is employed to the PSRM.
Experimental results and discussion
Experimental setup
Figure 8 illustrates the block diagram of the PSRM system for noise measurement. There are four measuring points, locating in the spherical surface with a 1 m radius and an origin in the center of the PSRM. The measuring points 1, 2, and 3 are 120° apart of each other. The vertical distances between the measuring points 1, 2, and 3 and the lower surface of base are 0.25 m. The measuring point 4 is directly above the center of the PSRM. The noise of the four measuring points is measured via four sound pressure sensors INV9206. Then, the noise signal is detected through high-precision data acquisition instrument INV3018A.

Block diagram of the PSRM system for noise measurement.
The sound pressure level is further obtained by using data processing instrument DASP V10 and personal computer (PC). The A-weighted sound power level to assess the noise of the PSRM is finally calculated with the obtained sound pressure level. The sound pressure sensors and data acquisition and processing instruments are from China Orient Institute of Noise & Vibration. 22 The frequency and sound pressure level of sound pressure sensors INV9206 range from 20 to 20,000 Hz and 20 to 146 dB, respectively. For the data acquisition instrument INV3018A, the resolution is 24 bits, and the highest sampling frequency is 51.2 kHz.
The experimental setup of the PSRM control system for noise measurement is indicated in Figure 9. The current drivers provide direct current (DC) to energize six-phase movers. The dSPACE modular hardware includes a DS1005 PPC board, a DS3001 incremental encoder interface board, and a DS2103 D/A board. DS1005 PPC has a PowerPC 750GX processor running at 1 GHz. DS3001 incremental encoder interface board is used to detect the position signals from linear optical encoders. DS2103 D/A board is applied to provide phase current commands to current drivers. The control algorithm is developed based on MATLAB/Simulink, which is downloaded to dSPACE modular hardware via real-time workspace (RTW) and real-time interface (RTI) to achieve real-time control.

Experimental setup of the PSRM control system for noise measurement.
Experimental results
The A-weighted sound power level of ambient noise for the measuring points is depicted in Figure 10. The trend of A-weighted sound power level of the measuring points is consistent. The mean values of A-weighted sound power level of the measuring points, which are presented in Figure 11, are considered as the A-weighted sound power level of ambient noise. The peak value of A-weighted sound power level of ambient noise is 48.25 dB.

A-weighted sound power level of ambient noise for the measuring points.
A-weighted sound power level of ambient noise.
The open-loop motion of the PSRM is performed. For the open-loop motion, the PSRM operates under different constant currents. The current ranges from 4 to 7 A. Figure 12 shows the A-weighted sound power level of the measuring points for open-loop motion under different currents. The trend of A-weighted sound power level of the measuring points is substantially consistent. The A-weighted sound power level is increased as the frequency is lower than 315 Hz. With the frequency higher than 800 Hz, the A-weighted sound power level is decreased. Under the frequency ranges from 315 to 800 Hz, the A-weighted sound power level has larger value and its change is small. In addition, the noise radiation intensity at the measuring point 4 is slightly higher than other measuring points. The mean values of A-weighted sound power level of the measuring points under different currents are depicted in Figure 13. The trend of A-weighted sound power level under different currents is substantially consistent. The peak frequencies of the mean values of A-weighted sound power level are 315 and 800 Hz. The peak values of the mean values of A-weighted sound power level under different currents are manifested in Figure 14. The peak A-weighted sound power level ranges 59.66–66.74 dB. With the increased current, the A-weighted sound power level increases and its growth rate decreases.

A-weighted sound power level of the measuring points for open-loop motion under different currents: (a) open-loop motion with current of 4 A, (b) open-loop motion with current of 5 A, (c) open-loop motion with current of 6 A, and (d) open-loop motion with current of 7 A.

Mean values of A-weighted sound power level of the measuring points for open-loop motion under different currents.

Peak values of the mean values of A-weighted sound power level under different currents.
The closed-loop motion of the PSRM is carried out. For the closed-loop motion, the circular trajectory tracking, rhombic trajectory tracking, and pentagonal trajectory tracking of the PSRM are implemented under proportional–derivative (PD) control. Figure 15 depicts the A-weighted sound power levels of the measuring points for closed-loop motion. The trend of A-weighted sound power level of the measuring points is substantially consistent for the closed-loop motions. The A-weighted sound power level is increased as the frequency is lower than 400 Hz. With the frequency higher than 1000 Hz, the A-weighted sound power level is decreased. Under the frequency range from 400 to 1000 Hz, the A-weighted sound power level has larger value and its change is small. The mean values of A-weighted sound power level of the measuring points for the closed-loop motion are indicated in Figure 16. The trend of A-weighted sound power level for the closed-loop motion is substantially consistent. The peak frequencies of the mean values of A-weighted sound power level are 400 and 1000 Hz. The peak sound power levels of the circular, rhombic, and pentagonal trajectory tracking are 57.02, 47.31, and 54.78 dB, respectively.

A-weighted sound power levels of the measuring points for closed-loop motion: (a) circular trajectory tracking, (b) rhombic trajectory tracking, and (c) pentagonal trajectory tracking.

Mean values of A-weighted sound power level of the measuring points for closed-loop motion.
Discussion
The peak frequencies of A-weighted sound power level for open-loop motion are 315 and 800 Hz. The fourth and eleventh natural frequencies of the PSRM are 300.3 and 809.2 Hz from finite element analysis of ANSYS Workbench. Because the two peak frequencies of A-weighted sound power level of open-loop motion are very close to the fourth and eleventh natural frequencies of the PSRM, the open-loop noise under the two peak frequencies is larger than that under other frequencies. The trend of A-weighted sound power level for the open-loop motion coincides with that for the closed-loop motion. However, compared to the open-loop motion, the A-weighted sound power levels of closed-loop motion are decreased. The electromagnetic noise is the main source of the noise of the PSRM, which is caused by the electromagnetic force ripple. There are two primary methods to reduce electromagnetic force ripple for lower noise: improved motor design and effective control strategy. A thrust force with large ripple is inevitable for the PSRM because of its double-salient pole and switched excitation method. Compared to the open-loop control shown in Figure 4(b), the thrust force ripple of the PSRM is reduced by using the applied position control and force distribution function for the closed-loop control shown in Figure 4(a). Therefore, the noise of the closed-loop control is reduced compared with that of the open-loop control.
The performance evaluation of the noise has not been specified for linear and planar motors to date. The performance evaluation of the noise of the PSRM refers to that of rotating electrical machines. For the maximum A-weighted sound power levels of rotating electrical machines at no load of the international standard IEC 60034-9, their minimum value in all conditions shall not exceed 73 dB. The A-weighted sound power level is less than 67 dB. The noise performance of the PSRM is thus satisfied.
Conclusion
In this article, the noise characteristics of the PSRM were studied to enrich the performance evaluation of the PSRM. The analytical mathematical model of sound intensity was proposed to characterize the relationship between the mechanical structure and noise. The noise measurement was then performed to analyze the noise characteristics. The experimental results demonstrate that (1) the larger base of the PSRM results in the larger noise for the constant noise power of the PSRM; (2) with the increased current, the noise of the PSRM is increased and the growth rate is decreased; (3) the noise of the PSRM with closed-loop control is smaller than that with open-loop control; (4) the A-weighted sound power level is less than 67 dB for the open-loop and closed-loop motions; and (5) the low-noise motion of the PSRM is achieved. This article enriches the performance evaluation of the PSRM and further promotes the industrial application of the PSRM.
Footnotes
Handling Editor: Yangmin Li
Declaration of conflicting interests
The author(s) declared no potential conflicts of interest with respect to the research, authorship, and/or publication of this article.
Funding
The author(s) disclosed receipt of the following financial support for the research, authorship, and/or publication of this article: This work was supported by the National Natural Science Foundation of China (grant numbers 51677120 and 51275312); the Natural Science Foundation of Guangdong Province, China (grant number 2017A030310460); the Shenzhen Government Fund (grant number KJYY201604 28170944786); and the Fundamental Research Funds for the Shenzhen University (grant number 2017039).