




Abstract
Safety valves are widely used as the safety device in pressure systems, such as boilers and pressure pipes, to ensure the safe operation of pressure systems. At present, the inspection of safety valves is mainly carried out by manual operation or semi-automatic operation, and it requires a lot of manpower operation costs. Moreover, the measurement of different pressure ranges is performed using only a single pressure sensor such that the test precision is insufficient. In this study, a high-precision safety valve test architecture with three testing channels was proposed, and an automated testing system was developed. In this system, the user can define the test specifications through parameter setting. The system can automatically execute the complete test control process and judge whether the test was passed based on the measured data. In this article, for the low, middle, and high test pressures, the safety valves of four different states were tested respectively and the test reports were automatically generated. Finally, it statistically analyzed the test results for the diagnosis of the safety valve failure. Therefore, the results of this research may effectively solve the problems of current safety valve testing and improve its operational efficiency and test quality.
Keywords
Introduction
With industrial development and advance of science and technology, many industries (such as gasoline, natural gas, and power generation) are provided with different pressure equipments1–3 such as boilers and pressure vessels. As there is pressure accumulating in these pressure equipments or their pipelines, there may be explosion when the pressure is too high, endangering personal safety and damaging important equipments and pipelines. Therefore, these equipments under pressure must be equipped with a safety valve,4–8 so that when the internal gas pressure increases, the pressure can be relieved by releasing equipment or pipeline gas to avoid the pressure being too high or exceeding the specified safety value, so as to prevent the equipments and pipelines from exploding.
When the container pressure exceeds the design specification, the safety valve is turned on automatically, and the gas is discharged to reduce the excessive pressure in the container to avoid damaging the container or pipeline. The valve is turned off automatically when the pressure in the container drops to normal working pressure, so as to avoid discharging all gas due to container overpressure that results in waste and production break. The safety valve comprises valve seat, flap, and loading mechanism.6,9,10 Some of the valve seat and the valve body are taken as a whole, and some of it is assembled with the valve body, which is then connected to the equipment. The flap is often provided with a valve handle, and it is fastened to the valve seat. The loading mechanism is above the flap, and the load can be regulated. When the pressure in the equipment is in a certain working pressure range, the force applied by the internal gas to the flap is lower than the force applied by the loading mechanism to the flap; their difference forms the sealing force between the flap and the valve seat, so that the flap squeezes the valve seat, and the medium of equipment cannot be discharged.
When the pressure in the equipment exceeds the specified working pressure and reaches the safety valve opening pressure, the force applied by the internal gas to the flap is greater than the force applied by the loading mechanism to the flap, so the flap leaves the valve seat, the safety valve is turned on, and the gas in the equipment is discharged through the valve seat (known as spurt).6,11 If the discharge capacity of the safety valve is higher than the safety discharge quantity of the equipment, the pressure in the equipment drops gradually, and the pressure returns to normal working pressure after a short-term exhaust. At this point, the force applied by the internal pressure to the flap is lower than the force applied by the loading mechanism to the flap, so the flap squeezes the valve seat (known as reseat), the gas discharge stops, and the equipment maintains normal working pressure and continues running. Therefore, the safety valve is turned off or on automatically by increasing or reducing the gas-applied force and the loading-mechanism-applied force on the flap, so as to prevent equipment overpressure. As shown in Figure 1 (the relationship between safety valve pressure and flap lifting), when the channel pressure PI in the equipment exceeds the opening pressure PSet set for the safety valve, the safety valve opens rapidly as PI increases. When it reaches the pressure of the fully open state (i.e. the spur pressure PS), there may be maximum discharge gas. Then, PI drops as the gas is discharged. When PI is lower than PSet, the flap will reseat, so the safety valve will be closed quickly. The pressure at this time is the reseat pressure PR. The pressure difference ΔP between PS and PR is closely related to whether the safety valve’s spur and reseat function are normal.

Relationship between safety valve pressure and flap lifting.
There are many types of safety valves, including spring, lever, deadweight, and pilot safety valves, according to the overall structure and loading mode.11–13 The spring safety valve means the sealing of flap and valve seat depends on the acting force of the spring. The lever type depends on the acting force of the lever and weight. The deadweight type depends on the deadweight force applied by the weight above the valve body. The pilot safety valve comprises a main safety valve and an auxiliary valve, when the medium pressure inside the channel exceeds the specified pressure value, the auxiliary valve is turned on, the medium enters the main safety valve through the conduit, and the main safety valve is turned on, so as to reduce the increased medium pressure. The spring safety valves are most extensively used in current industries. According to the medium discharge modes, the safety valves are classified into fully enclosed, semi-enclosed, and open safety valves. 13 When the fully enclosed safety valve discharges gas, all the gas is discharged through the exhaust pipe, so the medium cannot leak out. It is mainly applied to the containers with medium as toxic or flammable gases. A part of the gas discharged by the semi-enclosed safety valve flows through the exhaust pipe, and the other part leaks from the clearance between the flap and the valve handle. It is mostly applied to the gas containers with medium which will not pollute the environment. The flap of open safety valve is open, so that the spring cavity is connected to the atmosphere, favorable for reducing the temperature of the spring. It is applicable to the containers with medium as steam or high-temperature gas which will not pollute the atmosphere.
The safety valve must conduct periodical test at least once a year. The inspection includes dynamic inspection and disintegration inspection. The steps of dynamic inspection are divided into assembly, boosting (to working pressure), holding pressure (maintaining for a period of time without discharge), boosting to activation (activate discharge while increasing to the opening pressure), depressurization to reseat, and maintaining pressure (maintaining for a period of time after reseat without discharge). Dynamic inspection must perform the pressure test of the safety valve and check the maximum spur pressure PS that it can withstand, whether it can activate depressurization, whether it is closed after the pressure is reduced to the reseat pressure PR, what is the pressure difference ΔP between PS and PR, and so on.14–17 Since the current safety valve testing relies mainly on manual operation, it requires a lot of labor costs and is not accurate. Even if some of the test machines are already in use, most of them support the automatic measurement function and they cannot provide the complete automatic test control procedure. In addition, the existing test machines use only a single sensor to measure the safety valve pressure during the test and use it as the basis for judging the test results, so it is easy to have insufficient test accuracy. The main reason is that different types of safety valves can have different working pressure ranges, and appropriate pressure sensing devices must be used according to their pressure ranges. Otherwise, it is extremely easy to have problems of insufficient accuracy (such as using high-pressure sensor to detect low-pressure range) or failed detection (using low-pressure sensor to measure high-pressure range). Under certain circumstances, the sensors must be changed to appropriate pressure ranges manually.
In order to solve the above problems, a high-precision safety valve test architecture with three testing channels was proposed in this study, 8 and an automated safety valve testing system was also developed. This system can enable the user to define the test specifications and control parameters of the tested safety valve through parameter setting. The system can automatically open the corresponding testing channel according to the test pressure of the safety valve, so as to select the appropriate pressure sensor for precise measurement. In addition, this system can automatically perform the complete safety valve test operation, and it can automatically record the measured pressure data during the test process, thereby drawing its pressure curve, judging the test results, and outputting the test report. This article uses low, middle, and high test pressures to test the spring-type safety valves. In addition, it statistically analyzed the test results and judged whether the test was passed. And then, the test report was automatically generated. However, this system can also provide the user with reasons for analyzing the safety valve test failure and use them as the diagnosis basis for its fault or abnormality.
System design
System architecture
The three-channel safety valve testing system architecture proposed in this study is shown in Figure 2. In the figure, the blue full line represents the flow path of the gas, the green dotted lines represent the detection signal transmission paths, and the red dotted lines represent the control signal lines. The functions of each component are described as follows:
Safety valve test bench: It is a universal safety valve test platform that can fix the tested safety valve through the hydraulic control module and supply the gas pressure required for testing.
Hydraulic control module: It can lock and fix different types of tested safety valves to the test bench through hydraulically controlled clamps, providing a stable safety valve test environment.
Low-pressure channel unit: It is used to provide the low pressure (0–30 kg/cm2) to the safety valve test bench, and it can detect the pressure of this channel through the low-pressure sensor (sensing range of 0–30 kg/cm2).
Middle-pressure channel unit: It is used to provide the middle pressure (30–100 kg/cm2) to the safety valve test bench, and it can detect the pressure of this channel through the middle-pressure sensor (sensing range of 0–100 kg/cm2).
High-pressure channel unit: It is used to provide the high pressure (100–250 kg/cm2) to the safety valve test bench, and it can detect the pressure of this channel through the high-pressure sensor (sensing range of 0–250 kg/cm2).
Channel selection unit: It can activate low-, middle-, or high-pressure channels according to the monitoring host command, so as to provide the appropriate range of air pressure for the test bench.
Gas source: It is the source of air pressure, such as positive-pressure nitrogen or air cylinders.
Booster compressor: It can compress the gas supplied from the positive-pressure gas source into high-pressure gas and store it in the high-pressure tank first.
High-pressure tank: It acts as the buffer tank for compressed high-pressure gas for further adjustment to various ranges of test pressure.
Pressure adjustment unit: It is a pressure-regulating valve, which uses the high-pressure tank as the air pressure source. The air pressure of the testing channel can be gradually adjusted to the highest test pressure for the safety valve test.
Pressure control unit: It can control the valve switch of the pressure-regulating valve according to the command of the monitoring host. When the valve is opened, the pressure of the testing channel can be increased. When the valve is closed, the increase in the air pressure of the channel will be stopped.
Switch detection unit: It is used to detect the switch state of the pressure-regulating valve and transmits it to the monitoring host through the signal acquisition control unit.
Signal acquisition control unit: It is an Advantech USB-4711A adapter card 18 that can transmit the signals detected by the pressure sensors and the switch sensor to the monitoring host and transmit commands of the monitoring host to control units.
Monitoring host: It is a personal computer that can execute the LabVIEW monitoring software. It allows the user to set parameters and automatically execute the complete safety valve test procedure. Finally, based on the measured pressure data, it can carry out statistical analysis and judge the test results, and then produce the test report automatically.
Report output: It is used to output the safety valve test report produced by the monitoring host, so as to provide it to users for function validation or fault diagnosis.

System architecture.
Hardware design
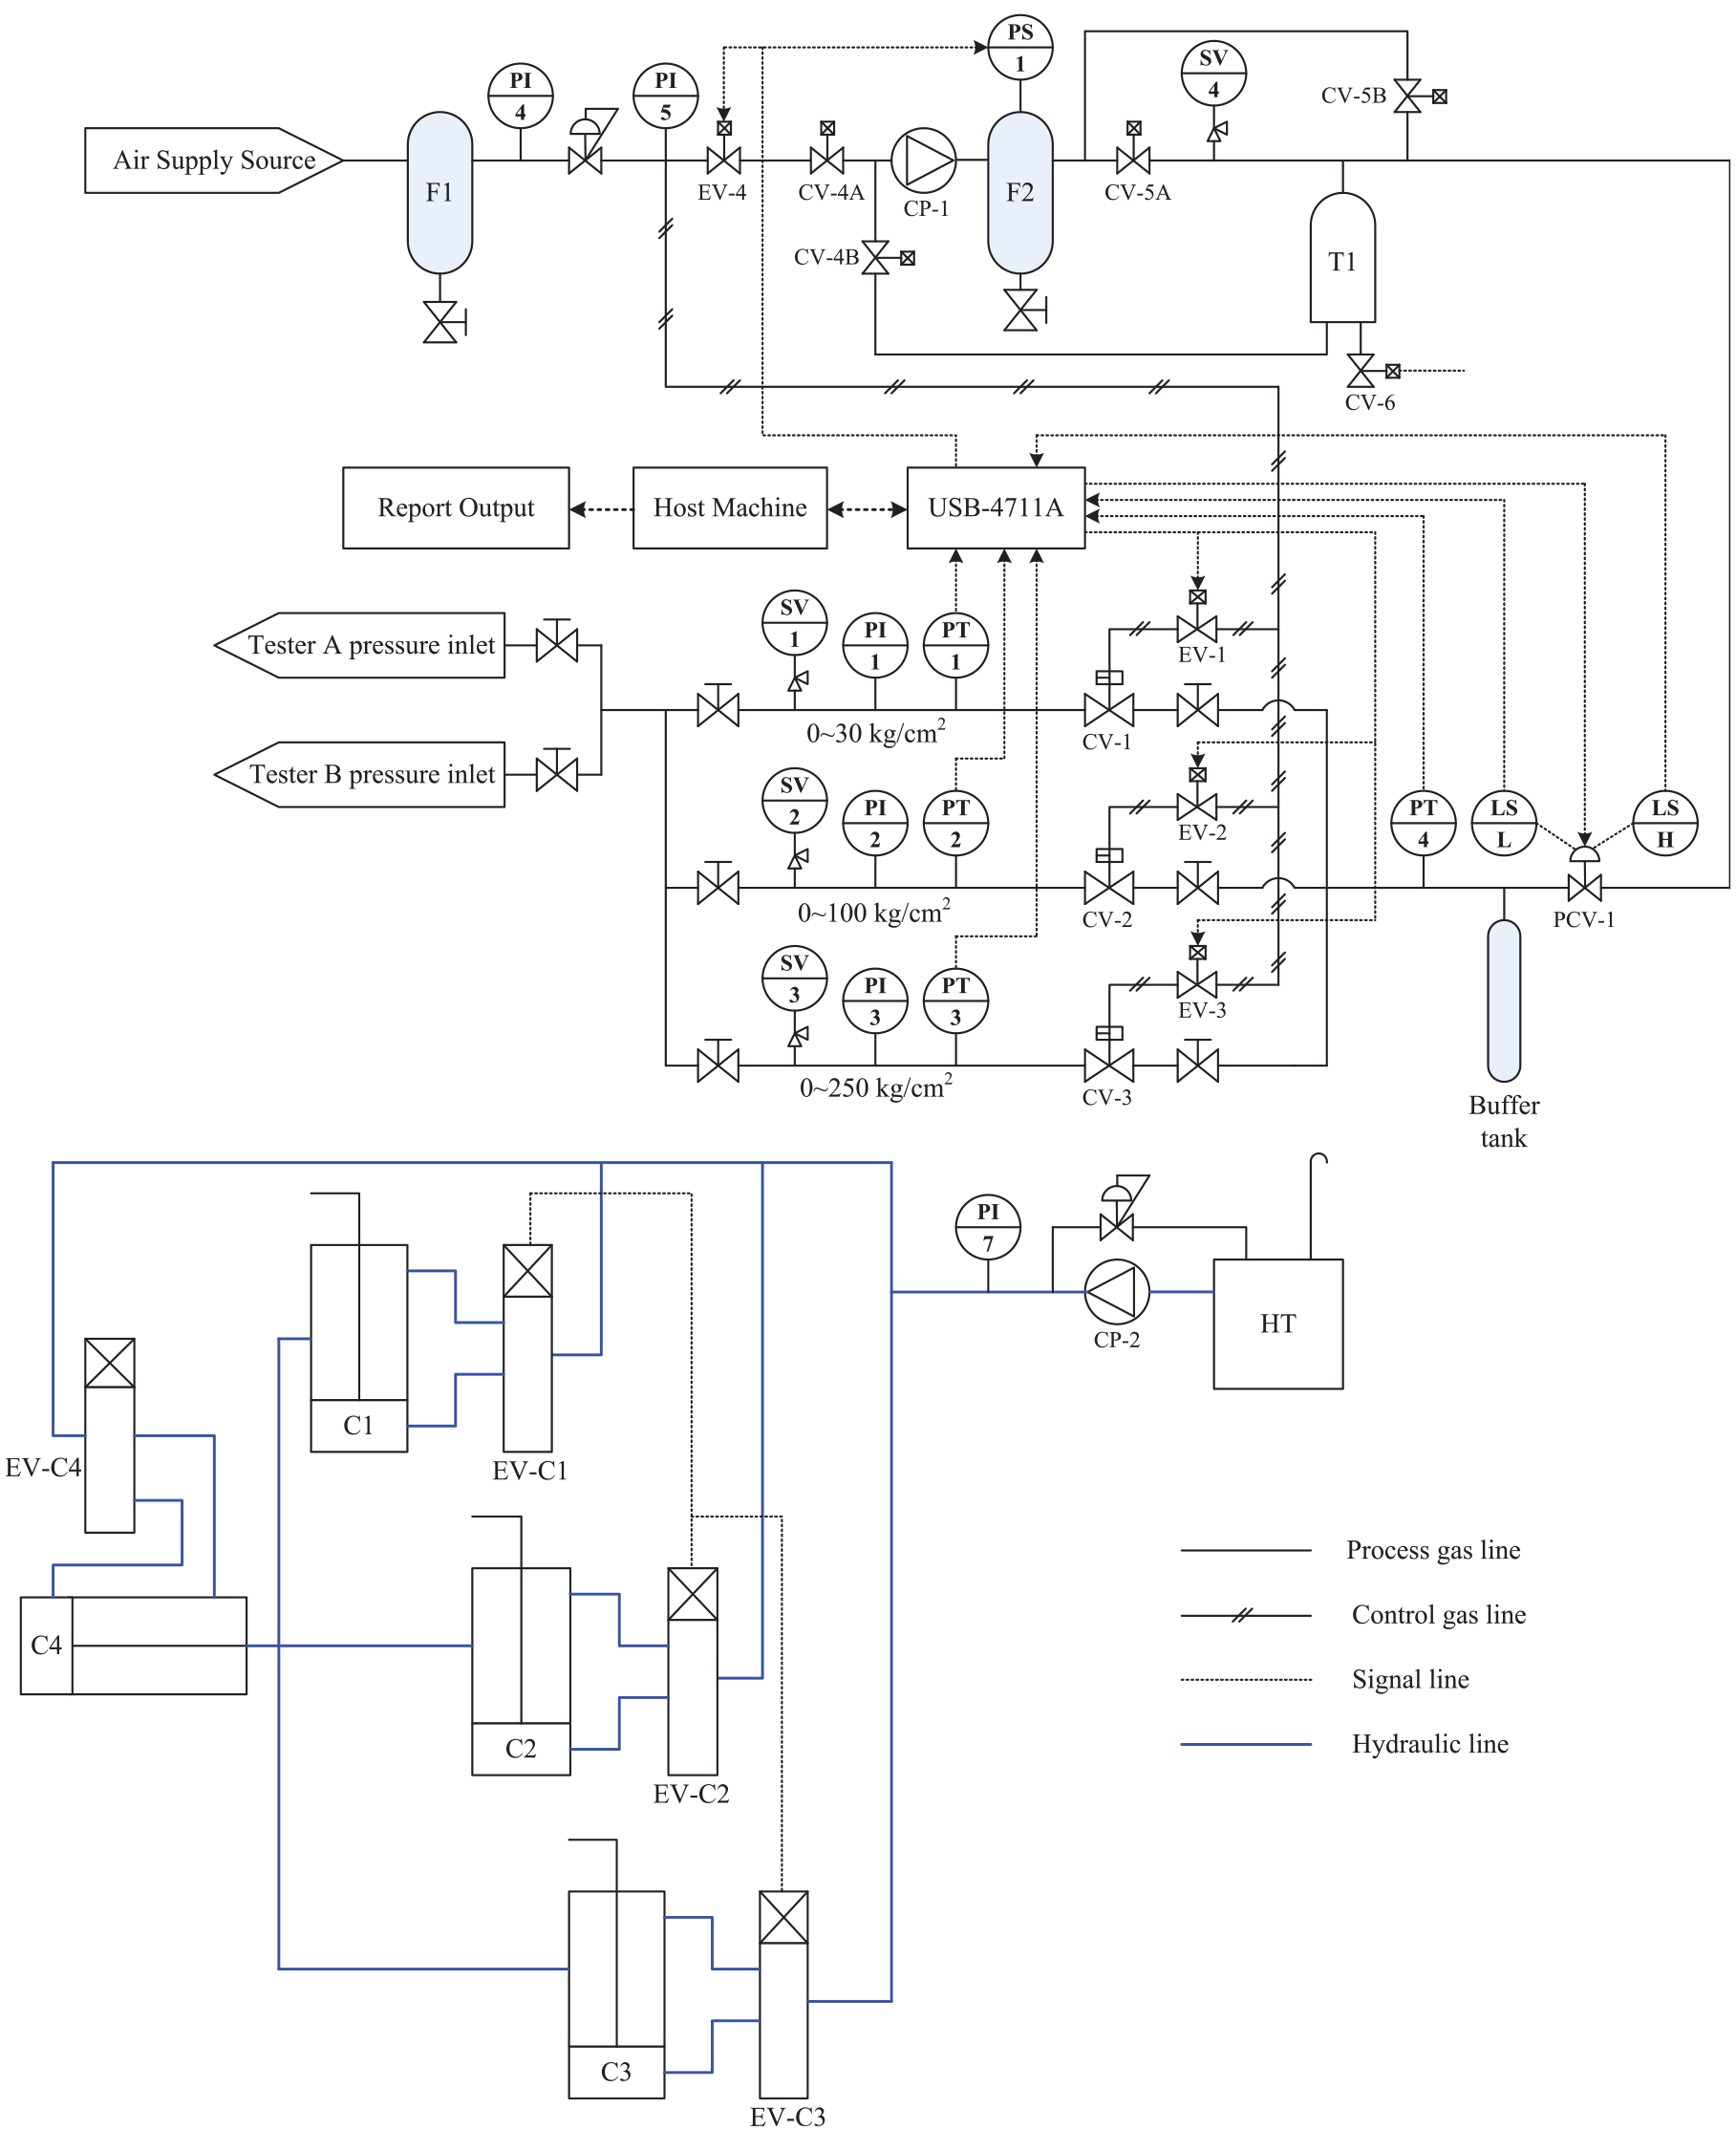
In the hardware design part, the P&ID (process and instrument diagram) of the safety valve testing system is shown in Figure 3. In this diagram, both F1 and F2 are filters, T1 is the high-pressure tank, PI-1 to PI-6 are pressure indicators, PS-1 is the pressure switch, and SV-1 to SV-4 are safety valve components for internal overpressure protection of the system. Both CP-1 and CP-2 are air compressors, PT-1 to PT-4 are pressure-detecting transducers (pressure sensors), and PVC-1 is the pressure-regulating valve. In addition, CV-1 to CV6 are control valves, EV-1 to EV-4 are electric valves, and LS is the limit switch. LSH and LSL are, respectively, used to detect the open (high) and closed (low) states of PCV-1. Each PT and PCV can transmit signals to the USB-4711A adapter card for monitoring host processing, and each EV and LS can be driven by the control signal sent by the monitoring host through the USB-4711A adapter card. Below the figure is the hydraulic control system of the safety valve test bench, in which HT is the hydraulic tank and C1 to C4 are the hydraulic cylinders. Among them, C1 to C3 can be driven by C4 at the same time, which can be locked and fixed to the test bench when the safety valve under test is installed.
Hardware design: P&ID.
Since different safety valves can have different pressure application ranges, when detecting the pressure of the safety valve, the corresponding pressure sensor should be used according to its applicable range. For example, for low-pressure safety valves, low-pressure sensors should be used. If middle- or high-pressure sensors are used, there may be insufficient accuracy. Conversely, for the high-pressure safety valve, only the high-pressure sensor can detect its high pressure. Therefore, this system has designed the testing channels controlled by three sets of electric valves, namely, EV-1, EV-2, and EV-3, for the tested safety valves of low-, middle-, and high-pressure ranges. What’s more, it uses low-, middle-, and high-pressure sensors (PT-1, PT-2, and PT-3, respectively) to detect the pressure of the corresponding channel respectively. The system can automatically activate the corresponding testing channel according to the set test pressure PSet (working pressure) and perform the test operation of the tested safety valve. Table 1 shows the control table of the safety valve testing channels, in which the pressure-regulating valve PCV-1 is used to activate the forward/backward rotation of the gas source motor, which can control the opening range of the gas source. It can turn on the gas source during forward rotation, and turn off the gas source during backward rotation. The pressure sensor PT-4 is used to detect the source air pressure. The column of pressure range in Table 1 shows the pressure range to be detected by each sensor, including the pressure range corresponding to the three pressure units of kg/cm2 or psig or bar. EV-1 to EV-4 are control valves that perform ON/OFF switching operations, of which EV-4 is the electric valve that controls the pressure discharge.
Control planning table for safety valve testing channels.

The actual safety valve testing system developed in this study is shown in Figure 4. Figure 4(a) shows the control module consisting of the monitoring host and various detection and control component circuits. The front of Figure 4(b) shows the safety valve test bench of this system.

Actual safety valve testing system: (a) control module and (b) testing module.
Software development
This study developed the automatic monitoring software for this safety valve testing system with the LabVIEW graphical language.19–21 This software mainly includes three major functions: parameter setting, safety valve test, and report output. Before the safety valve test, the user can define the test specifications and control parameters through parameter setting. The parameter setting screens are shown in Figure 5, where the blue block is the menu for selection, the white blocks are the areas for input, and the yellow blocks are the areas that the system automatically generates or automatically displays. The parameters that can be set include the following: customer model, project No., valve No., pressure unit (selectable pressure units such as kg/cm2 or psig or bar), number of tests (m), test pressure (PSet), increment percentage of the control pressure (RI), sampling time (Δt), test time (TT), residual pressure removal time (TR), tolerance error of the spur pressure (ESM), tolerance range of the reseat pressure (ERL–ERH), upper and lower limits of pressure curve display, and output file path. Judgment parameters such as ESM, ERL, and ERH are set up according to the factory ratings. The system can determine the maximum pressure (PMax) of the pipeline through the PSet and RI parameters, where PMax = (1 + RI)PSet. For example, if the user selects “kg/cm2” as the pressure unit in Figure 5(a), then all units in the screen will be displayed as kg/cm2, and the pressure range of the system is automatically set to 0–250 kg/cm2. If the user selects “psig” as the pressure unit in Figure 5(b), then all units in the screen will be displayed as psig, and the system will automatically set 0–3556 psig as the pressure range. In Figure 5(a), if PSet = 156 kg/cm2 and RI = 3%, then PMax = (1 + 3%)156 = 160.68 kg/cm2. Since this PSet is in the high-pressure range, the system automatically turns on the high-pressure channel controlled by EV-3 and uses the PT-3 pressure sensor to detect the air pressure of the channel. In Figure 5(b), if PSet = 300 psig and RI = 3%, then PMax = (1 + 3%) 300 = 309 psig. Since this PSet is in the low pressure range, the system automatically turns on the low-pressure channel controlled by EV-1 and uses the PT-1 pressure sensor to detect the air pressure of the channel.

Parameter setting screen: (a) parameter setting for selecting kg/cm2 as the pressure unit and (b) parameter setting for selecting psig as the pressure unit.
The execution procedure of safety valve testing is shown in Figure 6. This procedure contains 3 stages and 10 steps. The first stage is the initial stage (steps 1 and 2), the second stage is test stage (steps 3–9), and the third stage is the output stage (step 10). The functions of various steps are described as follows:
Step 1: Set test parameters. The user can input or set various test and control parameters as the criteria of safety valve test.
Step 2: Remove residual pressure in pipeline. The residual gas pressure in the pipeline must be relieved before the safety valve testing procedure is implemented.
Step 3: Open testing channel according to test pressure. This system can open the corresponding testing channel automatically according to the high, middle, or low pressure ranges of test pressure (PSet) and implements the test procedure and records the test data automatically.
Step 4: Activate pressure source to control boost. The system starts up motor to rotate forward to turn up the pressure source control valve gradually to increase the pipeline gas pressure PI.
Step 5: Check whether the maximum pressure is reached or not. Check whether the pipeline gas pressure has reached the maximum pressure (PMax) or not. If not, return to step 4. If yes, continue to implement step 6.
Step 6: Close pressure source to control pressure reduction. The system starts up motor to rotate reversely to turn down the pressure source control valve gradually to reduce the pipeline gas pressure.
Step 7: Check whether the test is completed or not. Check whether the pressure source control valve has been turned off and the test time (TT– TR) is up or not. If not, return to step 7. If yes, continue to implement step 8.
Step 8: Remove residual gas in pipeline. The residual gas pressure in pipeline must be relieved in removal time (TR) after the test is completed.
Step 9: Check whether the m tests have been completed. If not, return to step 3. If yes, continue to implement step 10.
Step 10: Export test report. The system generates test report automatically according to the recorded test data.

Safety valve testing procedure.
The screen of executing the safety valve testing process in this system is shown in Figure 7. The relevant test parameters are displayed at the top of the screen, as well as the source gas pressure measured by PT-4 and the safety valve pressure measured by PT-3. The pressure curve of the tested safety valve is displayed in the middle of the screen, and the displayed range is 100–200 kg/cm2 (determined by the parameters in Figure 5(a)). The testing channel for the tested safety valve “ST-Valve-11” is the high-pressure channel controlled by EV-3. When the user presses the “START” button in the lower left of Figure 7, the system automatically executes the control actions from step 2 to step 9 of the test process in Figure 6 according to the parameters set by the user. These control actions include removing the residual gas from the pipe in step 2 and implementing the test actions from step 3 to step 9 repeatedly. The number m of repeated tests can be set by the user in Figure 5. The “Total” item in the upper right of Figure 7 can display this set value (m = 10), and the “Test no” item value is 2 for the moment, meaning the second test has been finished. In addition, in the course of each test, the system extracts the measured pressure value of PT-3 sensor automatically and draws the real-time pressure curve. Finally, the system saves the user set parameters and the pressure data measured by the sensor in each test, so as to analyze the test result and to generate the test report. The state transition diagram of the safety valve real-time testing process is shown in Figure 8.

Safety valve testing screen.

State transition diagram for safety valve testing.
Testing results
The system can perform the testing process for different sizes and different types of safety valves. Figure 9(a) shows the various types of tested safety valves. Each safety valve can be installed on the test bench first through the hydraulically controlled clamp during the test, as shown in Figure 9(b). Then, it starts the automatic monitoring software to execute the testing procedure in Figure 6. Finally, based on the automatically measured and recorded test data, it carries out the analysis and judgment of the test results, as well as the output of the test report.

Installation and testing of the tested safety valve: (a) various types of tested safety valves and (b) tested safety valve installed on the test bench.
To generate the test report on each safety valve, the system establishes the average pressure curve Pj (j = 1, …, n) and standard deviation pressure curve Sj (j = 1, …, n) according to the pressure curve data Pij (i = 1, …, m, j = 1, …, n) recorded in m tests for the safety valve, and then it calculates the average value Savg of Sj, wherein n is the number of pressure data recorded in each test. The Pj, Sj, and Savg are calculated by equations (1)–(3) respectively


The average pressure curve Pj (j = 1, …, n) of the safety valve will be displayed in the test report, and the spur pressure PS can be defined as the maximum value of Pj curve. The reseat pressure PR is the average value during pressure maintenance after the safety valve is closed, and PS and PR are calculated by equations (4) and (5)


where A and B are the starting point and ending point for calculating PR; A = k + D, where k is the position of PS (i.e. Pk = PS) and D is the point of the maximum time for gas discharge (within d seconds; i.e. D = d/Δt); and B = (TT –TR)/Δt. The time coordinate positions of A, B, D, and k are shown in Figure 10(a).

Automatically generated safety valve test reports: (a) exported report of test failure due to the spur error is too large; (b) exported report of passed test; (c) exported report of test failure due to the reseat error is too large; and (d) pressure curve of test failure due to the reseat error is too small.
If the test result is to be judged, it is necessary to consider both the spur error ES and the reseat error ER; ES and ER are calculated as equations (6) and (7)


where ΔP = PS – PR, and the judgment of the pass or fail of the test result is given in equation (8)

The high-, middle-, and low-pressure spring safety valves are tested in this study. The valves with high pressure and middle pressure are open safety valves, and the ones with low pressure are semi-enclosed safety valves. Four safety valves in different states are tested, the results are judged, and then the test reports are generated automatically. Figure 10(a)–(d) shows the test reports on four high-pressure safety valves. In each report, “Reading” indicates the test pressure, “Average value” is the average pressure, “Spur value” is the spur pressure, “Reseat value” is the reseat pressure, “Min. value” is the initial pressure, “Test result” may display the “Pass” or “Fail” testing results, and “Average STD” is the Savg which is defined in equation (3).
The statistics of the four test experiments in Figure 10 are shown in Table 2. The pressure unit is kg/cm2. The test pressure PSet of the four test experiments are all in the range of high pressure, so all of them use PT-3 sensors for pressure measurement. The judgment parameters set by the user include the tolerance error of the spur pressure ESM = 3%. The allowable lower limit and upper limits of the reseat pressure are ERL = 2% and ERH = 15%, respectively.
Statistics of the high-pressure safety valve test experiments.

According to the statistics of Table 2, for Test 1, the spur error is too large (|ES| = 3.09% > ESM) because the set test pressure of the safety valve “ST-Valve-11” is too low (PSet = 150 kg/cm2), so the test result is Fail. For Test 2, in “ST-Valve-12,”|ES| = 0.89% < ESM and ERL < ER = 4.8% < ERH, indicating that both the spur and the reseat functions are normal, so the test result is Pass. For Test 3, “ST-Valve-13” fails to close the safety valve when it is discharged to the appropriate pressure, but it continues to reduce pressure instead, which makes the reseat pressure too low (PR = 130.49 kg/cm2), and the reseat error is too large (ER = 17.44% > ERH), so the test result is Fail. For Test 4, “ST-Valve-14” fails to open the safety valve at the maximum pressure for gas discharge to reduce the pressure, but it continues to maintain high pressure instead, which makes the reseat pressure too high (PR = 159.35 kg/cm2), and the reseat error is too small (ER = 0.54% < ERH), so the test result is Fail. Each bold value in Table 2 to 4 indicates the cause of the test failure in the corresponding line.
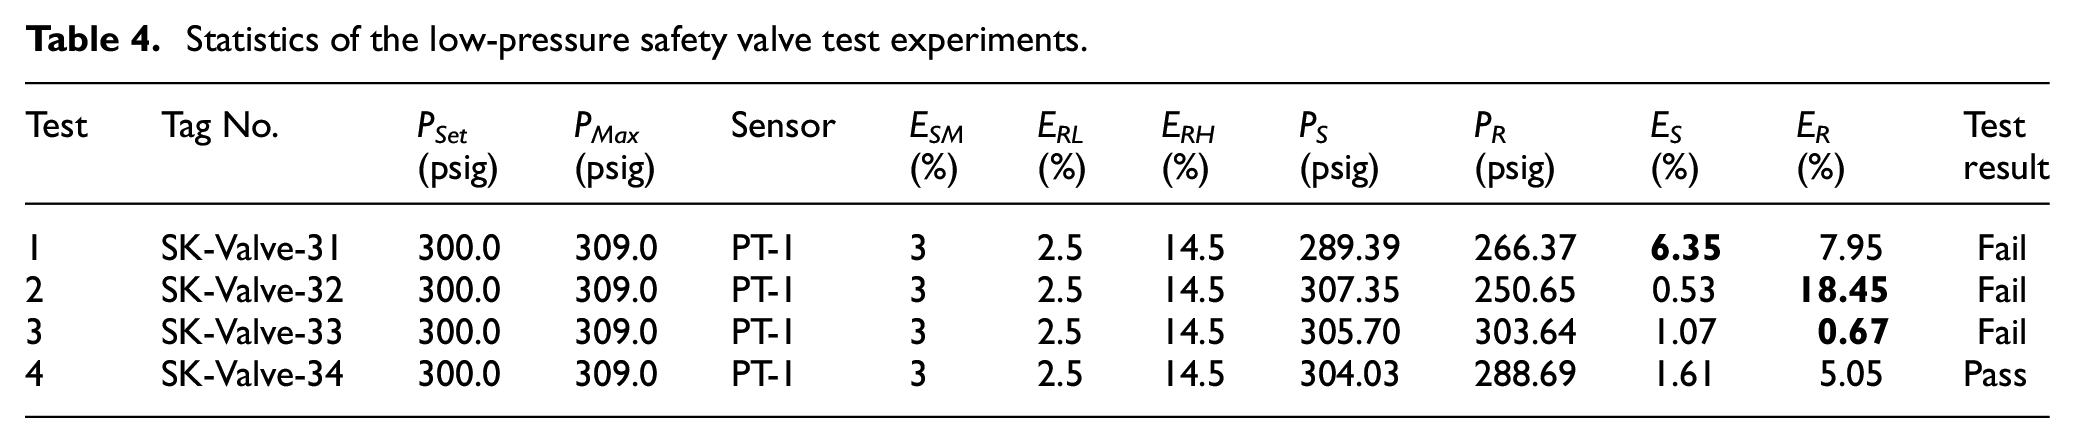
Four middle-pressure safety valves in different states and four low-pressure safety valves in different states are tested, and the test data statistics are shown in Tables 3 and 4, respectively. The judgment parameters in these two tables are set as ESM = 3%, ERL = 2.5%, and ERH = 14.5%, respectively. In Table 3, the pressure unit is kg/cm2. All the PSet of the four safety valves are 80 kg/cm2 (in the middle pressure range), so the PT-2 sensor is used for pressure measurement. The test results show that only ST-Valve-21 is Pass and the other safety valves are Fail. Among them, the ER of ST-Valve-22 is too high, the ES of ST-Valve-23 is too high, and the ER of ST-Valve-24 is too low. In Table 4, the pressure unit is psig. All the PSet of the four safety valves are 300 psig (in the low pressure range), so the PT-1 sensor is used for pressure measurement. The test results show that only SK-Valve-34 is Pass and the other safety valves are Fail. Among them, the ES of SK-Valve-31 is too high and the ER of SK-Valve-32 is too high, and the ER of SK-Valve-33 is too low.
Statistics of the middle-pressure safety valve test experiments.

Statistics of the low-pressure safety valve test experiments.
In order to validate that the test accuracy of the three-channel safety valve testing architecture proposed in this study can be better than single-channel test architecture, the high-, middle-, and low-pressure safety valves are tested in conventional single-channel test system and the developed three-channel test system, respectively. The former one only uses the high-pressure sensor PT-3, as listed in Table 1. The latter one uses PT-1, PT-2, and PT-3 sensors in low, middle, and high channels, respectively. Each safety valve is tested 10 times, and the standard deviation curve Sj is established. As the extent of standard deviation can reflect the discrete degree of pressure data measured in the 10 tests, the test accuracies of the two system architectures can be compared according to Sj. Figure 11(a) shows the single-channel standard deviation curve (represented by ST-Valve-11(1)) and three-channel standard deviation curve (represented by ST-Valve-11(3)) of the high-pressure safety valve ST-Valve-11. Figure 11(b) shows the single-channel standard deviation curve (represented by ST-Valve-21(1)) and three-channel standard deviation curve (represented by ST-Valve-21(3)) of the middle-pressure safety valve ST-Valve-21. Figure 11(c) shows the single-channel standard deviation curve (represented by SK-Valve-31(1)) and three-channel standard deviation curve (represented by SK-Valve-31(3)) of the low-pressure safety valve SK-Valve-31.

Comparison of standard derivation curves for single test channel and three test channels. Standard derivation curves for (a) high-pressure safety valve, (b) middle-pressure safety valve, and (c) low-pressure safety valve.
According to the comparison result of three standard deviation curves in Figure 11, for the high-pressure safety valve, the three-channel Sj curve is quite close to the single-channel Sj curve, so there is slight difference between their test accuracies. For the middle-pressure safety valve, the three-channel Sj curve is lower than the single-channel Sj curve; the former one has better test accuracy than the latter one. Finally, for the low-pressure safety valve, the three-channel Sj curve has been much lower than the single-channel Sj curve, so the test accuracy of the former one is more obviously better than that of the latter one.
The high-, middle-, and low-pressure safety valves listed in Tables 2–4 are tested 10 times in the single-channel system and three-channel system, respectively, and then the standard deviation curve Sj is established and the average value Savg of Sj is calculated; the test accuracies of the two system architectures are compared by Savg. Table 5 shows the comparison result of Savg of the two system architectures after 12 high-, middle-, and low-pressure safety valves are tested. According to the comparison result in this table, in terms of high pressure, the single-channel Savg is about 1.08 times of three-channel Savg; in terms of middle pressure, the single-channel Savg is about 2.52 times of three-channel Savg; in terms of low pressure, the single-channel Savg is about 8.24 times of three-channel Savg. Larger Savg represents higher dispersion of measured pressure values, lower measured precision, and lower test accuracy. Therefore, the test accuracy of the three-channel system architecture proposed in this study is over 2 times of the single-channel architecture in the middle-pressure part in this test, and over 8 times in low-pressure part.
Comparison of Savg between single channel and three channels.

Discussion
This research has developed an automated safety valve testing system with high-precision measurement function. This system has the following four characteristics:
It can be applied to the safety valve test requirements of different types and different specifications: users can define the test specifications of the tested safety valve through parameter setting in the monitoring software such as unit, number of tests, test time, test pressure, maximum pressure, and allowable error range. In the design of the test bench hardware, it provides a hydraulically controlled clamp that locks and fixes safety valves of different sizes to the test platform, so it can be used for the test of various types of safety valves.
According to the precise test requirements of different ranges for low, middle, and high pressure, three testing channels of low, middle, and high pressure have been built in this system. This system can automatically find out the corresponding testing channel according to the test pressure set by the user and carry out the pressure measurement with the most appropriate pressure sensor, thus meeting the precise testing requirements of the safety valves with different pressure ranges.
To improve the measurement quality of the pressure signal, this system eliminates the excessive external signal through the shielding technology in the hardware part and filters the high-frequency noise using the short-circuit filter capacitor. In the software part, it uses the method of mean value to remove the effects of a few surges. On one hand, the signals are captured 10 times consecutively within each sampling time, and the average value is calculated as the measured value, so as to obtain highly correct pressure measurement signals. On the other hand, this system can execute m test operations (m is set by user) for the tested safety valve and can calculate the average pressure curve to judge the test result, so as to obtain highly accurate testing performance.
It provides the automated safety valve testing procedure: this study has designed a complete and practical test control process with reference to the dynamic check procedure of the safety valve. When the user completes the setting of test pressure, the highest pressure, the sampling time, the test time, the pressure discharge time, and other related parameters, the system can automatically perform pressure discharging, pressure boosting, pressure maintaining, and other related control actions based on it. Therefore, the user only needs to install the tested safety valve on the test bench and complete the relevant test parameter setting, and then he or she can start the monitoring software to automatically complete the control process of the test.
It can judge the test result and automatically generate the test report: this system can automatically record all the measured pressure data during the execution of the whole test process, draw the pressure curve (according to the upper and lower limits of the display), and calculate the important information of the pressure curve according to the parameters set by the user such as the spur pressure, the reseat pressure, the spur error, and the reseat error and then judge whether the test result is Pass or Fail. Finally, it can automatically generate and output the report of the safety valve test.
It can be known from the above characteristics that the low-, middle-, and high-pressure testing channels built by Characteristic 2 can solve the problem of precision test that it is difficult to respond to different pressure ranges in the past using the single pressure sensor. Based on the masking technique and short-circuit filter capacitor design of hardware in Characteristic 3, as well as the mean technique of software, highly correct and highly accurate testing performance can be obtained effectively. Through the automatic safety valve test procedure provided by Characteristic 4, the problem of high labor cost of the current manual or semi-automatic operation can be solved. Through the pressure curve plotted by Characteristic 5, as well as the calculated spur pressure, reseat pressure, spur error, reseat error, and other information, when the safety valve test fails, it can provide the user with the diagnosis of the cause of the safety valve abnormality and judge whether the spur error is too large due to the wrong test pressure, whether the reseat pressure is too low because the safety valve cannot close the reseat, and whether the reseat pressure is too high because the safety valve cannot be relieved, and so on, using them as the reference for subsequent safety valve adjustment or maintenance.
In the design of the control system,22,23 the control mode of this system adopts sequential control combined with multi-condition logic control. In the state transition diagram of the control process, it mainly includes timing control (timing parameters based on test time or pressure discharge time, etc.) and multiple feature monitoring control (such as pressure, switch, and other control parameters). This system allows the user to set the target value of each parameter and performs multi-condition monitoring and logic control to determine the direction of execution. In this way, the control output of the multi-condition judgment can have high tolerance and stability to signal offsets and other external condition changes. Therefore, this control system can be highly robust.
Conclusion
During the current safety valve test through manual or semi-automated operation in industries, it may cost a lot of labor and the accuracy is not good. What’s more, the use of a single sensor is difficult to carry out precision tests in different pressure ranges. Therefore, an automated safety valve testing system with three testing channels has been developed in this study to cope with these problems. In this system, the user can define the test specifications and related control parameters of the tested safety valve through parameter setting. In addition, this system can automatically execute the complete test control process according to the set parameters, judge whether the test result is passed, and output the test report based on the recorded measurement data. In this article, test experiments on safety valves in four different states have been respectively tested for safety valves with three different test pressures (low, middle, and high). Through the statistical analysis of the test results and the judgment on whether the test is passed, the high-precision automated test function of this system has been verified. Therefore, the research results in this article may effectively solve the problems of current safety valve testing in the industries, improve its operational efficiency, and enhance its testing quality.
Footnotes
Handling Editor: James Baldwin
Declaration of conflicting interests
The author(s) declared no potential conflicts of interest with respect to the research, authorship, and/or publication of this article.
Funding
The author(s) received no financial support for the research, authorship, and/or publication of this article.
