
Abstract
This paper focuses on solving the problem of poor excitation performance of precision- controllable vibrator leading to shallow exploration depths, which cannot fully meet the current demand for deep oil and gas resources exploration. For this purpose, the evaluation parameters of the excitation performance of the precision-controllable vibrator are clarified, an optimization model of the structure parameters of the precision-controllable vibrator is established. Particle swarm algorithm and Pareto optimization logic are used to integrate the solution set to optimize the structure of precision-controllable vibrator and enhance the excitation performance of precision-controllable vibrator.
Keywords
Introduction
Precision-controllable vibrator has long been of interest for their reduced surface damage and contaminant emissions compared to explosive or hydraulic vibrator.1,2 Indoor and urban tests of precision-controllable vibrator and the application of monitoring the stratigraphic structure of fracture zones had initially verified the feasibility and practical value of precision-controllable vibrator.3–7 However, there is a large gap in the excitation performance of precision-controllable compared with explosive vibrator, and the exploration depth is shallow, which is often less satisfactory for oil and gas detection in the depth range above 1500 m. 8
To enhance the effect of deep exploration of precision-controllable vibrator, Yang et al. 9 used coherent and inverse fold product methods to enhance the signal strength of vibrator signals. Cui 10 enhanced the resolution of vibrator exploration by improving the emission signal of precision-controllable vibrator.11–13 Ikeda et al. 14 demonstrated that the spatial resolution of exploration can be effectively enhanced by combining the high repeatability signal of vibrator with the addition of window analysis. Song et al., 15 and Dong et al. 16 enhanced the precision-controllable vibrator base and verified that the excitation performance on the surface of concrete and steel base is better than direct contact with soil. In order to obtain better excitation effect, two degree of freedom system dynamics and energy transfer of vibrator plate are studied. Lu17–19 believes that the spring damping and stiffness will affect the vibration effect of the two degree of freedom system, and further studies its nonlinear effect. Ding 20 summarized the technical requirements of the vibrator baseplate in the process of energy transfer, and put forward the ways to improve the performance by changing structure and materials. Li21,22 proposed that the baseplate area, the reaction mass and the frequency band are the important factors affecting the excitation performance. Huang and Ding 23 used topology method to optimize the baseplate structure of KZ-28 vibrator based on the energy transfer rate and other baseplate performance evaluation parameters of vibrator, and proposed a new baseplate structure to improve the performance. Although the above studies have enhanced the discrimination and excitation performance of exploration by signal processing and changing the contact method, the enhancement of the deep exploration capability of precision-controllable vibrator is limited. This aims to optimize the structural parameters of the vibrator and improve the exploration efficiency. For this purpose, a precision-vibrator structural optimization model evaluating parameter of the excitation performance is established for the first time. The particle swarm optimization algorithm and Pareto optimization logic are used to integrate the vibrator structural parameters, and select the vibrator structural parameters with better excitation performance.
Structural optimization model based on excitation performance evaluation parameters
A precision-controllable vibrator is shown in Figure 1, and the vibration signal generated by its excitation box is transmitted to the ground through a baseplate to form seismic waves. 24 The effect and depth of seismic wave excitation are influenced by the vibrator down-transmission energy and the similarity between the excitation signal and the design signal, respectively. Generally, the deeper the seismic wave transmission, the greater the similarity of signals, and the better the precision-controllable exploration. 25 Therefore, this paper characterizes the variation of the excitation performance of the precision-controllable vibrator by the down-transmission energy and signal similarity.

Precision-controllable vibrator.
The dynamics system of the precision-controllable vibrator can be shown in Figure 2, where m1 is the mass of the top plate and the mass of the supporting column (upper mass), m2 is the total mass of the lower part components such as the baseplate and the excitation box (lower mass), k0 and c0 are the stiffness and damping of the rubber damper between the compression weight and the vibration top plate, 26 and kd, cd are the stiffness and damping between the vibration baseplate and the ground.

Dynamic model of the precision-controllable vibrator.
Excitation performance evaluation parameters
Ground forced vibration amplitude Y
In this paper, only suitable evaluation parameters are needed to characterize the magnitude of the down-transmission energy from the vibrator, without calculating the exact value of the actual down-transmission energy. Therefore, the dispersion of elastic waves during transmission in the ground, the loss of conversion between bulk and surface waves, and the consumption of internal stresses in the soil can be neglected, and the ground is an isotropic elastomer, as shown in Figure 3. 27

Elastic half-space mode.
Take a slender cylindrical section in the elastic half-space model for analysis, the cross-sectional area is ds, as shown in Figure 4, the baseplate drives the ground along the z-axis direction vibration, through the vibration form of P waves to the deeper part of the ground. Let the density of the ground be ρ, the modulus of elasticity be E, z = 0 at the surface, and the orientation down is positive, assuming that the micro-element section is stretched at this time, dz1 > 0 the down-transmission energy is in accordance with the formula 28 :


Vibration of soil in slender cylindrical section.
In fact, the energy excited by the vibrator radiates to all directions of the ground, and equation (1) characterizes the total elastic wave energy in a certain range of the lower part of the vibrator, which cannot be used to calculate the specific value of the down-transmission energy, and can only indirectly characterize the correlation between the down-transmission energy and various physical parameter.
Since the excitation frequency ω of the precision-controllable vibrator is determined by the scanning signal, 21 it will not change in general; and once the vibration location of the vibrator is determined, the ground density ρ will not change; and the interaction area S between the shaker plate and the ground surface will not change; it is known from equation (1) that the magnitude of the vibrator down-transmission energy and the ground forced vibration amplitude Y are positively correlated, so equation (1) can be rewritten as follows. In the operating state, the scanning frequency ω of the precision-controllable vibrator, the stratigraphic density ρ, and the contact area S between the baseplate and the ground surface, are fixed values. 29 The magnitude of the down-transmission energy is positively correlated with the ground forced vibration amplitude Y. The equation (1) can be rewritten as

In summary, the ground forced vibration amplitude Y can be used as the key evaluation parameter of excitation performance, and the larger the Y, the better the excitation performance.
Phase difference Δφ
The similarity between the output signal of the precision-controllable vibrator and the reference signal is an important factor affecting the exploration results. The excitation force generated by the precision-controllable vibrator is transmitted to the ground through the baseplate without the effect of system nonlinearity.30–32 The waveform of the reference signal of the precision-controllable vibrator can be expressed as 33 :

There is a phase difference Δφ between the output signal and the reference signal, and the output signal of the precision-controllable vibrator is

The wavelet of the precision-controllable vibrator output signal can be expressed as

The wavelet of the signal is calculated with the phase difference Δφ of 0°, 5°, and 10°, and the results are shown in Figure 5.

Wavelet with different phase differences.
As can be seen from Figure 5, with the increase of the signal phase difference Δφ, the maximum value of the wavelet main flap of the signal decreases in turn, leading to the decrease of the excitation effect of the vibrator, and the larger the phase difference, the worse the excitation performance of the precision-controllable vibrator.
Structural optimization model
Objective function
The baseplate is always pressed on the ground during the excitation of the precision-controllable vibrator. Assuming that the baseplate is not decoupled from the ground, the contact part of the ground and the baseplate amplitude is equal, the available baseplate vibration amplitude x characterize the ground forced vibration amplitude Y, x can be expressed as follows:

Where A and B are variables introduced by the harmonic balance method, ω is the excitation frequency, and according to the trigonometric formula, the mathematical expression of the baseplate amplitude x can be rewritten as:

Y is the forced vibration amplitude, and its specific expression is:

The forced vibration function is defined as:

Where X is the set of all design variables, X = [a1, a2…an]
From

That is, the objective function with respect to the amplitude of the ground forced vibration is obtained as:

The force on the ground from a precision-controllable vibrator can be expressed in the dynamical model as:

Substituting (6) into (12):

Simplify (13) to obtain:

where the value:


Δφ is the phase difference between the reference signal and output signal

Therefore, objective function on the phase difference between the reference signal and the output signal is:

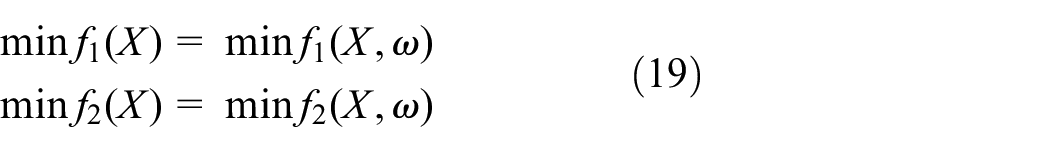
From equations (11) and (18), it can be seen that the evaluation equations of the output energy of the vibrator and the similarity of the output signal include the frequency ω. The objective function should actually be written as follows:
A certain equivalent transformation of the specific expression of the objective function is required before optimization. The excitation frequency ω table varies linearly with time t between the upper and lower limits of the frequency over a complete cycle, with the expression:

where ω1 and ω2 are the lower and upper limits of the excitation frequency, and T is the sweep period.
To characterize the comprehensive performance of the precision-controllable vibrator at each excitation frequency over a complete cycle, 20 points are evenly distributed over the entire bandwidth and the equation of state for each point is linearly superimposed and averaged as follows.

The structure optimization objective function of the precision-controllable vibrator based on the excitation performance evaluation parameters can be expressed as:

Design variables
The statistics of the parameters involved in the evaluation equation of the performance of the precision-controllable vibrator are shown in Table 1.

Dynamic system parameters of precision-controllable vibrator.

In order to reduce design variables, the parameters of the precision-controllable vibrator dynamics system are adjusted as follows:
(1) The maximum exciting force (Fb) is determined by the power and structural strength of the vibrator, which can be regarded as a fixed value;
(2) This paper focuses on finding ways to enhance its excitation performance from the structure of the precision-controllable vibrator. Therefore, the excitation signal bandwidth (ω1, ω2), vibration period (T), ground elastic modulus, density, and Poisson’s ratio (E, ρ, μ) are regarded as fixed values.
(3) The total mass of the precision-controllable vibrator remains unchanged, which can be expressed as:

m 1 can be used as the optimization parameter, and m2 can be calculated by formula (24) and the value of m1.
(4) The distribution of the finite element simulation excitation force transferred from the precision-controllable vibrator to the ground is shown in Figure 6. It can be characterized by a total of seven parameters: r1, r2, r3, r4, A1, A2, and A3, where r is The distance between the excitation force value point and the center of the vibrator, A1, A2, A3 represent the three excitation force amplitudes in the ring zone formed by the four distances of r1, r2, r3, and r4.

Excitation force distribution in the loading area.
It can be seen from Table 1 that the excitation force of the outer area A3 is much greater than the excitation force of the inner areas A1 and A2. It can be considered that the energy excitation force transmitted by the precision-controllable vibrator to the earth is mainly distributed in the outermost area. r3, r4, and A3, which characterize the distribution of excitation force in the outermost region, are used as research objects. In addition, since the contact force between the vibrator and the ground is the exciting force acting on the surface of the ground by the precision-controllable vibrator, no matter how the exciting force is distributed, the total value of the exciting force will not change much, which can be approximated as

Among them, a3 is the stress value in the zone area obtained through simulation, so only the values of r3 and r4 need to be determined during analysis and calculation, and the excitation force amplitude A3 can be calculated by the above formula,
In summary, the design variables for the optimization analysis of the excitation performance of the precision-controllable vibrator can be expressed as
Restrictions
(1) The lower mass of the precision-controllable vibrator includes at least the excitation box, eccentric mass, motor and other components, so the value of the upper mass is:

(2) The stiffness and damping ratio of the vibration isolator can be selected according to the parameters of the rubber damper, 30 and the possible range is:

(3) The value range of the excitation force distribution area and the excitation force distribution position is:

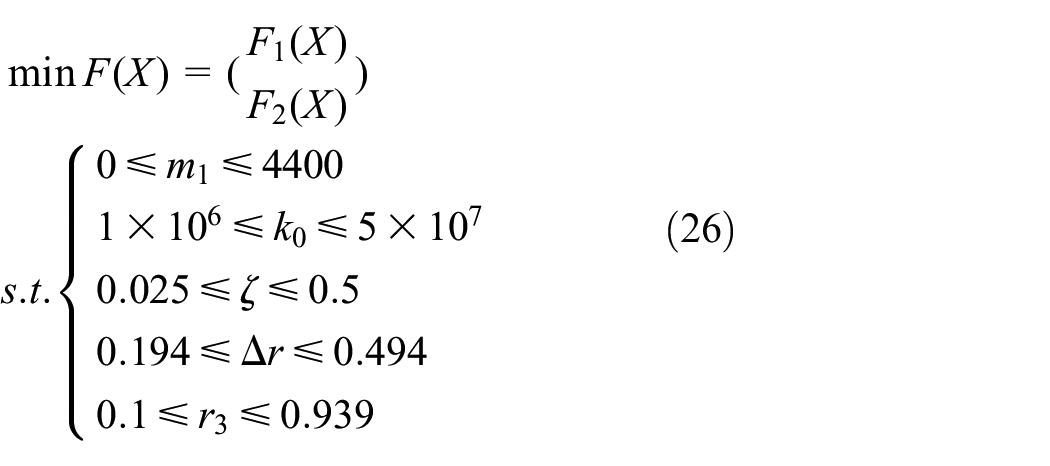
Structural optimization model based on excitation performance evaluation parameters
The structural parameter optimization model of the precision-controllable vibrator can be expressed as:
Solution to the optimization modelof the structure parameter of the precision-controllable vibrator
Optimization process
In this paper, the optimal solution set integrated with particle swarm algorithm and Pareto optimization logic is used to solve the precision-controlled vibrator excitation performance optimization problem, and its optimization process is shown in Figure 7.

The excitation performance optimization process of precision-controllable vibrator based on particle swarm optimization and Pareto optimization logic integration solution set.
Analysis of optimization results
Optimization model solving
The values of the control parameters used in the optimization model are: group size M = 50, learning factors c1, c2 = 1.494, initial inertia weight value Ω = 1, weight attenuation factor Ω d = 0.99, maximum number of iterations Tmax = 100, non-dominated solution file Library capacity N = 6, the number of grid divisions of the archive library Ngrid = 7, the archive expansion factor Nalpha = 0.1, the archive elimination factor Ngamma = 2, the dimension of the solution D = 5. 34
The upper and lower limits of each variable Xdmax and Xdmin have been determined in the optimization model, and the speed limit vdmax of each variable is determined by equation (26)

Under the conditions of the above parameters, the enhanced particle swarm algorithm is used to solve the Pareto optimal solution set of the dual-objective optimization of the excitation performance of the precision-controllable vibrator, and the optimization result shown in Figure 8.

Multi-objective optimization results.

The change range of the optimal solution.
The scattered points in Figure 8 are the Pareto frontier solutions for the optimization of the excitation performance parameters of the precision-controllable vibrator. Table 2 illustrates the value of the corresponding optimized variable X in the solution set, and group 0 in the table is the reference group.
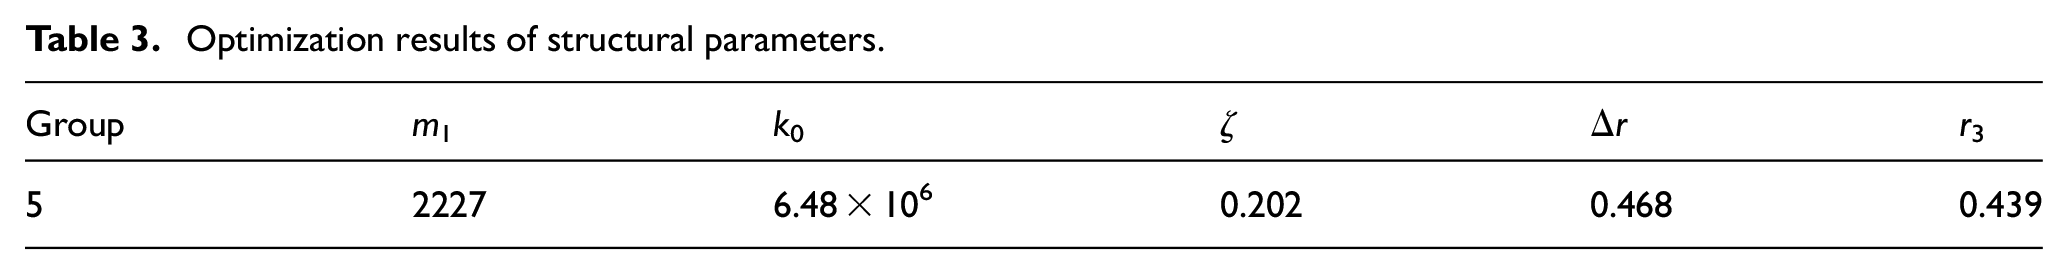
Optimization results of structural parameters.

Optimization results of structural parameters.
The results of each group of No. 1–6 are all the better solutions for the structural parameters that can enhance the excitation performance of the precision-controllable vibrator, and there is a non-dominated relationship between them. The last two columns of the table are the change amplitudes of each group solution relative to the reference group, expressed as a percentage, and a vertical line graph is drawn:
From the calculation results:
The range of reduction of phase difference of vibrator output signal is 28.2%–76.5%, and the range of increase of plate vibration amplitude is 55.3%–170%;
In order to enhance the excitation performance of the precision-controllable vibrator, it is very important to increase the vibration amplitude and reduce the phase difference. In this paper, the fifth group of structural parameters with a greater increase in plate amplitude and a greater decrease in phase difference is selected as the solution result.
Analysis of optimization results
The variation of the vibration amplitude Y and phase difference Δφ of the precision-controllable vibrator baseplate before and after optimization within a complete excitation period is shown in Figures10 and 11:

Baseplate vibration amplitude Y.

Phase difference Δφ.
It can be seen from the Table 4 that the amplitude of the baseplate during the entire excitation period of the optimized precision-controllable vibrator is 2.28 times of that before the enhancement, and the phase difference is only 42% of that before the enhancement. The optimization of the structure parameters of the precision-controllable vibrator with the enhanced particle swarm algorithm can effectively enhance the excitation performance.
Comparison of excitation performance evaluation parameters.

The enhancement of precision-controllable vibrator structure and comparison of excitation performance
Structure enhancement
According to the optimized structural parameters in Table 4, the following changes have been made to the vibrator structure:
1. The shape and size of the excitation force distribution are related to the shape of the contact part of the excitation box and the flat plate. According to the parameters of excitation force distribution before and after optimization, Δr is 0.294 m and 0.468 m respectively, and r3 is 0.379 m and 0.439 m, respectively, and the box is changed as shown in Figure 12.
2. According to the optimization results, the upper weight mL of the precision-controllable vibrator is reduced to 2227 kg. Therefore, part of the weight of the upper weight must be moved to the lower structure when the structure is enhanced. In order to achieve this goal, the model is enhanced as follows:
(1) The position of the vibration isolator is changed;
(2) Reduce the mass of the upper part to 2227 kg, and at the same time, ensure that the total mass remains unchanged at 7000 kg by adjusting the diameter of the column and the size of the baseplate;
3. The stiffness k0 before and after optimization of the vibration isolator is 1.3 × 10⁷ N/m and 6.48 × 10⁶ N/m, respectively, and the damping ratio ζ is 0.1 and 0.202.

Changes to the excitation box.

Change of top plate and vibration isolator.
Vibrator excitation performance optimization results
Baseplate vibration amplitude
Assuming that the average displacement of the central characteristic point of the excitation area at any time is
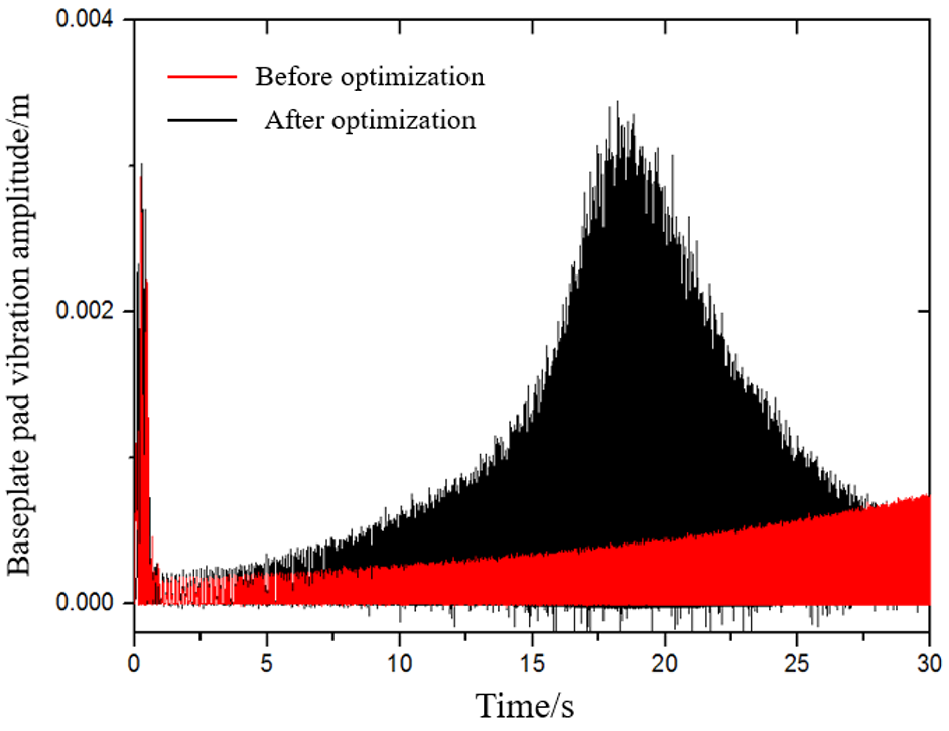
Vibration amplitude of characteristic points.
It can be seen from Figure 14 that the calculated results of the integration of the amplitude curve of the vibrator plate before and after the optimization are 0.00378 m and 0.00972 m, respectively. This shows that during the excitation period, optimization of the precision-controllable vibrator structure can significantly increase the amplitude of the plate and increase its output energy.
Baseplate vibration phase
As shown in Figure 15, the vibration displacement of the vibrator plate at the time when the excitation frequency is 10 and 30 Hz is extracted. The time interval between the vibration curve and the reference curve at each frequency point represents the phase difference between the output signal and the reference signal.

Ground vibration under different excitation frequencies: (a) 10 Hz and (b) 30 Hz.
It can be seen from Figure 15 that there is a certain phase difference between the precision-controllable vibrators before and after the optimization, and the specific value of the phase difference reduction is shown in Table 5:
Time interval of plate vibration at each frequency point.

It can be seen from Table 5 that under the action of the excitation force, there will always be a phase difference between the displacement curve and reference curve of baseplate vibration, resulting in the time interval which is negatively related to the frequency. After optimization, the time interval of the baseplate with 10 and 30 Hz is reduced by 39% and 67%, respectively. This indicates that optimizing the precision-controllable vibrator structure can significantly reduce the phase difference and improve the excitation performance.
Conclusion
This paper proposed the excitation performance evaluation parameters of the precision-controllable vibrator, and established a structural parameter optimization model. Based on the particle swarm algorithm and the logical solution set of the pareto model, the precision-controllable vibrator is optimized and the optimal structural parameters are obtained. The main conclusions are put forward:
The excitation performance of the precision-controllable vibrator can be characterized by ground force vibration amplitude and phase difference. The amplitude of the ground forced vibration is to judge the excitation performance by the total energy in a certain range below the vibrator, and it is positively correlated with the excitation performance. The phase difference is to judge the excitation of the vibrator by comparing the similarity between the input signal and the reference signal which is negatively related to the excitation performance of the vibrator.
The excitation force distribution parameters, the upper mass, the stiffness and damping of the vibration isolator can be used as the design variables of the precision-controllable vibrator optimization model. The optimal combination of particle swarm optimization and Pareto optimization is used as the structural parameters of the vibrator after optimization.
After adjusting structural parameters of vibrator according to optimization results, the amplitude of ground force generated by the vibrator increase, the phase difference between the input signal and reference signal decreases, and the excitation performance of the vibrator is significantly improved during the whole excitation period.
Footnotes
Handling Editor: James Baldwin
Declaration of conflicting interests
The author(s) declared no potential conflicts of interest with respect to the research, authorship, and/or publication of this article.
Funding
The author(s) received no financial support for the research, authorship, and/or publication of this article.