
Abstract
Objective
Dynamic changes in anatomic geometry of the inferior vena cava from changes in intravascular volume may cause passive stresses on inferior vena cava filters. In this study, we aim to quantify variability in inferior vena cava dimensions and anatomic orientation to determine how intravascular volume changes may impact complications of inferior vena cava filter placement, such as migration, tilting, perforation, and thrombosis.
Methods
Retrospective computed tomography measurements of major axis, minor axis, and horizontal diameters of the inferior vena cava at 1 and 5 cm below the lowest renal vein in 58 adult trauma patients in pre-resuscitative (hypovolemic) and post-resuscitative (euvolemic) states were assessed in a blinded fashion by two independent readers. Inferior vena cava perimeter, area, and volume were calculated and correlated with caval orientation.
Results
Mean volumes of the inferior vena cava segment on pre- and post-resuscitation scans were 9.0 cm3 and 11.0 cm3, respectively, with mean percentage increase of 48.6% (P < 0.001). At 1 cm and 5 cm below the lowest renal vein, the inferior vena cava expanded anisotropically, with the minor axis expanding by an average of 48.7% (P < 0.001) and 30.0% (P = 0.01), respectively, while the major axis changed by only 4.2% (P = 0.11) and 6.6% (P = 0.017), respectively. Cross-sectional area and perimeter at 1 cm below the lowest renal vein expanded by 61.6% (P < 0.001) and 10.7% (P < 0.01), respectively. At 5 cm below the lowest renal vein, the expansion of cross-sectional area and perimeter were 43.9% (P < 0.01) and 10.7% (P = 0.002), respectively. The major axis of the inferior vena cava was oriented in a left-anterior oblique position in all patients, averaging 20° from the horizontal plane. There was significant underestimation of inferior vena cava maximal diameter by horizontal measurement. In pre-resuscitation scans, at 1 cm and 5 cm below the lowest renal vein, the discrepancy between the horizontal and major axis diameter was 2.1 ± 1.2 mm (P < 0.001) and 1.7 ± 1.0 mm (P < 0.001), respectively, while post-resuscitation studies showed the same underestimation at 1 cm and 5 cm below the lowest renal vein to be 2.2 ± 1.2 mm (P < 0.01) and 1.9 ± 1.0 mm (P < 0.01), respectively.
Conclusions
There is significant anisotropic variability of infrarenal inferior vena cava geometry with significantly greater expansive and compressive forces in the minor axis. There can be significant volumetric changes in the inferior vena cava with associated perimeter changes but the major axis left-anterior oblique caval configuration is always maintained. These significant dynamic forces may impact inferior vena cava filter stability after implantation. The consistent major axis left-anterior oblique obliquity may lead to underestimation of the inferior vena cava diameter used in standard anteroposterior venography, which may influence initial filter selection.
Introduction
There has been an increase in the number of percutaneous inferior vena cava (IVC) filters placed for therapeutic and prophylactic purposes, particularly with the development of optional IVC filters. With an estimated 140,000 now placed worldwide annually, 1 IVC filters have been proven to be impactful in preventing the fatal consequences of venous thromboembolism (VTE). Yet, these filters have also been associated with various complications, such as IVC thrombosis, vascular perforation, device migration, and fracture.2–9 Additionally, their efficacy in prevention of pulmonary embolism depends on appropriate size dimensions as well as an optimal geometric orientation that may be altered with filter tilt.
When IVC filters are placed, the majority of these are deployed in the infrarenal IVC approximately 1 cm below the lowest renal vein (LRV)—a location subject to significant dynamic geometric changes from hemodynamic, volumetric, and external compressive forces. Intuition would suggest that these dynamic changes in IVC geometry may impact the device’s long term stability. While optional IVC filters are recommended to be removed once the period of VTE risk and vulnerability has passed, many are not removed. 10 Furthermore, although the devices are designed to be retrievable, retrieval can be difficult and is not always successful.10,11
Since many of these filters will remain in the patient indefinitely, it is prudent to better understand the hemodynamic and mechanical forces that they are subjected to. The longer the filters remain in place, the more likely that they may lead to the aforementioned complications.
Investigators have shown that the IVC undergoes marked dimensional changes secondary to variations in the respiratory cycle, changes in cardiac output, and blood volume status.12–15 However, the exact mechanism by which IVC dynamics play a role in filter complications is still poorly understood. Most studies evaluating IVC dynamics have been based on qualitative assessments of catheter-derived venography or ultrasonography.16–20
Although this has allowed a basic understanding that the IVC is a relatively malleable structure, the aim of this study is to evaluate the quantitative geometric dimensional changes of the IVC in response to intravascular volume variation in the setting of trauma. It is our aim that these quantitative assessments may provide additional insight into how dynamic changes in IVC geometry may influence the stability of IVC filters in this location.
Materials and methods
Patient selection
Patients 18 years or older, who presented to the University of California, Irvine Medical Center, a Level 1 Trauma Center, were entered prospectively into a database. In a 24 month period between July 2009 and June 2011, individuals who sustained severe blunt force injuries and had a trauma injury severity score (TISS) greater than or equal to 25 were selected from the database. From these patients, the study cohort was narrowed to patients who had contrast-enhanced abdominal computed tomography (CT) scans in a hypovolemic state within 1 h of presentation and a subsequent contrast-enhanced scan more than 6 h post-admission following volume-assumed resuscitation. Trauma patients are an ideal study cohort as a significant number of these patients had admission and repeat CT scans that could be examined as proxies for hypovolemic and euvolemic states, thus allowing quantitative assessment of IVC geometry changes following volume resuscitation. Patients who did not receive intravenous contrast-enhanced CT scans at either the initial CT scan or follow-up CT scan were excluded. Per protocol, all scans were performed with end-inspiratory breath holding whenever possible, which also is used to optimize the quality of imaging. All CT scans exceeding 5 mm slice thickness were excluded. The mechanism of injury, initial vital signs, time elapsed between comparative scans, and provided indications for the post-resuscitation CT scan were noted for each patient. The placement of an IVC filter was not a mandatory part of the inclusion criteria for this study. If more than two appropriate CT scans were obtained during the initial hospitalization, the scan most distant from the initial scan was deemed the post-resuscitation scan.
IVC measurements
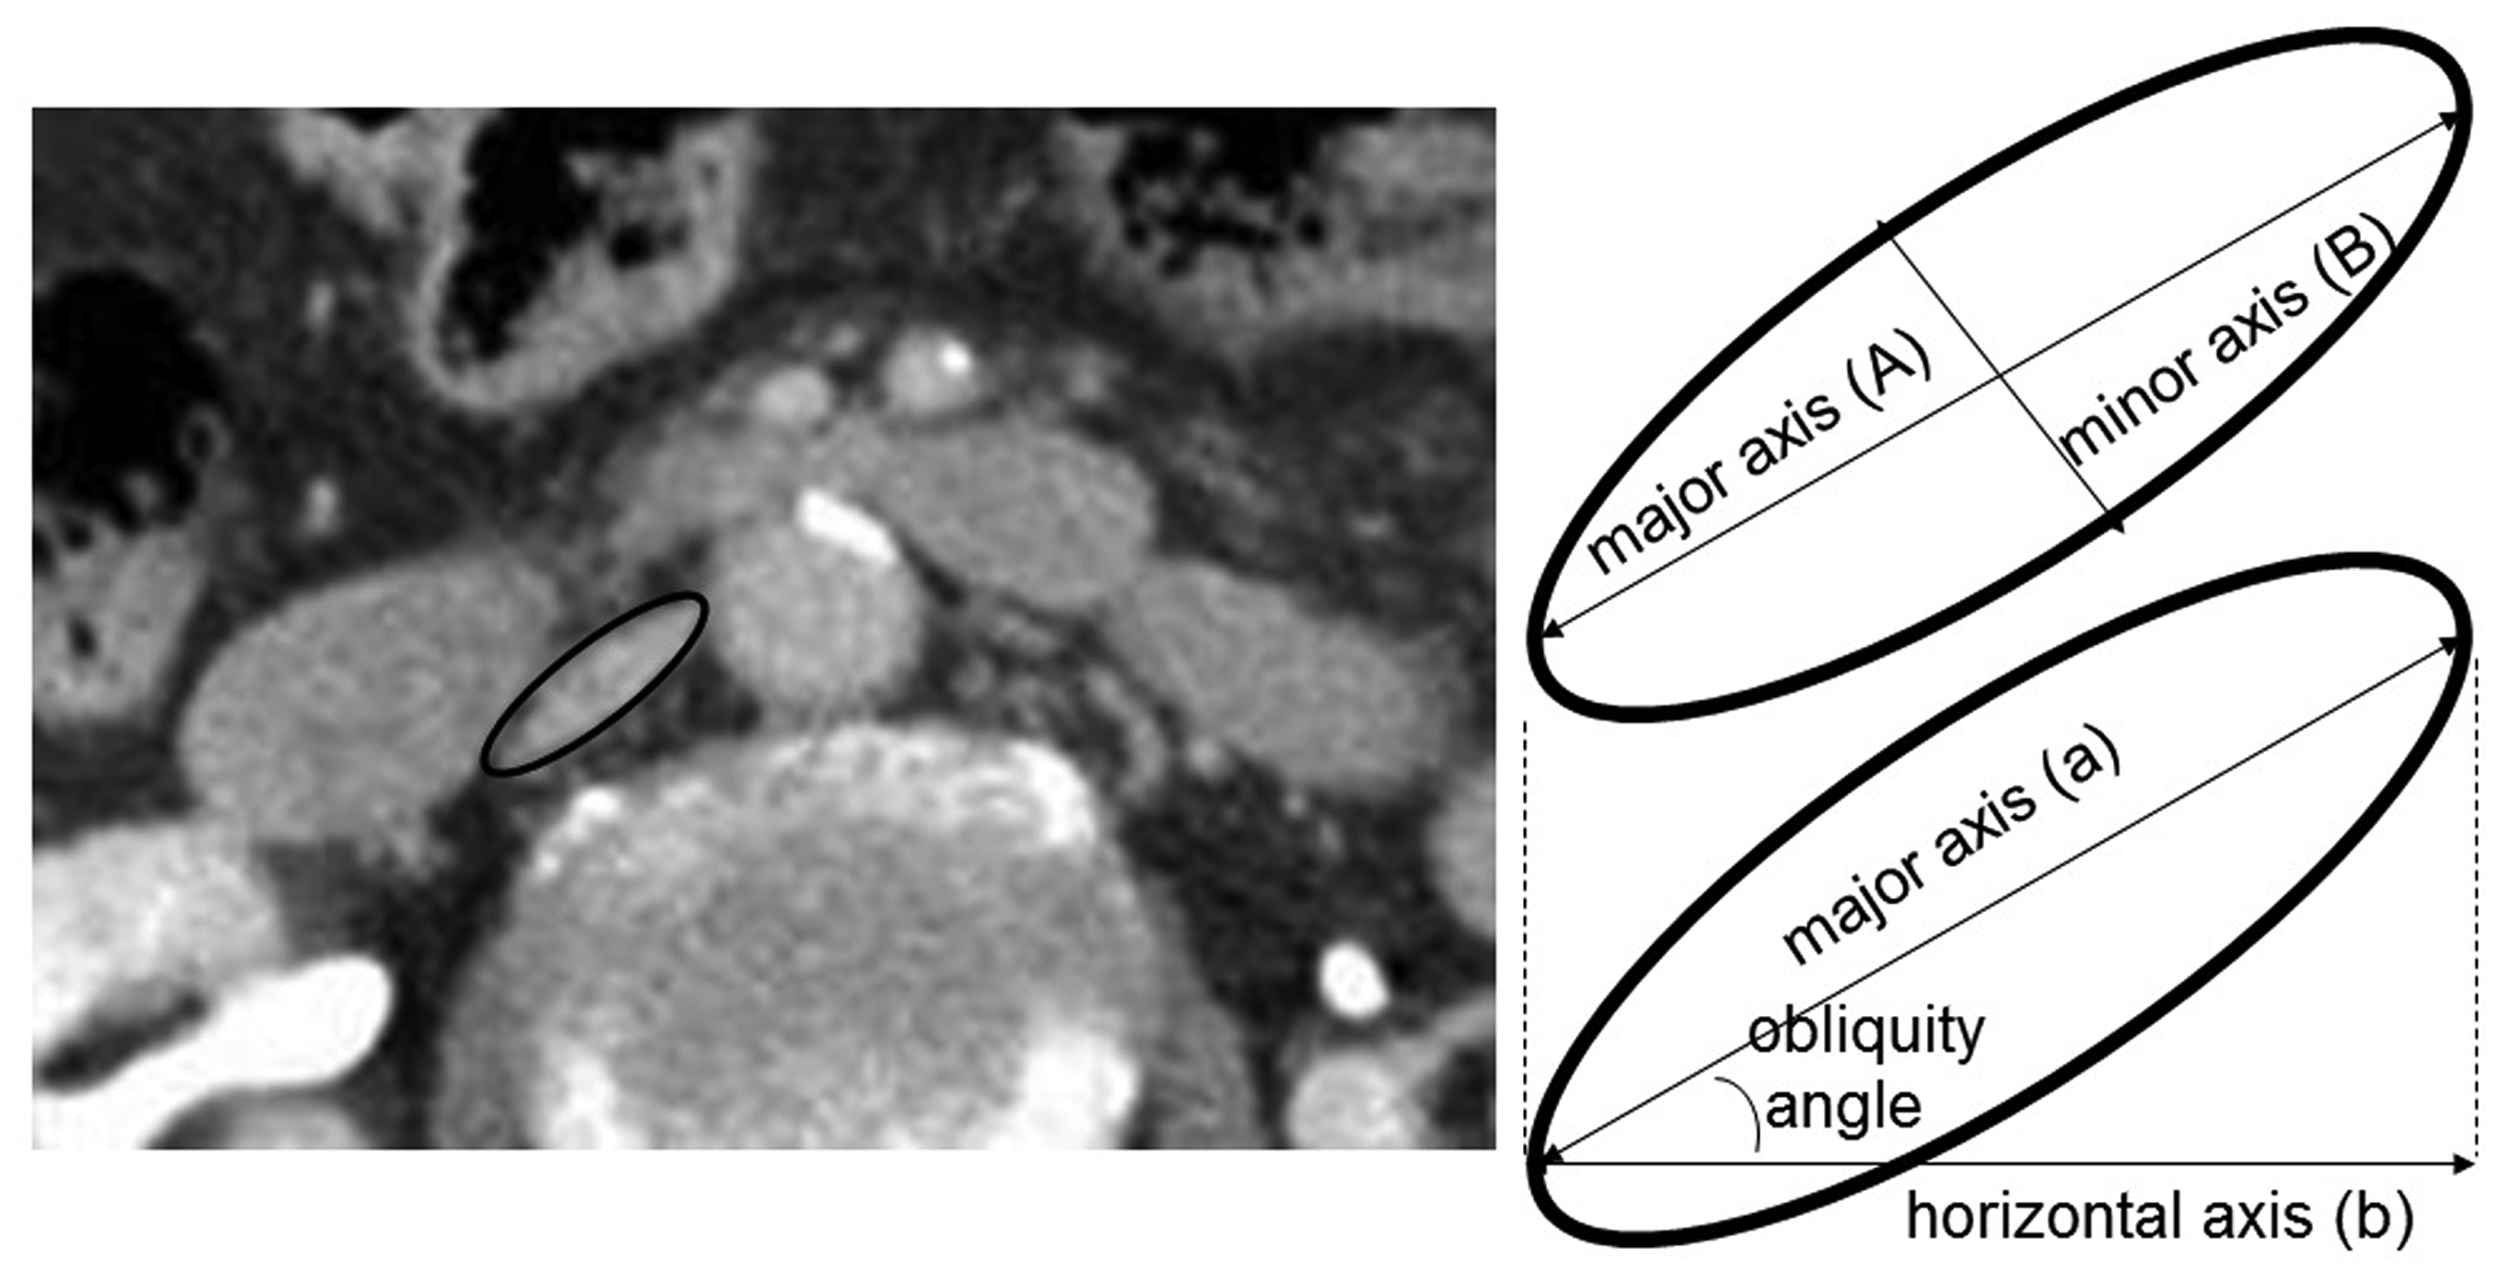
IVC dimensions were measured on images of contrast-enhanced CT scans, in the venous phase, using the AGFA PACS Imaging Software system (Agfa HealthCare Corp, Greenville, SC). IVC dimensions were measured at 1 and 5 cm below the LRV on axial images on both the admission pre-resuscitation and subsequent post-resuscitation CT scans for each patient (Figure 1). Measurements were taken at these IVC locations since they corresponded to the recommended location for placement of infrarenal caval filters by most manufacturers. The caval luminal borders were outlined and the cross-sectional areas (mm2) and perimeters (mm) were calculated on each of the two sequential axial CT images. The major axis/(maximal diameter) and the minor axis/(smallest diameter) were measured on orthonormal axial CT images (Figure 2). The volume of the infrarenal IVC between the two measured slices was then calculated under the assumption that the shape reflected that of a tapered elliptical cylinder, using Smalian’s formula (cm3): volume = (area 1 + area 2)/2 × length (Figure 3).
Coronal, sagittal, and axial sections demonstrating collapsed and resuscitated IVC states. Axial cuts were evaluated 1 and 5 cm below the level of the lowest renal vein in: (a) pre-resusciated and (b) resuscitated states. Schematic of IVC dimension measurements and obliquity assessment on magnified IVC: (A) major axis diameter corresponds to maximal diameter on orthonormal view and (B) minor axis represents minimal diameter. The angle between (a) and (b), the horizontal axis for the perfectly supine patient, demonstrates the obliquity of the IVC on that axial slice. Schematic of volume calculation based on measured IVC dimensions at 1 and 5 cm below the lowest renal vein. Volume of the segment of infrarenal IVC was calculated using Smalian’s equation for volume of a tapered elliptical cylinder: volume = (area 1 + area 2)/2 × length.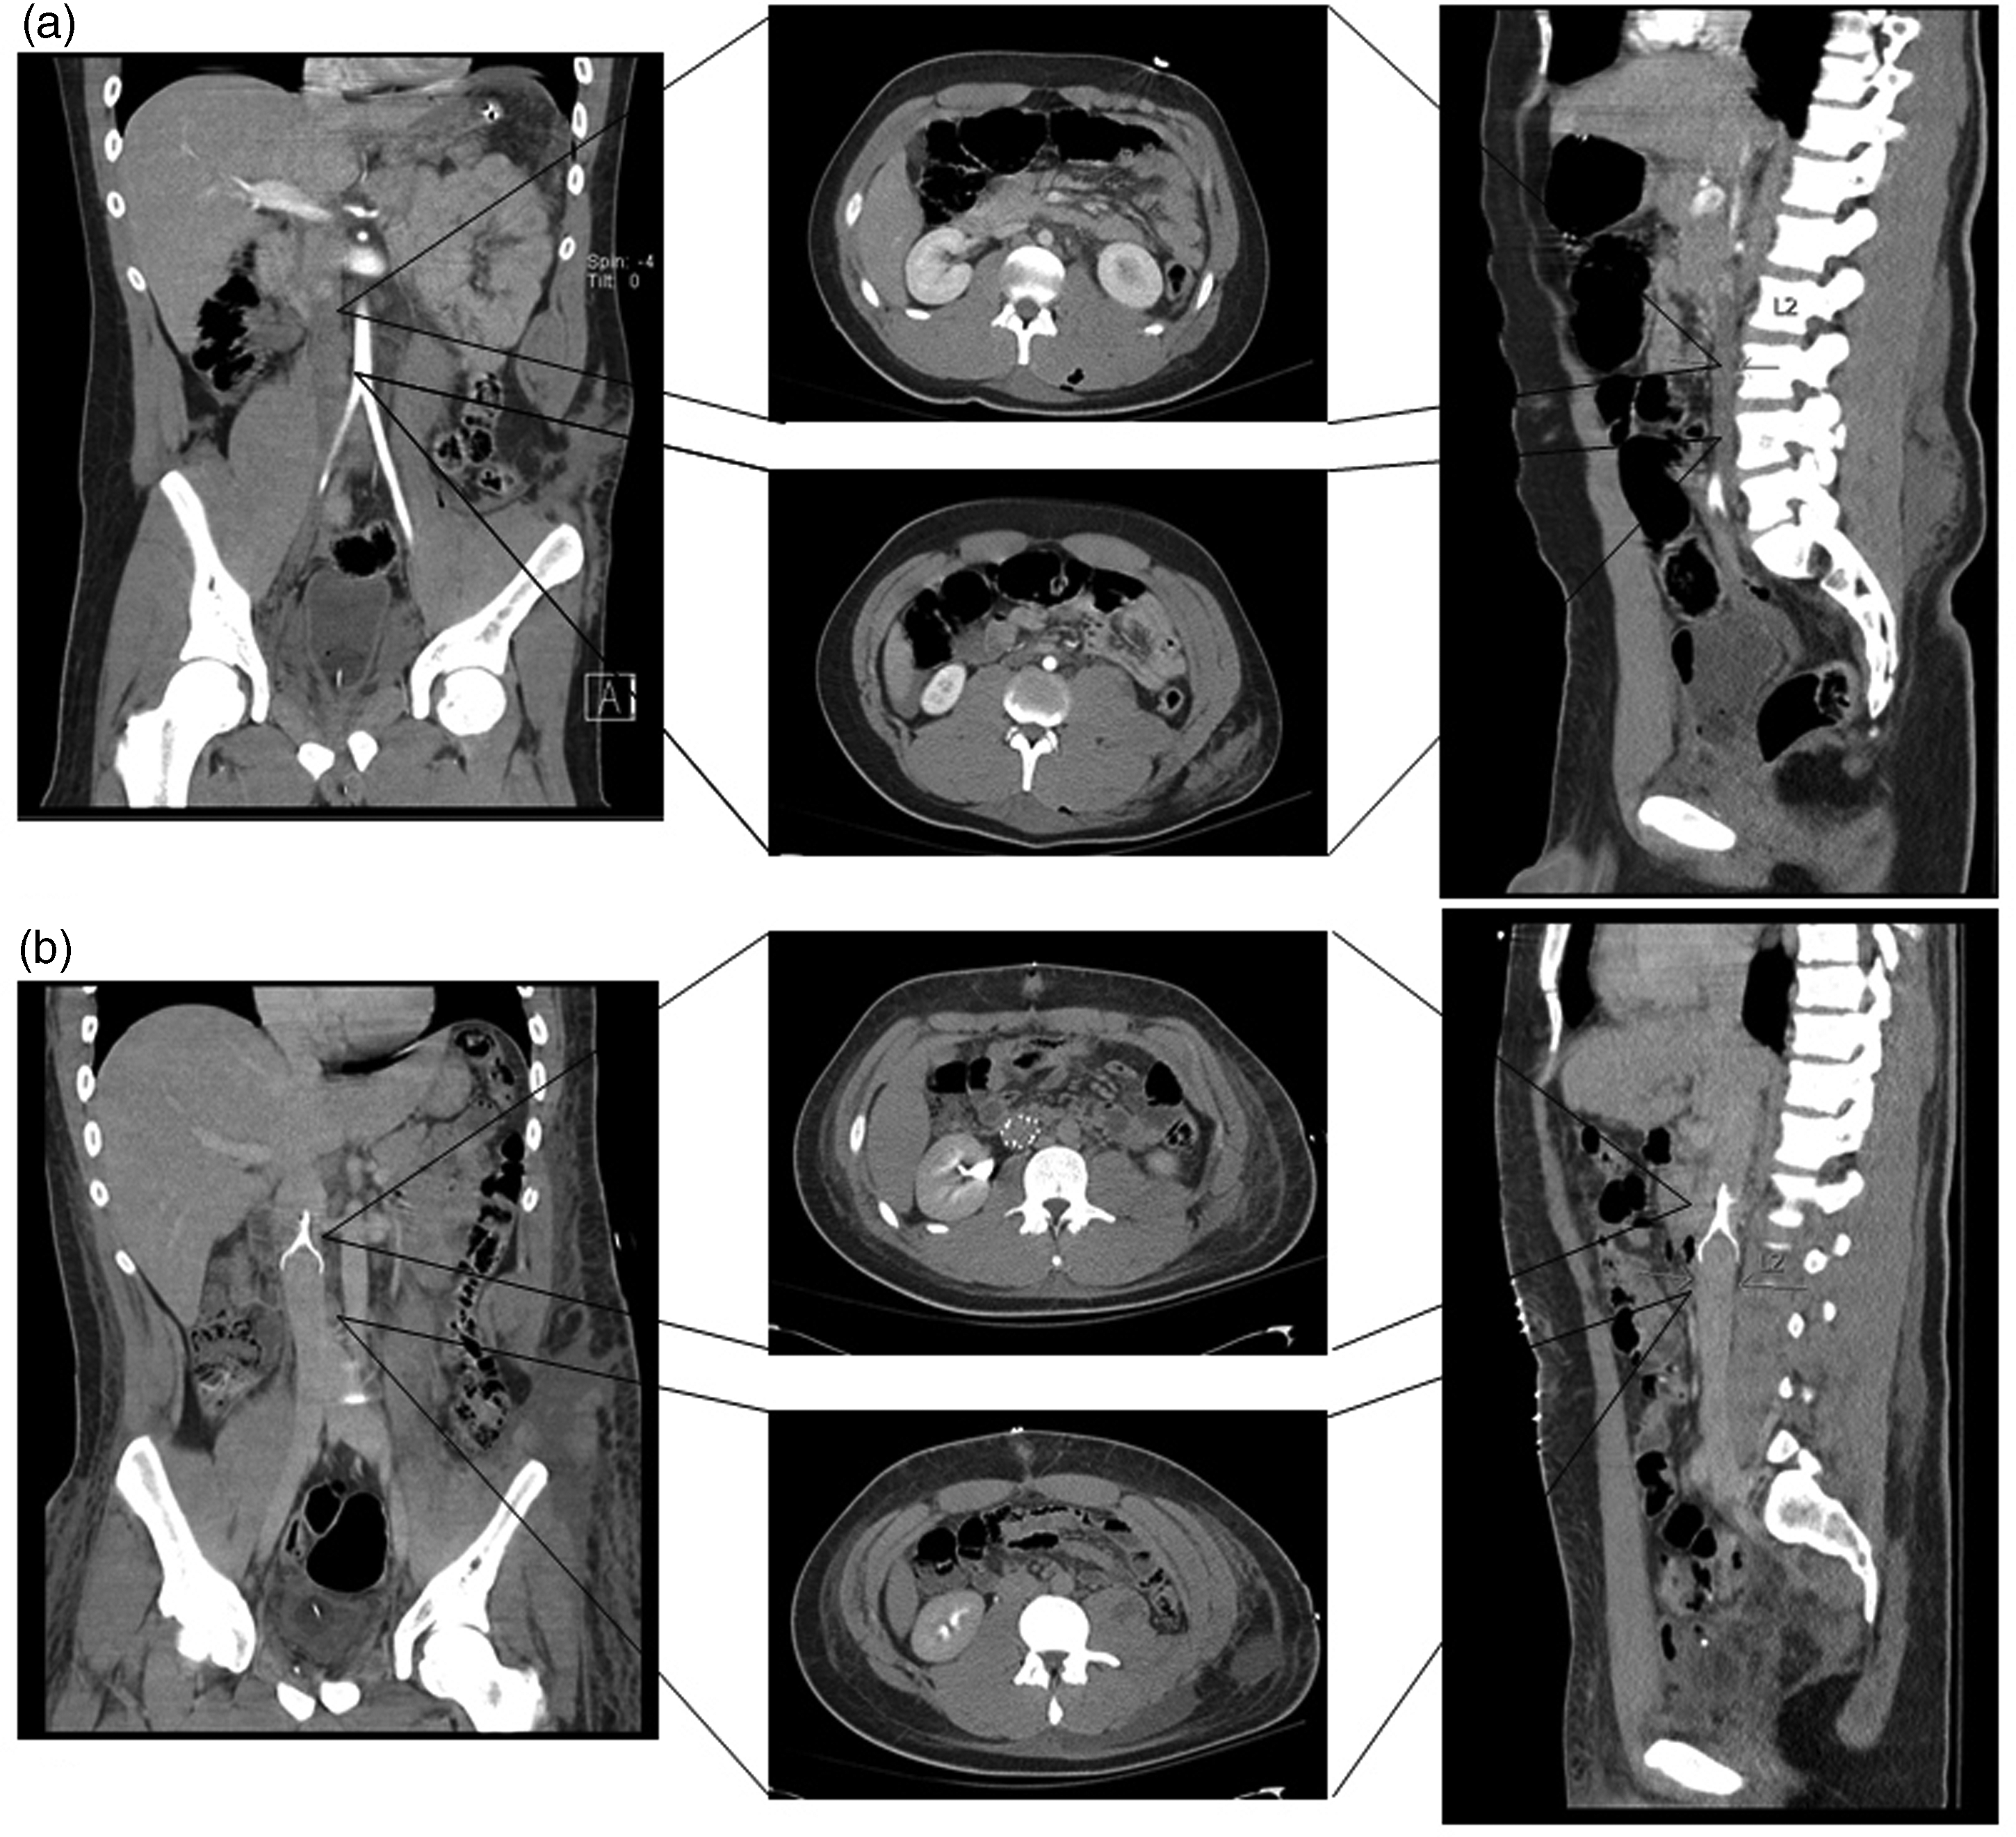

IVC orientation measurements
Orientation of the infrarenal IVC obliquity was determined by measuring the angle between the major axis and the horizontal axis on axial images (Figure 2). The maximal horizontal diameter corresponds with the standard anteroposterior projection seen with catheter-based fluoroscopic venography. The horizontal diameter on orthogonal views was then compared with the major axis diameter and the angle corrected orthonormal views to assess differences in actual maximal IVC diameter.
Statistics
All measurements from the CT images were independently reviewed by two experienced radiologists in a blinded fashion. Results of the measurements were expressed as the mean ± standard deviation. Changes in diameters, cross-sectional areas, perimeters, volume, and caval orientation between initial pre-resuscitation and subsequent post-resuscitation CT scans were evaluated using a Student t-test for paired data. Inter-observer precision was analyzed to ensure limited variation between independent observers. This was assessed by examining the mean ± standard deviation in the differences of measurements between the two blinded observers.
Results
Patient selection
Between July 2009 and June 2011, 2440 Level I trauma patients with blunt force trauma presented to the University of California Irvine Medical Center. Of these patients, a cohort of 58 patients presented with TISS ≥25, having received a contrast-enhanced abdominal CT scan within 1 h of admission and follow-up contrast-enhanced CT scan more than 6 h after admission in the period following intravenous fluid resuscitation. The mean TISS was 35.76 ± 10.69 (25–75). These patients were frequently hypotensive upon presentation (systolic blood pressure ≤95), with mean blood pressure of 118/63 and mean arterial pressure of 81. Further uniform quantification of these patients’ pre-resuscitated state was demonstrated by serum lactate levels, which were obtained on all patients. Mean serum lactate was 4.1 ± 2.2 mmol/l.
Mean time between the initial and subsequent CT scans was 5 days (range: 6 h–65 days). Mean patient age was 44.6 ± 18.5 (19–85) years. There were 38 males (65.6%) and 20 females (34.4%). Patients were not excluded based on reason for obtaining the follow-up CT scan. No patients evaluated during this time demonstrated any evidence of IVC duplication or agenesis. Furthermore, no patients had previous IVC filters placed prior to their trauma admission, nor was there any evidence of direct trauma to the IVC or renal veins.
IVC dimensional change
When comparing infrarenal IVC diameters in the pre- and post-resuscitation states, there was a significant change in diameter at both 1 and 5 cm below the LRV. The IVC diameter expansion was predominantly in the minor axis, where the mean percent change in diameter at 1 and 5 cm below the LRV was 48.7% (P < 0.001) and 30.0% (P = 0.01), respectively (Table 1). In the most extreme cases, the minor axis diameter in the resuscitated state increased by nearly 4.5-fold. The largest minor diameter change was 18.5 mm at 1 cm below the LRV and 15.9 mm at 5 cm below the LRV. Of the 58 patients, 8 patients showed at least doubling of the IVC diameter in the minor axis at 1 or 5 cm below the LRV. By comparison, the major axis diameters were relatively stable, with 4.2% (P = 0.11) and 6.6% (P = 0.017) mean diameter changes in comparing pre- and post-resuscitation states at 1 cm and 5 cm below the LRV, respectively (Figure 4).
Demonstration of perimeter, surface area, minor axis diameter (A), and major axis diameter (B) in: (a) preresuscitated state 1 cm below LRV, (b) post-resuscitated state 1 cm below LRV, (c) pre-resuscitated state 5 cm below LRV, and (d) post-resuscitated state 5 cm below LRV. While there is modest major axis expansion, the >4.5-fold expansion occurs preferentially in the minor axis. Displayed are IVC dimensions with mean ± standard deviation and complete range for minor and major axes diameters, surface areas, and perimeters 1 and 5 cm below the LRV on pre-resuscitation admission CT scans and post-resuscitation follow-up CT scans. The mean changes and aggregate percentage change are also displayed as is, whether or not these changes were statistically significant. Calculated segmental IVC volumes between 1 and 5 cm below the LRV are also displayed, which highlights a statistically significant volumetric expansion of the IVC. IVC: inferior vena cava; CT: computed tomography; LRV: lowest renal vein.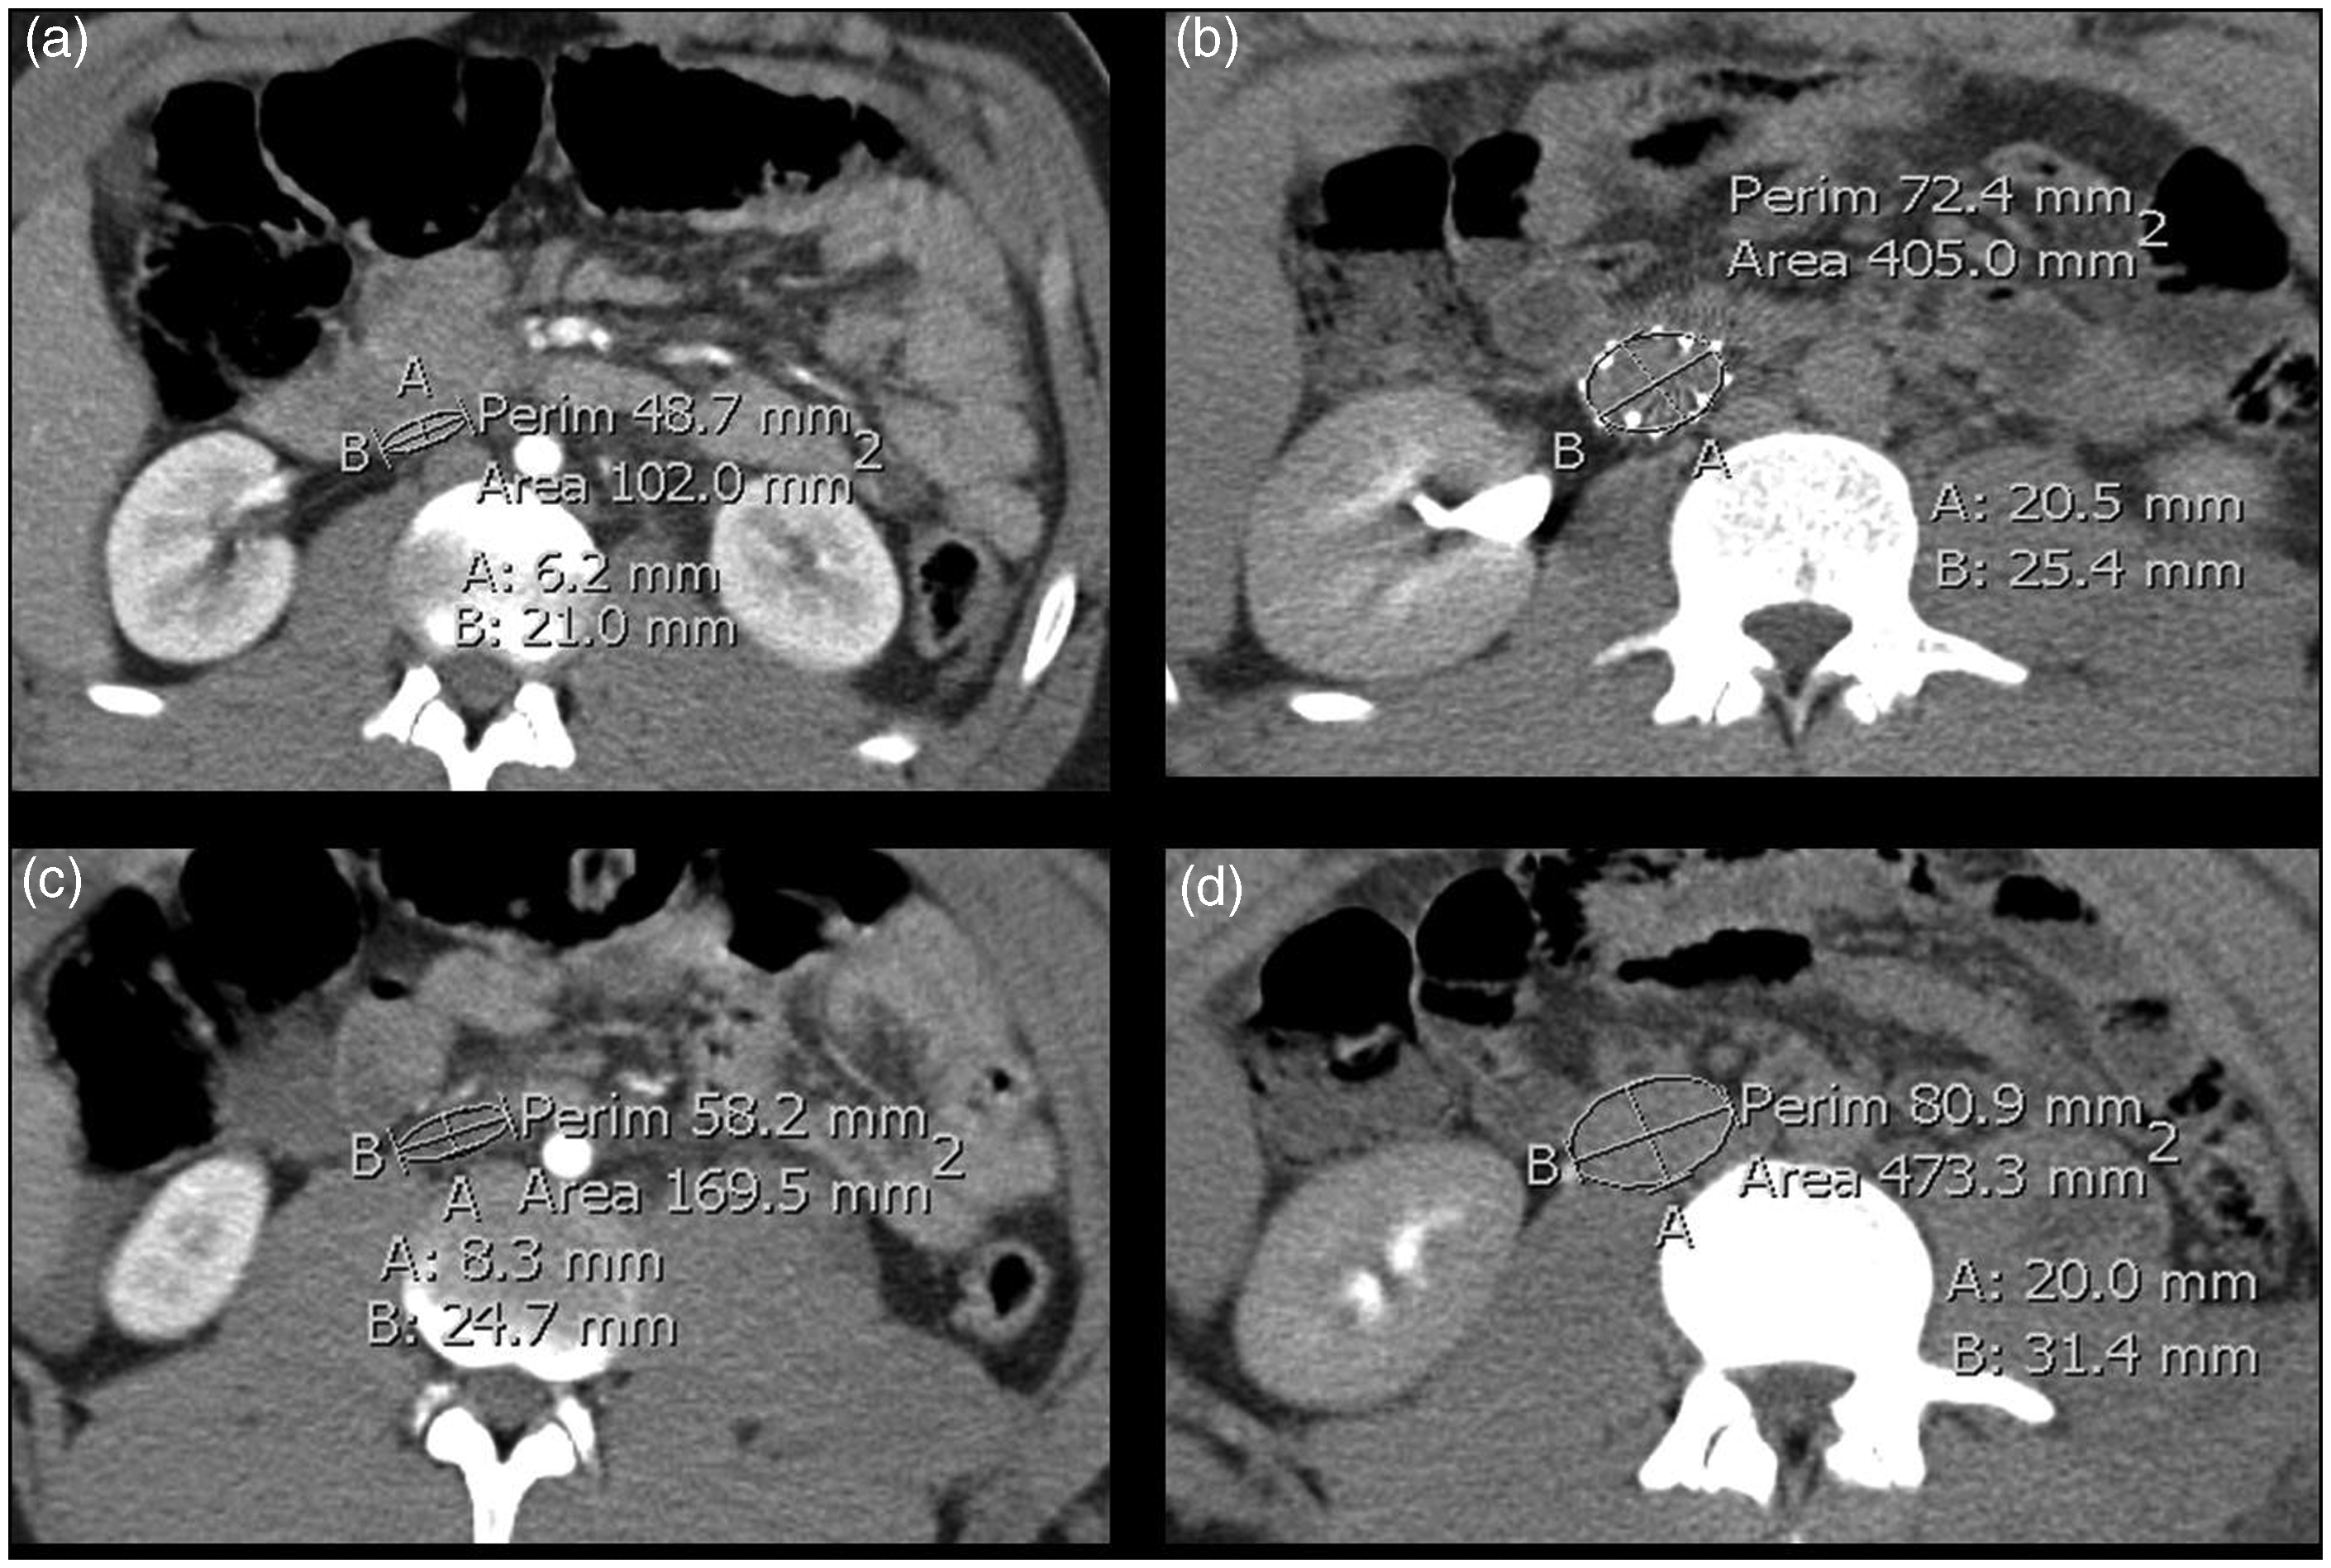
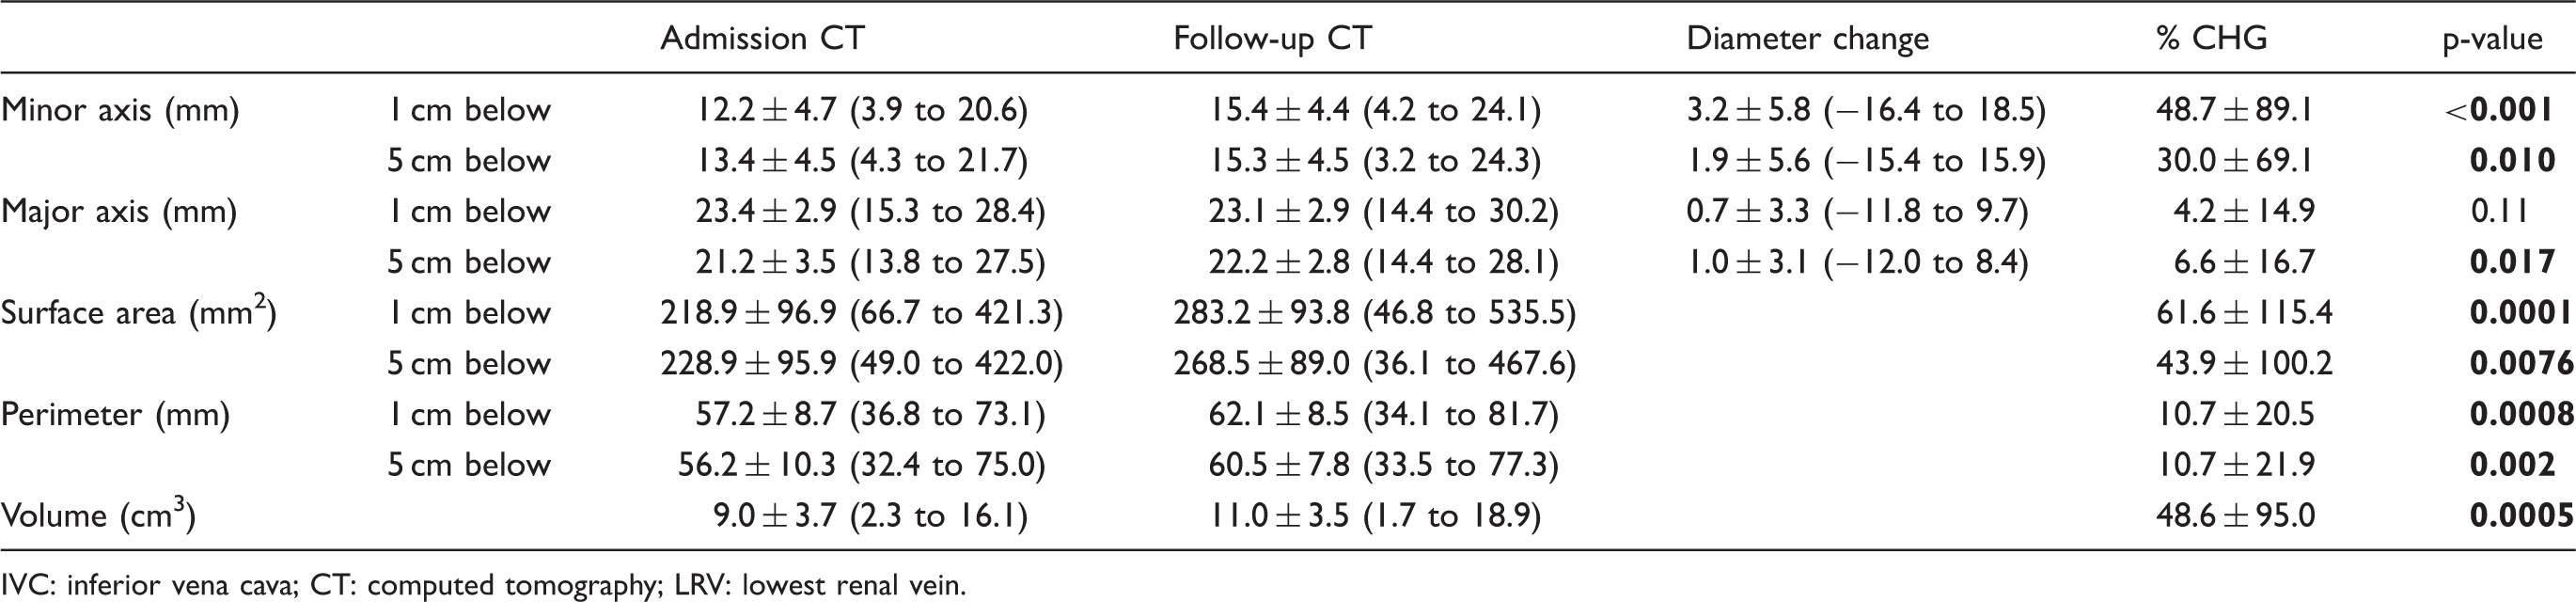
Cross-sectional area and caval perimeter measurements at 1 cm below the LRV expanded by 64.3 mm2 (or 61.6%, P < 0.001) and 4.9 mm (or 10.7%, P < 0.01), respectively. At 5 cm below the LRV, the expansion of cross-sectional area and perimeter measurements were 39.6 mm2 (or 43.9%, P < 0.01) and 4.3 mm (or 10.7%, P = 0.002), respectively.
By calculation using Smalian’s formula, the mean IVC volume between 1 and 5 cm below the LRV on admission pre-resuscitation CT scans was 9.0 ± 3.7 cm3. Following volume resuscitation, the mean IVC volume in this segment was 11.0 ± 3.5 cm3, yielding a mean 48.6% increase in volume (P < 0.001). It is important to note that this mean percentage change in IVC volume is a different entity than the averaged measurements between the mean pre- and post-resuscitation volumes (22.2%). The 48.6% directly reflects the mean of the percentage of volume change for each of the 58 patients, which is distinct due to the variability of initial IVC dimensions. The inter-observer differences were minimal, with the mean difference in calculated volumes for the pre-resuscitation scans being 0.7 ± 1.6 cm3 and post-resuscitation scans of 1.0 ± 1.6.
Caval orientation
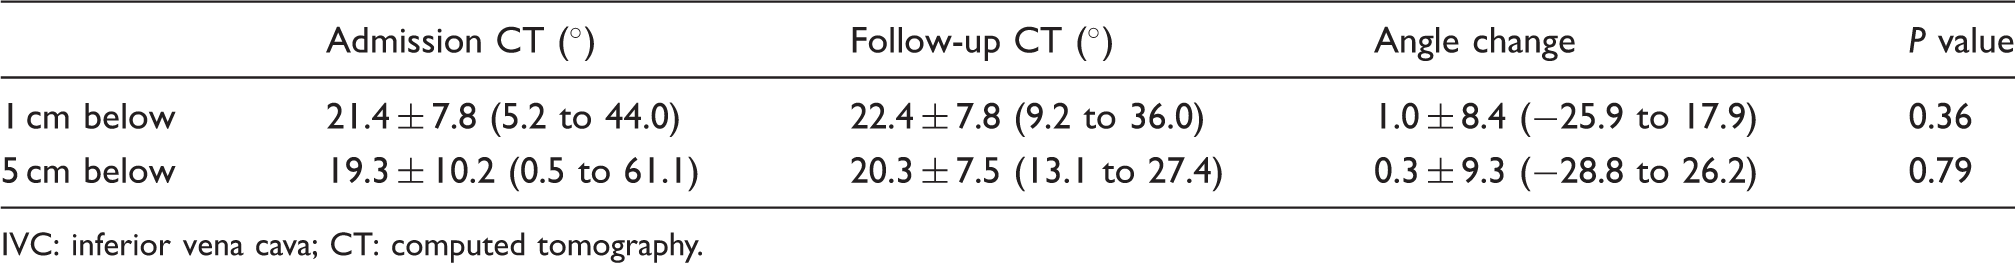
The IVC was consistently ovoid, with its major axis in a left-anterior oblique (LAO) configuration in all study patients. The mean obliquity off the horizontal orientation was 21.4° at 1 cm and 19.3° at 5 cm below the LRV on the initial pre-resuscitation CT scans (Table 2). In the subsequent post-resuscitation scans, the angle off the horizontal orientation measured 22.4° and 20.3° at 1 cm and 5 cm below the LRV, respectively. Secondary to this consistent obliquity, there was a significant difference and underestimation of the IVC maximal diameter using the horizontal measurement (Table 3). In the hypovolemic pre-resuscitation CT scans, the discrepancy between the horizontal and major axes diameter was 2.1 ± 1.2 mm (P < 0.001) and 1.7 ± 1.0 mm (P < 0.001) at 1 cm and 5 cm below the LRV, respectively. The post-resuscitation CT also showed significant underestimation at 1 cm and 5 cm below the LRV, measuring 2.2 ± 1.2 mm (P < 0.01) and 1.9 ± 1.0 mm (P < 0.01), respectively (Figure 5).
Demonstration of underestimation of true maximal diameter of IVC by horizontal/venographic caval diameter and measurement of LAO angulation differences on CT. Axial CT images from a patient following trauma show that the true maximum diameter of IVC (B) is greater than the venographic diameter (C) in pre- and post-resuscitated CT abdomen at (a,b) 1 cm and (c,d) 5 cm below LRV, respectively. Note the obliquity angle of IVC is smaller on (a) pre-resuscitation compared with (b) post-resuscitation images. Mean ± standard deviation angulation of the major axis versus horizontal axix. While there is significant range in angulation, there is no statistically significant change in obliquity of the IVC from pre-resuscitation admission CT scans to post-resuscitation follow-up CT scans. IVC: inferior vena cava; CT: computed tomography. Maximal IVC diameter as seen on CT as major axis diameter compared with antero-posterior venography IVC diameter depicted as horizontal diameter on CT demonstrates statistically significant underestimation of the maximal IVC diameter when using the horizontal diameter for IVC filter sizing. IVC: inferior vena cava; CT: computed tomography.

Discussion
This study demonstrates that there is significant volumetric expansion in the infrarenal IVC in blunt force trauma patients following initial resuscitation. There is significant anisotropic variability of the infrarenal IVC geometry, with substantially greater expansive and compressive forces in the minor axis. While the compressive and expansile variability in the minor axis is known to exist with the normal respiratory and cardiac cycles, we demonstrate that minor axis expansion is much more pronounced following intravascular volume administration, as viewed in the post-resuscitation CT scans. In the most extreme case in our study, IVC volume change was in excess of 500%, with an associated 400% change in minor axis diameter. Notably, while none of the patients in our study had a pre-existing IVC filter prior to their trauma presentation, six patients had IVC filters placed between their two serial scans. The expansile and compressive capability of the IVC was not hindered by the placement of the filter, with an average two-fold increase in volume.
The IVC is also characteristically an ovoid shape with the major axis oriented in an approximate 20° LAO configuration. The inherently low pressure of the venous system likely accounts for the oval shape of the IVC compared with the high-pressure arterial system. This consistent LAO configuration leads to significantly higher maximal diameter of the IVC compared with what would be observed on antero-posterior imaging. Obliquity in aggregate did not change significantly between initial and resuscitated states, although the angulation was frequently more LAO 1 cm below the LRV as compared to the more caudal measurement.
While the IVC is subjected to much lower pressures and less pulsatility compared with the arterial system, the highly compliant wall of the IVC allows for marked dynamic changes in size and geometry in response to changes in intravascular blood volume. Rarely, this may even lead to the IVC becoming larger than 30 mm in true diameter, as is seen in 2% of our patients. This consideration is important in regards to sizing of IVC filters, due to potential for migration, tilting, or other complications.
Relative changes in IVC volume can occur with normal respiratory activity and with Valsalva maneuvers. During normal respiratory inspiration, the negative intrathoracic pressure increases venous return into the thoracic cavity and causes partial collapse of the IVC. Conversely, during expiration, the positive intrathoracic pressure reduces blood flow into the thoracic cavity that results in subdiaphragmatic IVC expansion from relative increase in caval blood volume. This relative increase in caval volume is further increased with Valsalva maneuvers.17,20
Absolute changes in intravascular volume can have similar significant impact on the caliber and dynamics of the IVC. As we demonstrate, the caliber of the IVC can collapse markedly in situations of decreased circulating blood volume, which may result from hemorrhagic shock, marked dehydration, and severe sepsis. Conversely, IVC expansion may occur from increase in circulating blood volume, as may be observed in patients with renal failure, blood product or intravenous infusions, or decompensated heart failure. Multiple studies have shown that hemodynamic state impacts IVC diameter, irrespective of imaging modality.19,20
Murphy et al. 21 previously demonstrated the effects of intravascular volume changes on the geometry and spatial orientation of the IVC in trauma patients subjected to post-traumatic fluid resuscitation. This study replicates much of this previously examined phenomenon but was performed with the objective of examining a much larger cohort of trauma patients and to validate previous findings with particular attention placed on quantitative volumetric IVC expansile dynamics. This, in turn, may offer additional insight into the dynamic forces placed on IVC filters that lead to the complications reported.
Although the dimensional changes are significant, there are likely additional factors that influence the stability of filters positioned in the infrarenal IVC. These may include direct anatomic forces placed on the IVC, such as compression from descent of the diaphragm during inspiration, and may be even more forceful with Valsalva maneuvers. Similarly, cases of abdominal compartment syndrome with generalized abdominal hypertension may also cause compressive force on the venous system. This may be further exacerbated when there is intravascular volume depletion. Additionally, just as both angiographic and duplex ultrasound studies have demonstrated changes in IVC dimensions with respiratory and cardiac cycle changes, the IVC could also very well be affected by erect versus supine positioning. This is not addressed in our study; however, further study to evaluate if there is even greater variability in IVC dimensions with deep reverse trendelenburg or erect positioning may be useful.
Grant et al. 20 had previously studied 25 normal volunteers using dynamic ultrasound scanning of their IVCs to examine the changes in caval luminal distension during various phases of respiration and with Valsalva maneuvers. Optimal distension and visualization of the IVC were achieved after simple breath holding or at end expiration. In compliance with these findings, all patients subjected to the trauma CT scans were performed with breath holding, whenever possible, to optimize the quality of images.
The consistent 20° LAO obliquity may lead to underestimation of the IVC diameter used in standard anteroposterior venography and may influence initial filter selection. Anteroposterior venography has become very useful in delineating the renal veins and real-time positioning of the IVC filter for deployment; however, it may underestimate the IVC diameter. It is these authors’ request that the reader remember to account for this obliquity and size discrepancy prior to any filter deployment.
The limitations of this study begin with its retrospective nature. As such, selection bias and dependence on historical chart information recorded by multiple practitioners are disadvantageous. Additionally, volume status in both the pre- and post-resuscitation patient are theorized. It is reasonable to believe that a patient with a TISS score >25 will be hypovolemic; however, there is no quantifiable data in this study to support this remark. While we were unable to assess as detailed volume status information as we might have liked with central venous pressures or resuscitation measures at the time of the post-resuscitation CT, the time lapse and volumetric expansion of the IVC far outweighing what might be expected from normal physiologic variability provided confidence in the impact of volume resuscitation. Another limitation is the limited sample size of patients. Of all blunt force trauma patients presenting to our trauma center over 24 months, we captured 2.4% for our study. This largely stemmed from decreased frequency of follow-up CT scans. Although all records kept were reviewed over a 24 month period, a change in CT scanners at our institution with improved resolution and the requirement in our study design to only evaluate CT scans with 5 mm slice thickness or less precluded us from examining more. This did not hinder us from achieving statistically significant data, however. Finally, in this study, we were unable to realistically validate our CT image review with any type of anatomic study. We would like to believe that our radiographic evaluation using thin-slice contrast-enhanced CT represents the true dimensions and variation in real time; however, there remains the possibility that CT inadequately reproduces true real-time IVC luminal geometry and could impact the accuracy of our measurements.
In conclusion, there is marked anisotropic variability of the infrarenal IVC geometry with significantly greater expansive and compressive forces in the minor axis attributable to changes in intravascular volume. These forces are likely to impact IVC filter stability and may lead to complications. The significant cross-sectional area and volumetric changes in the IVC following volume resuscitation relative to the less dramatic perimeter changes may be explained by the elliptical shape of the collapsed IVC in the hypovolemic state and LAO caval orientation that is preserved irrespective of volume status. Taken together, these findings highlight the importance of considering physiologic geometrical descriptors in addition to traditional radiographic measures to more accurately assess vessel caliber, particularly for procedural purposes to ultimately prevent complications.
Footnotes
Conflict of interest
None declared.
Funding
This research received no specific grant from any funding agency in the public, commercial, or not-for-profit sectors.