
Abstract
Purpose:
To compare postoperative morphological and rheological conditions after eversion carotid endarterectomy versus conventional carotid endarterectomy using computational fluid dynamics.
Basic methods:
Hemodynamic metrics (velocity, wall shear stress, time-averaged wall shear stress and temporal gradient wall shear stress) in the carotid arteries were simulated in one patient after conventional carotid endarterectomy and one patient after eversion carotid endarterectomy by computational fluid dynamics analysis based on patient specific data.
Principal findings:
Systolic peak of the eversion carotid endarterectomy model showed a gradually decreased pressure along the stream path, the conventional carotid endarterectomy model revealed high pressure (about 180 Pa) at the carotid bulb. Regions of low wall shear stress in the conventional carotid endarterectomy model were much larger than that in the eversion carotid endarterectomy model and with lower time-averaged wall shear stress values (conventional carotid endarterectomy: 0.03–5.46 Pa vs. eversion carotid endarterectomy: 0.12–5.22 Pa).
Conclusions:
Computational fluid dynamics after conventional carotid endarterectomy and eversion carotid endarterectomy disclosed differences in hemodynamic patterns. Larger studies are necessary to assess whether these differences are consistent and might explain different rates of restenosis in both techniques.
Keywords
Introduction
Conventional carotid endarterectomy (C-CEA) with patch-angioplasty and eversion carotid endarterectomy (E-CEA) are reconstructive techniques in the surgical treatment of extracranial carotid artery stenosis. C-CEA with patch angioplasty is performed through a longitudinal arteriotomy of the internal and common carotid artery and is the most frequently employed endarterectomy technique. Whereas in E-CEA, the internal carotid artery (ICA) is completely transected at its origin at the carotid bifurcation, as initially described by DeBakey.1,2 These differences in the surgical approach lead to changes in the postoperative morphology and possibly rheology of patients treated by C-CEA compared to E-CEA.
The incidence of restenosis after CEA due to extracranial carotid artery disease ranges from 1% to 41%,3–10 depending on operative technique, severity of stenosis and the length of follow-up. The importance of restenosis as a cause of subsequent neurological events is not well established.11–18 However, a subanalysis of the Carotid Revascularization Endarterectomy versus Stenting Trial (CREST) revealed that patients with carotid restenosis within 2 years had a higher risk of ipsilateral stroke than those without. 19 Metaanalyses of restenosis rates after C-CEA and E-CEA report lower restenosis rates after E-CEA.20,21
In recent years, computational fluid dynamics (CFD) have become an accepted technique for investigating flow alterations in anatomical correct models in carotid artery disease and assessment of rheological conditions comparing different operative techniques.22–29 To the best of our knowledge, there has yet not been a CFD comparison between the postoperative morphologic and flow conditions in patients after C-CEA versus E-CEA.
The purpose of this pilot study was to gain insights into the mechanisms of initiation and formation of restenosis after C-CEA and E-CEA by investigating the technique-specific hemodynamic metrics with CFD.
Methods
Patient A, a 71-year-old male patient with asymptomatic carotid artery stenosis underwent C-CEA with patch-angioplasty. Patient B, a 75-year-old male patient with symptomatic carotid artery stenosis underwent E-CEA. An intraoperatively performed angiography of the reconstructed carotid artery showed an unremarkable morphological result without signs of residual stenosis, thrombus or dissection in both patients.
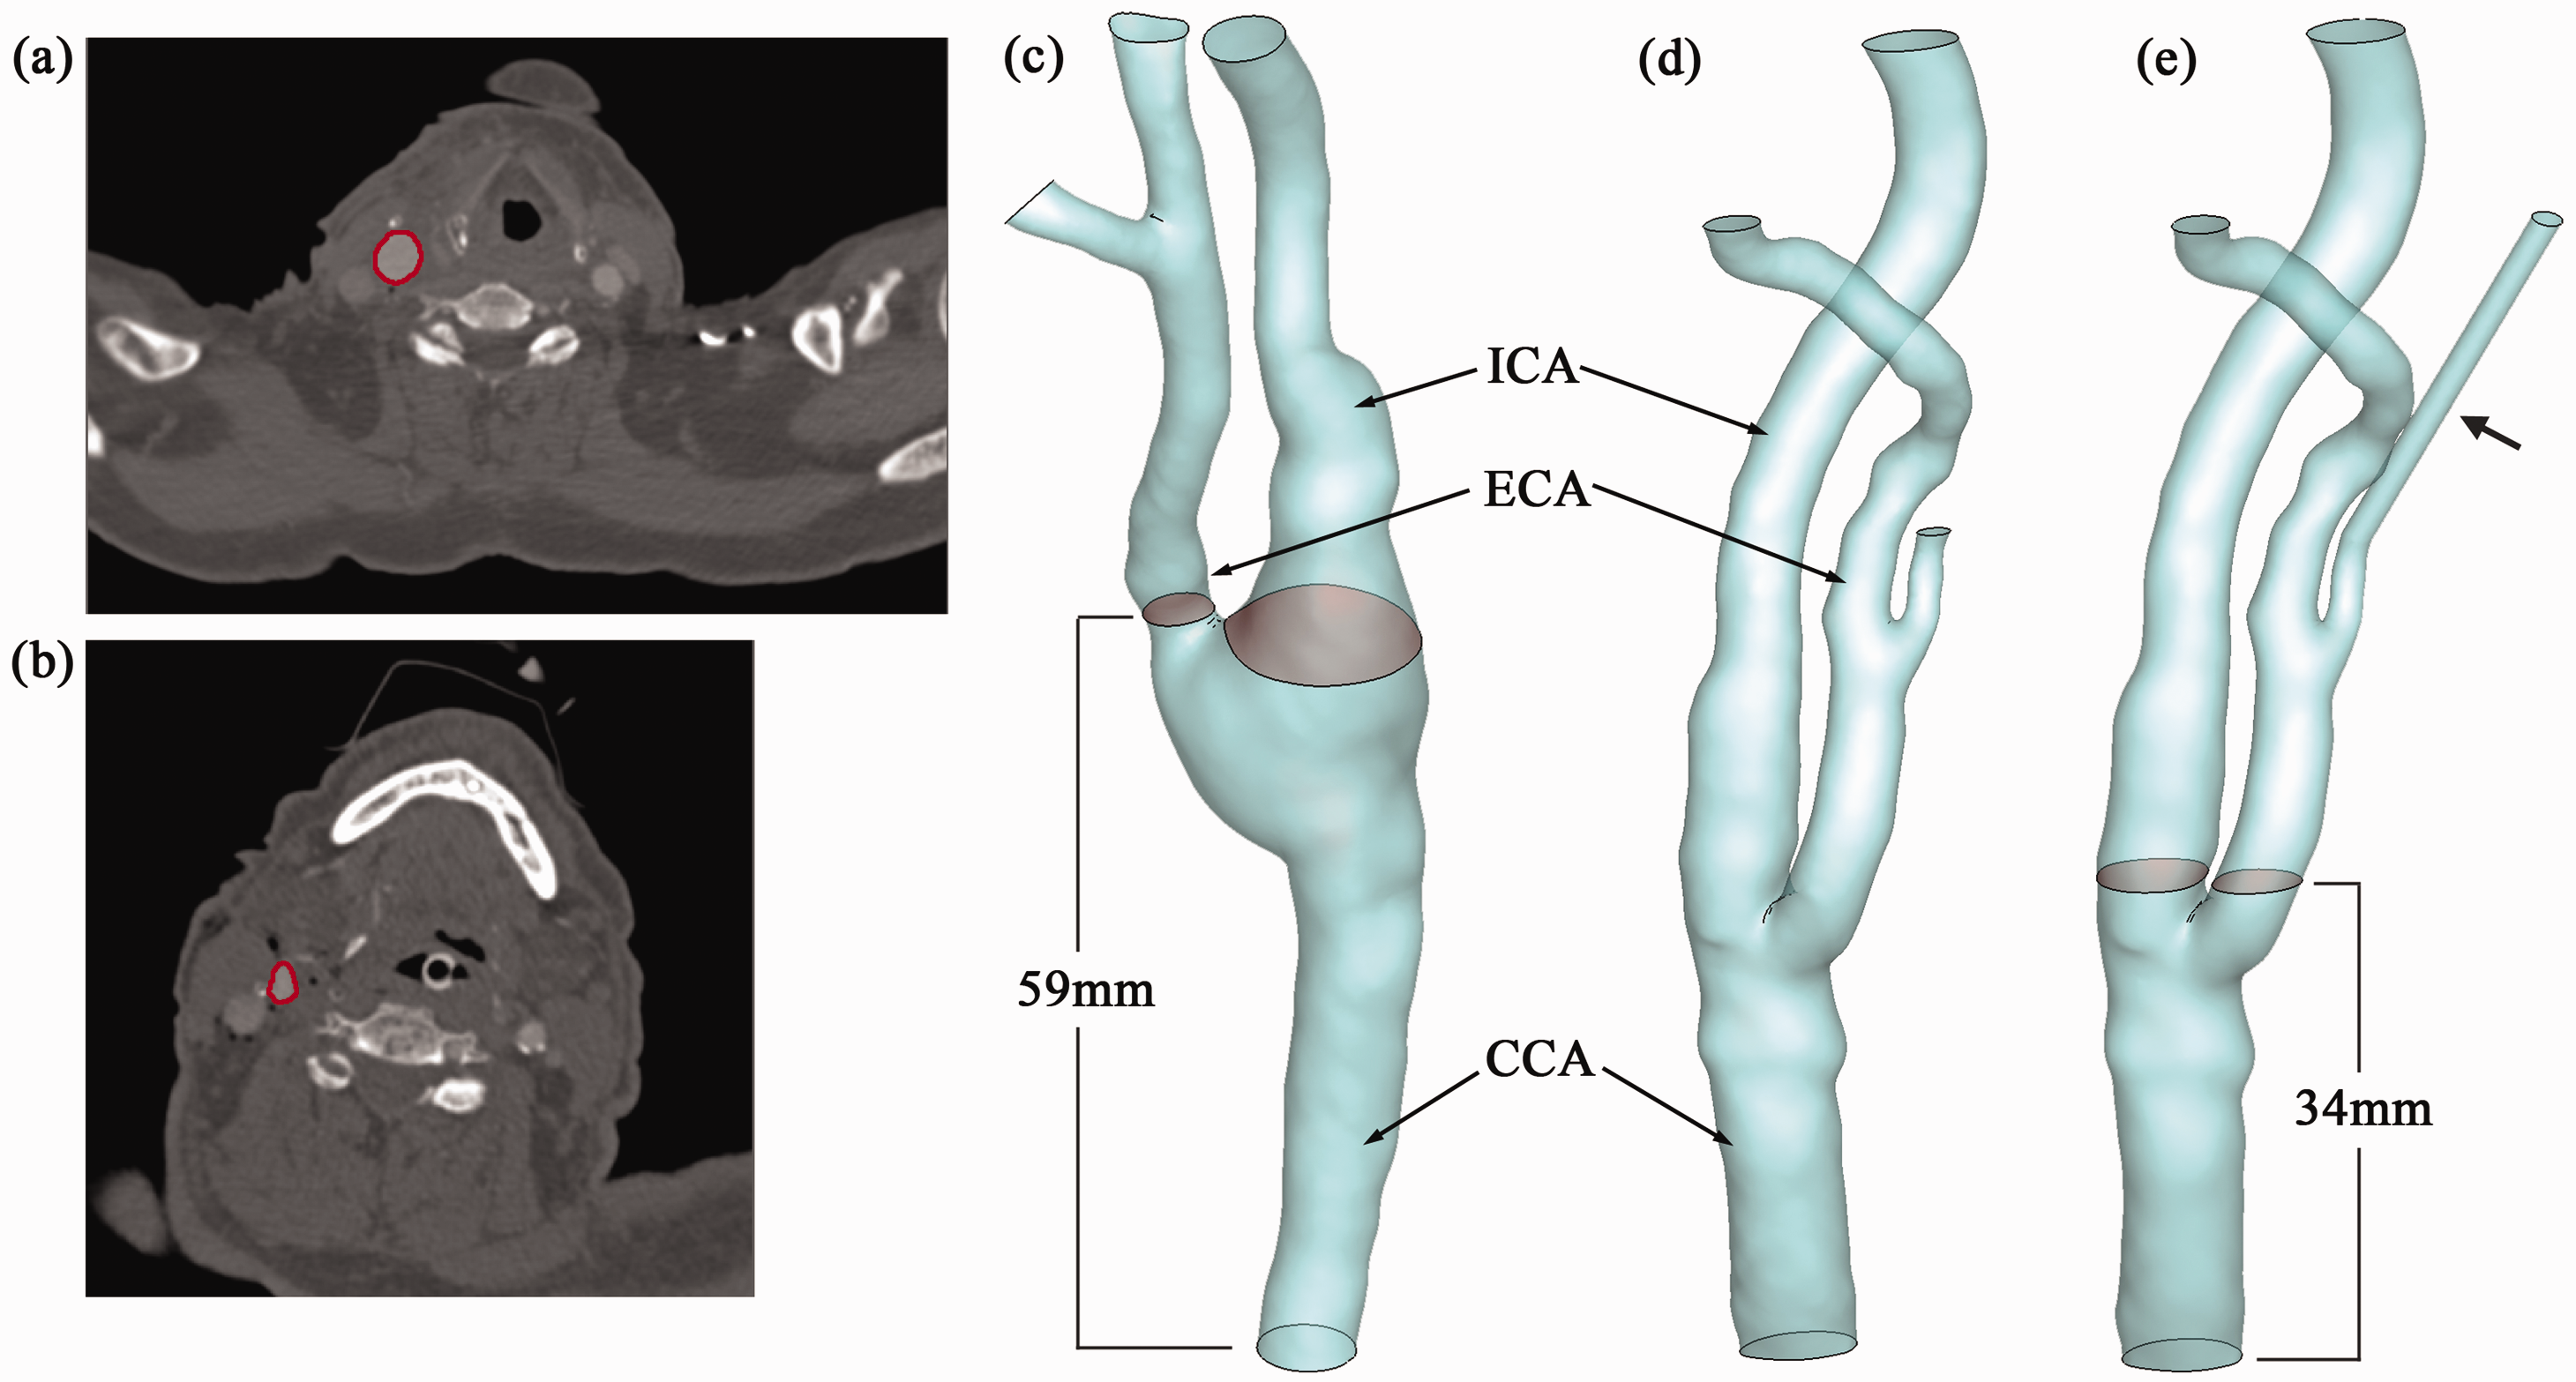
To validate the simulation, intraoperatively assessed flow measurements within the internal carotid (ICA) and common carotid artery (CCA) using intraoperative ultrasound (MediStim©, VeriQ©, Deisenhofen, Germany) were performed for both patients (Patient A and B). Within the clinical setting both patients received a multidetector computed tomography (MDCT) one day after surgery. Patient A who was treated by C-CEA was scanned with a Somatom Definition (Siemens Medical Systems, Erlangen, Germany). Scan and reconstruction parameters were as follows: 120 kV, 120 ref. mAs, reconstructed slice thickness 1 mm, reconstruction increment 0.7 mm, pixel spacing 0.5 × 0.5 mm and administration of 90 ml contrast medium (iomeprol with 350 mg iodine per ml, Imeron 350, Bracco Diagnostics, Princeton, NJ, USA) with 50 ml saline chaser. Patient B who was treated by E-CEA was scanned with a Somatom Definition (Siemens Medical Systems, Erlangen, Germany) as well. Scan and reconstruction parameters were as follows: 120 kV, 120 ref. mAs, reconstructed slice thickness 0.75 mm, reconstruction increment 0.7 mm, pixel spacing 0.4 × 0.4 mm and administration of 90 ml contrast medium (iomeprol with 400 mg iodine per ml, Imeron 400, Bracco Diagnostics, Princeton, NJ, USA) with 50 ml saline chaser (Figure 1). The segmentation and surface reconstruction of the carotid arteries were accomplished by a semi-automatic threshold-based segmentation tool (Amira 5.4, Visage Imaging Inc., USA). As shown in Figure 2(a and b), regions of the carotid arteries have been selected in each cross-sectional image of the datasets. Geometries of the vessels were reconstructed, detailed views of which are displayed in Figure 2(c and d).
Maximum intensity projections (MIPs) in sagittal orientation of CTA datasets show the postoperative morphometry after C-CEA (A) and E-CEA (B), respectively. Segmentation (a and b) and surface reconstruction (c–e) of both datasets (a and c: C-CEA; b and d: E-CEA). The superior thyroid artery in the E-CEA model (e) has been artificially extended in order to reduce the pressure difference at the outlets of this artery and the external carotid artery (black arrow). ICA: internal carotid artery; ECA: external carotid artery; CCA: common carotid artery.
The reconstructed geometries were meshed in ICEM (ANSYS 12.1 Inc, Canonsburg, USA) with tetrahedral elements in the core region and prismatic cells in the boundary layer near the vessel wall (10 layers of prismatic cells define the near-wall region). The superior thyroid artery in the E-CEA model has been artificially extended in order to reduce the pressure difference at the outlets of this artery and the external carotid artery (ECA) (Figure 2e). The C-CEA model possessed 2,005,753 cells in total and the E-CEA model contained 2,708,971 cells totally. To confirm the insensitivity of the results to the spatial resolution, a grid independence analysis was conducted; solutions on finer grids (C-CEA: 4,106,211 cells; E-CEA: 4,872,533 cells) were compared to the baseline models. A point at the center of the carotid bulb was studied: the maximum discrepancies of the velocity magnitude at this point during a cardiac cycle between the two grids were 3.6% for the C-CEA model and 3.9% for the E-CEA model, and exact same trends of the variable variations were observed. Thus, for the purposes of our study the baseline resolutions are adequate.
Transit time flow measurement has been achieved during the examination (VeriQ™ Intraoperative TTFM, MEDISTIM). Mean flow rates at the middle of CCA and at the origin of ICA have been recorded. Intraoperative measurements at the common carotid artery (CCA) were used as the inlet flow boundary conditions for numerical simulations; while, the measured flow information of ICA were employed to validate the computational results.
Pulsatile flow information was derived from the waveforms described in older human subjects.
30
Parabolic velocity profile was applied at the inlet of CCA,
31
and the maximum velocity at the inlet along the centerline of CCA was calculated based on the instantaneous volumetric flow rate, as represented in Figure 3. Vessel boundaries were assumed to be non-compliant. No-slip boundary conditions were imposed at the walls, and zero-pressure boundary conditions were applied at the outlets of ICA, ECA and their branches.
Discrepancies of the velocity magnitude at the center of the carotid bulb. C-CEA: conventional carotid endarterectomy; E-CEA: eversion carotid endarterectomy.
The blood was treated as Newtonian and incompressible 32 with a density of 1044 kg/m3 and a dynamic viscosity of 0.00365 kg·m−1·s−1. As shown in Figure 2(c and d), no obvious stenosis is presented in the postoperative carotid arteries; thus, a laminar model of the flow was applied during the computation.29,33 The finite volume solver, CFD-ACE+ (ESI Group, France), was employed for the numerical solution of the transport equations – the Naviér-Stokes equations. A second-order accurate discretization (central differences) was used to solve the flow velocity. Algebraic MultiGrid acceleration 34 was employed and the SIMPLEC-type pressure correction 35 was used for pressure-velocity coupling. The simulation has been carried out for five cardiac cycles to achieve a periodic solution for each model. The results presented below are based on the output of the final cycle.
Results
Flow analysis and validations
Figure 4 shows flow patterns within the carotid arteries at systolic peak (a and b) and during mid diastole (b and d) based on the C-CEA (a and c) and E-CEA (c and d) models. At systolic peak, the flow was fairly organized throughout carotid arteries in both of the models. Relatively high velocities (0.55–0.69 m/s) occurred along the centerline of CCA and ICA, indicating stronger flow transports in those vessels. In the C-CEA model, flow with low velocity (0.063 m/s) and reversely directed flow could be observed in the carotid bulb. In the E-CEA model, no sudden reduction of the flow velocity was observed near that region. During diastole, flow velocities in both cases were reduced; the maximum velocity magnitude (0.219 m/s of the C-CEA model and 0.223 m/s for the E-CEA model) was about 1/3 of that at systolic peak. Highly turbulent flow pattern with low velocities (0.022 m/s) was displayed in the carotid bulb of the C-CEA model. In the E-CEA model, flow remained organized generally; slightly helical features presented in the carotid bulb and in the ECA. The C-CEA model markedly broadened the vessel diameter with subsequent increase of slow and turbulent blood flow, compared to the postoperative conditions after E-CEA where the bifurcation keeps its physiological shape (Figures 1 and 2).
Flow patterns within the carotid arteries at systolic peak (a and b) and during mid diastole (c and d) based on the C-CEA (a and c) and E-CEA (b and d) models. Whereas flow is fairly organized in systole and diastole in the E-CEA model (b–d), flow in the aortic bulb of the C-CEA model (a–c) is turbulent with low velocities in both systole and especially diastole.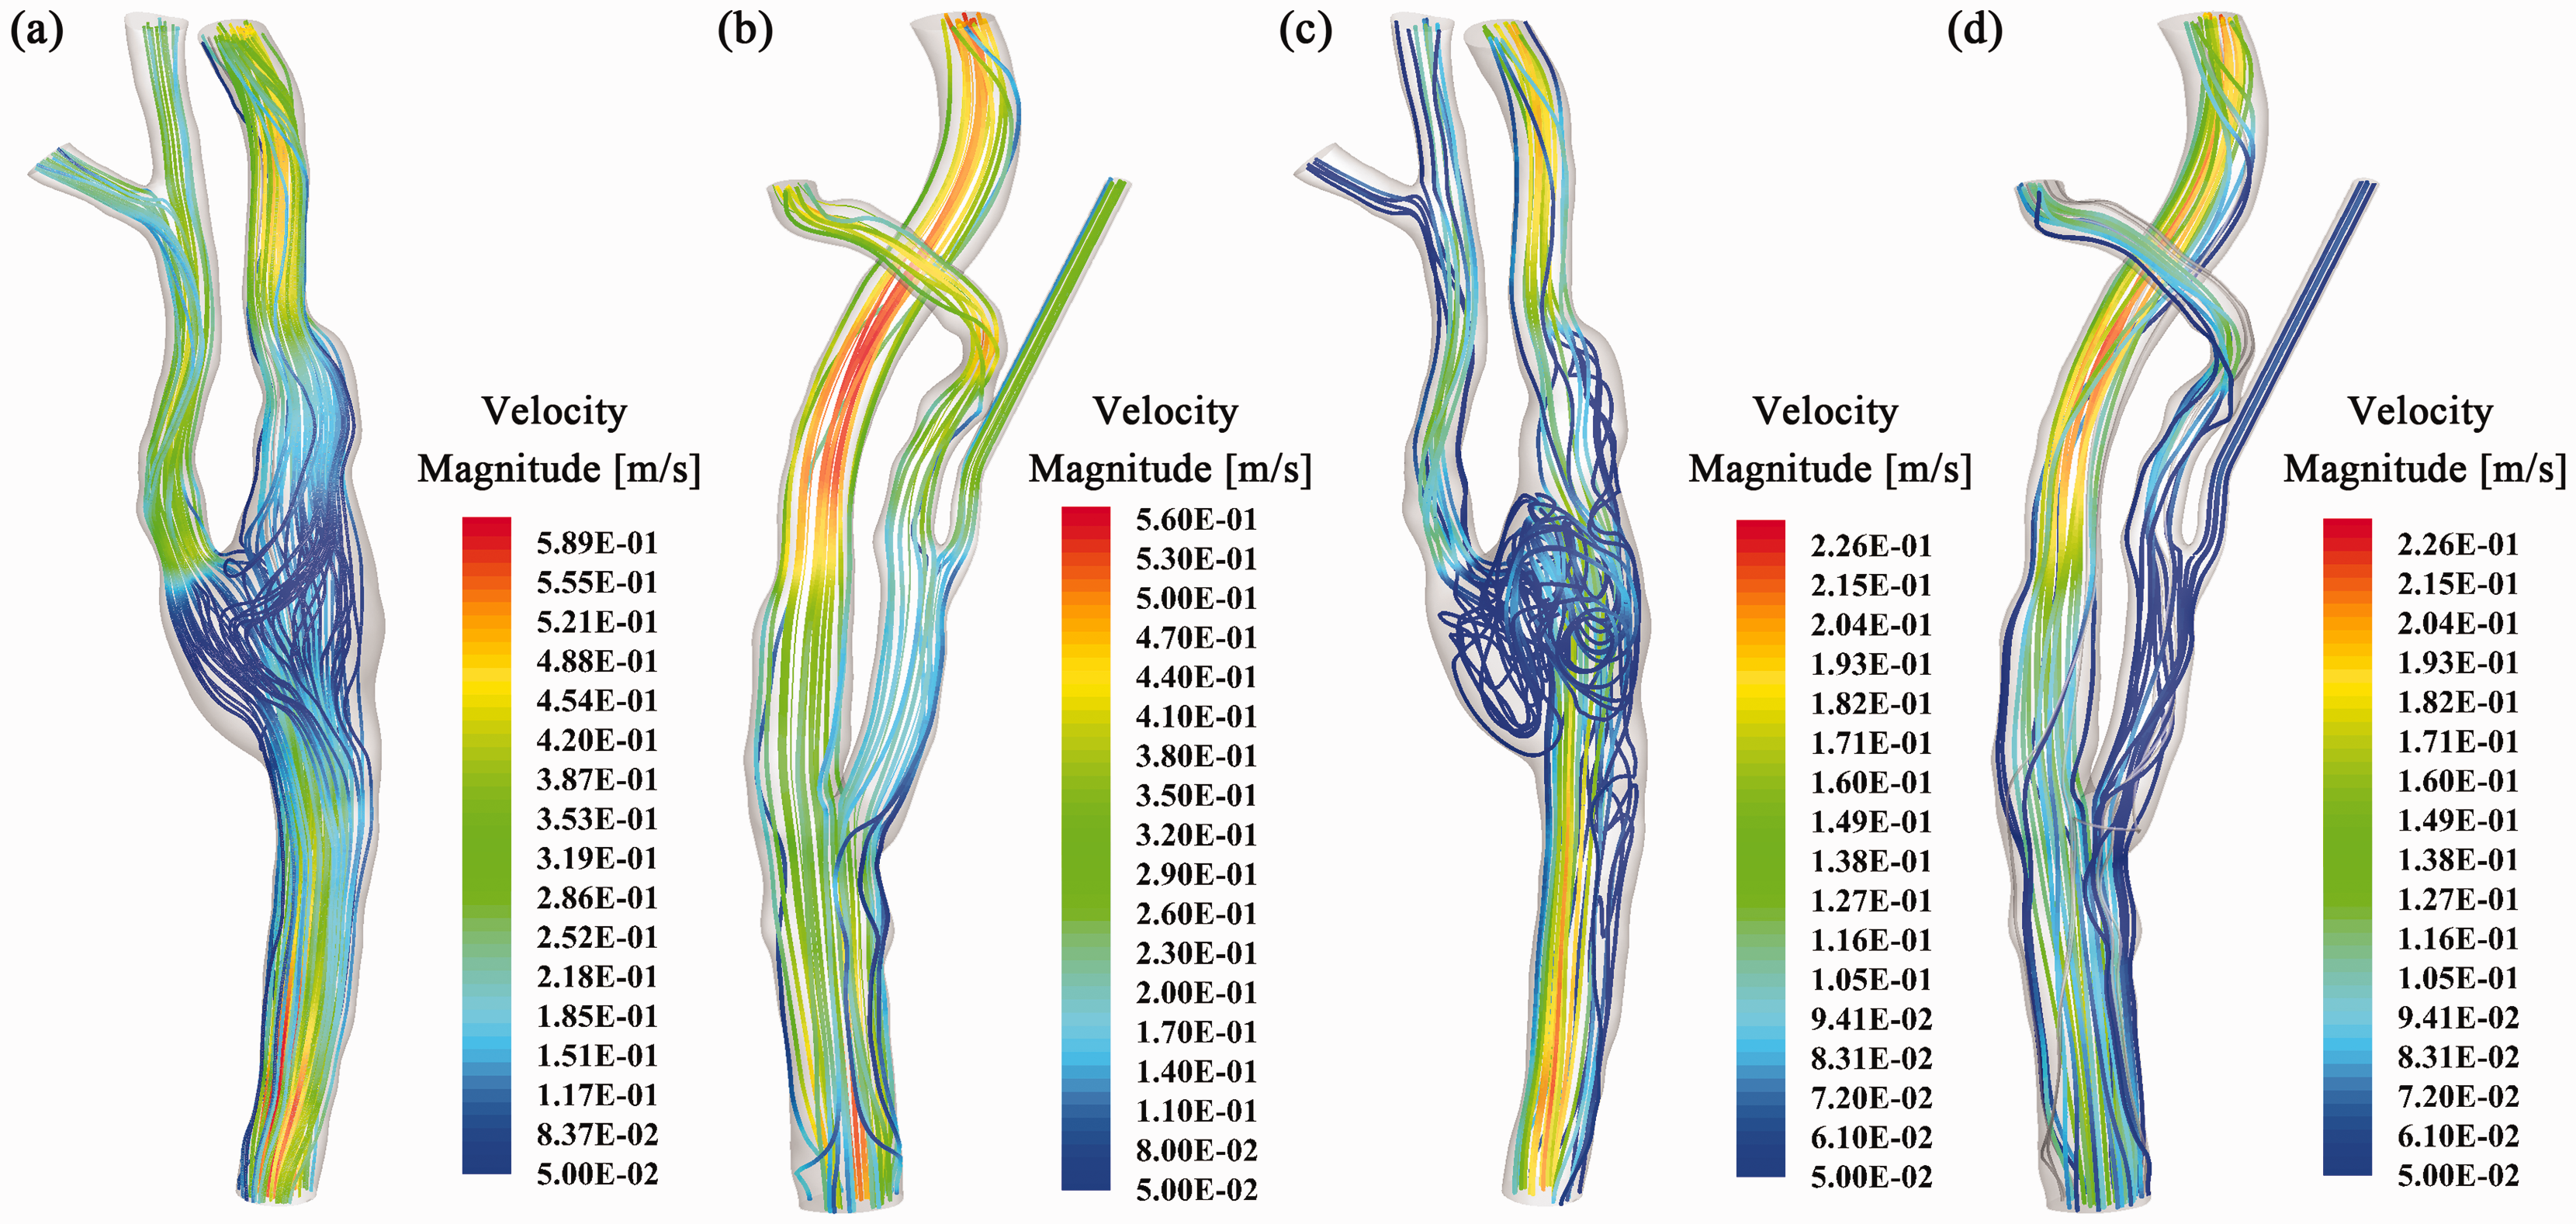
The intraoperatively measured mean flow rates near the origin of ICA for the C-CEA and E-CEA models were 239 ml/min and 257 ml/min, respectively, which were 63% and 71% of the inflow at CCA (379 ml/min and 360 ml/min for the C-CEA and E-CEA cases, respectively). To compare our results with the measured data, instantaneous flow rates were recorded at the proximal site of the ICA and ECA, as shown in Figure 2(c and e). The calculated mean flow rates at the ICA for the C-CEA and E-CEA models were 241.14 ml/min and 261.9 ml/min with discrepancies of 0.9% and 1.5% for the C-CEA and E-CEA models, respectively. The computational flow results could therefore be validated and further investigations regarding the loading distributions can be established.
Loading distributions
Figure 5 displays the loading distributions (pressure and wall shear stress (WSS)) of the models at systolic peak. Figure 5(a and b) presents the pressure distributions of the C-CEA and E-CEA models. Pressure in the E-CEA model gradually decreased along the stream path, from inlet at the CCA (about 240 Pa) to the outlets at ICA and ECA (zero pressure). However, in the C-CEA model, relatively high pressure (about 180 Pa) presented at the carotid bulb, which was due to the turbulent flow pattern occurring in that region, with low velocities but more stagnating times. The WSS at systolic peak in both of the models (Figure 5c and d) showed similar variation ranges (0.05–16.3 Pa for the C-CEA model and 0.03–15.9 Pa for the E-CEA model).
Loading distributions (a and b: pressure/c and d: wall shear stress) of the models (a and c: C-CEA; b and d: E-CEA) at systolic peak. In the C-CEA model (a), the arrow indicates a relatively high pressure (about 180 Pa) at the carotid bulb.
Further investigation of the loading distribution of the models involved the study of two other parameters – the time-averaged WSS (TAWSS) and the maximum temporal gradient of WSS (TGWSS). The TAWSS was calculated as the magnitude of the time-averaged wall shear stress vector equation (1)

where T denotes a cardiac cycle and Loading distributions (a and b: time-averaged wall shear stress (TAWSS)/c and d: maximum temporal gradient of wall shear stress (TGWSS) over the carotid arterial surfaces based on the C-CEA (a and c) and E-CEA (b and d) models. The low TAWSS region in the C-CEA model is much larger than that in the E-CEA model and with lower TAWSS values (black arrow a and b).
TGWSS quantifies the maximum value of the time derivative in WSS calculated between every two consecutive time points during the cycle. It can be outlined by equation (2)

where i is the spatial point and n is the time step. As shown in Figure 6(c and d), the distribution pattern of TGWSS was similar to that of WSS.
Discussion
This study investigates differences in hemodynamic metrics after C-CEA and E-CEA using physiological imaging by CFD that might explain different restenosis rates in both techniques.
Most recurrences occur within 2 years postoperatively due to neointimal hyperplasia caused by the “response to injury” reaction of the endarterectomised vessel wall, whereas atherosclerosis is the more frequent long-term cause.36,37 In recent years, CFD analysis has become an important tool for providing insights into the spatial and temporal distribution of hemodynamical parameters that affect acute thrombogenesis or atheromatous plaque formation.
Low shear stress and turbulent flow is associated with atherosclerotic disease throughout the arterial system, observed in the carotid bifurcation amongst others.38–45 Normally, in the arterial system shear stress ranges from 1 Pa to 7 Pa. 43 Low WSS (<1 Pa) directly affects genetic expression within endothelial tissue, encouraging the expression of genes involved in atherosclerosis.46,47 On the other hand, high WSS (larger than 40 Pa) is believed to be able to induce platelet aggregation, disrupture of smooth muscle caveolae, leading to intimal injury or rupture of vulnerable plaques due to endothelial denudation.48–51 Our computational results of patient data do not present WSS (at systolic peak) higher than 40 Pa, indicating the effectiveness of C-CEA and E-CEA in creating physiologic WSS for these specific patients. However, expansion of the vessel lumen by C-CEA with patch angioplasty increased the diameter of the carotid bulb resulting in a larger vessel region with low shear stress and increased slow and turbulent blood flow, which may stimulate thrombogenesis and recurrent atheromatous plaques.
Baan et al. 52 analyzed the strain of the vessel wall by measuring the ratio of the change in outside radius of the carotid bulb during the systole and diastole using ultrasound. The authors showed a significantly lower strain after C-CEA, which is highly consistent with the WSS pattern of our C-CEA model. Hayase et al. 25 compared postoperative hemodynamics after carotid artery stenting (CAS) with those after C-CEA with patch-angioplasty by use of CFD. Similar to the present study the authors showed an increased low and turbulent flow at the carotid bulb after C-CEA that may cause thrombogenesis and recurrent atheromatous plaques.
Marshall et al. 27 studied the pulsatile flow in physiologically realistic models of a normal and a stenosed human carotid bifurcation phantom. In contrast to the stenosed model, flow in the bulb region of the non-stenosed “internal carotid artery” was concentrated along the inner wall with a low flow region near the outer wall of the bulb. TAWSS was also markedly different for the two phantoms, showing much higher values along the inner wall of the ICA in the normal phantom. Birchall et al. 22 performed CFD-analysis of abnormal hemodynamics at the atheromatous carotid bifurcation compared to a healthy subject. Very close to our E-CEA model the sequential streamlines through the cardiac cycle in the healthy carotid bulb showed flow split into two relatively high-velocity streams attached to the inner walls of the ICA and CCA, with development in the early deceleration phase (corresponding to the mid diastole of the present model) of regions of slow, recirculating and weakly turbulent flow, most prominently within the lateral aspects of the bulb. Hence results of both studies regarding normal anatomy are very close to the dynamic pattern of the current E-CEA model, leading to the ascertainment that postoperative morphology and hemodynamics of the ICA operated by the eversion technique seems closer to the literature descriptions of a non-operated non-stenosed artery.
High values of TGWSS are related to the expression of atherogenesis-related genes in endothelial cells. 53 This may indicate the vulnerability of these regions to potentially suffer from atherosclerosis. Low TAWSS less than 0.5 Pa may stimulate atherogenic phenotype, 54 indicating a higher possibility of C-CEA for recurrent atheromatous plaques at the carotid bulb, especially near the adjoining wall of the external-common carotid artery.
Focusing on the carotid bulb alone, the E-CEA showed a more preferable loading distribution than the C-CEA model with regard to the potential of recurrent atheromatous plaques.
Limitations
Since not every patient routinely receives CTA directly after CEA and due to the complexity of the segmentation and simulation, number of patients is very limited. Additionally, due to the retrospective design of this pilot study the intraoperatively assessed flow measurements were not adjusted to blood pressure and heart rate. In this context, a different postoperative blood pressure response caused by transection of the sinus nerve during E-CEA, as shown in prior studies,55,56 might have influence on rheological conditions that were therefore not accounted for. However, all measures were taken to perform realistic patient-specific simulation as shown by good agreement of the intraoperatively and experimentally measured data. Due to low discrepancies between the computational flow results and intraoperatively measured data, flow results could be validated and further investigations regarding the loading distributions could be established. Further, for the purpose of our study, base resolutions with the baseline time step were deemed adequate.
In conclusion, CFD of C-CEA and E-CEA were successfully calculated on the basis of patient-specific data and disclosed differences in the postoperative hemodynamic patterns between both operative techniques. However, further studies in larger populations are necessary to prove our results, potentially elucidating higher restenosis rates after patch angioplasty.
Footnotes
Acknowledgements
Matthias Müller-Eschner and Hendrik von Tengg-Kobligk received support from the German Research Foundation (DFG) within project R03, SFB/TRR 125 “Cognition-Guided Surgery”. Duanduan Chen is supported by the National Natural Science Foundation of China (31200704), and would like to acknowledge the ESI Group and Mr. Xiangde Zhu for the use of CFD-ACE+, ANSYS Inc. for the use of ICEM, and Visage Imaging Inc. for the use of Amira.
Conflict of interest
None declared.
Funding
This research received no specific grant from any funding agency in the public, commercial, or not-for-profit sectors.