
Abstract
Background
Early detection of small type I endoleaks after endovascular aneurysm sealing is mandatory because they can rapidly progress and lead to severe complications. Recognition of endoleaks can be challenging due to the appearances on computed tomography unique to endovascular aneurysm sealing. We aimed to validate the accuracy and added value of subtraction computed tomography imaging using a post-processing software algorithm to improve detection of endovascular aneurysm sealing-associated endoleaks on postoperative surveillance imaging.
Methods
The computed tomography scans of 17 patients (16 males; median age: 78, range: 72–84) who underwent a post-endovascular aneurysm sealing computed tomography including both non-contrast and arterial phase series were used to validate the post processing software algorithm. Subtraction images are produced after segmentation and alignment. Initial alignment of the stent segmentations is automatically performed by registering the geometric centers of the 3D coordinates of both computed tomography series. Accurate alignment is then performed by translation with an iterative closest point algorithm. Accuracy of alignment was determined by calculating the root mean square error between matched 3D coordinates of stent segmentations.
Results
The median root mean square error after initial center of gravity alignment was 0.62 mm (IQR: 0.55–0.80 mm), which improved to 0.53 mm (IQR: 0.47–0.69 mm) after the ICP alignment. Visual inspection showed good alignment and no manual adjustment was necessary.
Conclusions
The possible merit of subtraction computed tomography imaging for the detection of small endoleaks during surveillance after endovascular aneurysm sealing was illustrated. Alignment of different computed tomography phases using a software algorithm was very accurate. Further studies are needed to establish the exact role of this technique during surveillance after endovascular aneurysm sealing compared to less invasive techniques like contrast-enhanced ultrasound.
Introduction
Endovascular treatment of abdominal aortic aneurysms by using the Nellix device (Endologix, Irvine, CA, USA), also known as endovascular aneurysm sealing (EVAS), is a relatively new technique and has some possible distinguishing features when compared to conventional endovascular aneurysm repair (EVAR).
While treatment with EVAR involves exclusion of the aneurysm and sealing at the proximal and distal landing zones, the EVAS concept has been based on sealing by using polymer-filled endobags surrounding two stent frames that maintain blood flow to the iliac arteries. 1 This technique therefore provides sealing and fixation throughout the aneurysm sac and is advocated to result in lower rates of endoleak and migration, although long-term follow-up is not available yet.2–4
Early detection of even small post-EVAS type IA and IB endoleaks is mandatory because they can progress and increase pressure inside the aneurysm, destabilize the Nellix endosystem and lead to devastating seal failures. 5 However, the properties of the polymer filled endobags result in a completely different appearance on follow-up imaging studies compared to EVAR and challenge physicians in recognizing complications, especially low flow endoleaks. 6 Sac pressurization can also occur without radiological evidence of endoleak. Density of the endobags’ polymer on computed tomography (CT) scans decreases over time from 100 to 250 Hounsfield units (HU) at 30 days to 50–100 HU at one-year follow-up.8,9 Additionally, the contrast-enhanced blood (150–400 HU) that should indicate endoleak on follow-up CT-scans needs to be differentiated from arterial wall calcification, stent graft material and contrast present in the polymer-filled endobags. Subtraction imaging can be used to subtract a non-contrast study from the arterial phase study to facilitate differentiation of contrast-enhanced blood from other high-density structures present in and around the area of interest. Post-processing software algorithms can be used to correct for variations in parameters such as inter-acquisition position changes (due to, for example, patient movement or breathing motions) and variations in pixel spacing (adjustment of scan window).
The aim of the present study was to validate the accuracy and added value of subtraction CT imaging using a post-processing software algorithm to improve detection of EVAS-associated endoleaks on postoperative surveillance imaging.
Methods
A dedicated post-processing software was developed for semi-automated alignment of the arterial phase and non-contrast CT series, and subtraction of the HU values of these aligned scans. The process includes three steps: (1) segmentation of the Nellix stent frames on both non-contrast and arterial phase series; (2) alignment of the segmentations and CT series; and (3) subtraction of the aligned CT series. The segmentation process includes one manual step, and the other steps are performed automatically by the software. Accuracy of the alignment, and subtraction were validated using datasets of the first post-EVAS CT scans of 17 elective EVAS patients. This study was approved by the local institutional review board, and the requirement for informed consent was waived by the board.
Study population
A total of 71 patients were electively treated with EVAS between March 2013 and February 2015. Seventeen of these patients had received a non-contrast and arterial phase series during CT follow-up, and were included for validation of the software (16 males; median age: 78, range: 72–84). For 3 out of 17 patients, a type IA endoleak was suspected at standard CT scan follow-up. Therefore, they received a new CT scan with a non-contrast phase and an arterial phase within six to six months. The results of the subtraction CT for these patients will be evaluated in detail to demonstrate the added value of CT scan subtraction.
CT acquisition protocol
CT scans were acquired on a 256-slice CT scanner (Philips Healthcare, Best, The Netherlands), using the following acquisition parameters: tube potential 120 kV; tube current time product 180 mAs; increment 0.75 mm; pitch 0.9; collimation 128 × 0.625 mm. First, the non-contrast CT series were acquired with a small window to reduce radiation dose, followed by administration of 60 mL intravenous contrast (Xenetix300) at a rate of 4 mL/s. The standard arterial phase scan protocol was used with a bolus trigger at a threshold of 150 HU. Patients were instructed to hold breath during scanning.
Subtraction algorithm
The proprietary post-processing subtraction software was developed in Matlab (Release 2016b, The MathWorks, Inc., Natick, MA, USA). The steps of segmentation, alignment and subtraction are explained in detail.
Segmentation
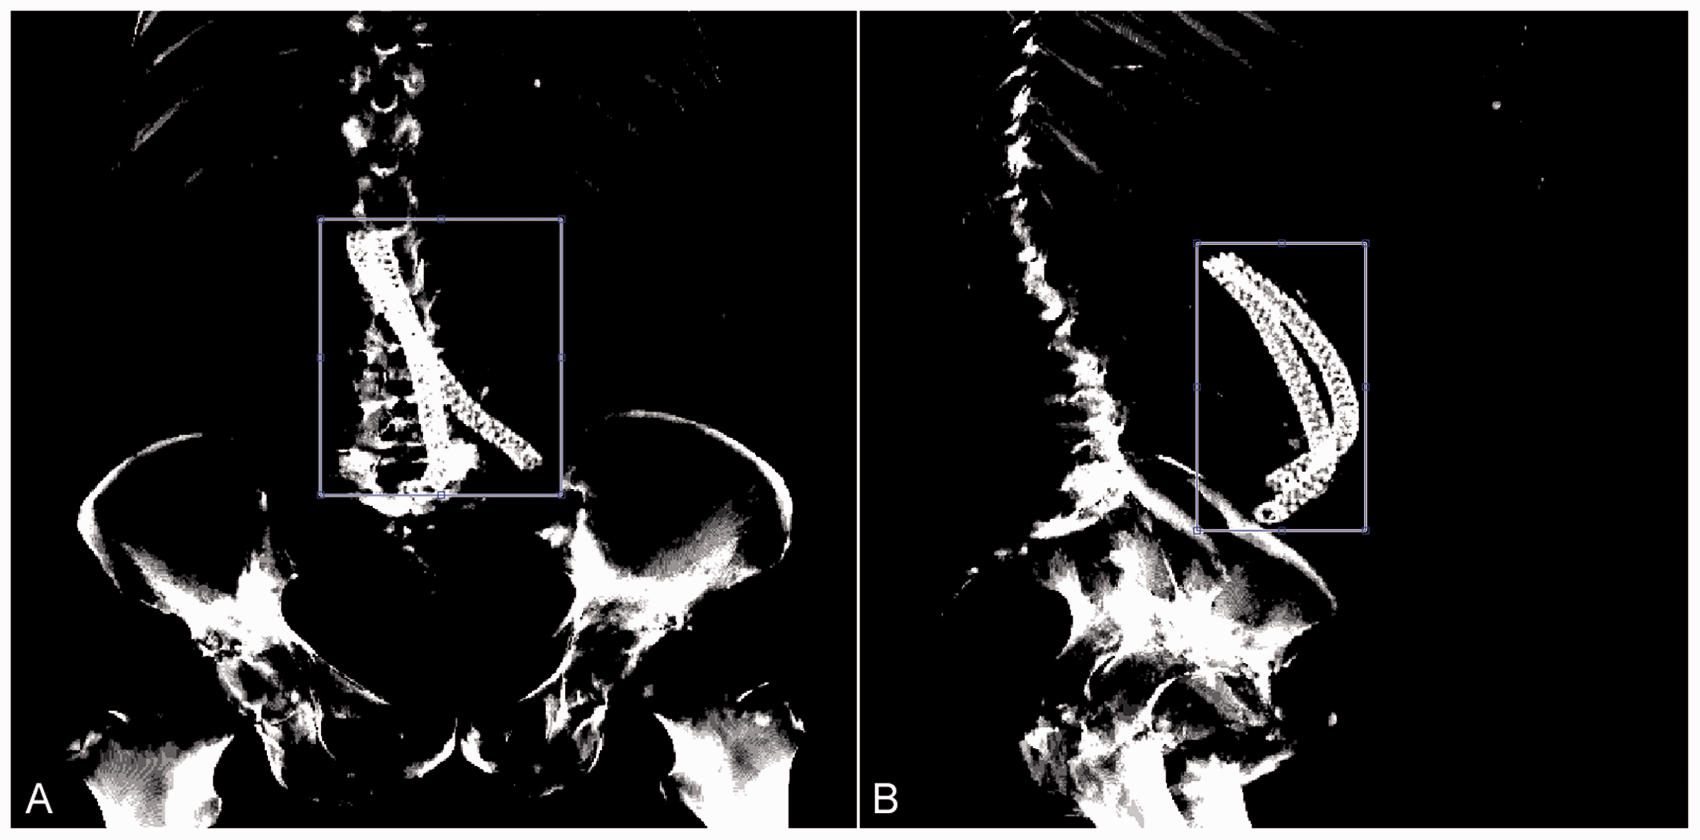
A region of interest (ROI) is manually defined on the cumulative sagittal and coronal high-intensity projections above a threshold of 1500 HU, on both CT series (Figure 1). These projections typically include the cobalt chromium stent frames (1800–2800 HU) and bone. The ROI is defined such that most of the bone is excluded, as the relative position of the aorta to the spine may differentiate slightly during the cardiac cycle, and due to breathing and patient movement. The 3D coordinates of the voxels within the ROI that match the radiodensity of cobalt chromium (1800–2800 HU) are automatically identified by the software (Figure 2(a)). Selection of the blue region of interest (ROI) on a coronal (a) and sagittal (b) high-intensity projected image. Differentiating the stent frame from other high-intensity structures. Structures within the ROI with an intensity ranging from 1800 to 2000 Hu are selected as stent frame.
Alignment
Initial alignment of the stent segmentations is automatically performed by registering the geometric centers of the 3D coordinates of both CT series. This initial alignment projects the stent frames over each other, which is needed for accurate closest point alignment. Accurate alignment of the stent segmentations is automatically performed by translation with an iterative closest point (ICP) algorithm.
7
This algorithm finds the translation between each individual coordinate of the non-contrast segmentation and the closest coordinate of the arterial phase segmentation. The iteration including the translation with the lowest registration error is used for the final alignment of the series (Figure 2(b)). The non-contrast and arterial phase series are aligned using the final transformation from the previous step.
Subtraction
The HU values of the non-contrast series are subtracted from the aligned HU values of the arterial phase series, providing DICOM images of the subtraction CT series.
Software validation
The accuracy of the alignment was determined by calculating the root mean square error (RMSE) between the matched 3D coordinates of both stent segmentations. The RMSE was calculated for both initial center of gravity alignment and the accurate ICP alignment. Optimal alignment was expected when the RMSE was within the range of the spatial resolution of the CT scans (0.7–1.0 mm).
An offset between the segmentations in the cranial-caudal direction may result in additional error, despite good alignment in the axial plane. This cannot be quantified with the RMSE, so a visual inspection of the proximal and distal ends of the stent frames was performed by two experienced readers (RV and RS) for each patient.
Results
Clinical results
All patients used to validate the current method (16 males, median age: 78.1 (71.5–83.6) years) underwent uneventful elective EVAS treatment. These 17 patients were selected because they underwent a post-EVAS CT scan including both non-contrast and arterial phase series. Median time interval between the EVAS procedure and the follow-up CT scan was 23.6 (22.3–30.9) months. All the other EVAS patients treated in the same time period underwent CT scans with an arterial phase series only.
Validation
Subtraction of the non-contrast CT series from the arterial phase CT series was successfully performed by the software in all 17 patients, with an average calculation time of 12 s. The median RMSE after initial center of gravity alignment was 0.62 mm (IQR: 0.55–0.80 mm), which improved to 0.53 mm (IQR: 0.47–0.69 mm) after the ICP alignment (Table 1). Visual inspection of the proximal and distal stent ends showed good alignment, both in transverse and cranial-caudal direction for all patients, and hence no manual adjustment was necessary.
The RMSE and mean distance after initial alignment and optimal alignment for all 17 patients.
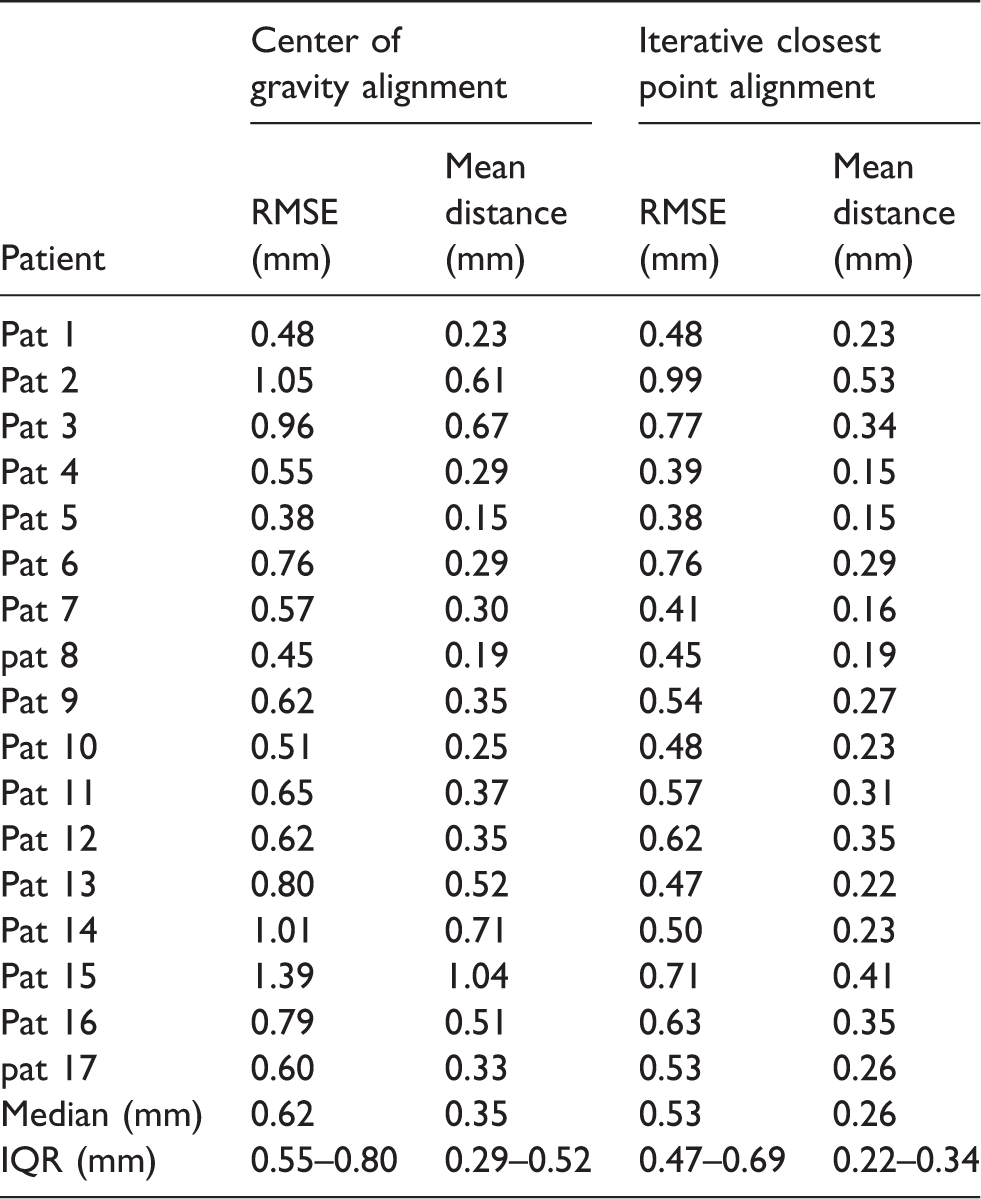
RMSE: root mean square error; IQR: interquartile range.
The reconstructions of the non-contrast and arterial phase CT series had the same slice thickness in 16 patients (all 1.5 mm), but one patient (Table 1, Pat #12) had reconstructions with different slice thickness, 3 mm for the non-contrast series (Figure 3(a)) and 1.5 mm for the arterial phase series (Figure 3(b), respectively. This resulted in an artefact, showing a false-positive hyper dense area on the subtraction CT (Figure 3(c)). However, the difference in slice thickness did not influence the RMSE (Table 1, Pat #12).
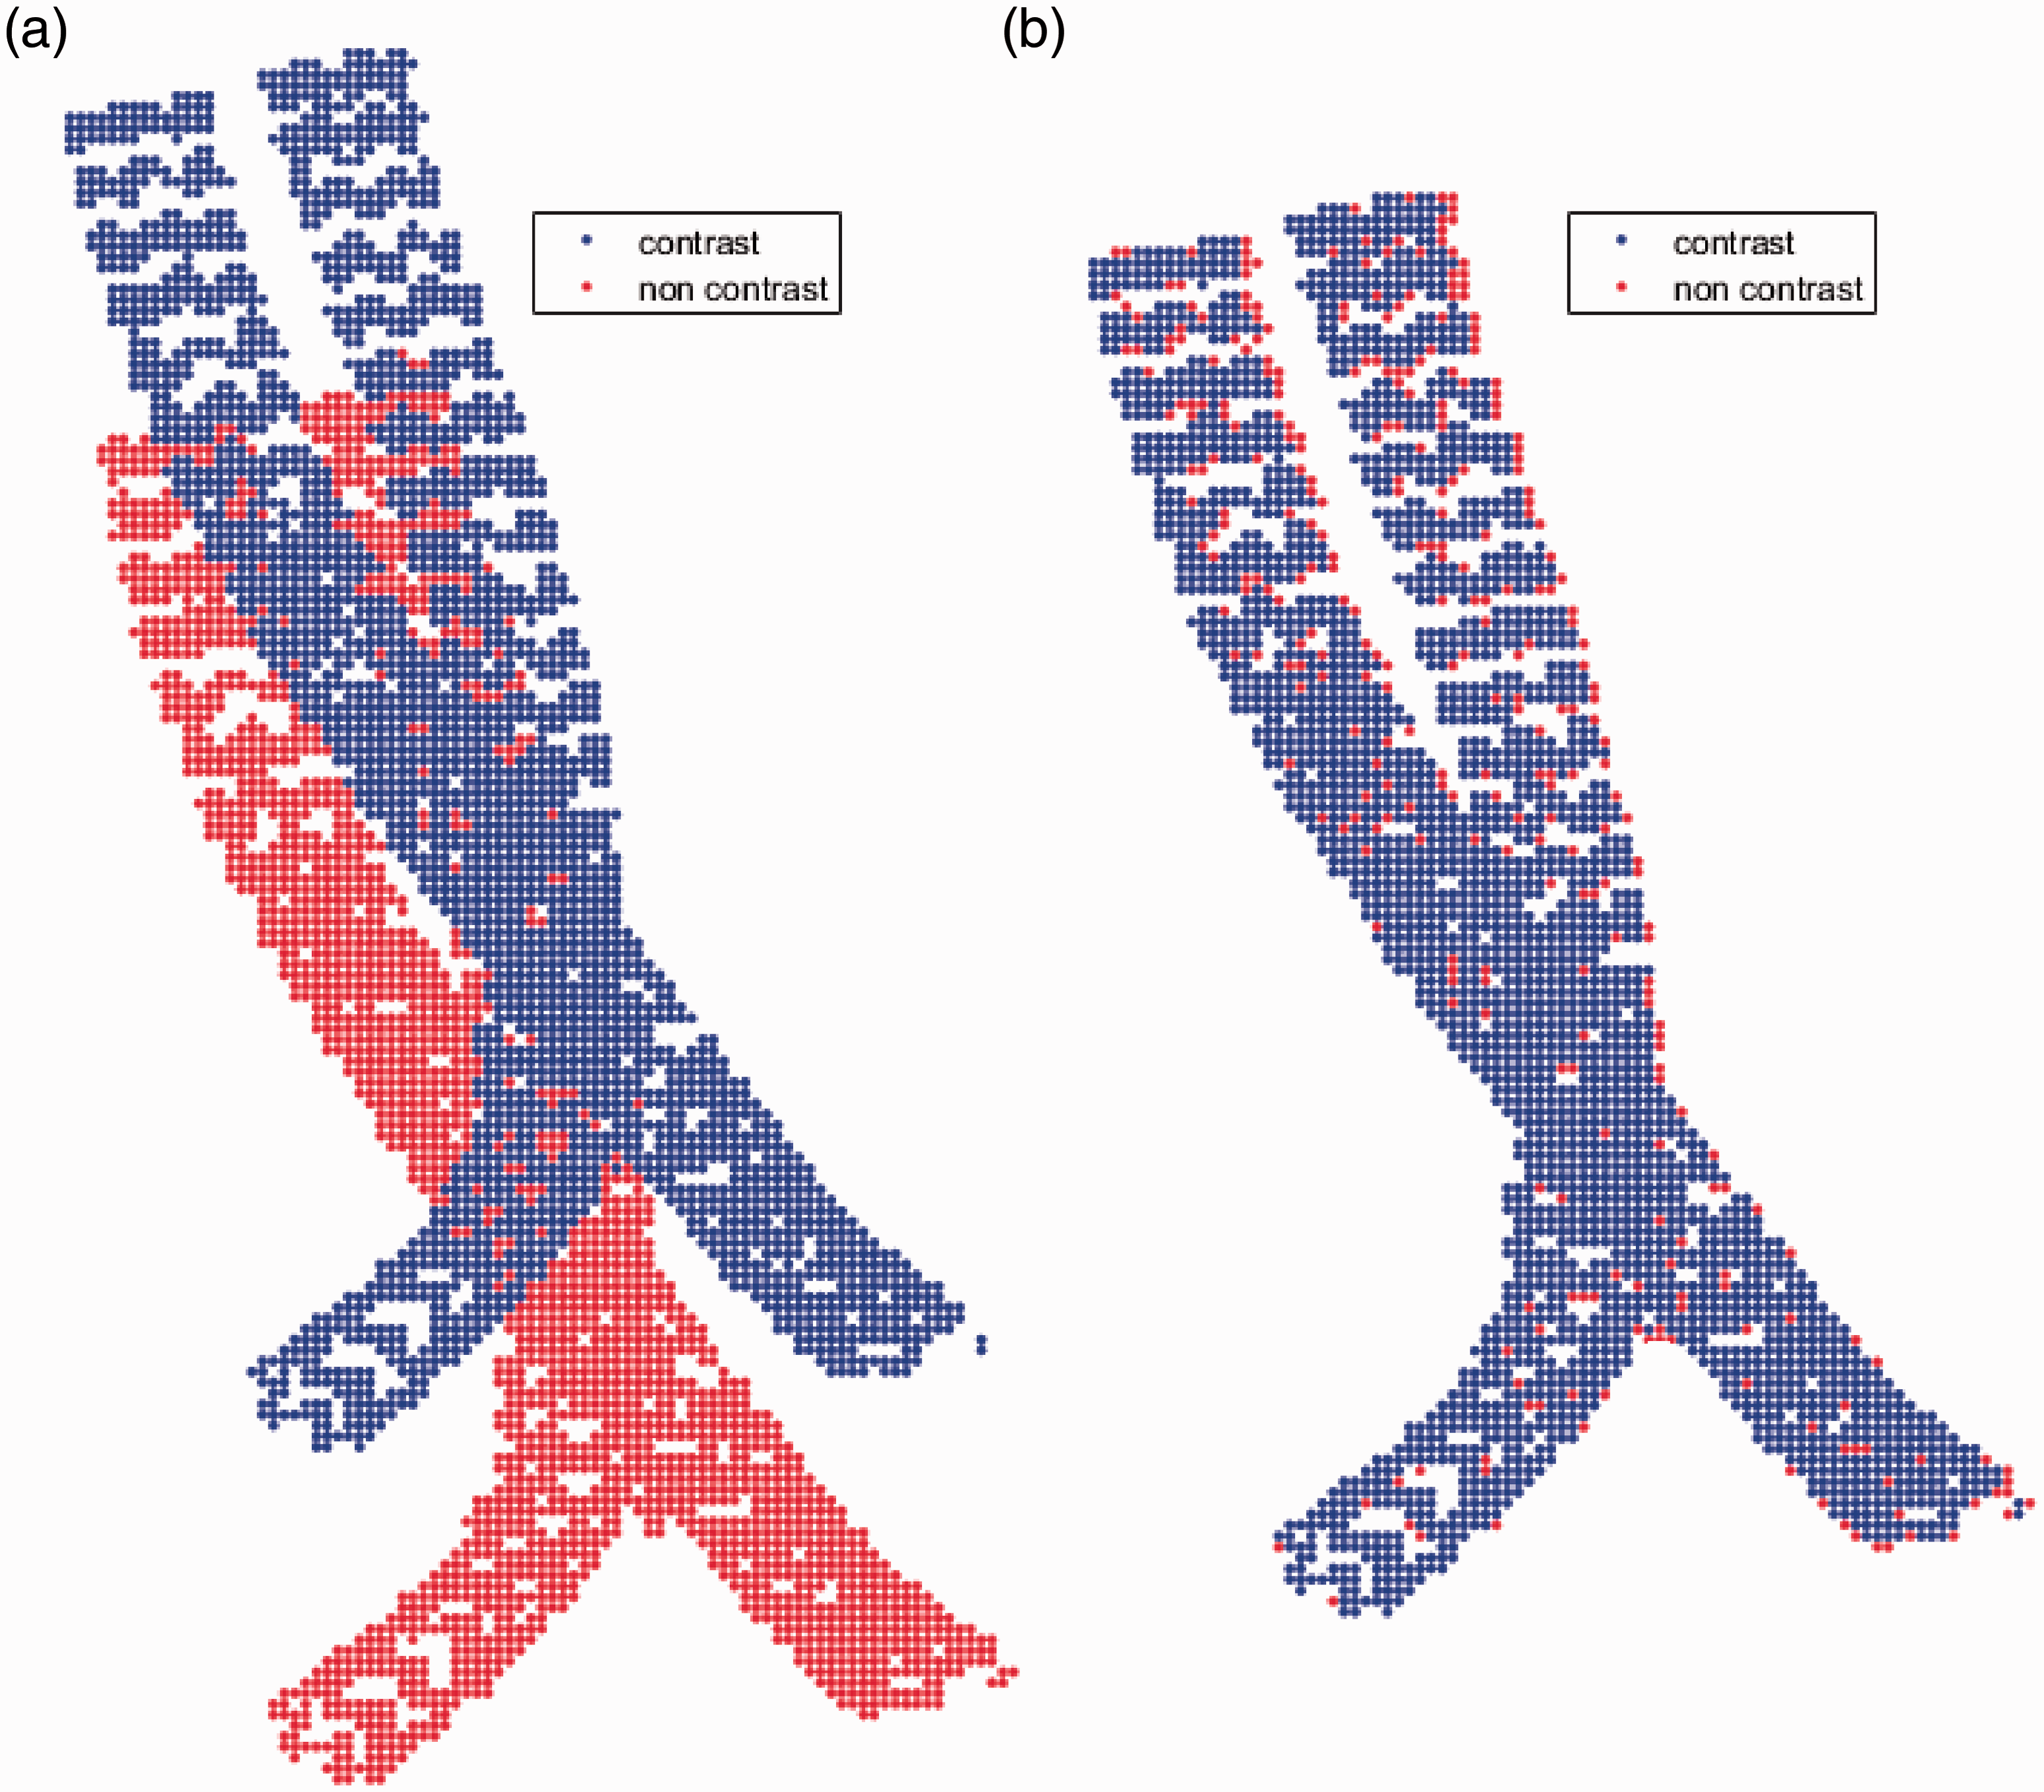
The segmented stent frames of the non-contrast (red) and arterial phase (blue) CT scan. (a) The position of the stent frames prior to alignment. (b) The position of the stent frames after final alignment.

(a) Arterial phase CT scan without suspect areas with a slice thickness of 1 mm. (b) Non-contrast CT scan with a slice thickness of 3 mm after alignment, (c) Subtraction CT scan with a hyper dense area (red arrow) caused by the difference in slice thickness between the arterial phase and non-contrast CT.
Examples of patients with suspected small endoleaks
Three patients with a suspicion of endoleak at a regular CT scan post-EVAS underwent a new CT scan three to six months later with an non-contrast series as well as arterial phase series to enable subtraction.
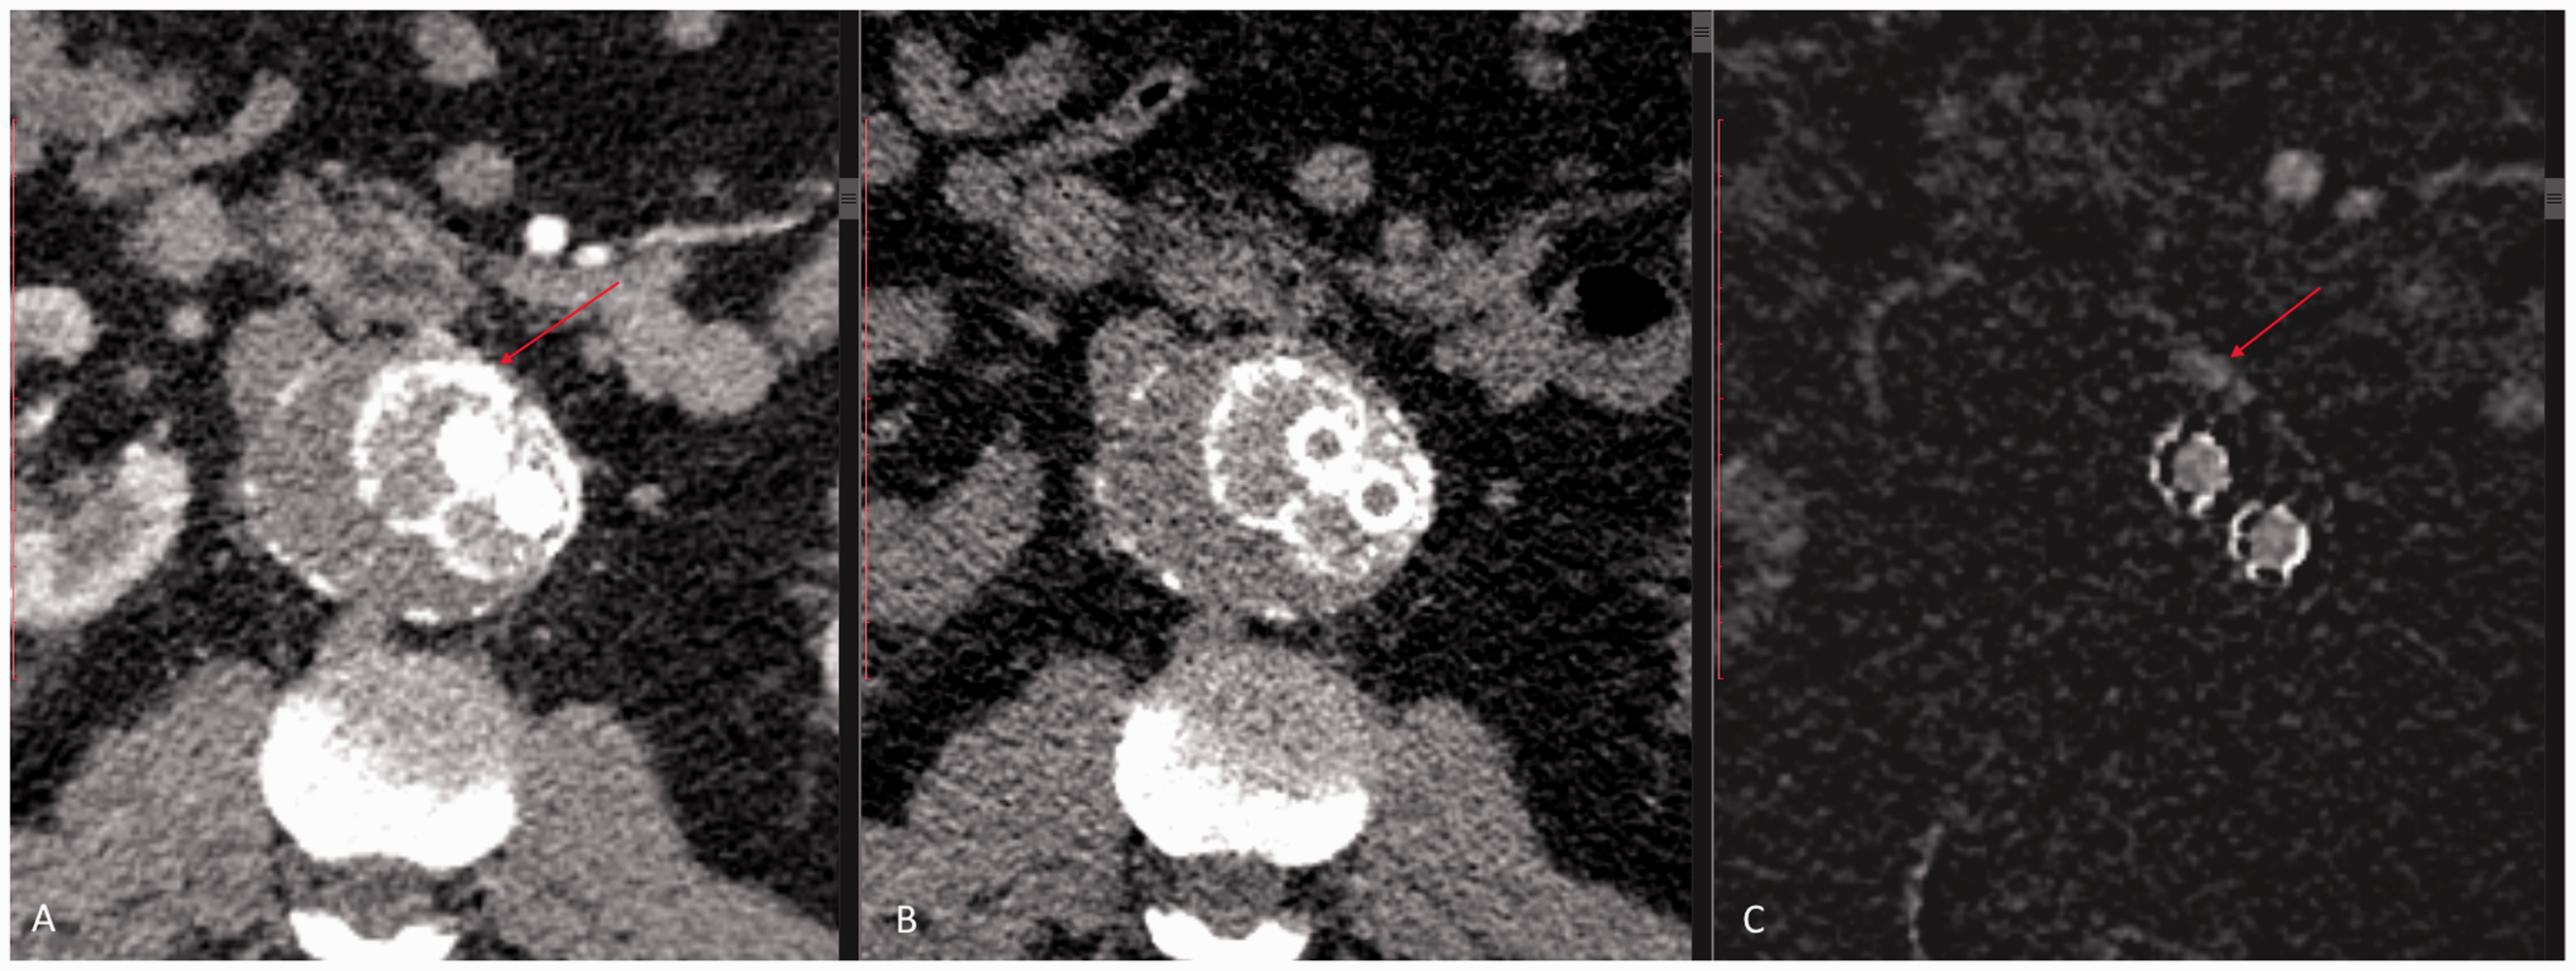
The first patient had an hourglass-shaped infrarenal aneurysm with increased contrast intensity, indicative for an endoleak on the arterial phase CT scan in the infrarenal neck as well as in the aneurysm (Figure 4(a)). Comparison with the non-contrast series suggests a type IA endoleak in the infrarenal neck, but no endoleak in the aortic aneurysm (Figure 4(b)), which is clear on the subtraction images (Figure 4(c)). Because of the lack of contrast in the aneurysm sac, no reintervention has been performed yet, and the patient is under intensified follow-up.
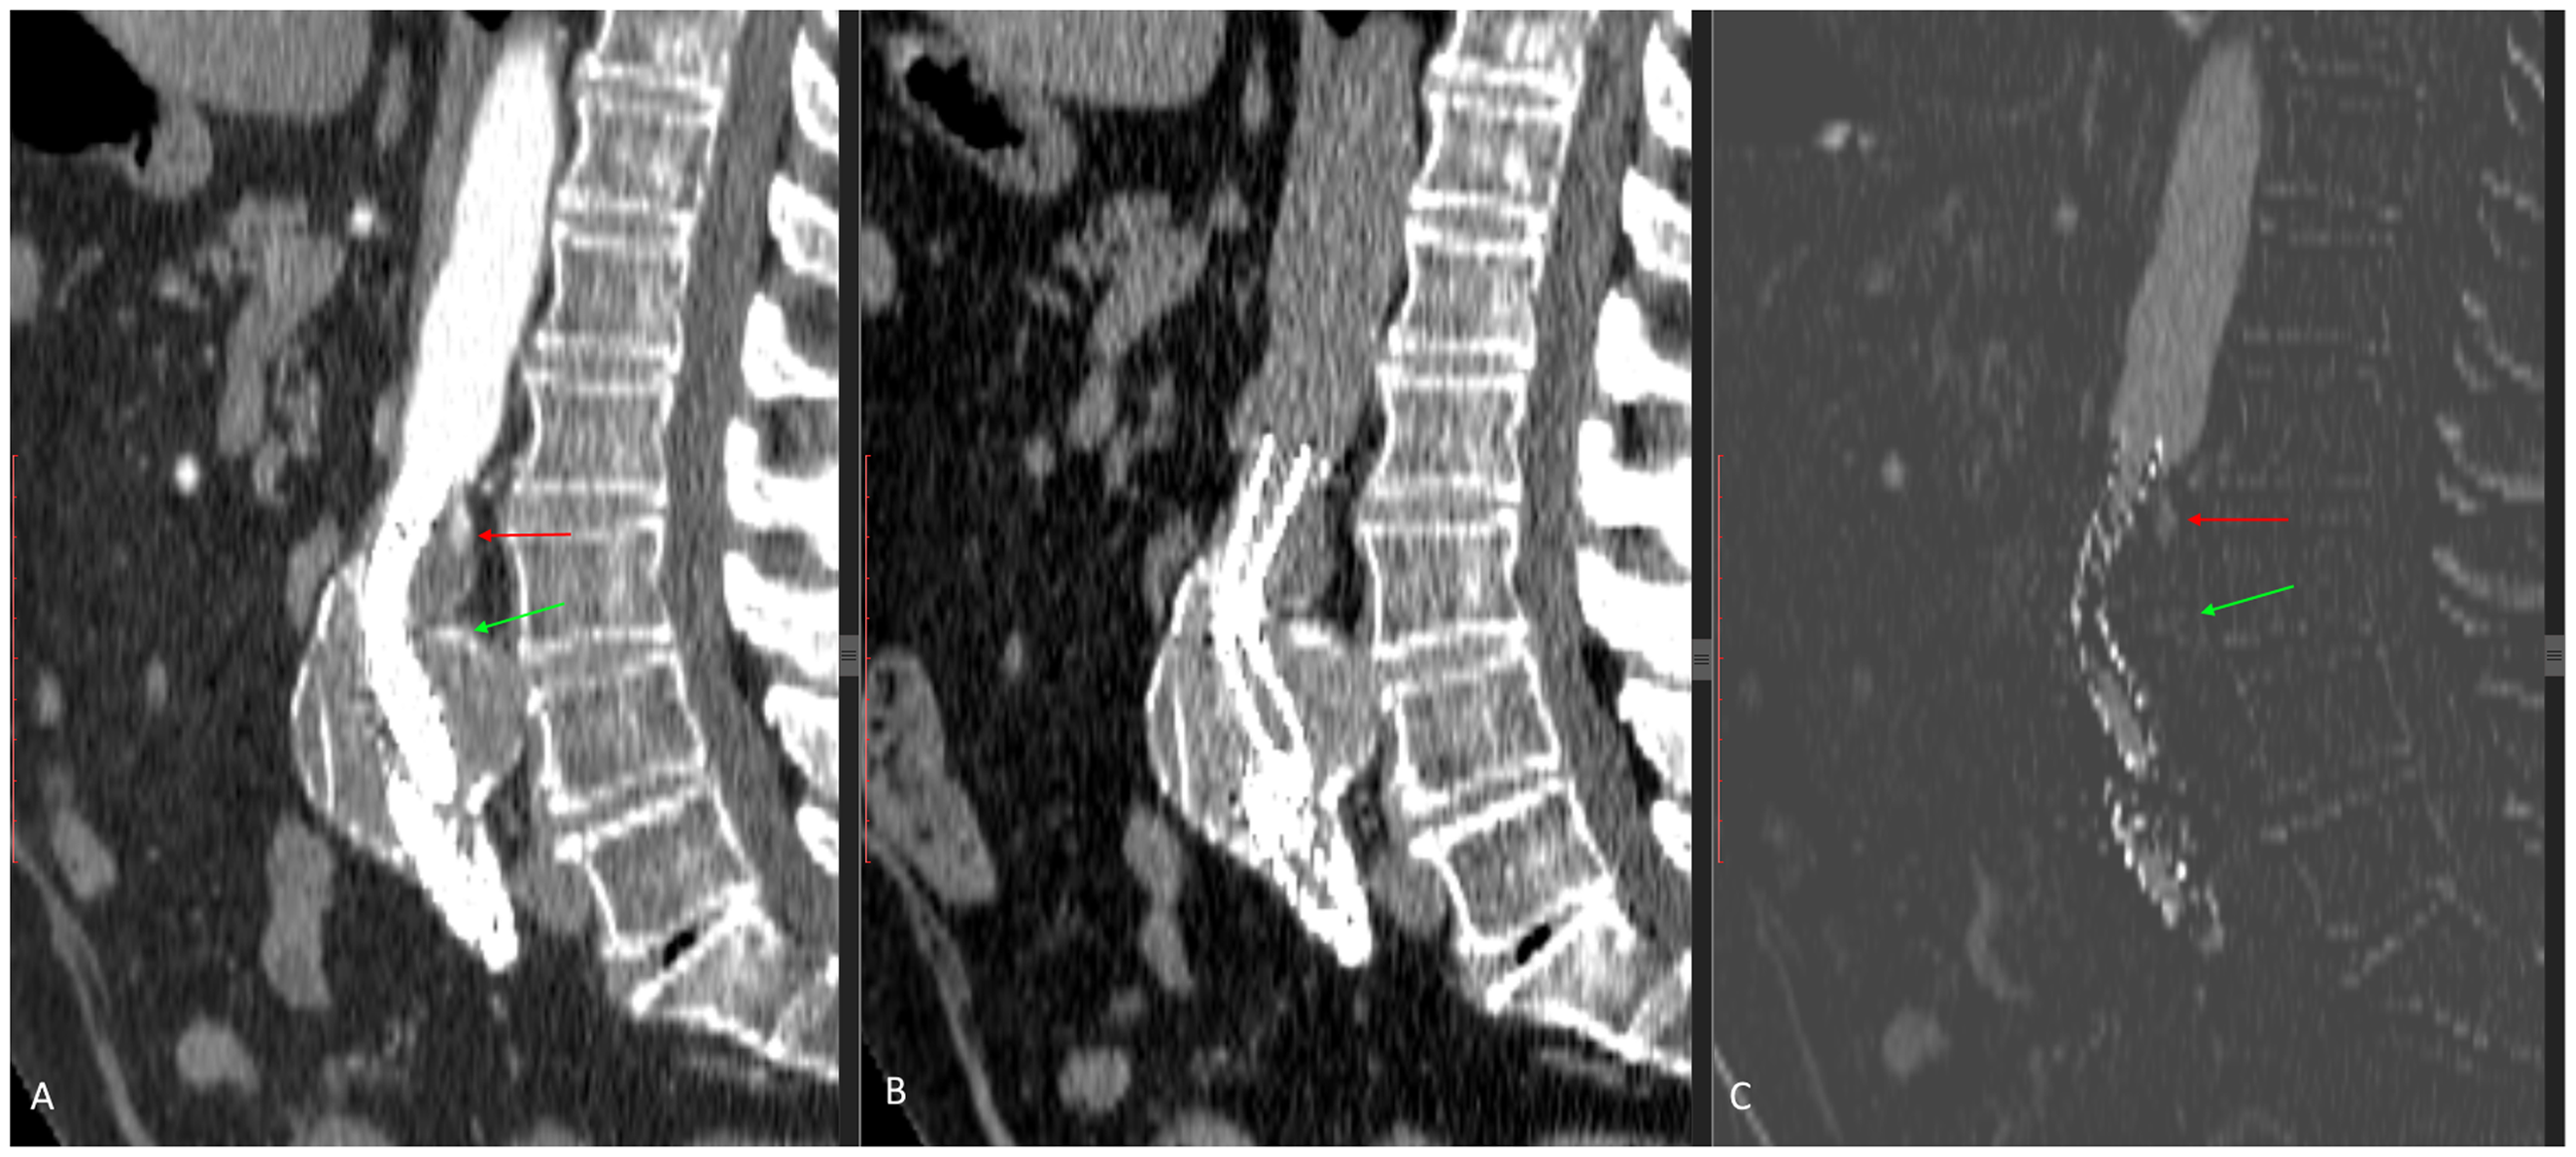
(a) Arterial phase CT scan with two suspect areas (red and green arrow). (b) Non-contrast CT scan after alignment, (c) subtraction CT scan with an endoleak in the upper area (red arrow) and no endoleak in the lower aneurysm (green arrow).
Both the arterial phase and non-contrast series of the second patient showed a high-intensity area anterior of the endobags (Figure 5(a) and (b)). No endoleak was reported in the radiology report, but the subtraction CT identifies an endoleak, suggestive for type IA (Figure 5(c)). The endoleak was treated by coil-embolization.
(a) Arterial phase CT scan with a high amount of contrast at the endobag edge. (b) Non-contrast CT scan with the contrast at the endobag edges. (c) Subtraction CT scan with a visible endoleak along the endobag.
The third patient had an increase in maximum aneurysm diameter of 10 mm at two years’ follow-up. The arterial phase and non-contrast CT series showed an endoleak with contrast along the endobag without connection to the aneurysm (Figure 6(a) and (b)). The subtraction scan clearly confirmed the endoleak with absence of contrast in the aneurysm sac (Figure 6(c)). On the most recent follow-up (28 months), the aneurysm diameter stabilized without further interventions.
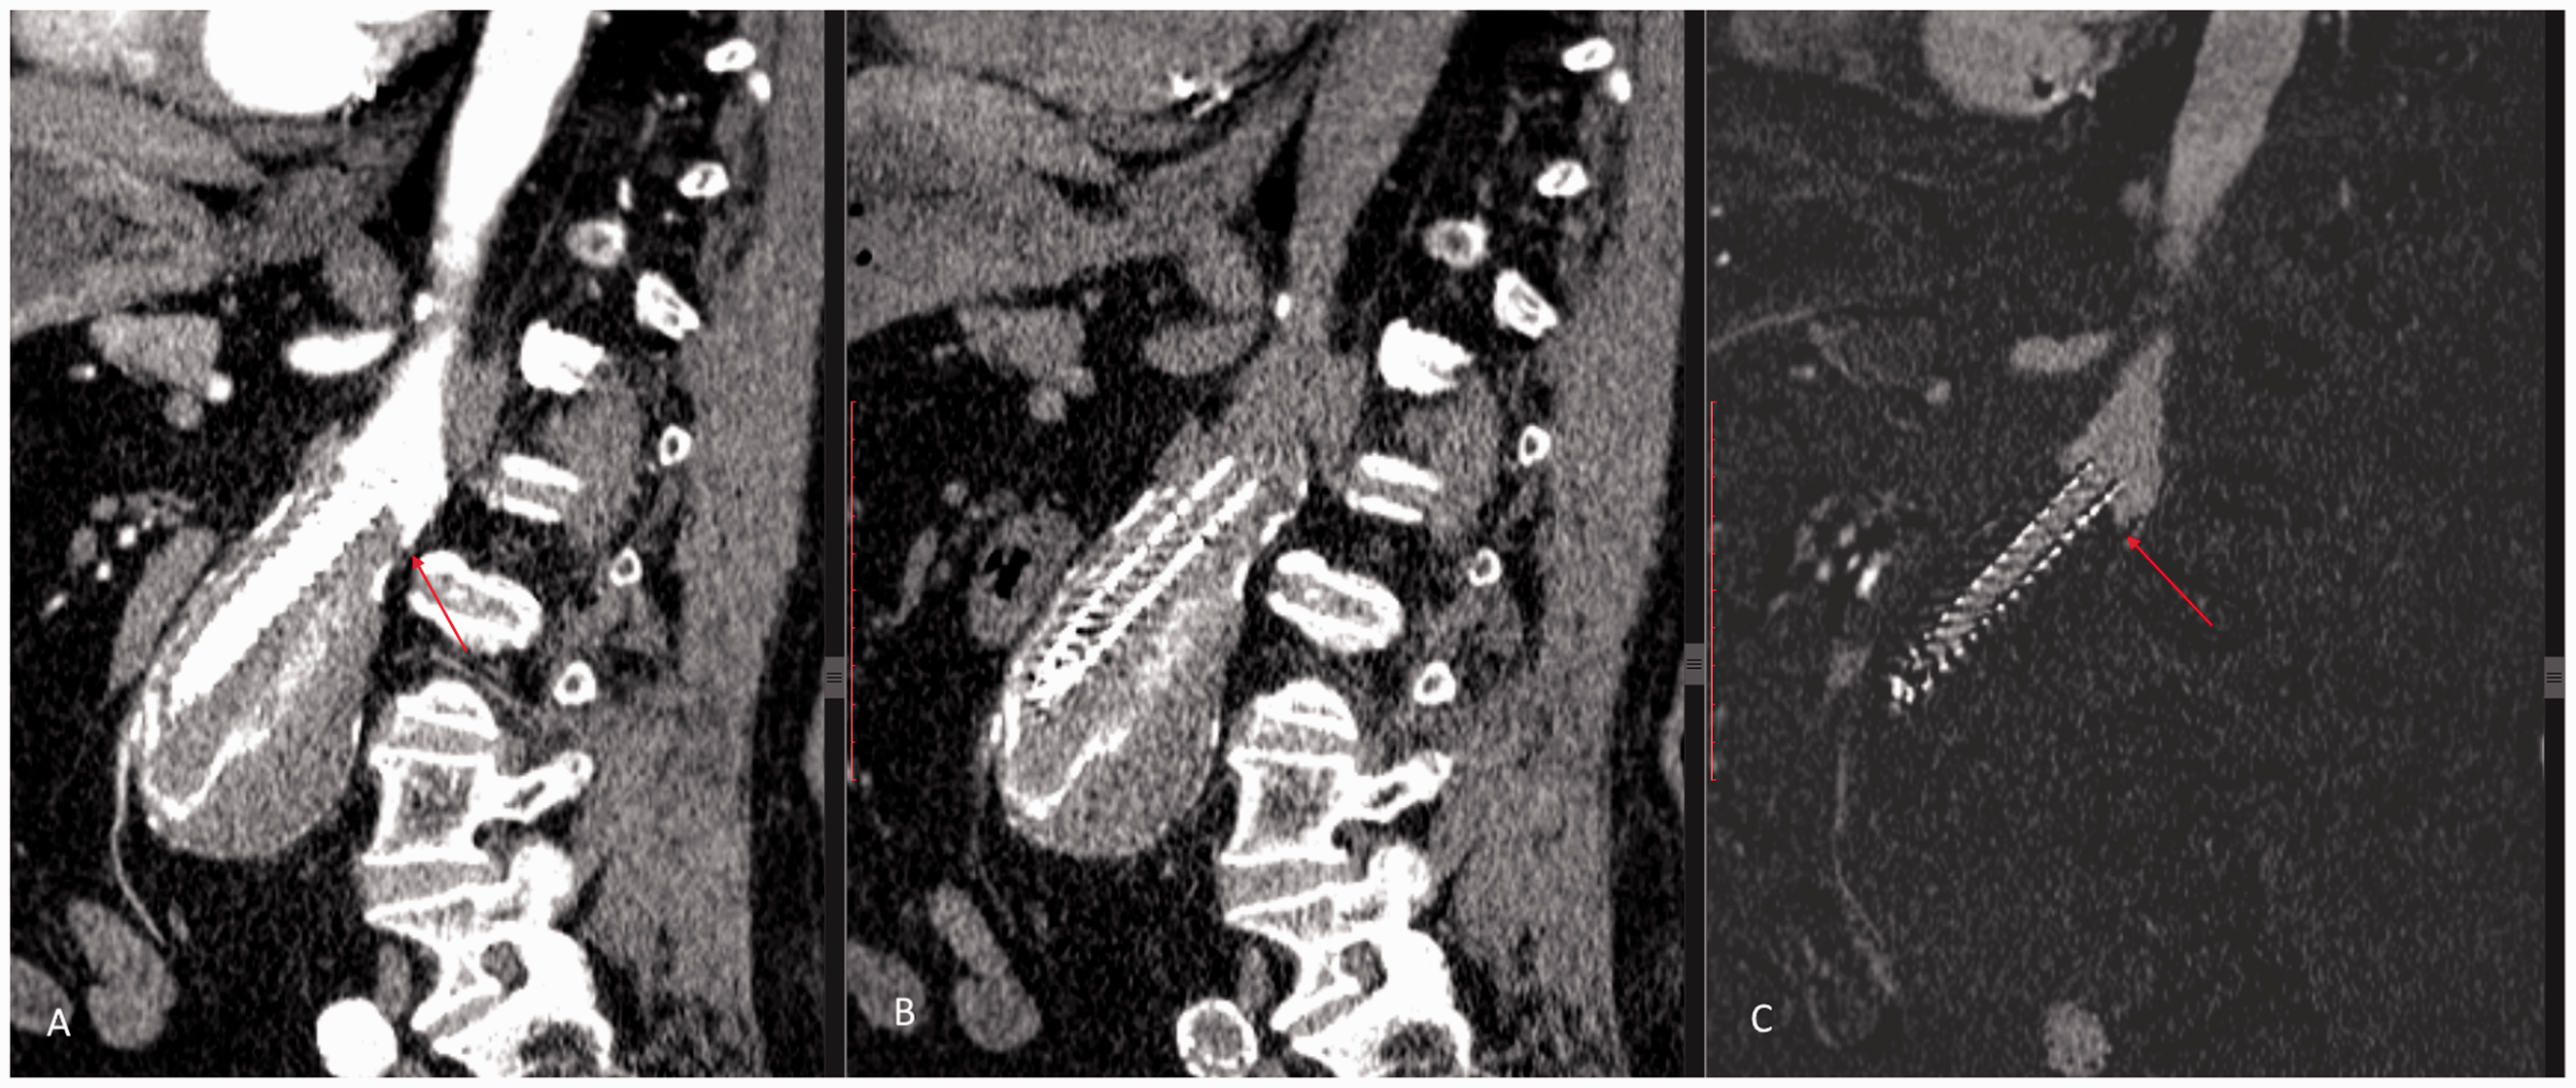
(a) Arterial phase CT scan with contrast at the posterior aorta wall (red arrow). (b) Non-contrast CT scan with calcifications at the posterior wall of the aorta. (c) Subtraction CT scan, no sign of contrast reaching the aneurysm (red arrow).
Discussion
In the present study, we illustrated the possible merit of subtraction CT imaging using a post-processing software algorithm for the detection of endoleaks after EVAS. The accuracy of alignment of the non-contrast-enhanced and contrast-enhanced CT scan was excellent with a median RMSE of only 0.53 mm, which is within the spatial resolution of the CT scans. Detection of endoleaks around the edges of the polymer-filled endobags or close to areas of calcification might be improved by the current method. The current evaluation was performed post-EVAS because of the variable appearance of the endobags on follow-up CT-A. However, this technique can also be of value post-EVAR.
Early detection of post-EVAS type IA and IB endoleaks is mandatory because they can progress and increase pressure inside the aneurysm, destabilize the Nellix endosystem and lead to seal failures. These endoleaks can be hard to detect due to the attenuation similar to contrast remaining in the endobags (especially at the borders of the endobags and during the first year of follow-up), areas of calcification or contrast-enhanced blood flowing through the stent lumen. Subtraction imaging can help to exclude structures from the final image that are already attenuated on the pre-contrast scan and that do not indicate endoleak. This ensures that attenuated areas in the final image can only be caused by contrast-enhanced blood. Therefore, not only the presence of endoleaks can be more readily visualized but also the extent and location of the endoleak, as classified by Van den Ham et al. 10 This is relevant as the different types of endoleak might require a different management and follow-up strategy.
Only a few studies with a small number of patients describe the appearances on surveillance CT imaging following EVAS8,9,11 and the largest experience, from the EVAS Forward Global registry was translated into a consensus document. 6 This paper underlined the difficulties encountered during surveillance imaging as described above, and it was highly recommended to obtain a non-contrast phase in addition to a contrast-enhanced phase to detect subtle endoleaks and differentiate these from calcifications or enhancement inside the endobags.
A reasonable alternative for CT follow-up could be duplex ultrasound (DUS) or contrast-enhanced DUS. The stents, endobags, aortic thrombus, aortic wall are readily visualized, and aortic diameters, flow through stents and the presence of endoleaks can be evaluated. 6 In addition to the general limiting factors such as patient size or presence of bowel gas, the presence of air in the endobags can limit the visualization of stent lumen or parts of the aneurysm sac. 6 Currently, there are no high-quality studies comparing surveillance via DUS or CT, and most centers have adopted CT as the primary modality for follow-up. Advantages include the more detailed anatomical information and reliable information about stent position or migration. 12 In the near future, a follow-up strategy including an early follow-up CT followed up by yearly DUS, similar to standard EVAR might become first choice. However, at this moment, less is known about the imaging appearances, and long-term behaviour of the EVAS system compared to standard EVAR and further studies comparing both modalities for their accuracy for the early detection of complications are needed. Whatever strategy is followed, at the time a CT scan is indicated, it should be performed in a way that maximally informs us. A protocol including multiple phases whether or not complemented by subtraction imaging as described in the present study seems reasonable.
Although subtraction CT imaging seems a promising adjunct for the surveillance after EVAS, there are some limitations to the technique and findings of the present study. First, an extra non-contrast-enhanced CT needs to be obtained. Although the associated additional radiation is limited, the extra non-contrast phase will take some additional time to obtain. It is crucial to keep important imaging parameters identical (i.e. slice thickness) and to avoid motion artefacts). Furthermore, the imaging alignment needs to be performed and checked for accuracy, which could further increase the total time of the investigation. Improvements in software, algorithms and processing power could reduce this time and improve workflow. The software algorithm used for image processing in the present study is for investigational use only, and currently, there is no FDA or CE approval, which limits its use in daily practice.
A principal difference between EVAS and EVAR is that in EVAS, the aneurysm sac is filled by the polymer bags and thereby obliterating the potential outflow pathways necessary to maintain flow for an endoleak to appear on contrast imaging studies. Due to the absence of liquid blood flow, thrombus is progressively formed as the aneurysm grows. Therefore, especially in EVAS, an endoleak can occur, leading to repressurization of the aneurysm sac without the endoleak being visible on contrast imaging. This means that if an endoleak cannot be determined, there may still be pressure on the aneurysm, and diameter or volume measurements should always be done on the post EVAS and EVAR CT scans. Although the number of patients included in this study is limited and insufficient to establish the accuracy, sensitivity and specificity of the test compared to the current gold standard, we clearly illustrated a proof of concept and the possible merit of the technique.
In conclusion, the present study illustrated the possible merit of subtraction CT imaging for the detection of small endoleaks during surveillance after EVAS. Alignment of different CT phases using a software algorithm was very accurate. Further studies are needed to establish the exact role of this technique during surveillance after EVAS compared to less invasive techniques like contrast-enhanced ultrasound.
Footnotes
Declaration of conflicting interests
The author(s) declared no potential conflicts of interest with respect to the research, authorship, and/or publication of this article.
Funding
The author(s) received no financial support for the research, authorship, and/or publication of this article.