
Abstract
Objective
Endovascular surgery is an important treatment modality in peripheral arterial disease. Digital subtraction angiography is the standard post revascularisation diagnostic tool to locate lesions and to evaluate the effect of an intervention. However, interpretation of digital subtraction angiography images is subjective and it is difficult to determine whether revascularisation has been sufficient for clinical improvement. A new technique is 2D perfusion angiography, which creates a 2D colour map and time density curve from the digital subtraction angiography scan for an objective evaluation of the results. However, its clinical relevance is unknown. The aim is to evaluate the association between 2D perfusion angiography parameters and clinical outcome after peripheral arterial interventions.
Methods
In this retrospective study, post revascularisation angiographic data and clinical data were reviewed of patients who underwent treatment of femoral-popliteal or femoral-tibial arteries. The outcome was assessed at three time points using three classification systems for peripheral arterial disease: Fontaine classification, American Medical Association whole person impairment classification (AMA) and average wound, ischemia, foot infection score. Post revascularisation angiographic data consisted of time density curves of the foot and lower leg which were extracted from the Syngo iFlow system (Siemens Healthineers). For each time density curve, five descriptive parameters were calculated: time of arrival, time to peak, mean transit time, wash-in rate and area under the curve. The association between the time density curve parameters and peripheral arterial disease classification systems was assessed using a regression analysis.
Results
Between July 2016 and December 2018, 103 patients underwent peripheral endovascular interventions in the hybrid operating room; 39 patients were suitable for analysis, of which 28 patients underwent digital subtraction angiography of the lower leg, 3 patients underwent digital subtraction angiography of the foot and 8 patients underwent digital subtraction angiography of both regions. Limited significant relations were found for time of arrival with Fontainde classification (B = 0.806, p = 0.043) and area under the curve with AMA classification (B = −0.027, p = 0.047).
Conclusion
In this retrospective study, time density curve parameters (time of arrival and area under the curve), measured in the lower leg, showed a limited significant association with two classification systems for peripheral arterial disease. Future prospective studies to determine the clinical relevance of this 2D perfusion angiography method should focus on standardisation of angiography protocols and comparison of pre- and post-intervention parameters.
Introduction
The prevalence of peripheral arterial disease (PAD) is estimated <10% for people aged below 55 and reaches >20% by the age of 80.1–4 Stenosis of arteries in the lower extremity due to atherosclerosis may lead to intermittent claudication, slowly or non-healing ulcerations, or gangrene.1,5–8
Endovascular procedures such as percutaneous transluminal angioplasty (PTA) with or without stenting are widely used as an effective treatment.2,4,8,9 During these procedures, digital subtraction angiography (DSA) is used to detect the stenosis and confirm whether the stenosis has resolved during the treatment.2,10,11 Furthermore, DSA is used by the vascular surgeon and interventionalist to visually determine whether blood flow has increased after intervention. The presence of wound blush can be used as an angiographic predictive variable for wound healing. 12 Although increased flow on the angiogram and the presence of wound blush serve as markers for increased perfusion, these parameters remain subjective and are difficult to quantify.13–15
A new technique which can be used to evaluate the results of revascularisation is 2D perfusion angiography (2DPA). This image processing technique creates a 2D colour map and a time density curve (TDC) from the DSA images. 15 The TDC can be used to extract quantitative parameters. 13 These parameters may be used to evaluate the quality of reperfusion and may predict the outcome of a vascular intervention.13,16
Because 2DPA is a relatively new technique, the number of studies is limited and has mostly focused on the reliability and reproducibility of the colour map and TDC. Studies on the value of 2DPA for the prediction of clinical outcome are scarce.10,16–18 This study focusses on the validation of 2D perfusion angiography, comparing quantitative parameters extracted from the TDC with validated classification systems for PAD.
Methods
Ethics statement
Human investigation review board approval was obtained (Meander Medical Centre, TWO 18–85).
Patient population
Patients were included based on the following criteria: endovascular surgery at the femoral-tibial or femoral-popliteal levels in patients with PAD and post revascularisation DSA scans acquired in the hybrid operating room (Artis Zeego, Siemens) equipped with iFlow (Siemens Healthineers, Erlangen, Germany) software. Exclusion criteria were patients treated proximal to the common femoral artery (AFC), no PAD present, no follow-up and non-compatible DSA scans.
Clinical data collection
Data were retrospectively collected starting from the opening of our hybrid operating room in July 2016 until December 2018. Castor EDC (version 2018.6, Castor, Amsterdam, The Netherlands) was used to build an electronic case report form to store data. For each patient, clinical scores from three validated classification systems were perceived at various time points (t= ± 1 month, t= ± 6months and t= ± 1 year). The classification systems were Fontaine classification, American Medical Association whole person impairment classification (AMA) and average wound, ischemia, foot infection (WIfI) score. 19 An altered version of the WIfI score was used, as described by Darling et al. 20 This is a mean WIfI score between 0 and 3 enabling inclusion of patients with missing follow-up data in any of the three WIfI components. 20 Fontaine, AMA and adapted WIfI classifications were scored as missing data after reintervention or major amputation, which meant end of follow-up and exclusion from later follow-up analysis.
2DPA data
Included patients underwent a peri-operative DSA scan of the lower leg and/or foot after revascularisation. DSA scans were acquired at a frame rate of 2 frames per second (F/s) with the Siemens Artis Zeego C-arm, combined with Artis Zeego software from Siemens Healthineers (version VD11D, Siemens Healthcare, Erlangen, Germany). Intra-arterial contrast was administered through a vascular access sheath or through a catheter. Method of administration was either by pump injection or injection by hand.
Image analysis took place using Syngo WP post-processing software from Siemens Healthineers (version VD20B, Siemens Healthcare, Erlangen, Germany). A 2DPA colour map was created from the DSA images. From this colour map, a TDC from the in- and outflow of the contrast was extracted in a selected region of interest (ROI). The ROI of the lower leg was defined between the bifurcation of the tibioperoneal trunk and the tibiotalar joint. The ROI of the foot was defined between the perforating branch of the fibular artery and the distal joints of the metatarsals. In lateral direction, the shape of the leg or foot was followed with a free-hand ROI selection tool (shown in Figure 1). The TDC of the ROI was exported to a comma-separated value file and imported into MATLAB 2018a (version 9.4, MathWorks, Natick, MA, USA) for parameter extraction. Five parameters were calculated from the TDC, which are defined in Figure 2; time of arrival (TOA), time to peak (TTP), mean transit time (MTT), area under the curve (AUC) and wash-in rate (WiR).

Colour map with ROI of the lower leg (left) and foot (right). The white contour indicates the selected ROI used for TDC extraction.
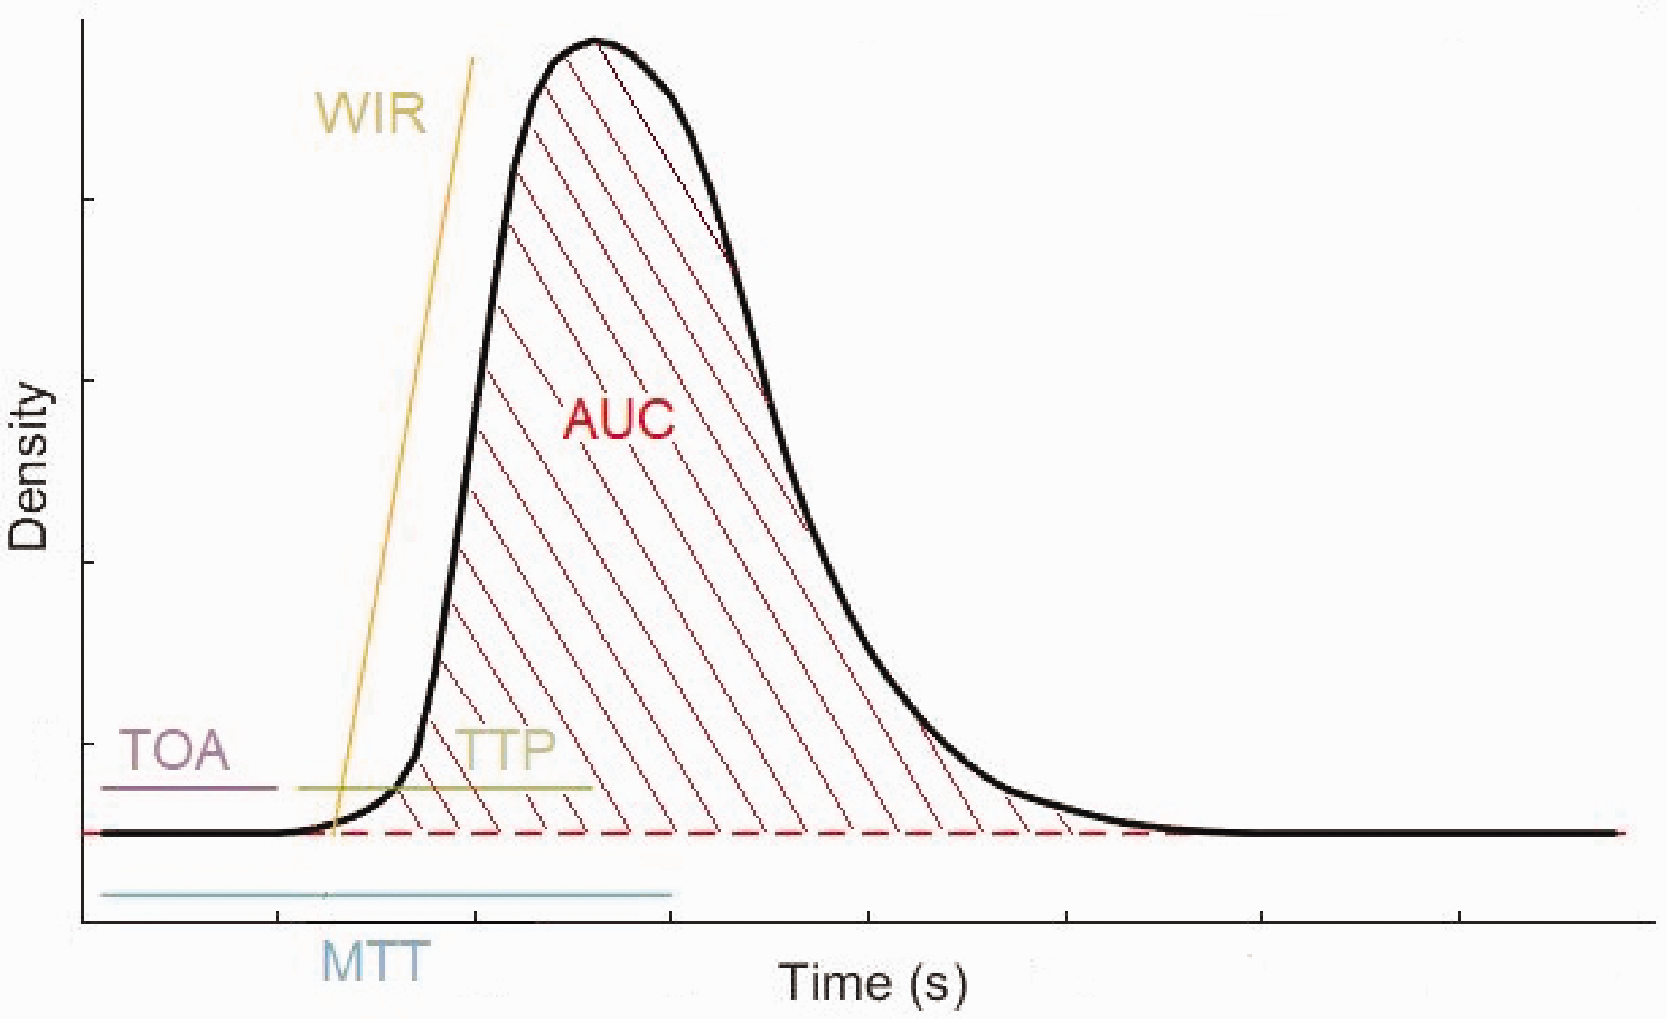
Quantitative perfusion parameters from the time density curve. TOA: time of arrival, TTP: time to peak, MTT: mean transit time, WIR: wash-in-rate, AUC: area under the curve.
Analysis
Data were analysed with SPSS (version 25.0, IBM SPSS Statistics for Windows, IBM Corp. Released 2017.). TDCs of the lower leg and foot were calculated separately. A descriptive statistical analysis was performed for the various TDC parameters at three time points. Furthermore, a regression analysis was executed to assess the association between TDC parameters and PAD classification systems. For each follow-up time point, association between the TDC parameters and PAD classification systems was calculated separately. Ordinal regressions were executed for the Fontaine and AMA score and a linear regression was executed for the mean WIfI score. 2DPA parameters were correlated to reintervention or ampuatation with Pearson correlation.
Results
One hundred and three patients underwent PTA with or without stenting in the femoral-popliteal or femoral-tibial trajectory in our hybrid operating room between July 2016 and December 2018. From these 103 patients, 64 were excluded mainly due to missing DSA scans in the Syngo iFlow system (19.4%), DSA scans only acquired from the upper-leg (12.6%), endovascular treatment for popliteal aneurysm (9.7%), inferior data quality for analysis (7.7%) and missing follow-up data (6.8%). In total 39 patients were included with a Fontaine classification range of II to IV. An inclusion and exclusion flow chart is presented in Figure 3, and patient characteristics are depicted in Table 1.

Flowchart for inclusion of the patients. DSA: digital subtraction angiography.
Patient demographics preoperative.
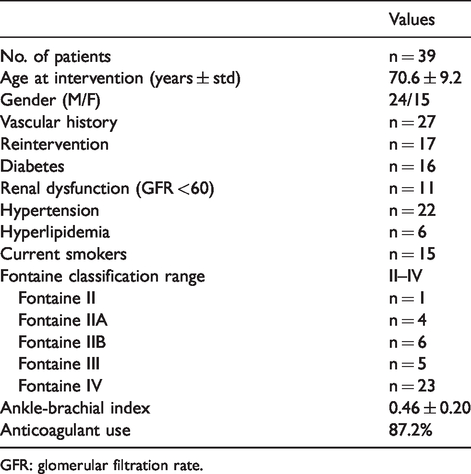
GFR: glomerular filtration rate.
For 22 patients (57%), PTA was performed at one location distal to the common femoral artery. Thirteen patients (33%) were treated at two locations and 4 patients (10%) were treated at three locations. From 11 patients (28%), a DSA of the foot was acquired, and from 36 patients (92%), a DSA of the lower leg was obtained at the end of the procedure. In all patients, DSA images before intervention were performed in different regions and angles than after the intervention. An overview of available follow-up data from the patient files is depicted in Table 2. Seven patients underwent reintervention and two patients underwent major amputation. Correlations between 2DPA parameters and reintervention or amputation were not significant (p > 0.177).
Study group follow-up information.

AMA: American Medical Association whole person impairment classification; WIfI: average wound, ischemia, foot infection.
An ordinal regression analysis was performed for comparing TDC parameters with the AMA score and Fontaine classification, see Tables 3 and 4. For the Fontaine classification at 12-month follow-up, all assumptions of ordinal regression were met, and a significant association was found for the TOA parameter (B = 0.806, p = 0.043). Also, for the AMA score in follow-up 1, all assumptions of ordinal regression were met, and a significant association was found for the AUC (B = –0.027, p = 0.047). A linear regression was performed for comparison with the mean WIfI score, see Table 5. No statistically significant relationship was found for this classification system.
Degree of association with the Fontaine classification for each TDC parameter and follow-up moment.
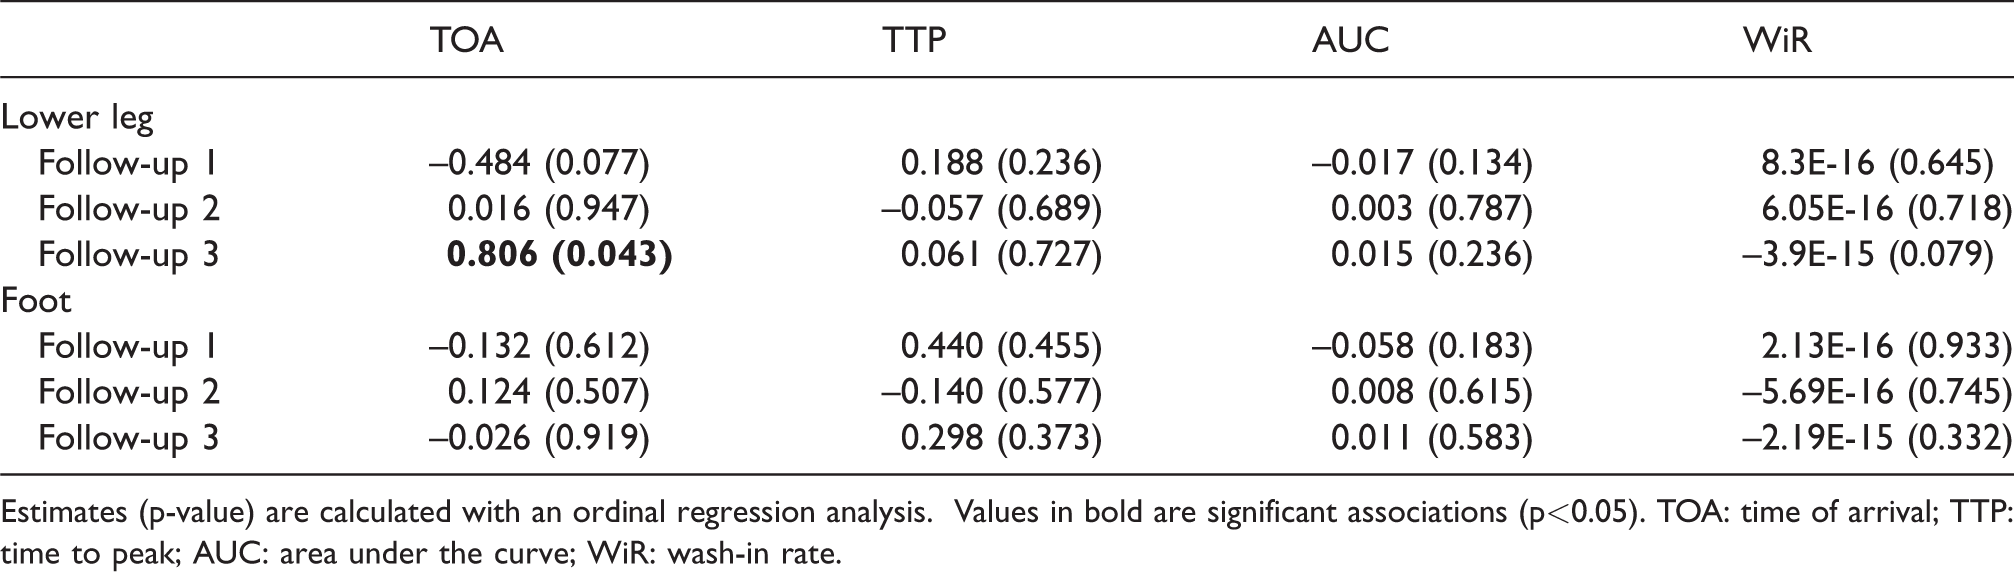
Estimates (p-value) are calculated with an ordinal regression analysis. Values in bold are significant associations (p<0.05). TOA: time of arrival; TTP: time to peak; AUC: area under the curve; WiR: wash-in rate.
Degree of association with the AMA classification for each TDC parameter and follow-up moment.
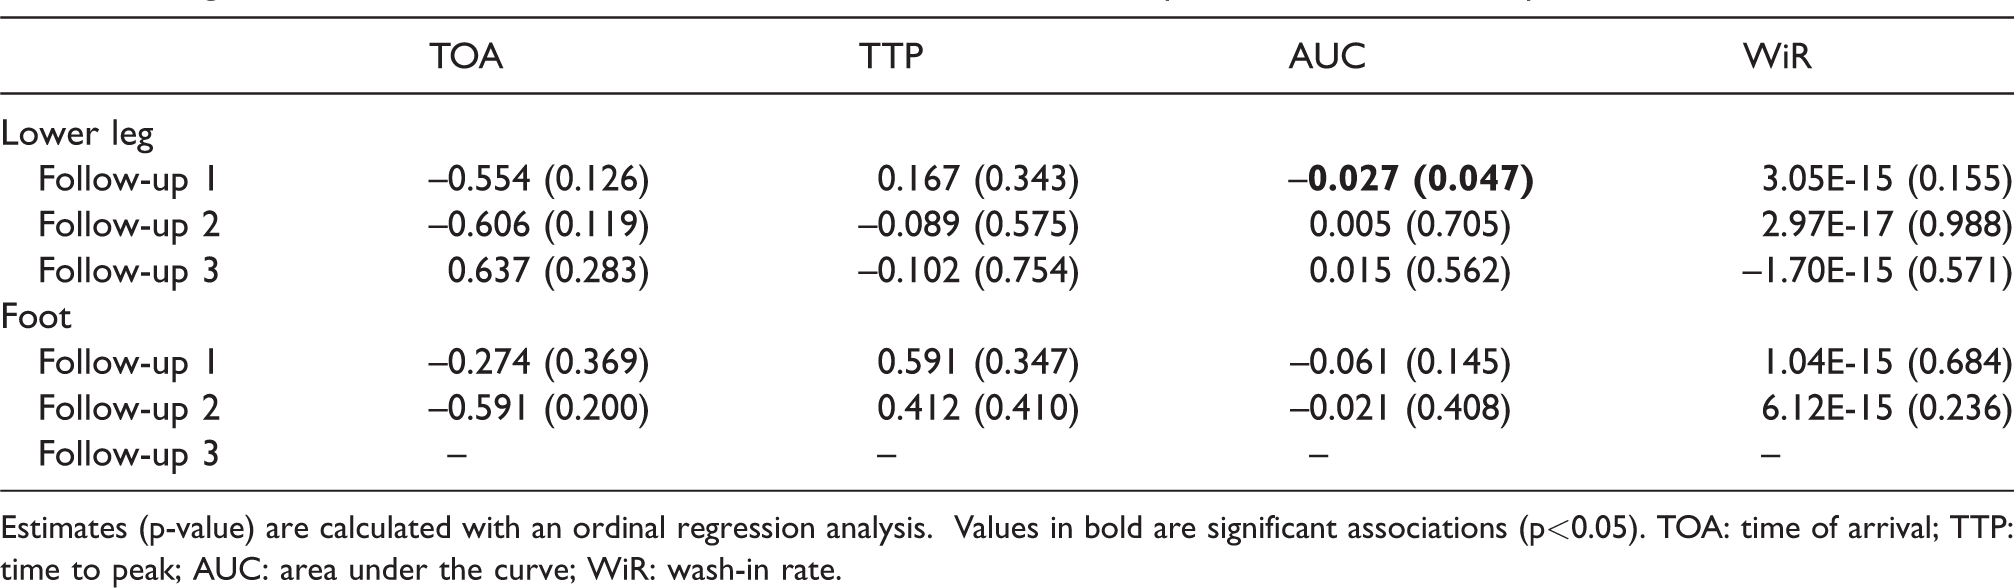
Estimates (p-value) are calculated with an ordinal regression analysis. Values in bold are significant associations (p<0.05). TOA: time of arrival; TTP: time to peak; AUC: area under the curve; WiR: wash-in rate.
Degree of association with the Average WIfI classification for each follow-up moment.

R2 and significance levels are calculated with a linear regression analysis.
Evidence of multicollinearity was found for the MTT and AUC parameters. Therefore, all regressions were performed twice, by alternating between MTT and AUC. Equal results were found for both methods, and only results from the analysis with AUC, TOA, TTP and WiR are presented in this article.
To evaluate TDC’s after revascularization for similarities, curves of all DSA scans of the lower leg were visualised in a single graph (Figure 4(a)). There was no resemblance between most TDC curve shapes, indicating the diversity of this measurement. However, similarities are observed for graph 2, 3, 26 and 34 (Figure 4(b)), which show a long, smooth curve with an elongated outflow, compared to the inflow.
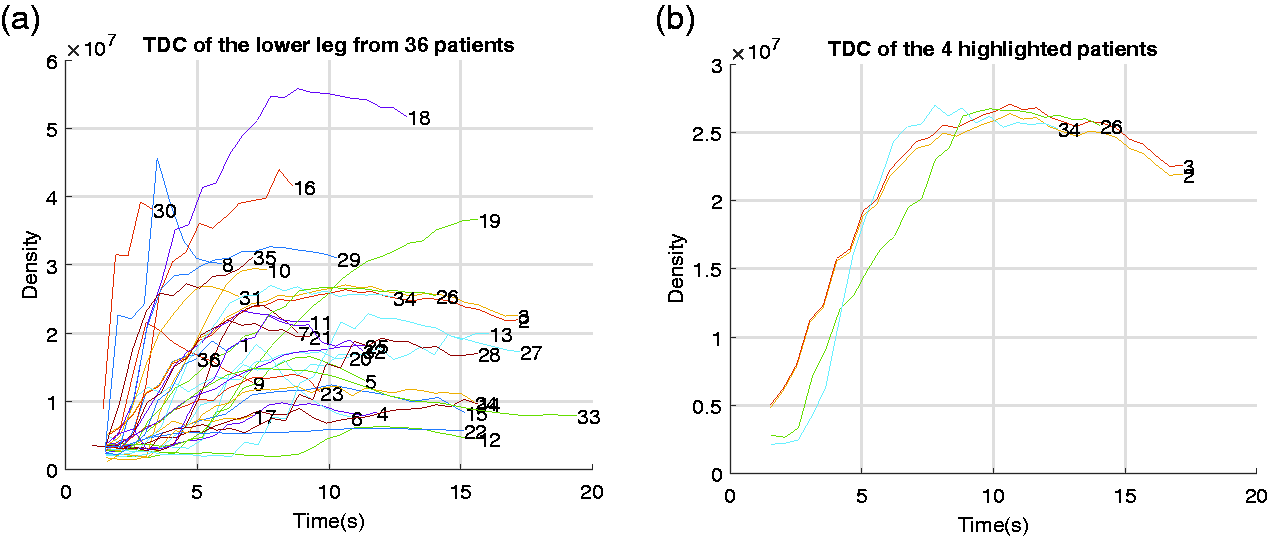
(a) The TDCs of the lower leg from 36 patients in a single graph. This graph illustrates the diversity in flow between patients. (b) Graph of 4 patients with a similar TDC. TDC: time density curve.
Discussion
The aim of this study was to determine the value of post revascularisation 2DPA to predict clinical outcome in daily vascular practice. At present, many new angio suites and hybrid operating rooms are built in hospitals worldwide. These rooms are equipped with software packages, including 2DPA software. Nevertheless, interpretation of this technique and its clinical value are unknown. In our hybrid operating room, we use the Siemens software to produce quantitative parameters extracted from the TDC. For this study, these data were compared with clinical outcome in patients that were treated for PAD by endovascular means.
It was hypothesised that 2DPA is a valuable tool to predict clinical outcome. Previous unpublished work in our hospital setting showed that Syngo iFlow is a reliable technique to quantify flow without intra- and interobserver variability for multiple regions of interest. To our knowledge, there are no previous studies comparing 2DPA perfusion parameters with clinical outcome in patients that were treated for peripheral arterial disease. A literature search revealed work on change in ratio of arterial flow proximal and distal to the stenosis, 10 comparing parameters extracted from smaller regions of the foot to only the Fontaine score, 17 examining a group of only five patients, 16 and evaluating 2DPA parameters, without comparison to clinical outcome. 18 In our study, we show that there was limited association between the TDC (AUC and TOA) parameters and PAD classification scores when looking at the foot or leg as a region of interest. AUC and TOA correlate with DSA imaging improvement, indicating an increased contrast volume passing through the arteries and accelerated arrival time of contrast in the imaged region, respectively. Clinical scores that did show a correlation with iFlow consisted merely of clinical degree of ischemia (Fontaine) or extremity impairment (AMA), whereas no relation was found with ulcer healing (WIfI). Most patients were, however, treated for critical limb ischemia with ulcers and gangrene. Especially in the patient cohort with tissue loss, we need an additive modality to help improve our endovascular strategies. Focus should be on improving reliability of iFlow measurement. Although this is a small retrospective study with limitations, some recommendations to achieve this can be derived from this study, which may help to design a future prospective study.
In our daily practice, no standardised protocol is used for image acquisition, leading to some technical limitations. First, movement artefacts interfered with our 2DPA measurements. Foot immobilisation during the endovascular procedure using a footrest to limit movements may prove beneficial. 21 Moreover, a footrest could ensure an equivalent imaging position of the foot and lower leg before and after intervention. This enables analysis of flow improvement by calculating ratios between the parameters before and after intervention. Additionally, this leads to less variation in imaging position between patients, which caused a diverse selection of imaged ROI’s in our study. Furthermore, detailed information was lacking about the method of contrast administration, which involves the placement of the catheter tip and the method of contrast injection. Variations within these methods can affect the shape of the TDC. Therefore, a standardised contrast bolus injection by pump with the tip of the catheter in a standardised position is necessary to ensure reproducibility of the TDC. The fourth limitation is the variability in imaged contrast out-flow, which greatly reduces the AUC and MTT. These differences can be observed in Figure 4. In future research, a standardised cut-off point should be used to ensure reproducibility of the TDC. This cut-off point should include the venous outflow since this provides important information about tissue perfusion. Lastly, care should be taken to limit radiation exposure with these new protocols.
Next to the four protocol limitations, another limitation of this study is the limited availability of DSA scans of the region of the foot. The foot is an end-organ, which makes it interesting for imaging due to the expected change in capillary perfusion, especially when the clinical problem is ulceration on the foot or toes. An increase in volume flow will only result in wound healing when it also translates into sufficient perfusion of the capillaries in the foot. 18 However, intermittent claudication is caused by reduced blood flow to the muscles of the lower leg, indicating that the recovery of the microcirculation in the lower leg is of importance for reducing claudication intermittent symptoms. 22 Therefore, imaging of both the leg and the foot can be of importance for end-stage evaluation in patients with PAD. Apart from variations due to technical issues, iFlow curves may also vary due to patient- and disease-related differences between individual patients, as proposed by Jens et al. 21
Conclusion
In conclusion, in this study, only a limited association was found between the TDC parameters and PAD classification scores. Only TOA, measured in the lower leg, showed a significant association with the Fontaine and AMA classification. No association was found with the average WIfI score. Moreover, a great variation in iFlow curves was observed between patients. Some important practical limitations of our current technique were discussed. New standardised protocols may offer improved predictive value of 2D perfusion angiography using iFlow in the future.
Footnotes
Declaration of conflicting interests
The author(s) declared no potential conflicts of interest with respect to the research, authorship, and/or publication of this article.
Funding
The author(s) received no financial support for the research, authorship, and/or publication of this article.