
Abstract
Objectives
The increase in carotid artery blood flow velocity is a measure of the severity of the carotid artery stenosis caused by atherosclerosis. Carotid artery stenosis is progressive and is of great importance due to the risk of stroke it creates. As an alternative to radiological examinations in these patients, patient follow-up can be facilitated by associating novel laboratory parameters with the severity of stenosis. In this study, we aimed to investigate the effect of the calculated plasma osmolality and atherogenic index of plasma on carotid artery blood flow velocities in patients with carotid artery stenosis.
Methods
A total of 161 patients diagnosed with carotid artery stenosis who admitted to our clinic between May 2018 and May 2020 were retrospectively analyzed. According to the carotid artery blood flow velocities measured with the Doppler ultrasonography, the patients were divided into two groups as “Normal flow velocity group” (n = 62) and “Increased flow velocity group” (n = 99).
Results
The calculated plasma osmolality, atherogenic index of plasma, and mean platelet volume were significantly associated with increased carotid artery blood flow velocity (p < 0.001, p < 0.001, p = 0.006; respectively). Calculated plasma osmolality and atherogenic index of plasma were identified as independent predictors of increase in carotid artery blood flow velocity (p < 0.001, p < 0.001; respectively). In the Receiver Operating Characteristic curve analysis, the plasma osmolality cut-off value, which predicts the increase in carotid artery blood flow velocity was found to be 291.45 mOsm/kg (Area Under the Curve: 0.746, p < 0.001, 65.7% sensitivity, and 67.7% specificity), and atherogenic index of plasma cut-off value was 0.20 (Area Under the Curve: 0.735, p < 0.001, 65.7% sensitivity, and 66.1% specificity).
Conclusion
There was a significant relationship between the increase in carotid artery blood flow velocity and the increase in plasma osmolality and atherogenic index of plasma values. As a result, we can predict the increase in carotid artery blood flow velocity, that is, the increase in the severity of the carotid artery stenosis, with plasma osmolality and atherogenic index of plasma values that can be calculated simply from routine biochemical tests.
Introduction
Stroke is the second leading cause of mortality in the world after cardiovascular diseases, with 80% ischemia in its etiology. In addition, 20%–30% of strokes are associated with extracranial carotid artery atherosclerosis. 1 It is important to diagnose stenosis caused by atherosclerotic plaques in carotid arteries, because it is progressive. In the North American Symptomatic Carotid Endarterectomy Trial study, 70% of patients with carotid artery stenosis had a stroke rate of 24% after 18 months, and the stroke rate of those with 50% to 69% stenosis was 22% within five years. 2 The first diagnostic test recommended in the diagnosis of carotid artery stenosis is Doppler ultrasonography (DUS), which is effective in evaluating the atherosclerotic plaque type and morphology, blood flow velocity, and degree of stenosis. Its sensitivity is 92.6%, and its specificity is 97%. The biggest disadvantage of DUS is that it is an operator-dependent examination. 3 , 4 For this reason, clinical and laboratory findings are also important in the follow-up of patients diagnosed with carotid artery stenosis.
Plasma osmolality is managed by the body according to the balance of fluid and electrolytes and is an indicator of extracellular fluid and body hydration. It can be calculated with fasting blood glucose, Blood Urea Nitrogen (BUN), and sodium (Na). It is known that plasma hyperosmolality affects endothelial cells, initiates atherosclerotic processes and inflammation, and causing the progression. 5 The negative effects of diabetes mellitus, renal failure, hyponatremia, or hypernatremia on endothelial cells and atherosclerosis are well known.6–8 However, to the best of our knowledge, there is no study in the literature investigating the effect of plasma osmolality on atherosclerotic plaques in the carotid arteries.
Hyperlipidemia is considered to be a risk factor for the atherosclerosis development. Atherosclerotic processes begin in coronary vascular bed and peripheral arteries with the effect of plasma lipids on endothelial cells and with their migration to the subintimal layer. Studies were conducted to examine the relations between plasma lipid concentrations and their blood-carrier lipoproteins and the development of atherosclerosis. It is already known that elevated triglyceride (TG) levels and low high-density lipoprotein cholesterol (HDL-C) levels are associated with increased development of atherosclerosis and atherosclerosis-associated cardiovascular disease. 9 Recent studies have shown that the atherogenic index of plasma (AIP), which is calculated by logarithmic (log) conversion of the TG/HDL-C rate, is a novel and strong predictor for atherosclerosis. 10 An increase in TG levels or a decrease in HDL-C levels causes an increase in AIP values and this has been associated with the development of atherosclerosis. 11 According to recent studies, elevated AIP values can be a good biomarker for the risk of cardiovascular diseases. 12 , 13
In carotid artery stenosis, carotid artery blood flow velocities measured by DUS are known to increase in the stenosis region except mild stenosis (< 50% stenosis) and total and subtotal stenosis. 14 In carotid artery stenosis, as an alternative to radiological imaging methods, new parameters that can be evaluated from routine biochemical tests should be associated with the severity of stenosis. In this way, the increase in the severity of the disease can be followed and the physician can plan the most appropriate treatment. The purpose of this study was to investigate the effect of calculated plasma osmolality and AIP on carotid artery blood flow velocities in patients with carotid artery stenosis.
Materials and methods
Patients and study design
A total of 161 patients diagnosed with carotid artery stenosis who admitted to our clinic between May 2018 and May 2020 were included in this retrospective study. The patient data were obtained from the hospital registration system, and the study was approved by Adiyaman University Ethics Board (approval number: 2020/6–29).
Pulsed wave DUS and color-flow DUS applications are performed together in the examination of carotid arteries with DUS. Color-flow DUS is the most sensitive method, especially in <50% stenosis where blood flow velocities do not change. 14 In our study, internal carotid artery (ICA) peak systolic flow velocity (PSV), end-diastolic flow velocity (EDV), and the systolic flow velocity ratios calculated by dividing ICA PSV by common carotid artery (CCA) PSV (ICA/CCA PSV ratio) measured by DUS were evaluated in patients. According to the defined velocity-based DUS criteria, patients’ carotid artery stenosis was categorized as mild (ICA PSV <125 cm/s, <50% stenosis), moderate (125 ≤ ICA PSV ≤ 230 cm/s, 50%–69% stenosis), and severe (ICA PSV > 230 cm/s, ≥70% stenosis). 15
The patients with total carotid artery occlusion whose ICA PSV could not be measured or with subtotal carotid artery stenosis whose ICA PSV could not be measured correctly, those with a history of carotid endarterectomy or stenting, chronic renal or liver disease, systemic inflammatory disease, known malignancy or hematological problems, familial hyperlipidemia, statin or steroid drug use, and TG level ≥ 400 mg/dL were excluded from the study.
The mean ICA PSV measured by DUS in healthy people is 80–100 cm/s; however, it is 60–80 cm/s in the elderly, and it is known that blood flow velocity increases in ≥ 50% stenosis. 14 In our study, after the exclusion criteria were applied, 62 patients diagnosed with carotid artery stenosis and in the category of mild stenosis with a normal blood flow velocity were included in the study as “Normal flow velocity group.” And 99 patients (45 patients with moderate stenosis, 54 patients with severe stenosis) diagnosed with carotid artery stenosis and in the category of moderate and severe stenosis were included in the study as “Increased flow velocity group,” and these two groups were evaluated statistically. Also, the variables of patients were recorded in the mild, moderate, and severe stenosis categories for in order to examine in more detail.
The demographic data, comorbidities, and routine laboratory parameters were recorded. After 12 hours of fasting period, the blood samples taken from antecubital vein of patients were evaluated. The automatic blood counting device was used for full blood count (Abbott CELL-DYN Ruby; IL).Fasting blood glucose, Na, BUN, TG, total cholesterol (TC), HDL-C levels were analyzed with automatic analyzer (Abbott Architect 16000; IL). The low-density lipoprotein cholesterol (LDL-C) levels were calculated with the Friedewal Formula (TC = LDL-C + HDL-C + TG/5). 16
Calculation of plasma osmolality and AIP
The plasma osmolality was calculated with the following formula: Osmolality = (2 × Na) + (Glucose/18) + (BUN/2.8). The distribution range of normal plasma osmolality was defined as 275 –295 mOsm/kg. 17
The Log10 (TG/HDL-C) formula was used for calculating the AIP. Each concentration is expressed as mmol/L in this formula. 10
Statistical analysis
The SPSS 11.5 Program was used in the analysis of the data. As descriptive, the number of patients (percent) was used for qualitative variables and mean ± standard deviation and median (interquartile range) were used for quantitative variables. The normality distribution of the data was tested with the Shapiro–Wilk test. The difference between the qualitative variables with two categories in quantitative terms was tested with the Student t test if normal distribution assumption was met; if was not met, tested with the Mann–Whitney U test. The Chi-Square test was used when the relation between the two qualitative variables was examined. The Receiver Operating Characteristic (ROC) analysis was made to find a method to be used instead of the gold standard qualitative variable for the quantitative variable, and the Youden Index value was used to calculate the cut-off value for the quantitative variable. Univariate and multivariate logistic regression analyzes were used to determine the risk factors affecting the increase in carotid artery blood flow velocity (moderate and severe stenosis). The statistical significance level was taken as p < 0.05.
Results
A total of 161 patients diagnosed with carotid artery stenosis were included in the study. The demographic and clinical characteristics of the patients are presented in Table 1. There were no statistically significant differences in terms of age, gender, body mass index, hypertension, diabetes mellitus, coronary artery disease, chronic obstructive pulmonary disease, smoking, stroke, transient ischemic attack (TIA) history, presence of contralateral ICA severe stenosis or total occlusion between the increased flow velocity group (n = 99), and normal flow velocity group (n = 62). The mean blood flow velocity measurements (ICA PSV, ICA EDV, and ICA/CCA PSV ratio) of patient categories are presented in Table 1.
Demographic and clinical characteristics of the patients.
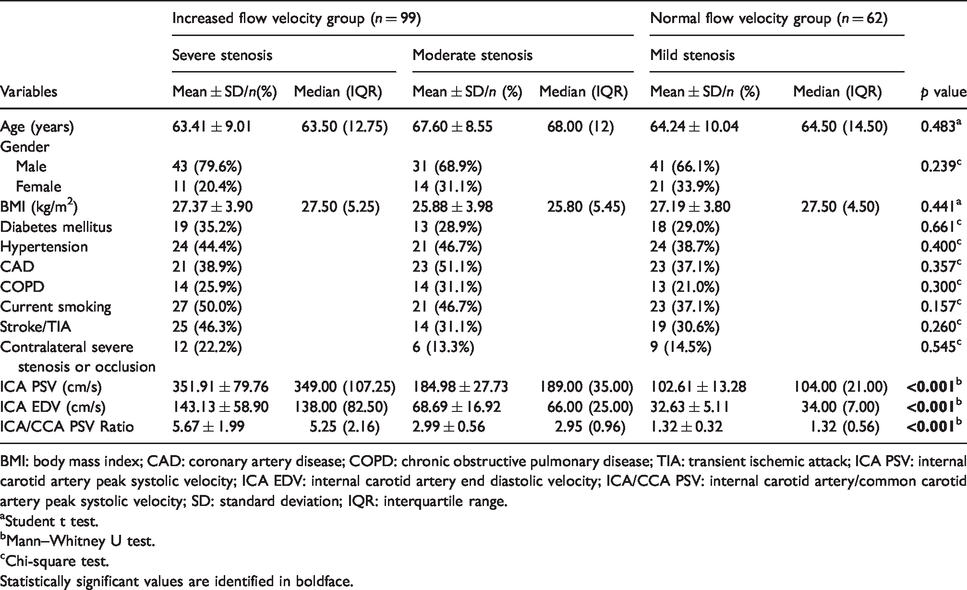
BMI: body mass index; CAD: coronary artery disease; COPD: chronic obstructive pulmonary disease; TIA: transient ischemic attack; ICA PSV: internal carotid artery peak systolic velocity; ICA EDV: internal carotid artery end diastolic velocity; ICA/CCA PSV: internal carotid artery/common carotid artery peak systolic velocity; SD: standard deviation; IQR: interquartile range.
aStudent t test.
bMann–Whitney U test.
cChi-square test.Statistically significant values are identified in boldface.
The comparison of laboratory parameters of patients is presented in Table 2. The fasting blood glucose, BUN, Na, and calculated plasma osmolality values of the increased flow velocity group were found to be significantly higher (p = 0.035, p = 0.001, p < 0.001, p < 0.001; respectively). When the lipid profile was evaluated, HDL-C was significantly low, TG and AIP were significantly higher in the increased flow velocity group (p < 0.001, p = 0.001, p < 0.001; respectively). Mean platelet volume (MPV), which was one of the evaluated hemogram parameters, was found to be significantly higher in the increased flow velocity group (p = 0.004).
Laboratory variables of the patients.

SD: standard deviation; IQR: interquartile range; TC: total cholesterol; LDL-C: low-density lipoprotein cholesterol; HDL-C: high-density lipoprotein cholesterol; TG: triglyceride; AIP: atherogenic index of plasma.
aStudent t test.
bMann–Whitney U test.Statistically significant values are identified in boldface.
Univariate logistic regression analysis was performed to evaluate possible risk factors associated with increased carotid artery blood flow velocity (Table 3). Plasma osmolality, AIP, and MPV were found to be significantly associated with increased blood flow velocity (p < 0.001, p < 0.001, p = 0.006; respectively). As a result of univariate logistic regression analysis, statistically significant variables were included in the multivariate logistic regression analysis. And as a result of multivariate logistic regression analysis, plasma osmolality and AIP variables were found to be statistically significant (p < 0.001, p < 0.001; respectively). It was found that one unit increase of plasma osmolality increased the carotid artery blood flow velocity increased by 1.145 times, and 0.01 unit increase in AIP increased it by 1.079 times.
Univariate logistic regression analysis to identify predictors of the increase in carotid artery blood flow velocity.
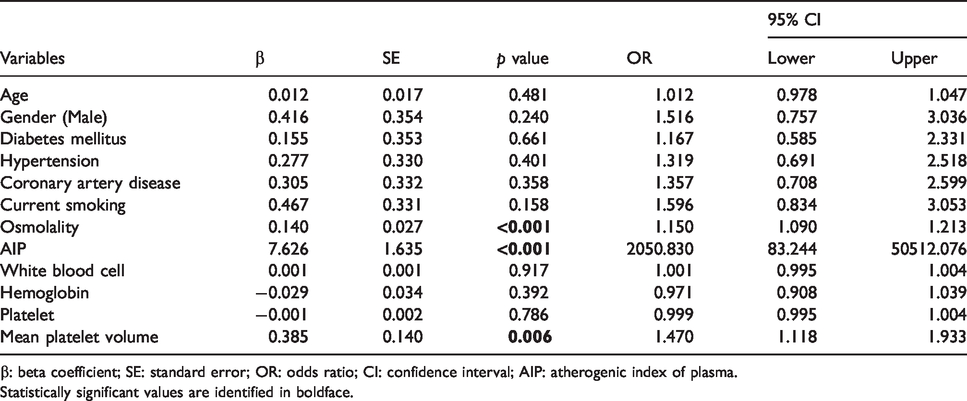
β: beta coefficient; SE: standard error; OR: odds ratio; CI: confidence interval; AIP: atherogenic index of plasma.Statistically significant values are identified in boldface.
ROC Curve analysis was performed to determine the predictive effect of plasma osmolality and AIP levels in the increase in carotid artery blood flow velocity (Table 4). The Area Under the Curve (AUC) for plasma osmolality was 0.746 (95% confidence interval (CI): 0.670–0.822, p < 0.001). The most ideal cut-off value for plasma osmolality was 291.45 mOsm/kg (sensitivity: 65.7% and specificity: 67.7%). AUC for AIP was 0.735 (95% CI: 0.656–0.813, p < 0.001). The most ideal cut-off value for AIP was 0.20 (sensitivity: 65.7% and specificity: 66.1%; Figure 1).
Results of the ROC curve analysis.
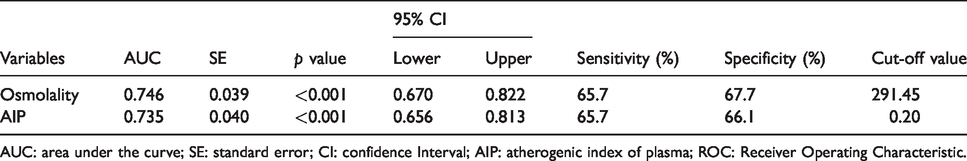
AUC: area under the curve; SE: standard error; CI: confidence Interval; AIP: atherogenic index of plasma; ROC: Receiver Operating Characteristic.
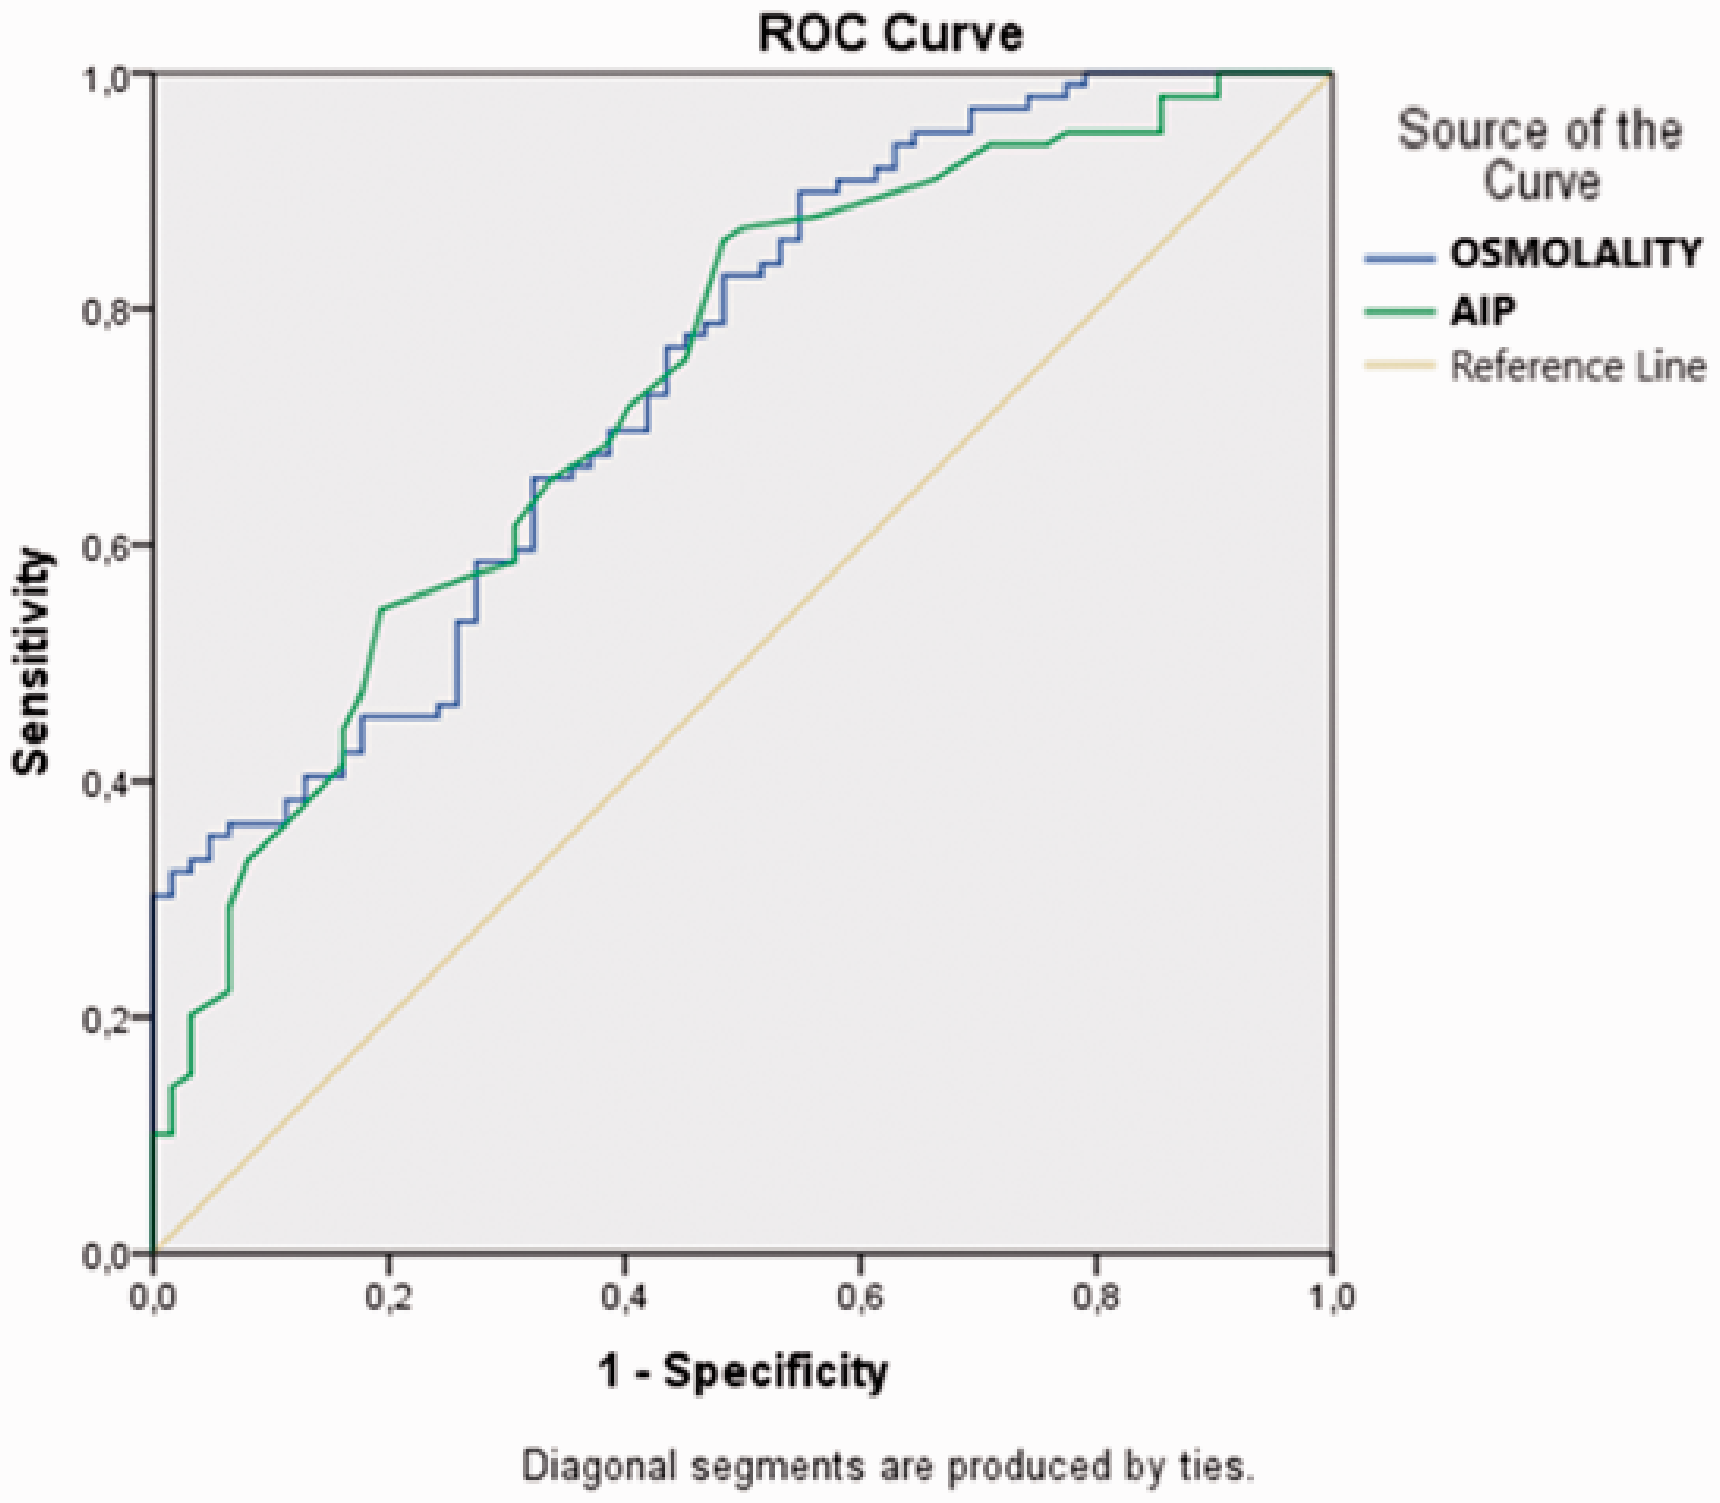
ROC curve of plasma osmolality and AIP for predicting to increase in carotid artery blood flow velocity. AIP: atherogenic index of plasma; ROC: Receiver Operating Characteristic.
Discussion
In our study, we evaluated the relationship between increased carotid artery blood flow velocities due to carotid artery stenosis and calculated plasma osmolality and AIP. We determined that the increase in plasma osmolality and AIP was associated with increased carotid artery blood flow velocity. Univariate logistic regression analysis found that there was a statistically significant relationship between increased carotid artery blood flow velocity and plasma osmolality, AIP, and MPV. In multivariate logistic regression analysis, plasma osmolality and AIP were found as independent predictive factors for increased carotid artery blood flow velocity. With this study, we determined that the increase in the severity of carotid artery stenosis can be predicted with plasma osmolality and AIP values for the first time in the literature.
It is already known that the most common cause of carotid artery stenosis is atherosclerosis. In the progression of early subclinical atherosclerosis (PESA) study, that included asymptomatic 4184 middle-aged individuals (40–54 years), 31% ratio atherosclerosis was detected in the carotid arteries with DUS. 18 The stenosis caused by atherosclerosis in the carotid arteries is important, because it is progressive, common, and can cause ischemia-induced TIA and stroke. 19 There is direct proportion between the severity of the carotid artery stenosis and the increase in blood flow velocity in the stenosis area, and blood flow velocities are considered to be indicative of stenosis severity. As a basic rule, carotid artery blood flow velocities do not increase in mild stenosis (< 50% stenosis), cannot be measured in total stenosis, and can be measured incorrectly in subtotal stenosis. 14 , 20 ICA PSV is the primarily used parameter to determine the severity of carotid artery stenosis, and ICA EDV measurement is also considered, as there may be erroneous technical measurements in ICA PSV. 15 However, since ICA PSV and ICA EDV values are affected in hemodynamic parameters such as blood pressure, cardiac output, and contralateral carotid artery severe stenosis, ICA/CCA PSV Ratio value is also measured. 14 In our study, no statistically significant differences were detected between our patient groups in terms of the presence of hypertension, coronary artery disease, and contralateral severe stenosis or occlusion, and this supports the reliability of our results.
The response hypothesis due to endothelial damage is accepted in the pathogenesis of atherosclerosis. Endothelial damage, secondary to shear stress due to blood flow occurs on the vascular endothelium and this endothelial damage initiates atherosclerotic processes. The degree of hemoconcentration is an important factor in the formation of endothelial damage. 21 The increase in plasma osmolality, which is an indicator of extracellular fluid and body hydration, increases the hemoconcentration, initiates and progresses the atherosclerotic processes through endothelial damage. 22 , 23 In the literature, studies on plasma osmolality generally emphasize the effect of body hydration on the prognosis and mortality of the diseases. In their study, which included 167 acute stoke patients, Bhalla et al. reported that plasma osmolality > 296 mOsm/kg on admission increased the mortality risk 2.4 times (odds ratio (OR): 2.4, 95% CI: 1.0–5.9, p = 0.05). 24 Rohla et al. reported that plasma osmolality can be used in risk classification in patients with acute coronary syndrome and is a predictor of mortality. 25
It was determined in our study that there is a statistically significant plasma osmolality elevation in our increased flow velocity group (p < 0.001). We considered that the elevation of plasma osmolality increased the carotid artery stenosis severity by increasing the atherosclerosis. Also, the multivariate logistic regression analysis showed that the plasma osmolality was an independent predictive factor for increased carotid artery blood flow velocity. In our study, no statistically significant difference was found between the patient groups, the number of patients diagnosed with diabetes mellitus which affects plasma osmolality and known to increase the risk of atherosclerosis. However, the fasting blood glucose of patients in the increased flow velocity group was found to be significantly higher (p = 0.035). In addition, the patients who were diagnosed with chronic renal disease, which has an effect on plasma osmolality and electrolyte levels, were prevented from affecting our results by excluding them from the study.
Many studies have been conducted on hyperlipidemia and blood lipid parameters, which are known to cause atherosclerosis development by performing endothelial dysfunction. LDL-C is considered an atherogenic lipoprotein. Also, it is known that there is a relation between small-dense LDL-C levels which have higher atherogenic potential and TG levels. There are studies reporting that TG levels are a predictive marker for atherosclerosis because the increases in TG levels cause increases in small-dense LDL-C levels. 26 , 27 Since HDL-C carries cholesterol to the liver from the plasma, it is considered to be antiatherogenic lipoprotein. It has been reported that there is a relationship between low HDL-C levels and carotid intima-media thickness and increase in atherosclerotic heart diseases. 28 , 29
In recent years, AIP, which is calculated by logarithmic (log) conversion of plasma TG and HDL-C levels ratio, is accepted as a new and powerful predictor for atherosclerosis. 10 There are studies reporting that AIP is an indicator of subclinical atherosclerosis and cardiovascular diseases. 12 , 30 , 31 Dobiásová et al. reported that as the risk of cardiovascular disease increases, AIP also increases, and that −0.3 to 0.1 values showed low cardiovascular risk for AIP, 0.1 to 0.24 showed medium risk, and values above 0.24 showed high risk. 32 It was found in our study that as the severity of carotid artery stenosis increased, the value of AIP also increased, and AIP was an independent predictive factor for increased carotid artery blood flow velocity. The most ideal cut-off value for AIP value in increase in carotid artery blood flow velocity was found to be 0.20 (sensitivity: 65.7% and specificity: 66.1%).
It is known that platelets play an important role in inflammatory and thrombotic processes. The metabolic and enzymatic activities of young and large platelets produced due to inflammation in the body have increased. The indicator of platelet size is MPV. 33 Cerebrovascular and cardiovascular diseases developing due to atherosclerosis, which is an inflammatory process, have been shown to be associated with high MPV values. 34 , 35 However, the results of the studies investigating the relation between the severity of carotid artery stenosis and MPV values are controversial. A study conducted by Arévalo-Lorido et al., that included 215 atherothrombotic stroke patients, reported a significant correlation between the severity of carotid artery stenosis and high MPV values. 36 Mayer et al. reported that there were no statistically significant relations between carotid artery stenosis and MPV levels, in their prospective study that included 1006 asymptomatic carotid artery stenosis patients. 37 In our study, the MPV levels of the patients in the increased flow velocity group were found to be significantly higher (p = 0.004). However, in multivariate logistic regression analysis, MPV was not found as an independent predictive factor for the increase in carotid artery blood flow velocity.
Our study had some limitations. Firstly, the patient population was relatively small because the study had a retrospective nature and was a single-center study. Secondly, the use of DUS, which is an operator-dependent examination. Thirdly, the calculated plasma osmolality is used instead of measured one. The difference between the measured plasma osmolality and calculated plasma osmolality is expressed as the osmolal gap. 5 In our study, the conditions that might cause osmolal gap increase were considered as the exclusion criteria. Fourthly, we do not have healthy population data, since only patients diagnosed with carotid artery stenosis were included in our study. Therefore, studies in prospective nature and involving healthy population should be planned in order for these two laboratory parameters to be considered as a diagnosis or screening test for carotid artery stenosis and to enter clinical use. Fifthly, we think that these two parameters, which we calculate from biochemical tests routinely applied in the follow-up of patients diagnosed with carotid artery stenosis in our hospital, are cost-effective when compared with repeated DUS measurements. We are planning to verify this hypothesis with new studies that are including cost calculations.
Conclusion
There was a significant relationship between increased carotid artery blood flow velocities due to carotid artery stenosis, and plasma osmolality and AIP values that can be easily calculated from routine biochemical tests. The increase in carotid artery blood flow velocity, that is, the increase in the severity of the carotid artery stenosis, which is important due to the stroke risk it creates, can be predicted with calculated plasma osmolality and AIP values. In patients followed up with a diagnosis of carotid artery stenosis, the use of repeated DUS examinations and angiographic examinations with known side effects can be reduced by monitoring the increase in the severity of carotid artery stenosis with these two laboratory parameters.
Footnotes
Declaration of conflicting interests
The author(s) declared no potential conflicts of interest with respect to the research, authorship, and/or publication of this article.
Ethical approval
The study was approved by the Adiyaman University Ethics Board (Approval number: 2020/6–29).
Funding
The author(s) received no financial support for the research, authorship, and/or publication of this article.