



Abstract
This article describes four technologies relevant to vascular ultrasound which are available commercially in 2015, and traces their origin back through the research literature. The technologies are 3D ultrasound and its use in plaque volume estimation (first described in 1994), colour vector Doppler for flow visualisation (1994), wall motion for estimation of arterial stiffness (1968), and shear wave elastography imaging of the arterial wall (2010). Overall these technologies have contributed to the understanding of vascular disease but have had little impact on clinical practice. The basic toolkit for vascular ultrasound has for the last 25 years been real-time B-mode, colour flow and spectral Doppler. What has changed over this time is improvement in image quality. Looking ahead it is noted that 2D array transducers and high frame rate imaging continue to spread through the commercial vascular ultrasound sector and both have the potential to impact on clinical practice.
Keywords
Introduction
The area of vascular ultrasound refers to arteries and veins in the upper and lower limbs, the extracranial arteries and the abdomen. The main vascular ultrasound technologies are B-mode imaging for evaluation of tissue structure, colour-flow imaging for evaluation of flow patterns and identification of regions of abnormal velocity (such as in stenoses), and spectral Doppler for measurement of blood velocities and related quantities at specific regions within the vessel. The basic toolkit of vascular ultrasound for the last 25 years has consisted of these three modalities: B-mode, colour flow and spectral Doppler. A large number of additional technologies and extensions to the basic toolkit have been described. This article will review developments in technology which have become commercially available in recent years, tracing their development from prototype systems in research labs. It will be clear in this article that ‘recent’ commercial developments have a very long history, often going back several decades.
3D
Systems with the ability to produce 3D-ultrasound images of vascular disease have mostly been based on collection of a series of 2D images. The transducer may be moved mechanically or by the operator in a freehand manner with tracking of the transducer location using optical or magnetic sensors.1,2 The 2D images are reconstructed into a 3D view based on the known position of each image slice. Mechanical scanning produces images with regular spacing and orientation, whereas freehand scanning results in irregular spacing and orientation of images. 3D imaging based on 2D scanning suffers from registration artefacts due to patient movement, movement of organs and reflexes such as swallowing and variations in probe pressure during scanning resulting in compression of the underlying tissues to varying degrees.
3
Two-D array transducers enable steering of the beam within a 3D volume allowing 3D image acquisition without movement of the transducer, and in real-time.1,4,5 The first commercial 2D array system was manufactured by Volumetrics Medical Imaging (Durham, North Carolina, USA) at the end of the 1990s based on the technology developed by the group at Duke University led by Smith. Later, Philips Medical Systems (Amsterdam, Netherlands) produced a 2D array system with part of the beam forming within the transducer. Early 2D array systems were aimed primarily at cardiac 3D scanning. Though there are clear advantages for 3D imaging, this technology is still not in widespread use amongst manufacturers in 2015 with only Siemens and Philips offering 2D arrays suitable for vascular ultrasound. Figure 1 shows images obtained using the Philips 2D array system.
Surface-shaded views of (a) the femoral artery and (b) the aortic bifurcation. 3D ultrasound images are collected using the Philips Matrix array ultrasound scanner. Images provided courtesy of Royal Philips (Amsterdam, Netherlands)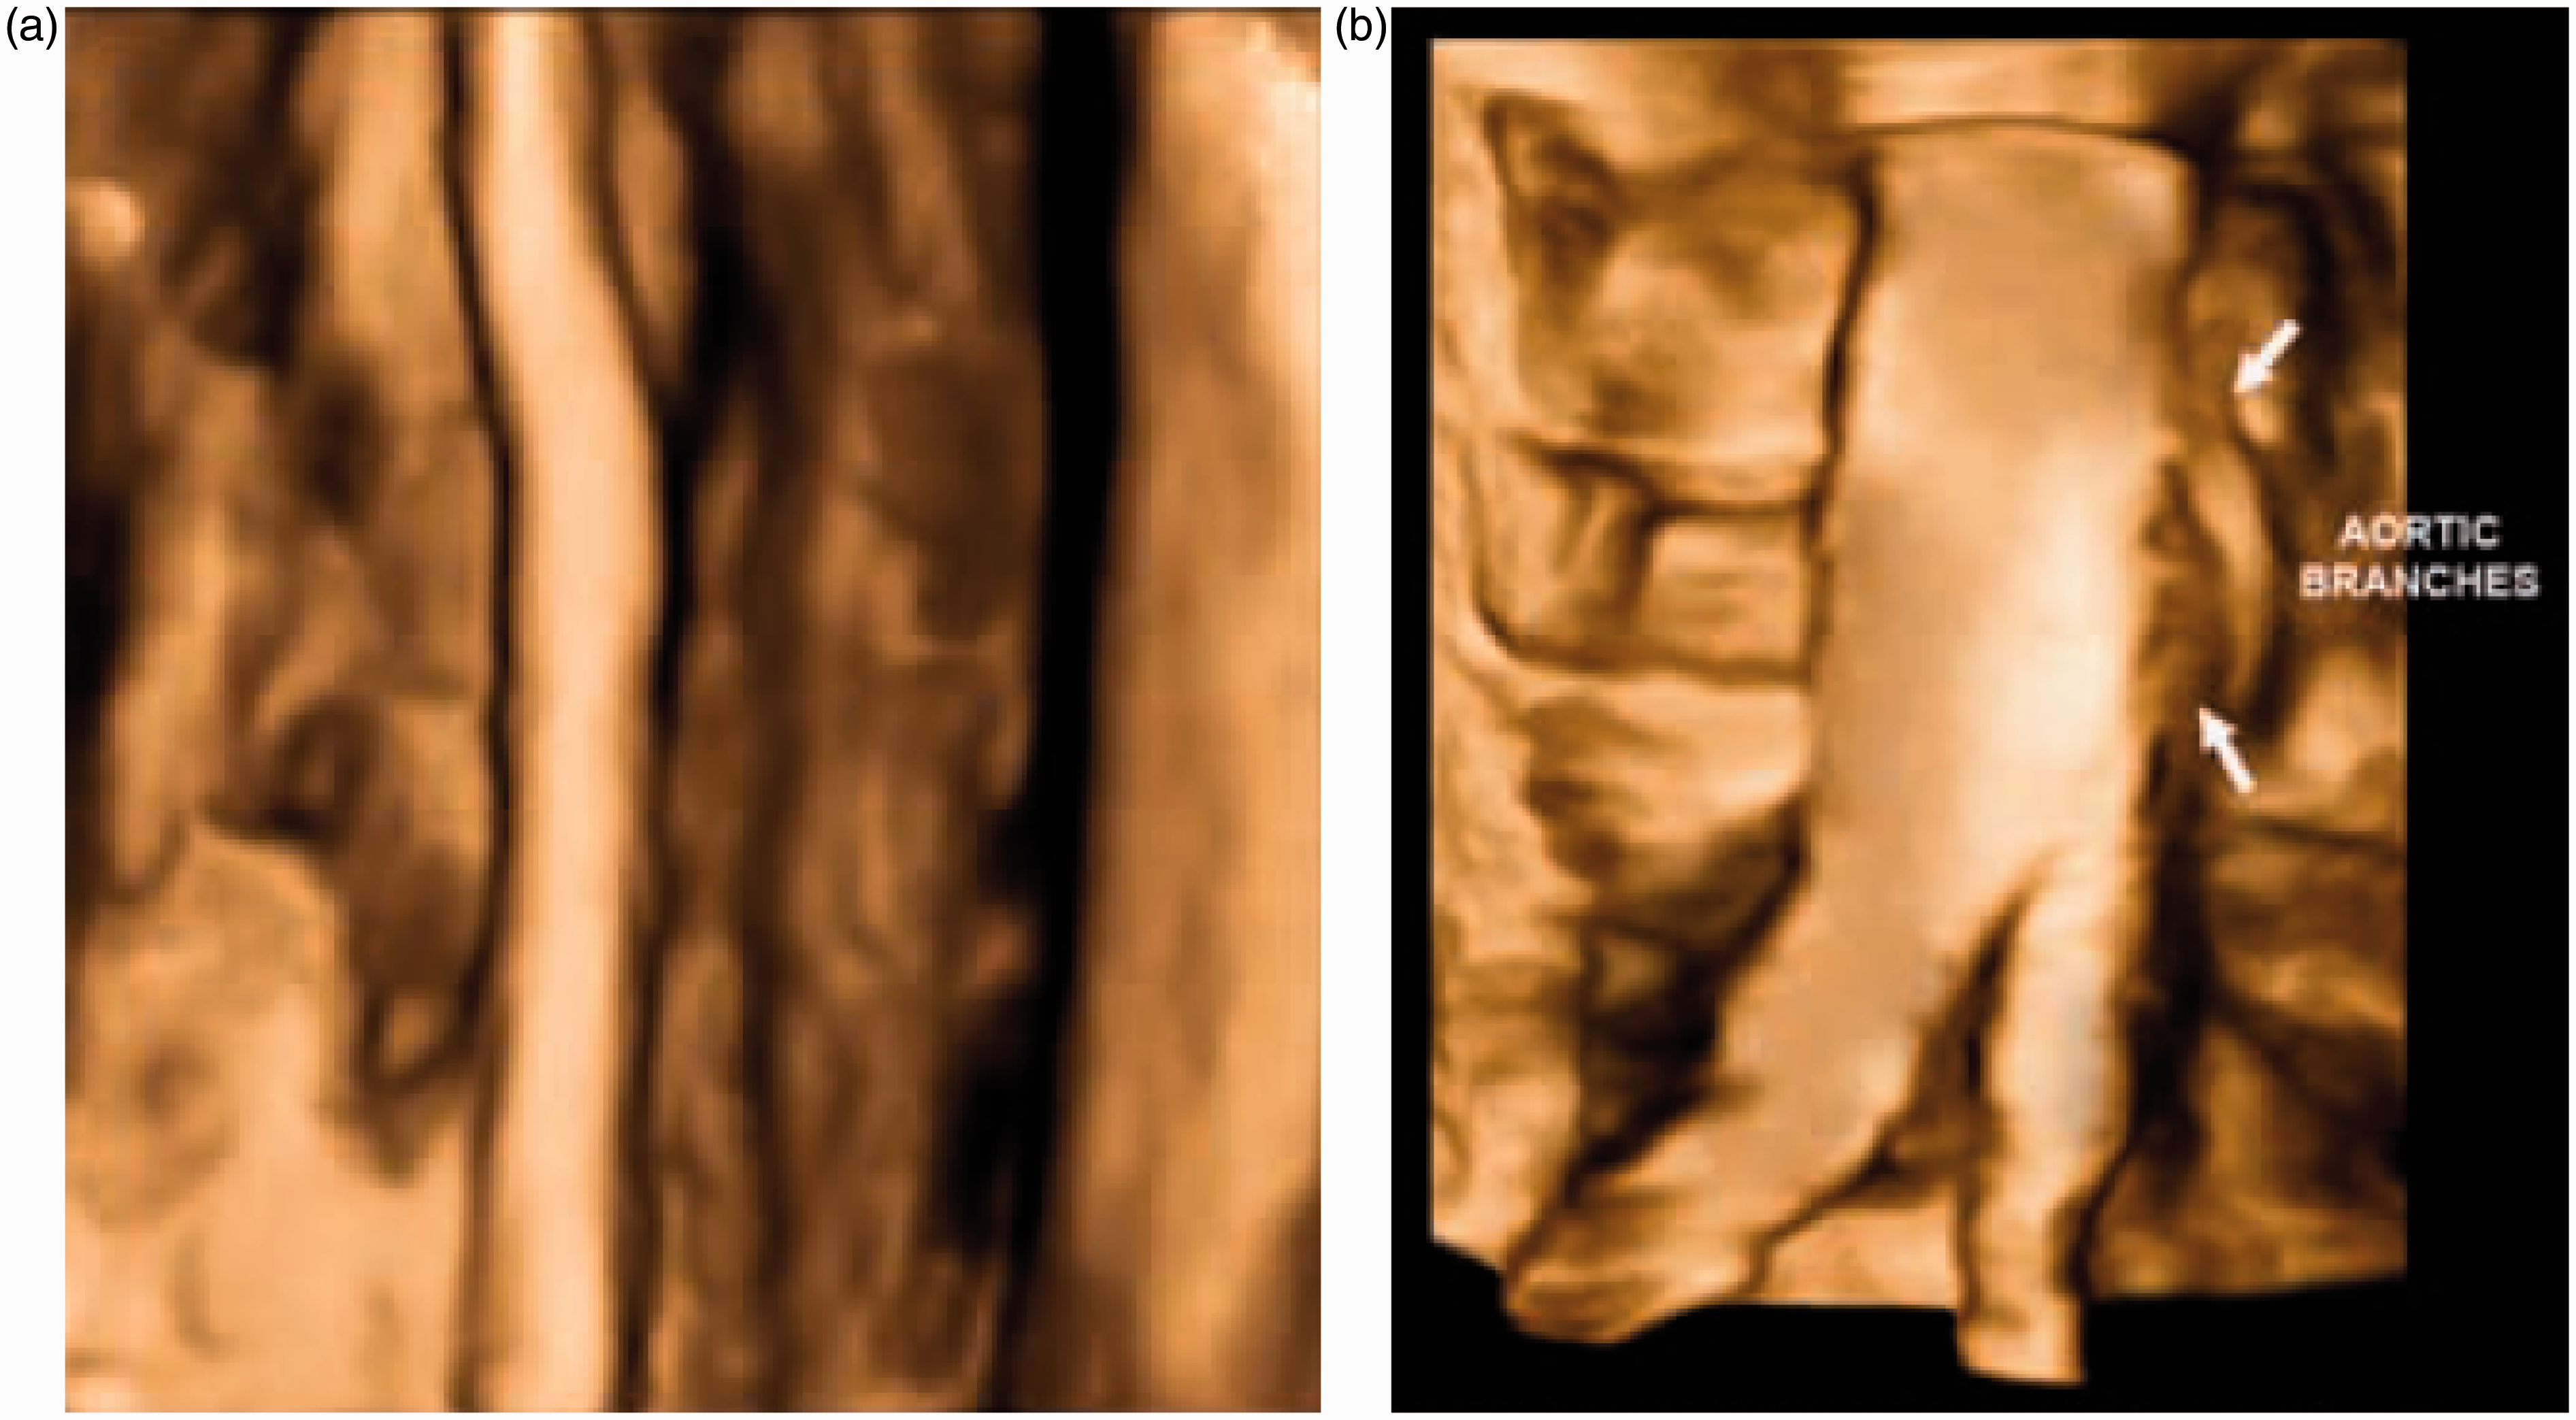
Three-D ultrasound may be used to visualise vascular geometry (Figure 1). However, the main clinical interest to date has been measurement of plaque volume. As an atherosclerotic plaque develops, the plaque typically grows outwards, so there is an increase in overall artery diameter, but the lumen diameter is preserved. Early atherosclerosis is therefore often missed on simple measurements of lumen diameter. Plaque volume has therefore been advocated as a better marker of the degree of atherosclerosis than lumen diameter. In general, plaque volume has been shown to be a better marker of overall cardiovascular risk than other markers such as carotid intima-media thickness, ankle-brachial index and abdominal aortic diameter. 6
Plaque volume measurements were first described by Delcker and Diener 7 using a 3D method based on acquisition of sequential 2D images. Subsequent studies have been performed,8,9 with Makris et al. 10 providing a review of studies to 2011.
The change in plaque volume over time has been used to evaluate the effectiveness of plaque-reducing therapies such as atorvastin and statins.10,11 Figure 2 shows the effect of giving statins on plaque volume.
12
Reduction in plaque volume after a course of statins; redrawn from data in Krasinski A, et al.
12

The quantity ‘plaque volume’ excludes the medial and adventitial layers of the artery. An alternative metric which some studies use is the total vessel volume, which includes both plaque, medial and adventitial layers. However, it has been noted that changes in total vessel volume cannot distinguish between changes in plaque volume (e.g. arising as a result of drug therapy or diet) and changes in medial thickness (e.g. arising as a result of remodelling due to reduction in blood pressure). 13
The region of atherosclerotic plaque is traced on each 2D image and the overall plaque volume is then calculated taking into account the distance between adjacent slices. A semi-automated plaque volume tool has been described by Philips Medical Systems based on use of their 2D array transducer (Figure 3). Manual tracing is very time consuming and partial automation helps speed up the process considerably making this more suitable for clinical practice.
Automated segmentation of arterial wall and atherosclerotic plaque for use in 3D plaque volume estimation. Images provided courtesy of Royal Philips (Amsterdam, Netherlands)
Vector Doppler
Virtually all commercial Doppler systems which have been produced have been based on use of a single beam to estimate blood velocity. This gives rise to an angle dependence whereby the estimated Doppler frequency is dependent on the angle between the beam and direction of motion. It is therefore necessary for the operator to manually align the angle cursor for estimation of the blood velocity from the Doppler frequency in spectral Doppler. Another way of describing this angle-dependence is that single-beam systems measure only 1 velocity component, that along the direction of the beam. In fact a velocity vector is correctly described by three components corresponding to the x, y and z axes. Measurement of two or even three components is possible using a multi-beam approach and this is called ‘vector Doppler’. Early systems used single-element transducers, as reviewed in Dunmire et al. 14 Array transducers are especially suitable for vector Doppler due to the ability to control beam steering electronically. Array-based vector Doppler has been reported for colour flow15–19 and for single-velocity measurement including spectral Doppler.20–24 An arrangement which is suitable for real-time vector Doppler is the use of a single beam on transmission followed on reception by the use of two receiver beams aligned in different directions. The acquisition of Doppler data from two different directions then allows the true velocity magnitude in the plane of the scan to be calculated automatically. In principle, beam-steering in three directions using 2D array transducers would allow all three velocity components to be estimated. Recently, new vector-Doppler methods have been developed based on plane-wave imaging.25,26
A prototype vector spectral Doppler system for real-time acquisition and off-line processing was developed by Philips Medical Systems.22,23 However, even though vector Doppler would be easy to implement on commercial systems, there has been little uptake by manufacturers. For flow visualisation, BK Medical (Herlev, Denmark) has provided a vector Doppler system based on the work of Jensen's group in Lyngby (Denmark) using a transverse oscillation approach.27–29 Figure 4 shows examples of the vector flow data produced using the BK system. This system performs automatic angle correction for spectral Doppler, aligning the angle cursor with respect to the direction of flow. It has been used for visualisation of flow fields30,31 and measurement of volumetric flow.32,33
Vector flow imaging using the BK 3000 scanner (BK Medical, Herlev, Denmark). (a) Common carotid artery with the automatic alignment of the angle cursor with the direction of blood motion. (b) Femoral artery and vein; notice the backflow behind the valve in the vein (bottom vessel). (c) Carotid artery with reverse flow in the bulb. (d) Well-functioning dialysis fistula. (e) Vena porta from a subcostal insonation window (Figure 4a provided by BK Medical. Figure 4b–e provided by Dr Kristoffer Hansen, Blegdamsvej, Denmark)
Wall motion
Arteries undergo changes in diameter of typically up to 10% during the cardiac cycle as a result of changes in blood pressure. Typically, the distension waveform along a single diameter is measured using ultrasound, allowing measurement of the minimum (diastolic) and maximum (systolic) diameter, d
d
and d
s
. This may be combined with diastolic and systolic blood pressure data, P
d
and P
s
, to provide an estimate of wall stiffness (equation 1). The pressure strain elastic modulus E
p
is an index of structural stiffness, whereas the Young's modulus E is an index of material stiffness.
34
Estimation of Young's modulus E requires knowledge of the wall thickness h (equation 2).
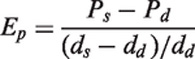
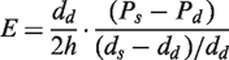
Initial studies of wall motion measurement (1968–1972) involved A-line devices with display of data on an oscilloscope.35–37 Since these early studies, a large number of papers have reported methods for wall motion measurement and studies on volunteers and patients. Review articles cover the extensive history of this area.38–41 A brief description will be given here of the main technologies related to wall motion. Though it is possible to measure wall motion from the B-mode display or from the M-mode display, the best accuracy is provided by use of the RF data, where displacements of 1–10 µm can be measured.36,42–45 It is also possible to use the tissue Doppler (TDI) data to obtain information on wall motion.46,47 Most commonly, radial wall motion is measured along a single ultrasound line and stiffness (E or E p ) is estimated using equations 1 and 2. It is also possible to measure motion in 2D, so both longitudinal and lateral motions are measured.48,49
Multi-line systems that measure wall motion, along multiple lines simultaneously, allow measurement of wall motion as a function of distance along the vessel. Such systems may be used to identify local patterns of wall motion, for example to identify regions of high longitudinal strain in plaque.50,51 However, the main interest in multi-line systems is in the measurement of local pulse wave velocity (PWV) as described below.
During systole, blood is ejected from the left ventricle into the aorta. The aorta increases in diameter and the expansion travels down the arterial system in the form of a wave, called the ‘pressure wave’. The speed of travel of the pressure wave is proportional to the stiffness of the artery. Equation (3) shows the Moens-Korteweg equation to estimate PWV from stiffness:
40
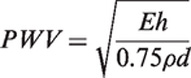
Measurement of PWV is usually performed using pressure tonometry with measurements taken at the carotid and femoral artery. The PWV is then calculated as the difference in arrival time of the pressure wave at the two sites divided by the distance between them. The use of multi-line wall-motion systems allows measurement of the distension produced by the pressure wave over a short segment of the artery, which in turn allows the local PWV to be estimated.52–55
Several studies have measured wall motion and stiffness indices in patients and volunteers. With increasing age or diabetes the stiffness of the aorta increases (E and E
p
).39,56,57 Studies on patients with atherosclerosis showed an overall increase in stiffness in the carotid artery47,58 and in the femoro-popliteal arteries (Figure 5).
59
However, there was a large variability in stiffness and it was noted that lipid-filled vulnerable plaque are likely to be much less stiff than stable plaque with small or no lipid pool and a high collagen content. For patients with abdominal aortic aneurysm there was no difference in stiffness (E
p
) between those aneurysms that ruptured and those that did not rupture.
60
Increase in Young's modulus in carotid arteries in patients with peripheral arterial (PAD) compared to controls (redrawn from data in Claridge et al.
47

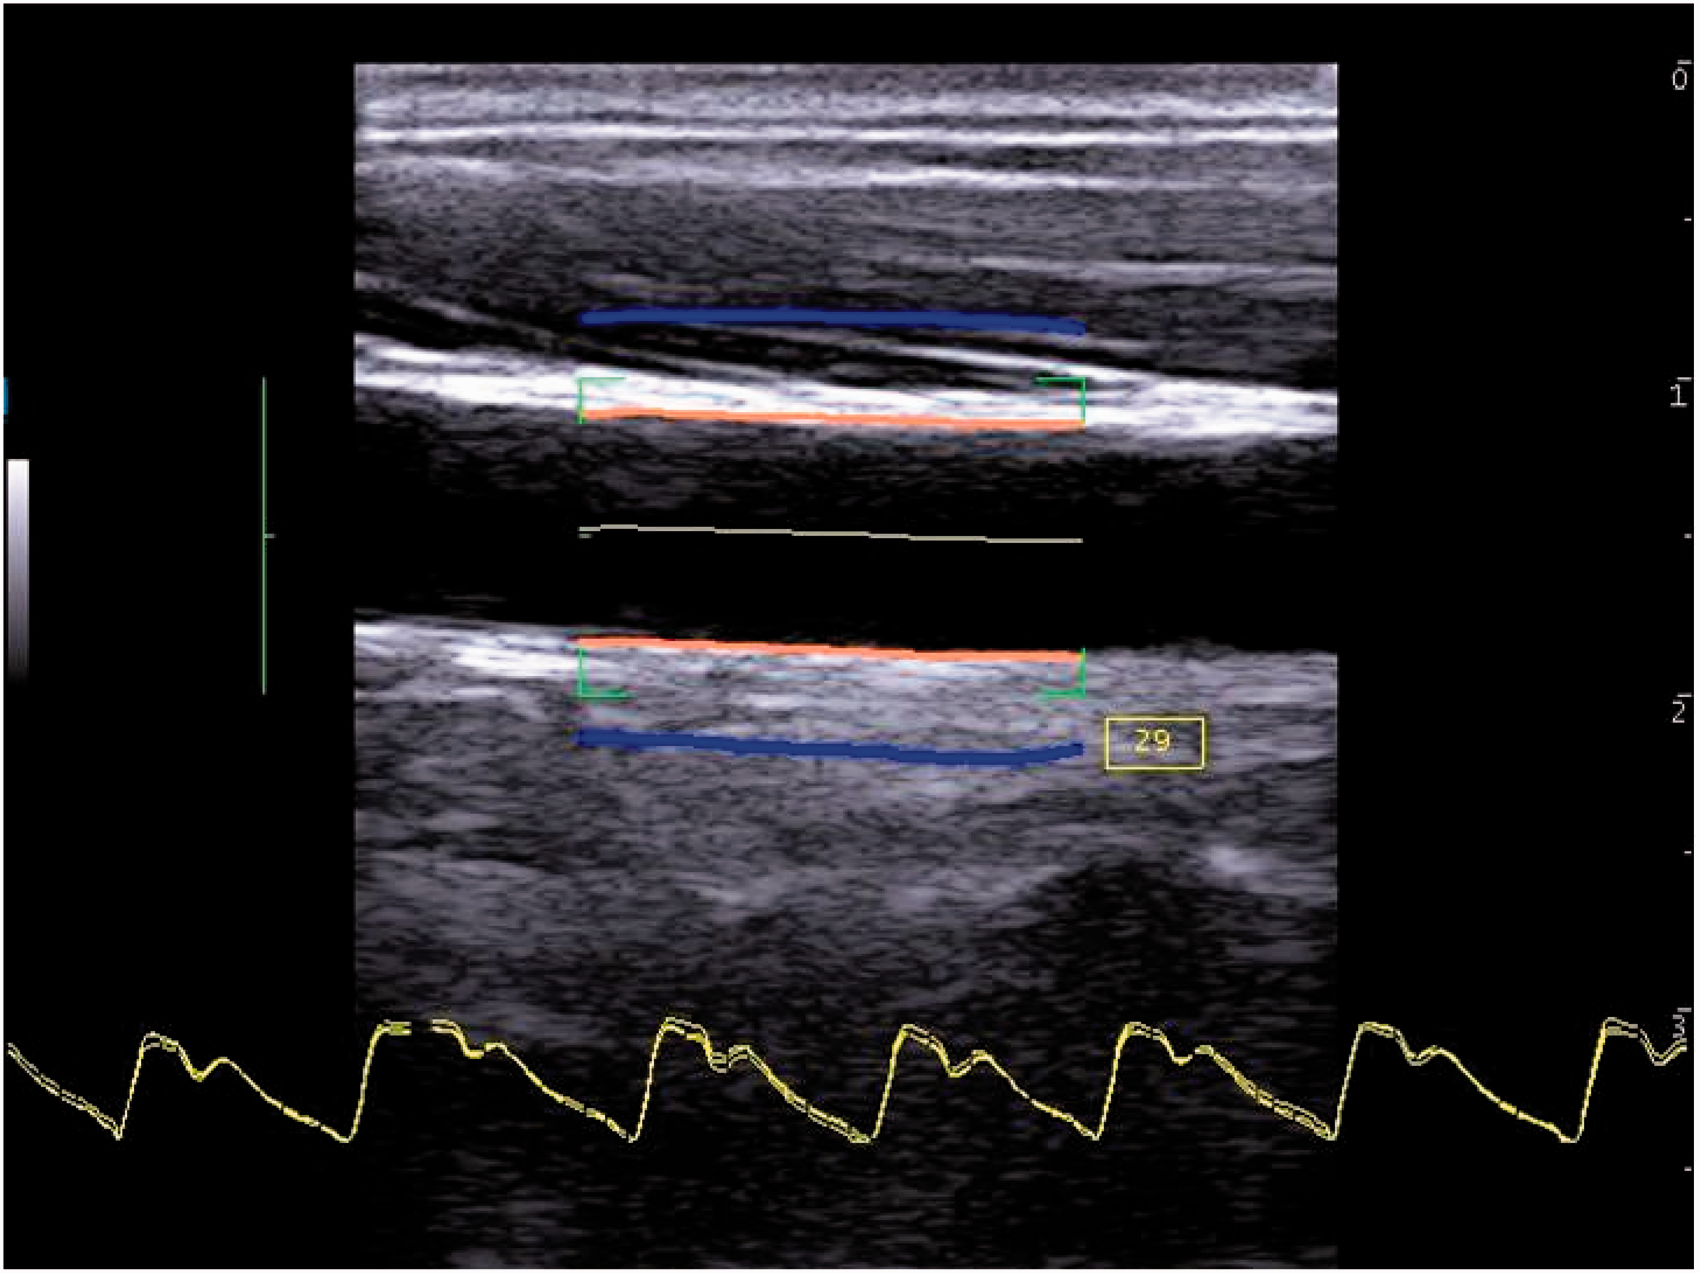
Several manufacturers have provided wall motion capability over the last 25 years. Teltec AB (Malmo, Sweden) provided a single-line wall-tracking system in the 1990s. The GE Vivid 7 (GE Healthcare, Little Chalfont, UK) in the 2000s had wall tracking ability. Philips Research France (Paris), part of Royal Philips (Amsterdam, Netherlands), produced a multi-line system for research in the early 2000s (Figure 6). Esaote (Genoa, Italy) currently offer wall motion capability on their imaging platforms (Figure 7). The Artsens is a dedicated wall motion system without imaging offered by Healthcare Technology Innovation Centre (Chennai, India).
Wall motion obtained from TDI using a Philips HDI 5000 (Royal Philips, Amsterdam, Netherlands). (a) Healthy artery. Left top: TDI images in blue and red. Left middle: Instantaneous wall displacement as a function of longitudinal position along the artery. Left bottom: wall distension versus time. Right: Distension waveforms from all scan lines superimposed, plus mean distension (orange line). (b) TDI images in a diseased artery (red and blue); superimposed is the instantaneous wall distension as a function of longitudinal position in the artery Wall motion obtained using an Esaote ultrasound system (Esaote, Genoa, Italy). Wall motion waveforms are shown at the bottom. The blue lines indicate the instantaneous wall distension as a function of longitudinal position in the artery (Courtesy Dr Peter Brands, Esaote)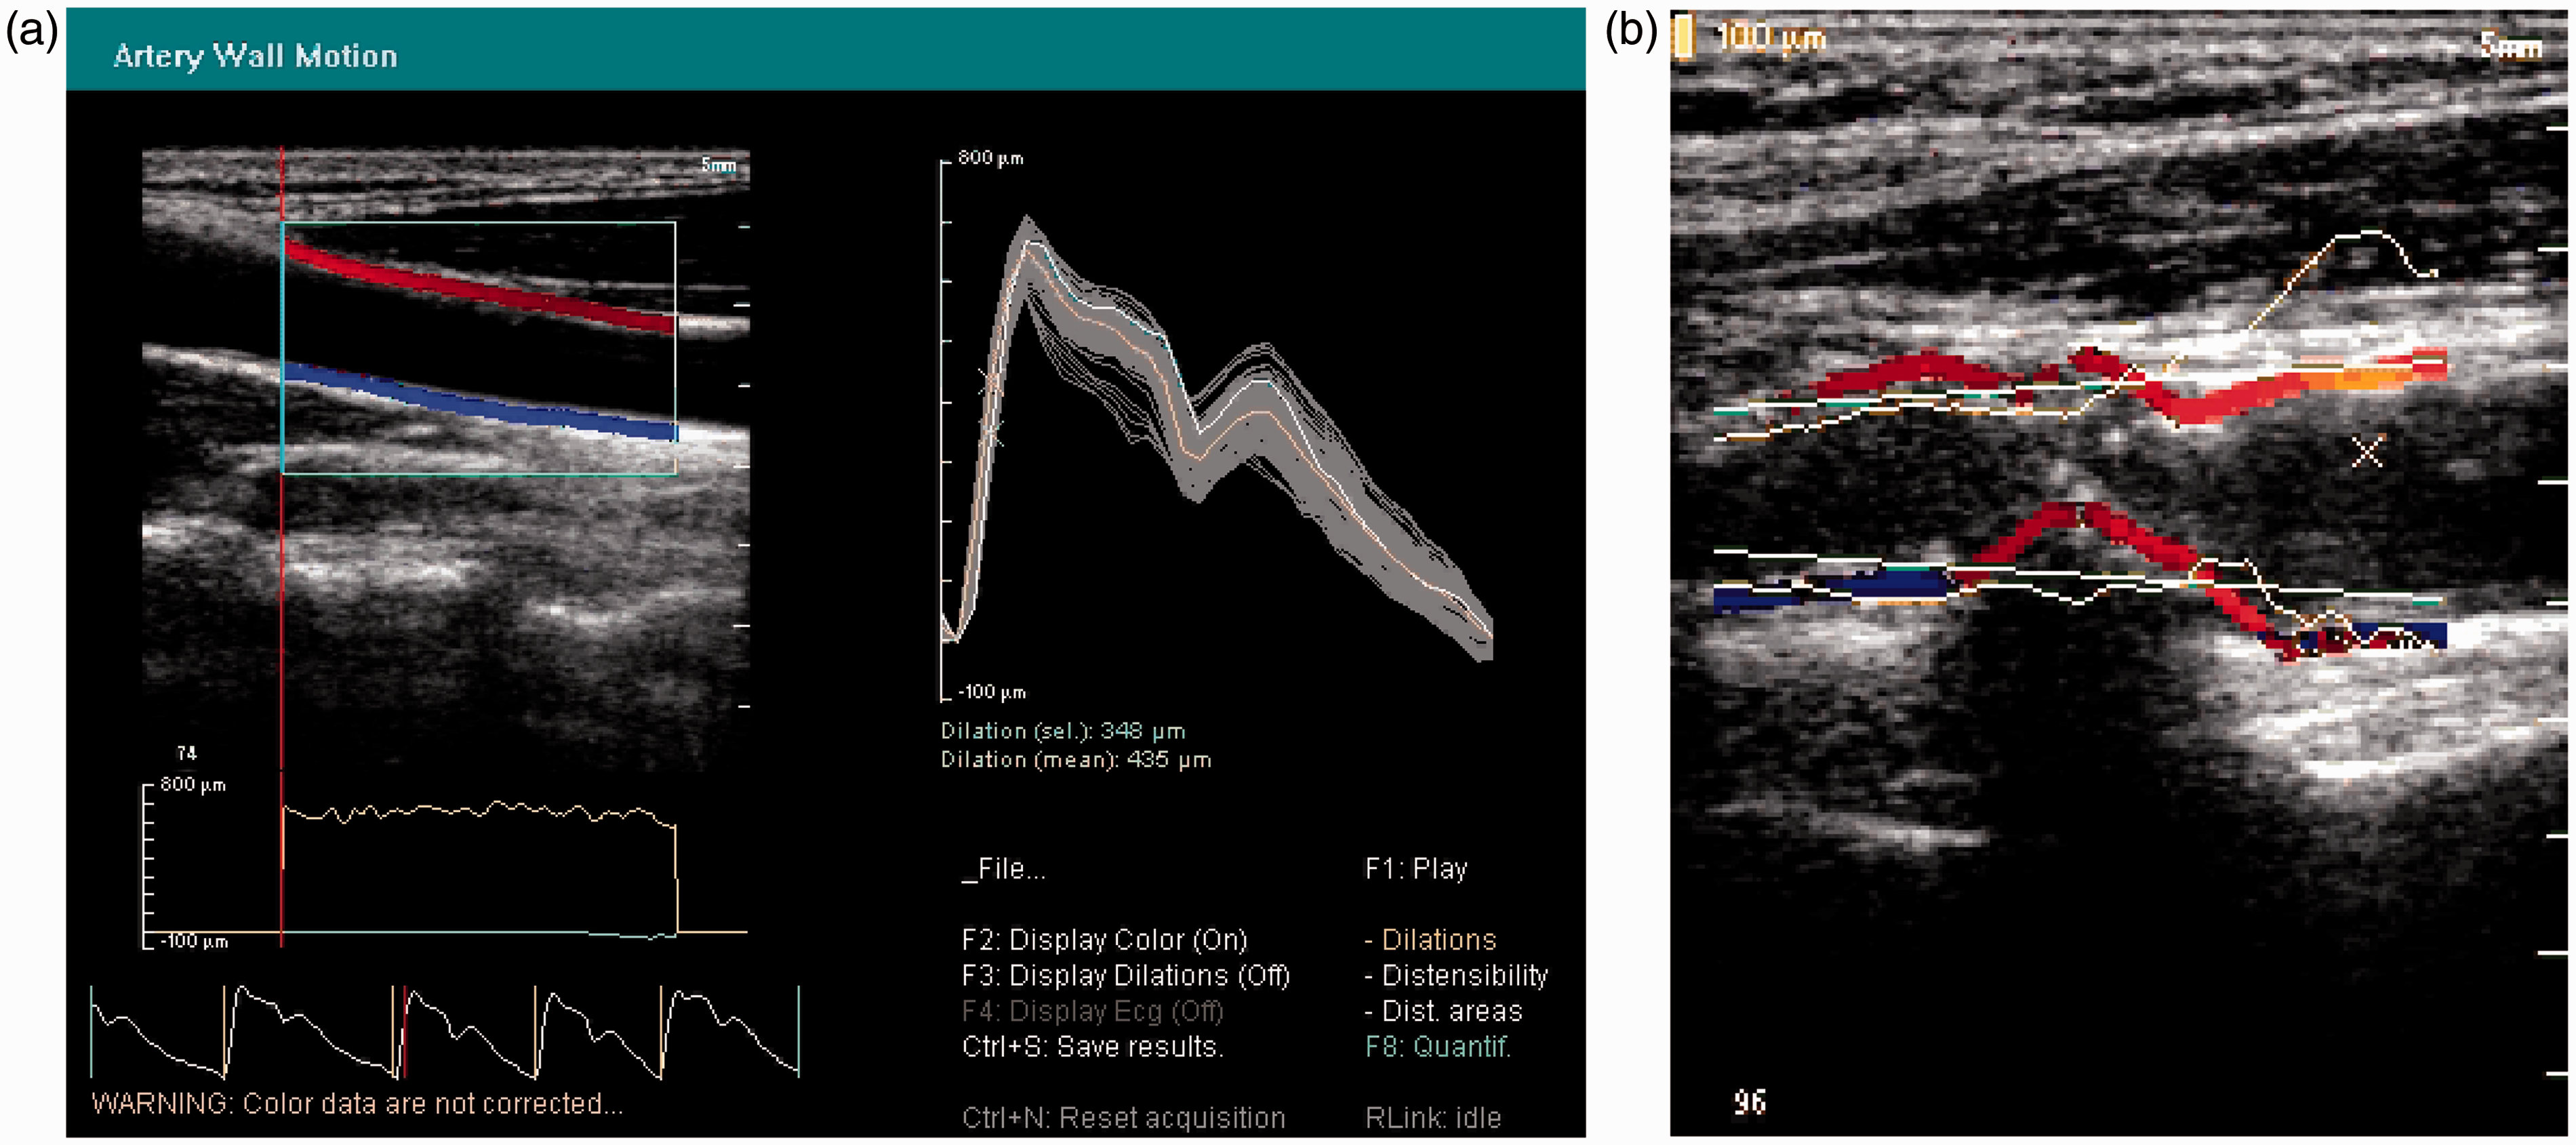
Elastography imaging
Elastography refers to measurement of imaging related to the stiffness of tissues. Elastography techniques may be divided into those that are concerned with induction and measurement of strain and those concerned with induction and measurement of shear waves. General reviews of elastography are provided by several authors.61–64 It is only shear wave elastography which will be described in this paper. Shear wave elastography involves the generation of shear waves followed by measurement of their speed of propagation within tissue. Shear wave speed c
s
is related to local tissue stiffness E by a simple formula
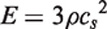
Shear waves may be induced using an external actuator. However, this then requires the use of two transducers, one to generate shear waves and a second transducer to image the shear waves. The use of a single transducer to both induce and image shear waves is far more practical in a clinical setting as it allows the operator use of their other hand to operate the controls on the ultrasound machine. Shear waves are induced by the radiation force which is present when an ultrasound beam passes through tissue. The higher the intensity of the ultrasound pulse then the higher the radiation force. In shear wave imaging, high-intensity ultrasound pulses are directed along a single beam. At the focus, the acoustic intensity is highest, as is the radiation force. The tissue is displaced momentarily (a few milliseconds) along the beam, and the displacement propagates away from the focus in the form of a shear wave with a speed of a few meters per second. In ‘supersonic imaging’ several pulses are produced with increasing depth producing shear waves that propagate from the focal zones in the form of a cone. The high-intensity beam is often called a ‘pushing beam’. Following the pushing beam, the transducer images the displacements within the tissue caused by the passage of the shear wave. Shear wave imaging requires very high frame rates, typically 10,000 per second or more, which is achieved using plane wave transmission with focus on receive. From the data on tissue displacement, the local shear wave velocity and finally the local stiffness are estimated using equation (4). Shear wave imaging was originally proposed by Sarvazyan et al. 65 and several groups have developed shear wave technology.66,67
The first commercial system for shear wave elastography imaging was produced by Supersonic Imagine (Aix en Provence, France) who released their Aixplorer system in 2008. Other manufacturers have been relatively slow in adopting shear wave imaging, but in 2015 Siemens also offer shear wave imaging. Standard diagnostic imaging transducers are insufficiently robust for the generation of high-intensity ultrasound beams needed in shear wave imaging. Also standard beam-forming systems are based on conventional focussing in transmission and reception rather than plane wave imaging. The move to shear wave imaging therefore requires manufacturers to upgrade both their transducers and their beam-forming and this may explain the slow uptake of this technology amongst ultrasound manufacturers.
Shear wave elastography has been mainly used for detection of cancerous tumours and staging of liver fibrosis.
61
However, shear wave elastography may also be used for the measurement of arterial stiffness. Couade et al.
68
were the first to demonstrate shear wave imaging in the vessel wall of a flow phantom and in-vivo in the arterial wall of a volunteer, and suggested that this method may be used for the detection of unstable plaque. This may be understood in that plaque prone to rupture, so-called vulnerable plaque, are associated with a large lipid pool and a thin fibrous cap. Stable plaque is associated with small or no lipid pool, a thick cap and a large region of fibrous tissue. It would be expected that vulnerable plaque with their large lipid pool would not be as stiff as stable plaque with their large region of fibrous tissue, so that stiffness might be used to distinguish vulnerable plaque. The potential of shear wave imaging to measure stiffness in plaque was demonstrated in flow-phantoms with simulated stenoses.69,70 A case study showing elastograms in a single carotid artery has also been published,
71
which was followed by a reproducibility study in patients with atherosclerotic plaque,
72
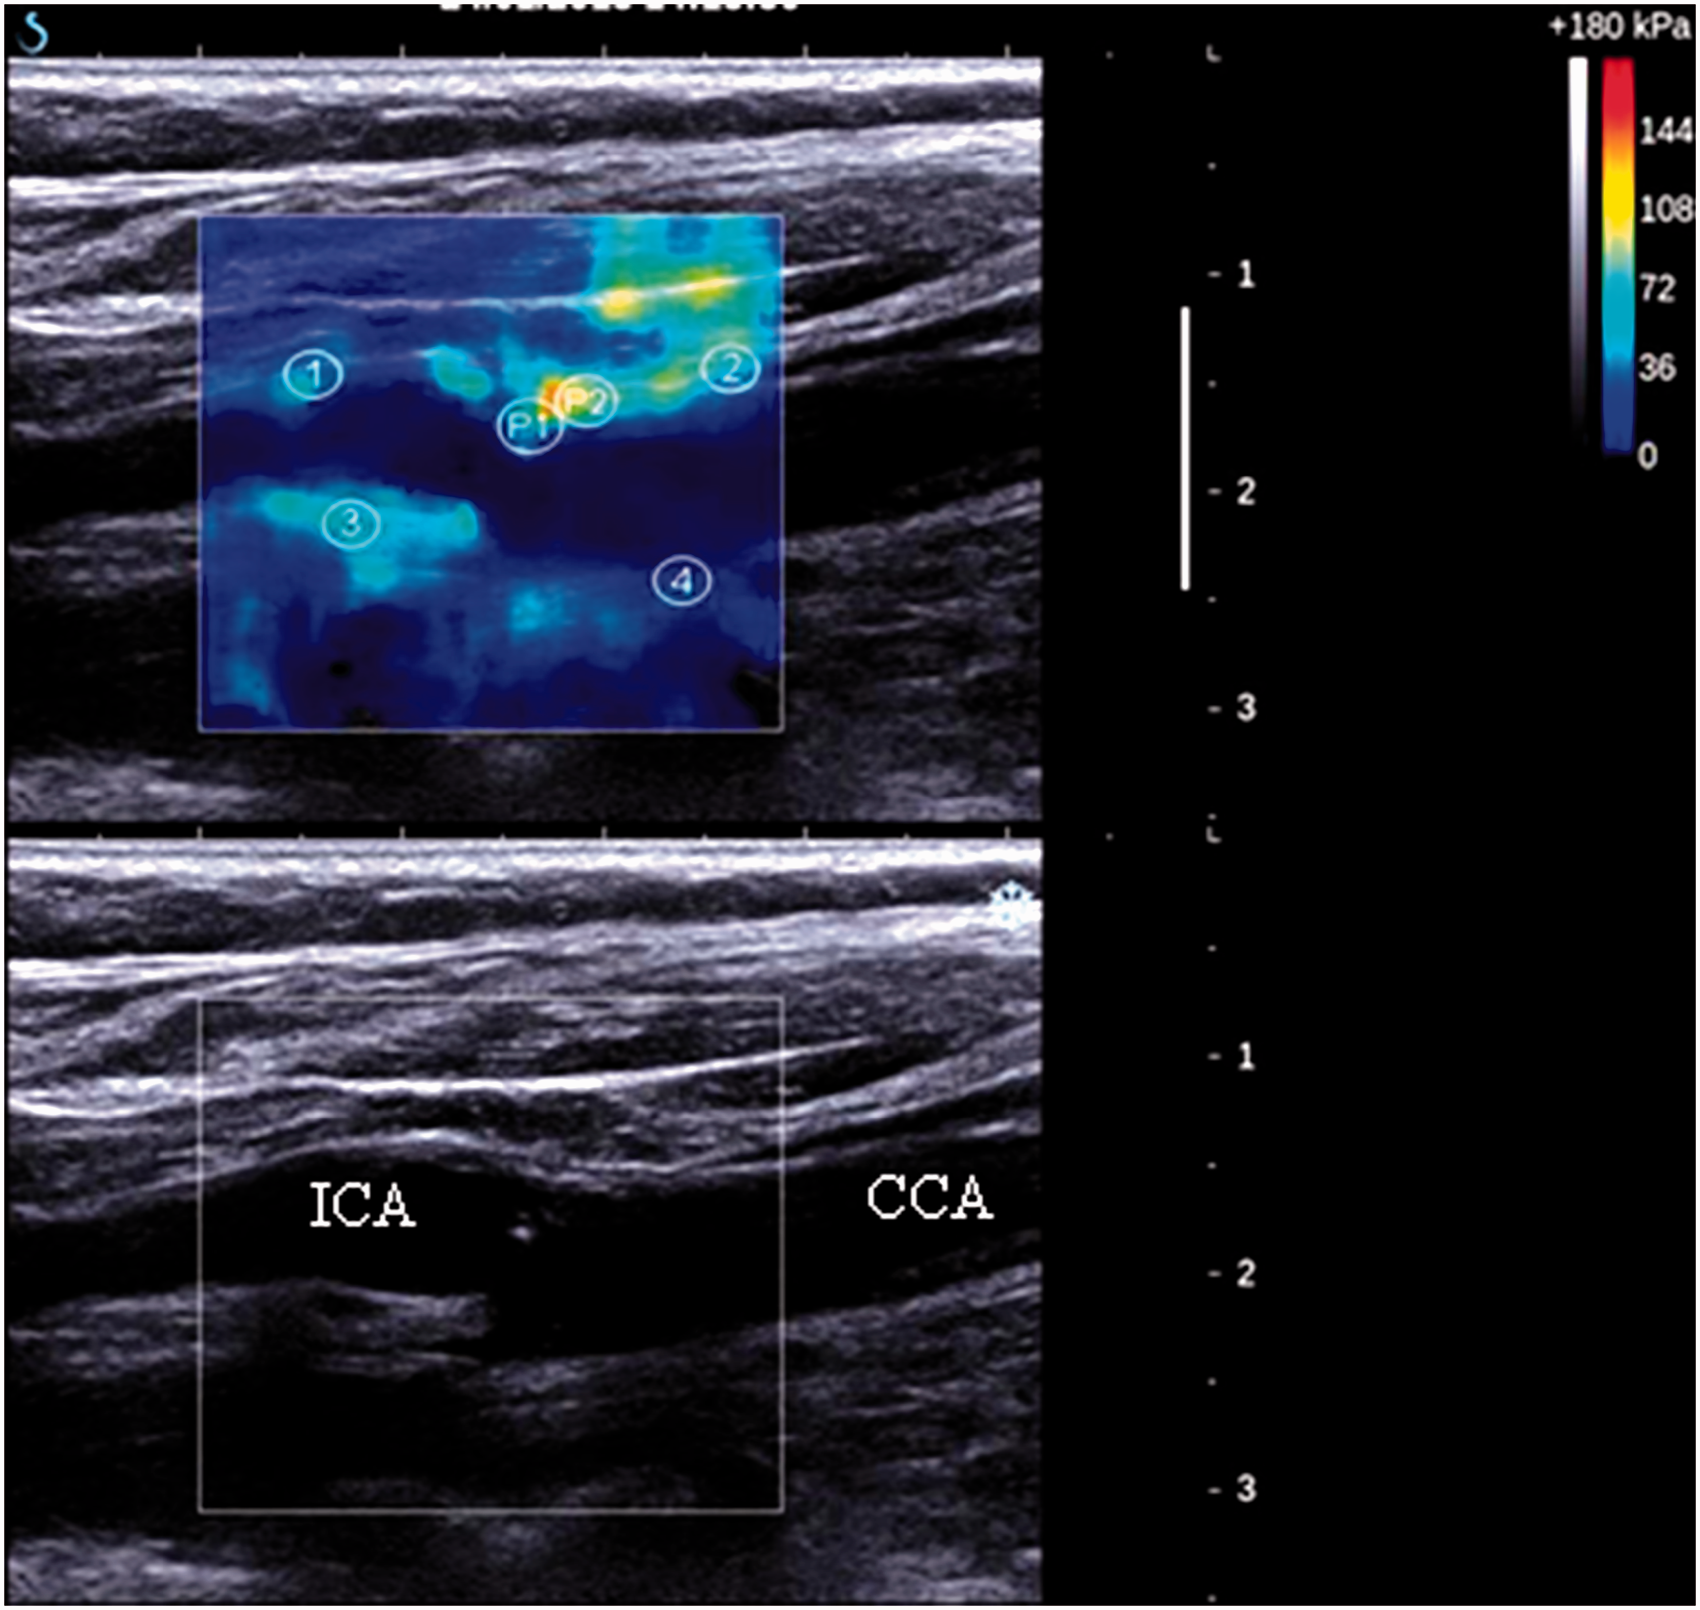
both studies using the Supersonic Imagine system. Figure 8 shows a typical example of a stiffness image from a patient with carotid atherosclerosis. Estimated stiffness is likely to be influenced by the small size of the plaque constituents compared to the shear wavelength and there is a need for a study which compares true stiffness against stiffness measured against elastography.
Typical example of a stiffness image from a patient with carotid atherosclerosis. Reproduced from Ramnarine KV, Garrard JW, Kanber B, et al. Shear wave elastography imaging of carotid plaques: feasible, reproducible and of clinical potential. Cardiovascular Ultrasound 2014;12:49; published by BioMed Central.
72
Discussion and conclusion
This review article has highlighted four vascular ultrasound technologies, which are commercially available in 2015 and has traced their origins back through the research literature. These techniques usually have a long history in the research field before they were commercially adopted. Relevant dates are: 3D plaque volume (1994), 7 colour vector Doppler (Hoskins et al. 1994), 15 wall motion (1968) 35 and shear wave imaging in arteries (2010). 68 In parallel to development time, the other issue is the clinical impact of these technologies. There has been almost no change in the basic toolkit for vascular ultrasound over the last 25 years which remains as real-time B-mode, colour flow and spectral Doppler. The main change in this time has not been the introduction of other technologies but improvements in the image quality of these three core imaging modalities. In terms of future clinical impact, the underpinning technologies of 2D array transducers and high frame rate imaging are likely to be the main drivers of technological changes. For vascular ultrasound these are likely to impact on 3D imaging, especially plaque volume, and on assessment of the elastic properties of arteries.