



Abstract
Introduction
The Royal College of Radiologists and the Society and College of Radiographers in the United Kingdom published ‘Standards for the provision of an ultrasound service’, including application-specific limiting values for resolution and penetration. No measurement methods were detailed. We aimed to explore a possible theoretical basis for the standards and to develop a measurement protocol.
Methods
Since application-specific standards fail to account for probes of different frequencies used for similar applications and no evidence for the standards was provided, we developed generic standards based on theoretical considerations. In a trial implementation of the published standards, automated measurements were made on four recently purchased scanners with a total of eight probes, results being assessed against the standards. Measurements were made on 15 modern probes and used to develop our generic standards.
Results
Automated measurements showed less inter- and intra-observer variability than manual/visual measurements. Four new ultrasound scanners with a total of eight probes all failed to meet the published axial and lateral resolution standards; three failed to meet the penetration standard. Our generic standards were tested on 15 probes, four probes failing to meet the revised standards.
Conclusions
Automated methods are essential for measurements against standards. New generic standards with a theoretical basis have been proposed. Further work is required to refine standards and methods and to determine the appropriate contributions of objective and subjective equipment selection methods.
Introduction
A number of professional bodies have developed guidelines for the quality assurance (QA) of ultrasound (US) imaging equipment, including acceptance testing.1–3 However, they offer no guidance on absolute performance criteria. In 2008, the United Kingdom Association of Sonographers referred to the absence of nationally accepted performance standards for US equipment. 4 The most recent American standard requires acceptance testing, to include quantitative measures of image quality, but provides no acceptance criteria. 5
Essential limiting values for resolution and penetration. 6
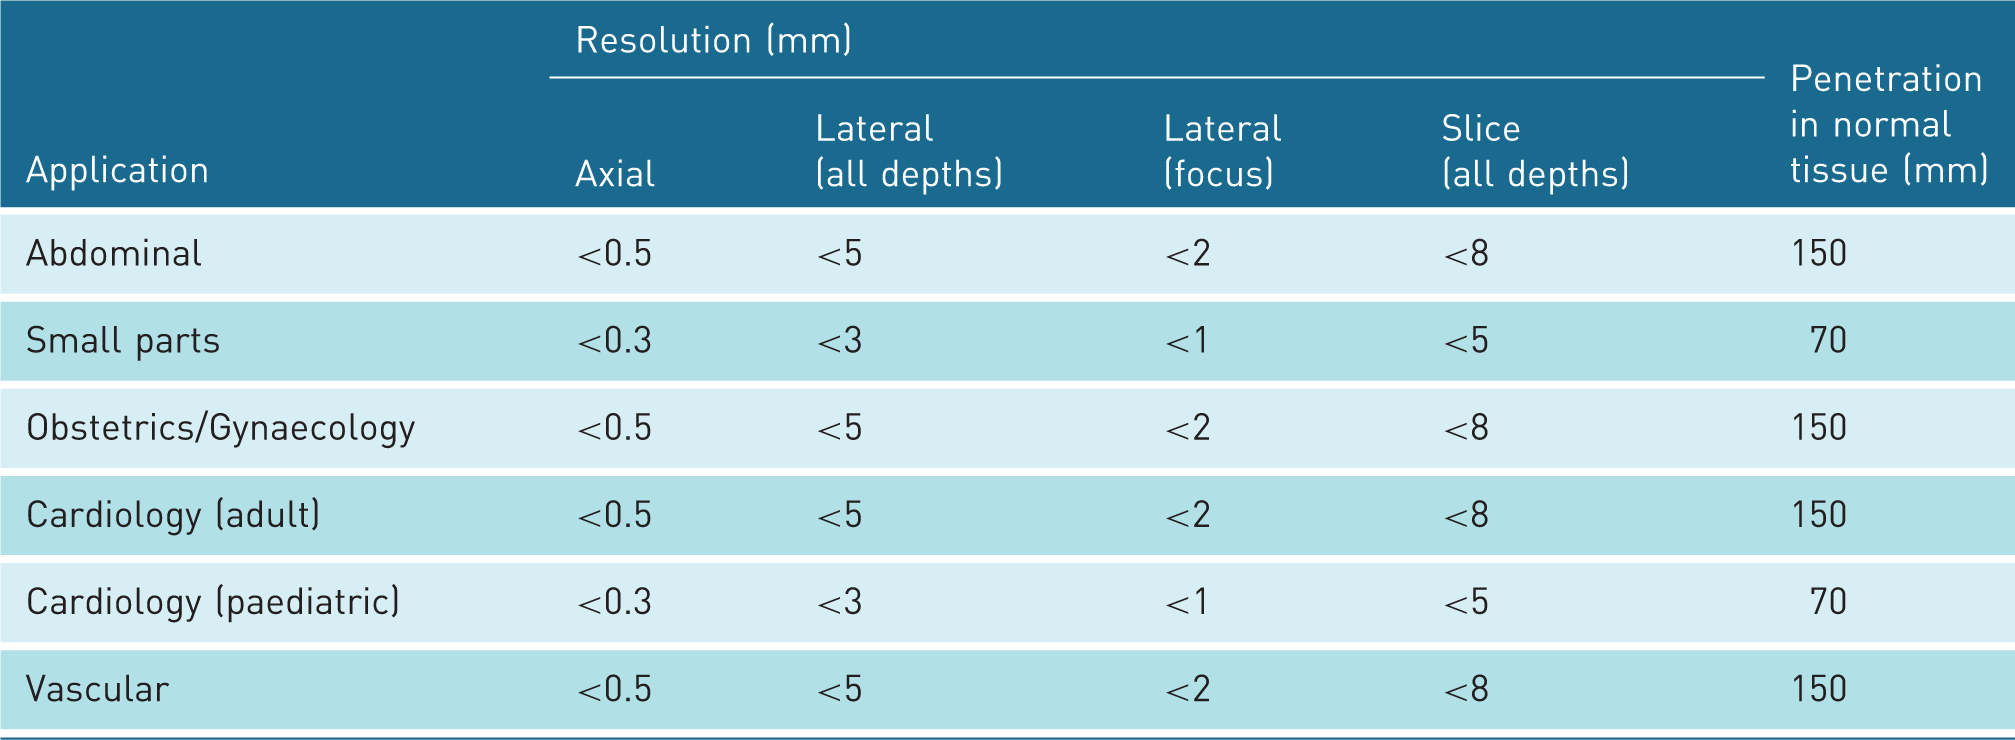
Departments attempting to implement the standards will need to make measurements on equipment to ensure compliance. In considering implementation in our organisation, we identified two caveats. The document provided no rationale or evidence base, making it difficult to justify rejection of equipment that fails to meet the standards. The document also gave no guidance on measurement methods, so it is likely that departments will use whatever methods they have available, potentially resulting in different results across the UK for the same US equipment. Departments may choose to follow the UK guidance in IPEM Report 102, 2 but this states that few measurements are accepted as representative of clinical performance, offers two alternative methods for measuring resolution and does not recommend any quantitative measurements of image quality at acceptance.
In order for implementation of the standards to be effective and consistent, an evidence base and standardisation of measurement methods are required. The aims of this project were to explore a possible theoretical basis for standards, to develop and test a measurement protocol for resolution and penetration and to assess recently purchased equipment against the standards.
Theory
The standards 6 did not provide any evidence in support of the target values, so it is worthwhile attempting to provide and test a theoretical basis, using simple models of ultrasound beam shape, and to assess the resulting target values. The standards divide applications into a small number of categories (see Table 1), whereas scanners may have a number of probes for similar applications but with different footprints and operating frequencies, in particular for small parts. In order to accommodate the associated variation in performance, more generic standards would be helpful, i.e. standards that are independent of probe type and application.
Low contrast penetration
A generic target for low contrast penetration (LCP, sometimes known as depth of penetration – DOP) may be developed by considering attenuation in a tissue mimicking test object (TMTO) and the dynamic range of modern scanners. The attenuation is typically 0.5 dB cm−1 MHz−1 (or 1 dB cm−1 MHz−1 for the imaged depth, accounting for ultrasound travelling to a target and back to the probe) and a typical dynamic range is 65 dB (this is the dynamic range of the signal following any compression and rejection and prior to display; the raw signal will have a dynamic range in the region of 100 dB; in our experience, where stated, the displayed dynamic range of modern scanners is set in the range 55 dB to 80 dB). With an attenuation of 1 dB cm−1 MHz−1, we may therefore predict the LCP as the ratio of dynamic range to frequency, e.g. at 5 MHz, the expected LCP is 13 cm. Where the dynamic range chosen by the manufacturer for a particular application is known, this may be used in the calculation. We suggest that for harmonic imaging, the receive frequency should be used in the calculation, and where frequency is not displayed then the scanner is set to high-resolution imaging and the highest frequency in the probe bandwidth (often given in the transducer description) is used in the calculation. This is a source of uncertainty and discussion with the supplier’s representative may be helpful in establishing the centre frequency used for image formation.
Lateral resolution
Providing a theoretical basis for resolution target values is more complex. Resolution depends on unknown (or difficult to obtain) variables, such as transmit and receive aperture size. Our experience, based on many years of performance measurements for QA, is that lateral resolution is best near the probe, where the receive aperture will be small, and gradually deteriorates with depth, plateauing as attenuation becomes more significant; the transmit focus has an effect on the resolution profile but this is not dramatic (see Figure 1). Resolution at depth will therefore be the limiting factor for imaging performance, so we believe that this should be used as a standard; this will be dependent on focusing on reception.
Automated lateral resolution measurements (full width half Maximum: FWHM) for a low-frequency curvilinear probe (transmit focus 77 mm) and a high-frequency linear probe (transmit focus 40 mm).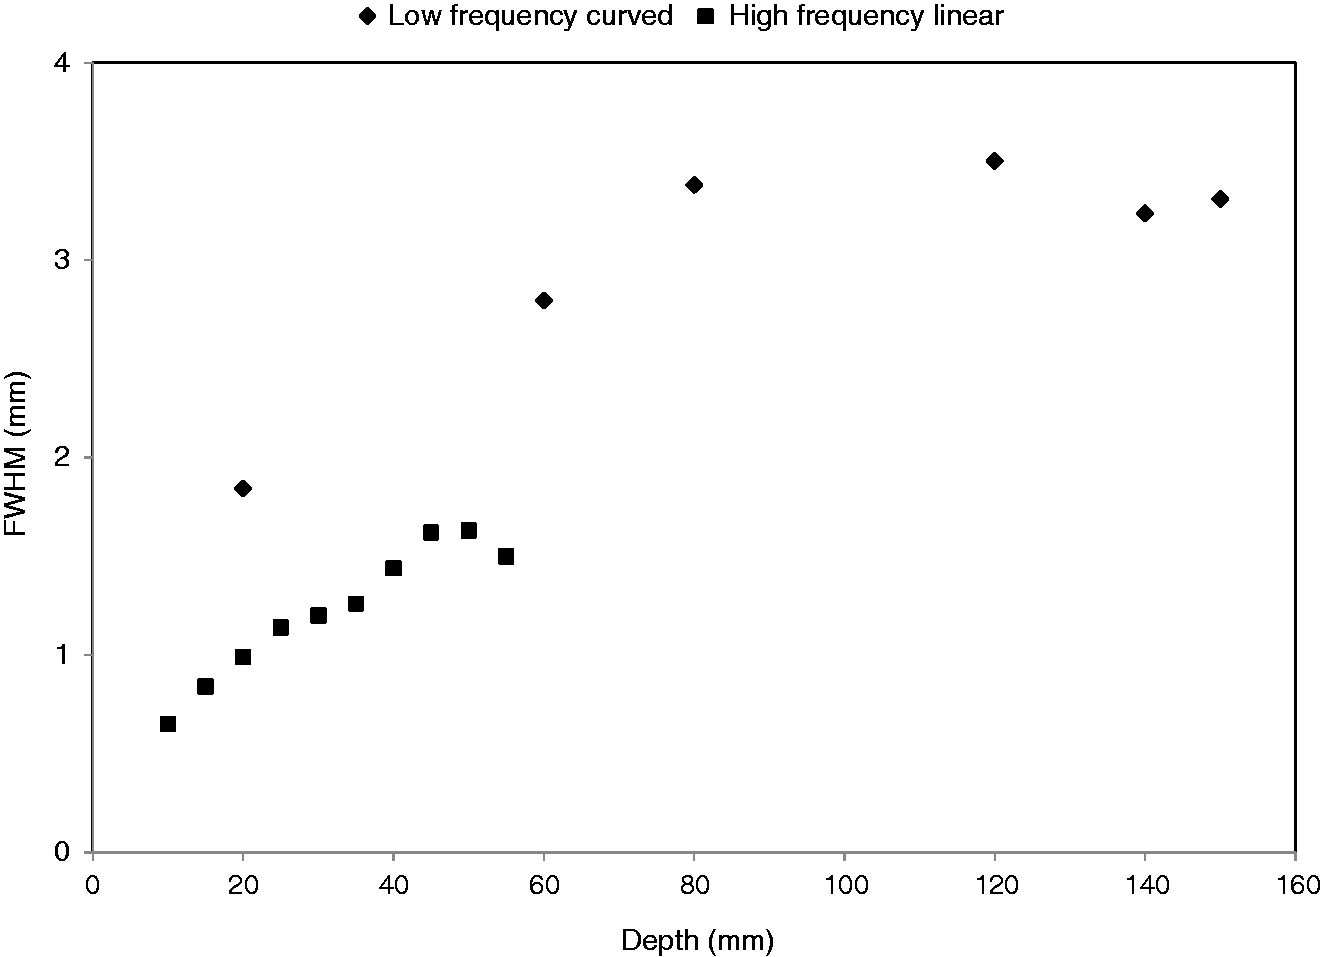
If we assume that the transmit aperture is designed such that the near field boundary (NFB) is at the LCP depth, the beam is focused at half the LCP and that the receive aperture is the same width as the transmit aperture for echoes from the transmit focal depth, then the receive aperture at the LCP will be twice the transmit aperture, since the ratio of focal length to aperture will be held constant.
7
The transmit aperture (DT) for these conditions may be approximated by rearranging the equation for the NFB and replacing it with the (equal) LCP
8


The beam widths at depth estimated using equation (2) for the probes shown in Figure 1, a low-frequency curvilinear array (5 MHz) and a high-frequency linear array (14 MHz), are 3.2 mm and 1.1 mm, respectively. Comparison with Figure 1 shows that this resolution is not achieved. This may be due to our assumptions and to weaknesses in the equations used. There are also possible physical reasons, e.g. limitations to the receive aperture for deep echoes, defocusing of the beam by various mechanisms.
Slice thickness
Slice thickness is difficult to measure close to the probe and may be underestimated at depth. Theoretically, we should expect slice thickness at the probe face to be equal to the elevational aperture, reducing towards the focus and increasing thereafter, resulting in a slice profile that is symmetrical about the focus. Our QA measurements show that this is the case, except that the increase in slice thickness beyond the focus is counteracted by attenuation, so that the worst slice thickness is near the probe (see Figure 2). Since the slice thickness near and far from the probe is determined by the fixed aperture (which may be estimated directly from the probe and, in our experience, does not vary greatly between manufacturers) and the beam is focused in the elevation direction, we believe that the slice thickness standard should be at the slice focus. For geometric elevational focusing, the target slice thickness at the focus may be estimated from
8
Automated slice thickness measurements (full width half Maximum: FWHM) for a low-frequency curvilinear probe and a medium frequency linear probe.
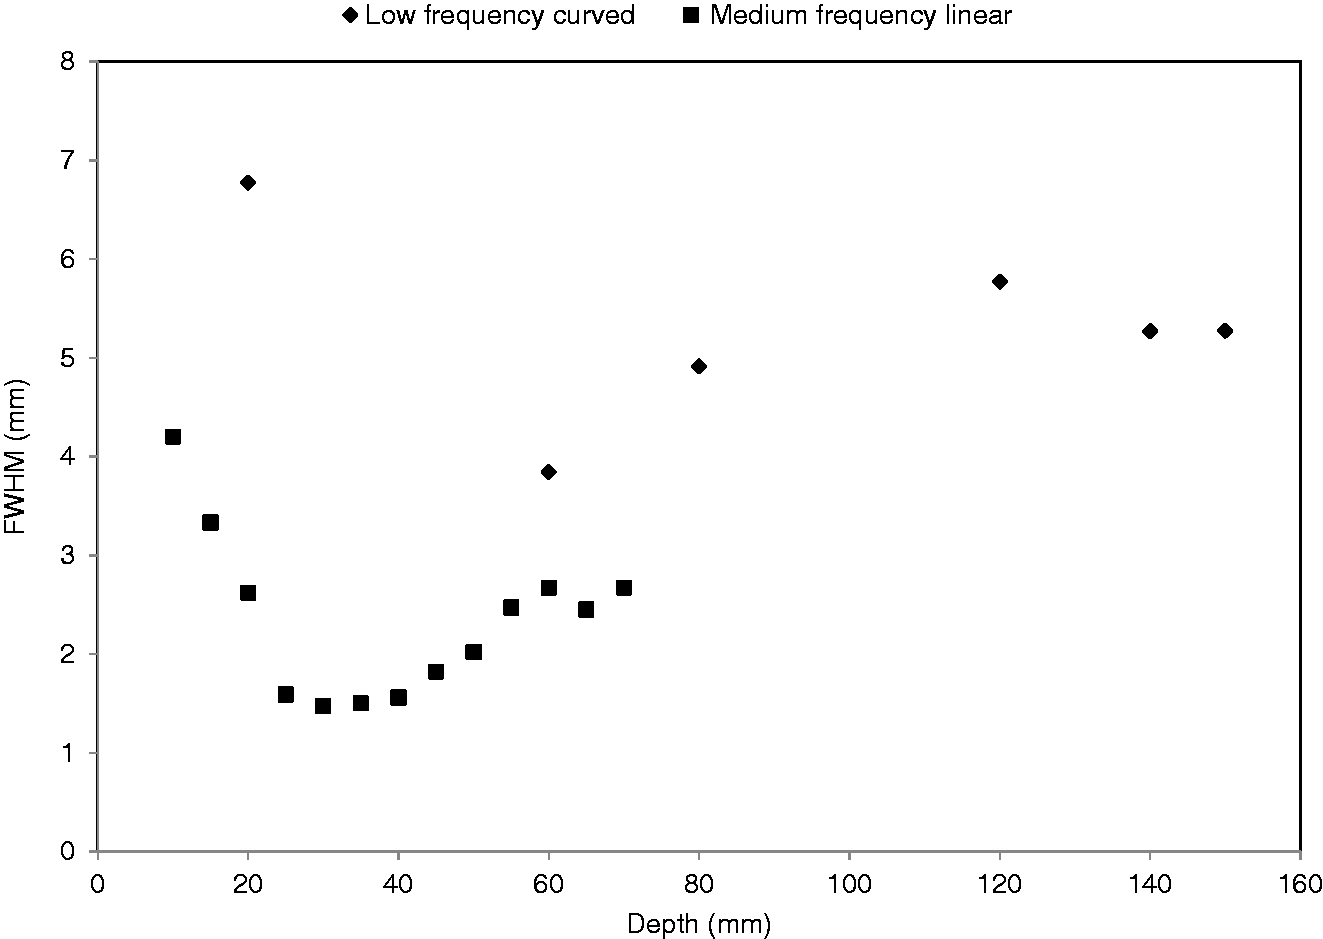
The focal slice thicknesses estimated using equation (3), assuming a focus at half the target LCP, for the probes shown in Figure 2, a low frequency curvilinear array (5 MHz) and a medium frequency linear array (8 MHz), are 3.3 mm and 1.6 mm, respectively. Comparison with Figure 2 shows that this resolution is not achieved for the 5 MHz probe but is achieved for the 8 MHz probe.
In the case of probes employing electronic focusing in the elevational plane, the same standards as for lateral resolution should be applied, bearing in mind that the receive aperture cannot exceed the width of the array in the elevation direction.
Axial resolution
In our experience, the available measurement methods for axial resolution are not fit for purpose. The targets for measurement of resolution are generally nylon filaments with a circular cross-section with diameter of the order of 0.1 mm. The wavelength of ultrasound pulses generated by the probes in a typical hospital setting range from approximately 0.1 mm (15 MHz) to more than 0.5 mm (3 MHz) in a TMTO (the wavelength in the filaments will be longer as the speed of sound in nylon is higher) so that the image of the filament is subject to axial reverberation and interference artefacts. Image pixel sizes are typically comparable with these wavelengths, ranging from approximately 0.1 mm (high frequency) to 0.5 mm (low frequency), so that the axial target profile is under-sampled and measurements are unreliable. For this reason, we did not develop a generic standard for axial resolution.
Correction factors
Since our QA results showed probes do not all meet our theoretical values for resolution and slice thickness, in order to achieve a generic standard for resolution we used equations (2) and (3) (as they include frequency and LCP dependence) and applied an empirically derived correction factor from measurements made during this study, as described in the Methods section.
Methods
Measurement protocol
All measurements were made using a default or factory scanner preset programme appropriate to the primary application of the probe, with some adjustments as follows. The display scale was set to 10 mm deeper than the target LCP for the probe/application. Acoustic output was set to 100% to maximise LCP. Speed of sound correction, if available, was disabled as any tissue-specific correction would degrade resolution in a TMTO. Any compounding or real-time image processing was left on default settings, as this would have been designed to optimise resolution and LCP. A single focus was set at approximately half the image depth. Overall gain and time gain compensation (TGC) were initially left at default settings, as they would have been optimised for tissue attenuation similar to that in a TMTO. TGC was then adjusted if necessary for a uniform grey level throughout the image and to ensure that speckle was visible at the deepest level possible.
LCP was assessed against the standard simply by visually determining whether speckle was visible at the depth specified.
Although manual measurements of resolution have a large uncertainty,10,11 this may be the only method available to many departments and so we compared manual and automated measurements before proceeding to make measurements against the standards using the automated methods only. The manual and automated methods were tested by three observers on a Toshiba Xario (Toshiba Medical Systems Corporation, Tochigi-ken, Japan) with a low-frequency curved array probe (PVT-375BT). The three observers were: (1) a Trainee Clinical Scientist, with recent basic training in ultrasound performance measurement; (2) a Clinical Scientist with over 25 years’ experience in US QA and (3) a Clinical Scientist having recently completed specialist training in imaging with non-ionising radiation. All three observers gained experience in the measurements used in this study during refinement of the protocol and agreed on the methods used in the final version. Imaging was performed using a Gammex 410 LE-SC TMTO (Gammex Inc., Middleton, WI, USA). Whilst TMTOs may have acoustic properties that differ from those in tissue in some respects, for example the ratio of absorption to scatter which may affect apparent penetration and dynamic range, these are the only standardised image quality test tools available and so will inevitably be used in assessing equipment against published standards.
The manual protocol for lateral resolution and slice thickness measurements required calliper placement between the points on the target image where the brightness was approximately 50% of maximum, avoiding weak tails. 2 For the manual method, write zoom was used to magnify the image whilst maintaining the position of the focus, resulting in a zoom factor of approximately two. The three observers each independently made five measurements of the lateral resolution at the focus and the superficial slice thickness, reacquiring the image each time and blinded to the results. Slice thickness measurements were made using the Skolnik method, 12 rotating the probe through 45° and again measuring the lateral target profile. Automated measurements of the same targets were made using the Nottingham US QA software, 11 which measures the full width half maximum (FWHM) of each target image profile after subtracting the mean background level.
Implementation
Measurements were made on our four most recently purchased high-end scanners (October 2014 to March 2015; eight probes), as these were contemporaneous with publication of the standards. Imaging was performed using one of two TMTOs: Gammex 410 LE-SC (lower frequency applications) or Gammex 404 GS-LE (higher frequency applications). Observer 2 acquired five independent images for each probe, for automated measurement, following the protocol above. The results were assessed against the standards. 6
Development of generic standards
In order to develop equations (2) and (3) into potential generic standards, observer 2 made measurements of lateral resolution and slice thickness on 15 modern probes (including the eight in the initial implementation), five of which were measured at two frequencies (harmonic and fundamental) giving a total of 20 measurements; the additional probes were included to provide a larger cohort for development of our generic standards. The probes were curvilinear (five) and linear (10); we did not have sufficient examples of different models of phased arrays and small convex (e.g. transvaginal) probes to provide meaningful results. In calculating target values, we used a nominal dynamic range of 65 dB for all probes.
Theoretical target values for lateral resolution (BW) were calculated using our generic standard for LCP and the wavelength of the stated probe frequency in equation (2) and compared with the measurements of lateral resolution obtained for the various probes, in case the simple models used did not provide a close match to practical measurements. This comparison provided an empirical correction factor (the slope of the line of best fit to the data) for converting the theoretical target values for lateral resolution into generic standards for measurements of lateral resolution.
Similarly, theoretical target values for slice thickness (equation (3)) were compared with the measurements of slice thickness to provide an empirical correction factor for converting theoretical target values for slice thickness into actual target values for measurements of slice thickness.
For each generic standard thus obtained, a tolerance of two standard deviations (SD) in the measured quantity (automated measurements) was added. As the target values are acceptance criteria for equipment purchase, we believe that a tolerance of at least 2 SD is necessary in order to avoid rejection of equipment due only to measurement uncertainty.
Results
Measurement protocol
Figure 3 summarises the manual and automated results for lateral resolution at the focus and superficial slice thickness, observers having acquired images using agreed settings. It is clear that inter-observer agreement is better using the automated method. The range of the mean values for the three observers for lateral resolution is 0.9 mm for manual measurements and 0.4 mm for automated measurements and for slice thickness the range is 0.9 mm for manual measurements and 0.7 mm for automated measurements. Observer variance is significantly smaller for automated compared to manual measurement for measurements of lateral resolution by observers 2 and 3 (p < 0.05).
Summary of five manual and five automated measurements of slice thickness (upper results; squares – manual; circles – automated) and lateral resolution (lower results; X – manual; + - automated) by each observer.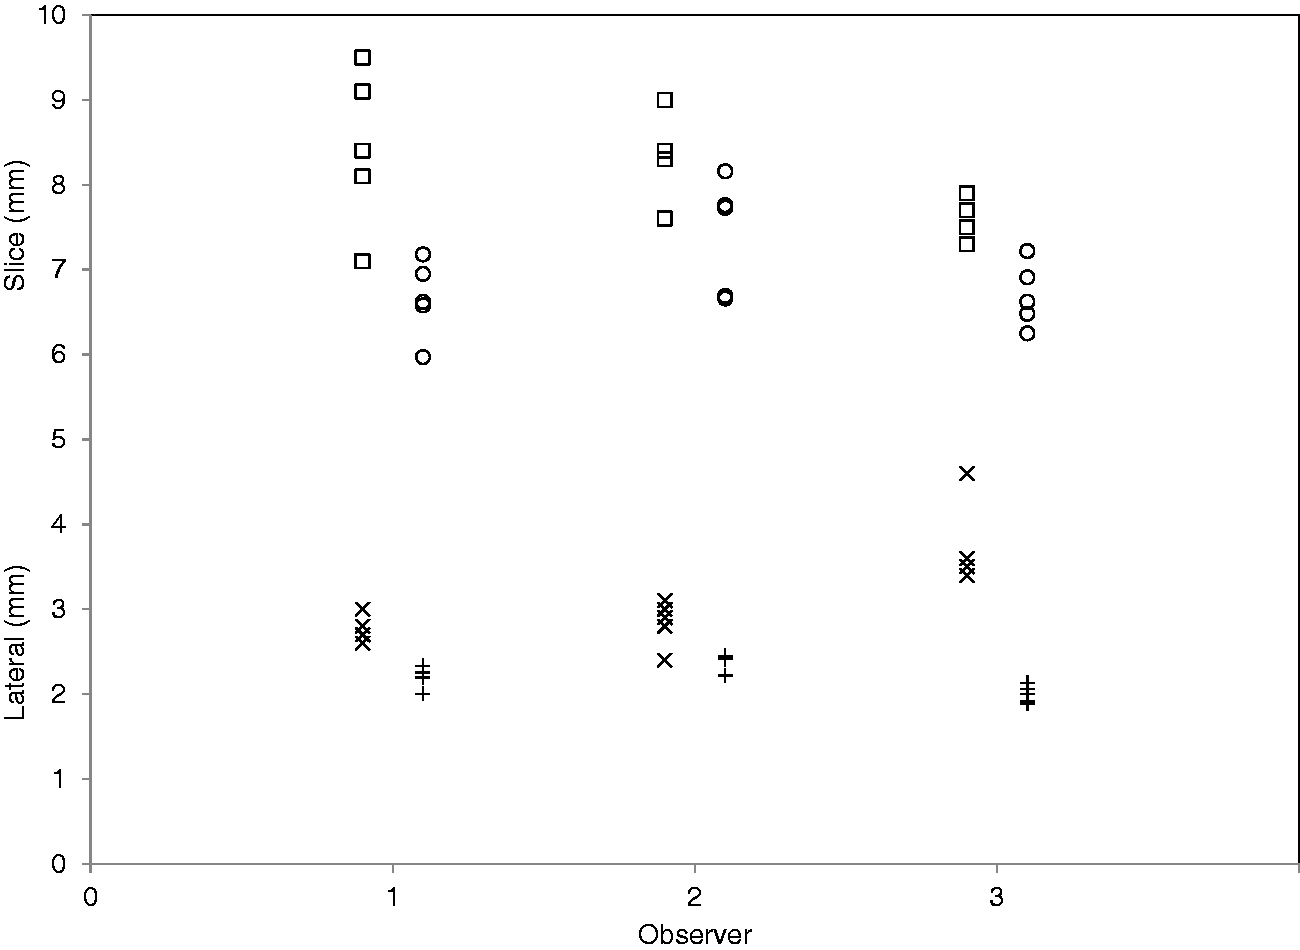
Implementation
Prospective comparison of scanner performance against the standards using the automated measurement protocol
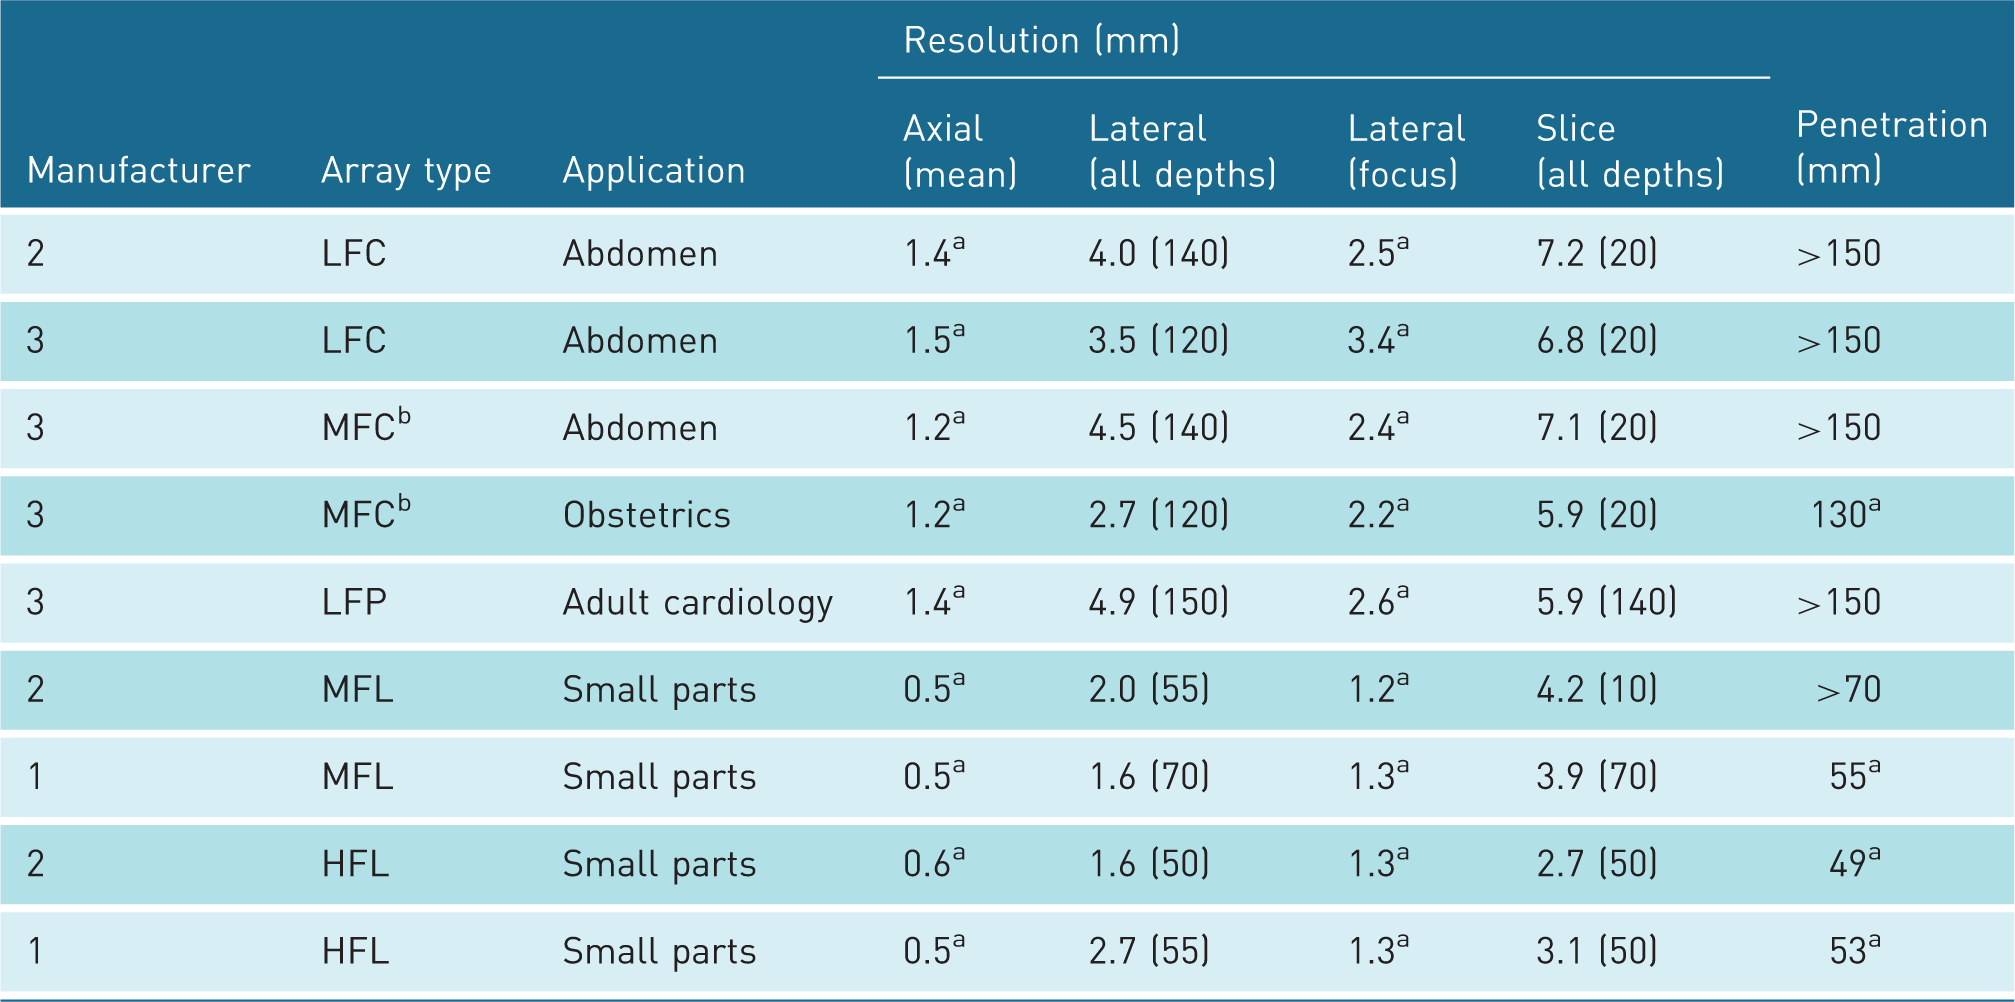
Note: Lateral and slice resolutions (all depths) are the maximum figure, with the depth of measurement in parentheses.
LFC: low frequency curvilinear; MFC: medium frequency curvilinear; LFP: low frequency phased; MFL: medium frequency linear; HFL: high frequency linear.
Failed to meet standard in Table 1.
A single MFC probe operated under two application settings.
Points to note are: (i) a single probe (MFC) failed to meet the LCP standard using obstetrics settings but met it using abdominal settings; (ii) probes of a similar frequency from different manufacturers showed similar performance, with the exception of lateral resolution for high frequency linear probes. The high-frequency linear probe with considerably worse lateral resolution than the other linear probes was attached to a scanner with a speed of sound correction which was turned off for the measurements; however, it was noted that better resolution was possible with a speed of sound adjustment applied, suggesting an anomaly with the beam forming algorithms for this probe.
Development of generic standards
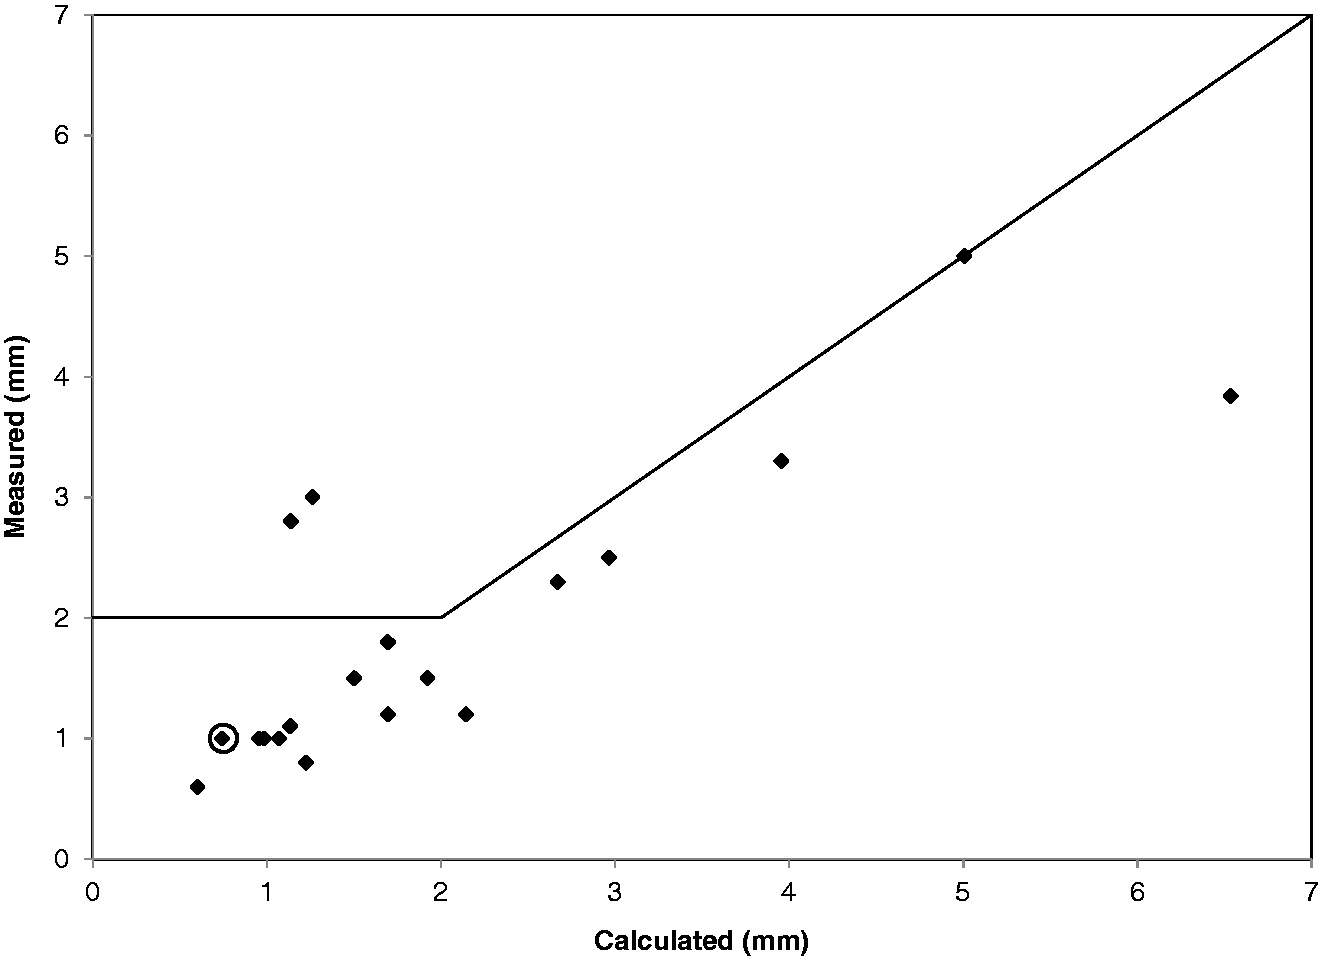
Figures 4 and 5 show the measurements of lateral resolution and slice thickness against the theoretical target values calculated from equations (2) and (3). The correction factors for converting theoretical target values into generic standards for measurements of lateral resolution and slice thickness were taken to be the gradients of the best fit lines to the data (1.08 and 0.79, respectively).
Measured versus calculated lateral resolution at depth. The solid line showing the proposed standard; points above this line fail. The circled point is a high-resolution linear probe with a suspected beam forming algorithm anomaly. Measured versus calculated slice thickness at the focus. Solid line showing the proposed standard; points above this line fail. The circled point is a high-resolution linear probe with a suspected beam forming algorithm anomaly, affecting lateral resolution but not slice thickness.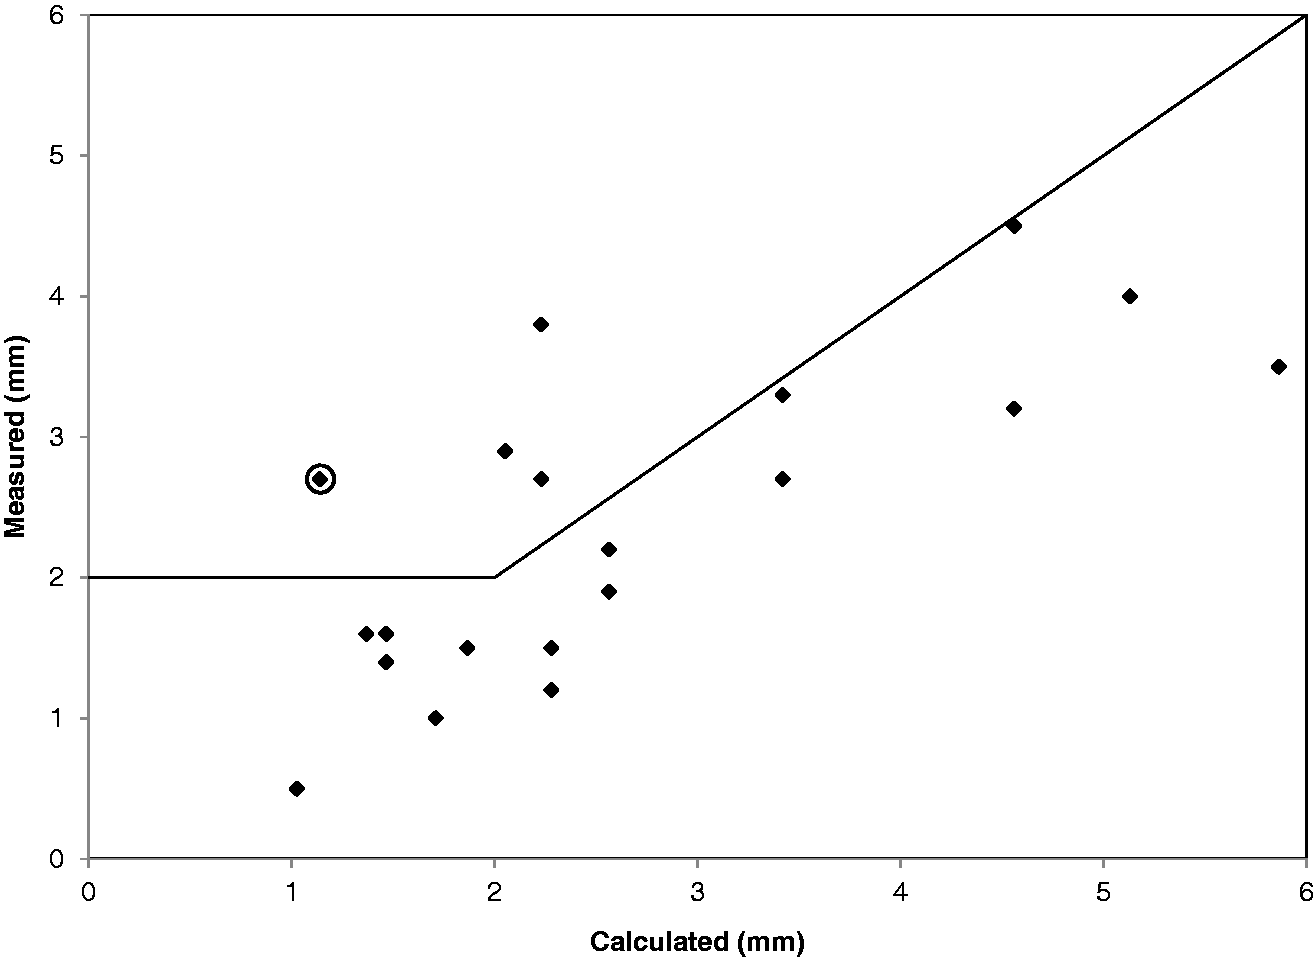
Our proposed generic limits for resolution and penetration (all distances in mm)
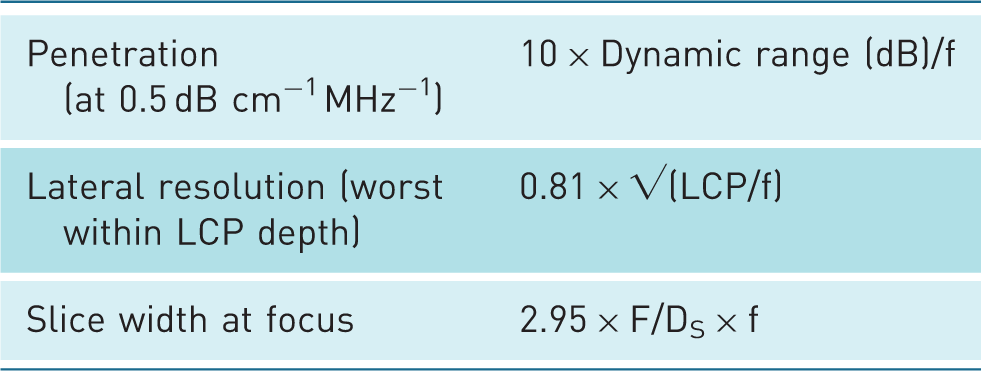
f: frequency (MHz); LCP: low contrast penetration; F: focal depth; DS: slice aperture.
Inspection of the data shown in Figures 4 and 5 shows that four probes failed to meet the revised standard for lateral resolution and two of these probes also failed to meet the revised standard for slice thickness. Only one of the probes tested in the initial implementation of the testing protocol failed to meet our generic standards (circled in Figure 4); this was the high-frequency linear probe, where it was noted that better resolution was possible with a theoretically inappropriate speed of sound adjustment applied.
Discussion
Manual/visual measurement methods should not be used to assess equipment against resolution performance standards, since automated analysis of images provides more reproducible measurements.
For LCP, the pass/fail criterion is easily visualised and automated analysis is not essential. Resolution target performance values should be set to account for some measurement uncertainty in automated measurements. We use the Nottingham US QA software, 11 which is not yet widely available. UltraIQ (Cablon Medical BV, Leusden, the Netherlands) 13 is a commercial package that provides resolution measurements including FWHM, full width tenth maximum and −6 dB width; detail of the method used has not been published, but it is likely that the FWHM and −6 dB width results would be very similar to those produced by the Nottingham US QA software. QA4US is a freely available package; details of the original version have been published 14 and an updated version is available. 15 Although designed to measure resolution at the focal depth, the software allows interactive selection of filament targets for measurement, returning an FWHM value which will be similar to the result produced by the Nottingham US QA software.
In addition to standardising measurement methods, possible differences between TMTOs must be considered. Different tissue mimicking materials may have the same attenuation but different backscatter and different frequency and temperature dependence, potentially resulting in different LCPs and resolution measurements. 16 Speed of sound in TMTOs used for this purpose must match the calibration speed of the equipment, usually 1540 m s−1, otherwise the ultrasound beam will become defocused. It is also important for TMTOs to include targets at appropriate depths to allow adequate sampling of the beam profile.
Measurement of performance of four high-end scanners against the standards revealed a general failure to meet the standard for lateral resolution at the focus and three of four small parts probes failed to meet the penetration standard. If tested against the standards as part of a selection process, the scanners would all have failed. Comparison of the results (Table 2) with the standards (Table 1) shows that the probes exceeded the limiting values in the standards for lateral resolution and slice thickness at all depths by up to 47%. A small range of application-specific standards is not appropriate and the standards do not match current equipment performance.
Table 2 also shows that performance can be markedly different for the same probe using different application-specific settings (medium frequency curvilinear, abdomen and obstetrics). In attempting to optimise settings, there may be hidden adjustments to the image that adversely affect performance in a test object. We have encountered an example of this in hidden speed of sound corrections on equipment from at least one manufacturer. If an application is selected, where the speed of sound in tissue differs from the speed of sound in the test object, then the resolution will be affected. It is important to know about such corrections and to choose an application setting without the correction, if available.
Modern developments, such as probe advances, compounding, real -time processing, coded excitation and tissue harmonic imaging, should improve resolution and penetration. However, these have been implemented in different ways by manufacturers and have been targeted at patient imaging so there may be different and unpredictable effects in test object imaging. These caveats may be overcome by allowing the person demonstrating the equipment, usually the supplier’s clinical applications specialist, to optimise the equipment for the test.
Our proposed revised generic standards (Table 3) are a first attempt at setting evidence-based acceptance thresholds for ultrasound equipment and were based on a limited range of equipment so may not yet be applicable to all makes and models of scanners and probes. These generic standards will be further developed as more data become available. Generic standards for phased array and small convex probes are still required and are likely to be different to those for linear and curvilinear probes due to differences in image formation methods.
The single new probe that failed to meet our generic standards appeared to have a problem with its beam forming algorithm, so our generic standards were successful in identifying this probe.
Current practice is to clinically evaluate equipment to inform purchase. Clinical assessment will combine variables, i.e. the user is looking at overall image quality for particular applications and this will be influenced by resolution, contrast, noise, field of view, image acquisition and processing algorithms and probably other variables. Clinical users will also consider issues, such as ease of use and familiarity. Familiarity with the image appearance on a particular scanner may introduce bias into the process, which is already subjective. Ideally, equipment should be evaluated based on measures of clinical efficacy, e.g. the sensitivity for imaging a particular pathology, but this would require a large-scale clinical trial.
There is, therefore, a need for more objective assessment methods to be used in conjunction with clinical assessment. Future work will include developing generic standards for phased arrays and small convex arrays and carrying out clinical and TMTO-based evaluations in parallel to refine our generic standards and methods and to determine the appropriate relative contributions of objective and subjective evaluation methods in equipment selection.
Conclusions
The standards were published without any theoretical basis, evidence base or measurement methods and so we have proposed revised, generic standards which require further development and testing. Automated methods have smaller inter- and intra-observer variability than manual resolution measurements, but conservative tolerances are still required due to levels of uncertainty.
Footnotes
Declaration of Conflicting Interests
The author(s) declared no potential conflicts of interest with respect to the research, authorship, and/or publication of this article.
Funding
The author(s) received no financial support for the research, authorship, and/or publication of this article.
Ethical approval
Not applicable.
Guarantor
NJD.
Contributors
NJD researched and conceived the study. All authors performed measurements and contributed to protocol development. NJD analysed the data and wrote the first draft of the manuscript. All authors reviewed and developed the manuscript and approved the final version.
Acknowledgements
We are grateful to Gammex Inc., Middleton, WI, USA for loan of the Gammex 410 LE-SC test object.