



Abstract
Introduction
The aim of this study was to compare the intra-observer repeatability when using two different methods for estimating the volume of foetal urinary bladders.
Method
The urinary bladders of 20 foetuses were documented by three-dimensional ultrasound. Standard deviation was compared when the volumes of identical bladder images were repeatedly estimated using the Virtual Organ Computer-aided AnaLysis and the experimental SUM-OF-CYLINDERS methods.
Results
No systematic deviation was found between the estimated volumes when using these two methods. Standard deviation was smaller for the SUM-OF-CYLINDERS compared to the Virtual Organ Computer-aided AnaLysis method (p < 0.0001). In relation to bladder volumes of 5–25 ml, standard deviation was 11–14% for the Virtual Organ Computer-aided AnaLysis and 4–5% for the SUM-OF-CYLINDERS method.
Conclusions
Using three-dimensional ultrasound images adapted for the Virtual Organ Computer-aided AnaLysis method, foetal urinary bladder volumes can also be estimated using the SUM-OF-CYLINDERS method. The SUM-OF-CYLINDERS method employs technical advances which may result in a lower standard deviation and therefore higher intra-observer repeatability.
Introduction
Assessing the urine production in foetuses may lead to important advances in our understanding of foetal physiology in normal and complicated pregnancies.1–7 During the filling phase, the increasing volume of the urinary bladder can be observed, documented and estimated by ultrasound.8–16 Volumes taken at different time points within one filling phase allow the hourly foetal urine production rate (HFUPR) to be calculated (Figure 1).
Initially, the bladder was filled up to 19 ml before emptying and a new filling phase began. This is a previously unpublished examination by the author (M.F.) of a 32-week foetus, the HFUPR of 33 ml/hour was estimated by regression function and extrapolation to a time span of 1 hour.
Estimation of each one of the volumes includes measurement error, which could be demonstrated as differences between the findings when repeating the assessment of identical bladder images. This error will be incorporated in the HFUPR calculation and its value is fundamental in order to evaluate the reliability of HFUPR measurement.
Foetal organs can be studied by two- (2D) and three-dimensional (3D) ultrasound. The 3D technique enables detailed anatomical evaluation of certain organs. Documented images, stored in the ultrasound computer memory, may be activated after the examination, manipulated on the screen and fully analysed. In the current study, the well-established Virtual Organ Computer-aided AnaLysis (VOCAL™) software was one alternative used for volume estimation of foetal urinary bladders. Two perpendicular bladder projections are required for this method.
Volumes of symmetrical organs can be estimated by 2D ultrasound but the assessments need additional manual calculation. The foetal urinary bladder has been assumed to be a symmetrical rotational body based on the results of previous studies.17–22 This reduces the information needed for volume estimation; only one appropriate longitudinal 2D image is required. Such an image is a projection that follows the entire central axis through the horizontally positioned longitudinal bladder image. No additional projection is needed for volume calculation. This is the precondition for application of the experimental SUM-OF-CYLINDERS method, which was the other alternative method in the current study for volume estimation of the foetal urinary bladder. 23
The use of two instead of one bladder projections, which is needed for volume calculation by the VOCAL™ method, might increase variability. Based on this hypothesis, the volume variability was compared when using the SUM-OF-CYLINDERS vs. the VOCAL™ method. Assuming the variability to be normally distributed, standard deviation (SD) was used. The aim of this study was to compare SD when estimating the volumes of foetal bladders using these two methods.
Method
The study was performed between 2006 and 2009 at the Department of Obstetrics and Gynaecology, in Kongsvinger Hospital, Norway. Information about the study, which was approved by the Medical Ethics Committee in Oslo, was given to women with singleton pregnancies. The first 20 women who gave their informed consent were included in the study and allocated at different gestational ages (19–38 weeks) to 1 extra ultrasound scan of the foetal urinary bladder. These scans were performed by one observer (V.S.). To detect any age-related problems for examination the foetuses were scanned at different gestational ages. There were no exclusions. The newborn children were healthy.
A 3D ultrasound machine, Voluson 730 Pro (General Electric Medical System, Milwaukee, WI, USA), with the volume estimation software VOCAL™ was used in combination with a 4–8 MHz curved-array 3D transducer. Also, a PC (Hewlett-Packard laptop ProBook 4520) with Windows 7 operating system and Microsoft Office software was used in combination with the computer program Mathcad (Parametric Technology Corporation, 140 Kendrick Street, Needham, MA 02494 USA) version 11.0.
For each foetus, the observer V.S. selected a longitudinal image plane through the foetal urinary bladder free from shadows. The image quality was optimised by adjusting the level of focus and using harmonic imaging. Each 3D ultrasound sweep generated a set of bladder projections which were documented (Figure 2).
The projections are electronically interconnected by the software of the ultrasound machine and move congruently when the observer subsequently rotated and moved the different bladder projections in parallel shifts along the x-, y- and z-axis. With the purpose to select an appropriate bladder image, the longitudinal projection (upper left, Figure 2) was modified until the observer subjectively achieved a horizontal projection with the longest dimension and sharpest possible boundaries. This modified set of bladder projections for each foetus was stored on the hard drive of the ultrasound machine. Study material: 20 sets of bladder projections with appropriate longitudinal bladder images included.
By 3D ultrasound, the investigated object is presented as a set of four images on the ultrasound screen: one longitudinal (upper left), one transverse (upper right), one coronal (lower left) 2D projection, whereas the lower right is the 3D image. Each image is framed by a square, whose vertical and horizontal dimensions were calculated in millimetres and recorded by the observer for following calibration (in Method section).
Volume estimation by the VOCAL™ method
The ultrasound software VOCAL™ with semiautomatic volume calculation was used. For each one of the bladder projections, the observer E.S. manually moved a loop of 40 interconnected dots on the screen and positioned the loop around the bladder in the longitudinal projection for volume estimation (Figure 3). By pressing the control “Next”, the perpendicular projection was activated. It is to be noted that the observer has no control of the selection of this bladder image. The foetal pelvis might cause disturbing shadows, which hide parts of the bladder image. Nevertheless, the observer had to outline the bladder border with the loop of dots. When the observer pressed the “Done” button, the volume calculation was performed by a procedure of rotating the projection around a fixed axis, while 2D contours were automatically delineated on each plane. In this study the rotational angle of 6° was used, indicating that 30 steps of rotation were applied for volume estimation. This procedure was repeated for all cases (20 sets of bladder projections) and the results were documented as paper copies, blinded for the observer. With an interval of at least one day, the 20 bladder images were re-examined a further six times, giving 20 × 7 volume estimates.
Operating manual instructions for high image quality were followed. This figure illustrates a bladder volume calculation and how the 2D longitudinal bladder section was traced by forty electronic dots. The coronal section (lower left) is automatically outlined without the observer’s participation.
Volume estimation by the SUM-OF-CYLINDERS method
The study material, stored on the hard drive of the ultrasound machine, was copied, transferred and stored on a PC as bitmap files (BMP-files). These files were called primary BMP-files. Based on the same 20 sets of bladder projections used in the previous estimates, the volumes were also estimated by the SUM-OF-CYLINDERS method. Only the appropriate 2D longitudinal bladder image was needed. This image, composed of a matrix with pixels (like ultrasound images in general), was magnified to view the bladder border in detail (Figure 4). Each pixel has the shape of a square with a side length of approximately 0.2 mm. In general, the colour of the pixels on the screen is determined by an additive combination of red, green and blue components, based on International Red–Green–Blue (RGB) colour standard. Using Microsoft Paint software, the observer M.F. exclusively traced the pixels of the bladder border using the pen tool, creating a red outline with maximum red intensity and minimum green and blue intensity. This image was saved as a secondary BMP-file. A side view of the magnified longitudinal bladder image shows numerous of vertical stripes of pixels within the marked borders, each 1-pixel-wide but with varying heights (Figure 5). Assuming the bladder to be a rotational body, each stripe becomes the diameter of a cylinder. The volume of the bladder can be calculated by adding together the volumes of these parallel cross-sections or cylinders. The tracing and storing procedure was repeated a further six times for each case with at least one day in between, giving 20 × 7 volume estimates, stored in the PC.
Because images with different maximum depths were included in the study, each image was calibrated using supplementary Excel files. The relationship between the number of pixels and length in millimetres was calculated in the following way. Each image of the bladder projections was framed by a square, whose vertical and horizontal dimensions were recorded when the study material was selected (see Figure 2). In the BMP-file, the vertical and horizontal coordinates of each pixel are displayed to the left of the information row. By utilising the endpoint coordinates of the vertical and horizontal sides of the framing square, the number of pixels was related to the lengths previously documented. This information was recorded in the calibration Excel-files.
All secondary BMP files (see Figure 4) and Excel files were stored in the computer before any volume assessment was performed, avoiding the observer being influenced by the results. The bladder volumes were then calculated by an algorithm (Mathcad software), based on the secondary BMP-file and corresponding calibration Excel-file.
23
The tracing procedure was simplified after magnifying of the bladder image. Every single pixel included in the bladder contour was traced solely by the red colour component with the highest intensity (RGB value 255, 0, 0).
The software MathCad was programmed to scan the secondary BMP-file, with the bladder border outlined by red pixels. All vertical stripes (one pixel wide) of the image were examined from right to left and from top to bottom. In the position of the horizontally oriented bladder image, the stripes included two pixels with the red colour, one in the upper part and one in the lower part of the bladder border.
The number of pixels between the two red pixels of each stripe was calculated, giving the length (millimetres) according to the calibration Excel-file (Figure 5).
A side view of the magnified longitudinal bladder image shows, from right to left, numerous of vertical stripes of pixels within the marked borders, each one-pixel-wide but with varying heights. The height of each stripe becomes the diameter of a cylinder. A one-pixel-wide cross-section or cylinder is extracted for illustration. The volume of the bladder can be calculated by adding together the volumes of these parallel cross-sections or cylinders. Each cylinder volume was calculated by the base area (π × diameter/2 × diameter/2) multiplied by the height of one pixel.
Statistics
In the study, there are two groups of paired continuous data, the bladder volumes estimated by the VOCAL™ and SUM-OF-CYLINDERS method. Bland–Altman analysis was used to estimate an agreement interval, within which 95% of the volume differences between the estimates of the groups were found. 24 SD of volumes was calculated for repeated estimation of identical bladder images within the VOCAL™ and SUM-OF-CYLINDERS group. SD of the estimated volume can be related to the bladder volume. 25 The scatter plots demonstrated a linear relationship between SD and corresponding bladder volume for the SUM-OF-CYLINDERS but not for the VOCAL™ method, for which a quadratic regression model was used. The two regression models for the SUM-OF-CYLINDERS and VOCAL™ methods were compared using an F-test, testing for equal linear terms in the two models and zero quadratic term in the VOCAL™ model. The Wilcoxon signed rank test was used to compare the SD of the two methods. Both methods were jointly included in the same model, taking intra-individual dependencies into account by assuming a general covariance structure within each individual.
Results
The regression analysis showed for the VOCAL™ method the relation: SD = 0.06396 + 0.09288 × Volume + 0.00177 × Volume2 (r2 = 0.97). For the SUM-OF-CYLINDERS method, the relationship was: SD = 0.0586 + 0.0337 × Volume (r2 = 0.52). SD for the VOCAL™ method was significantly greater (p < 0.0001) than for the SUM-OF-CYLINDERS method (Table 1). Based on these formulas (see Figure 6), SD was calculated in relation to bladder volumes. For the volumes of 5–25 ml: SD was 11–14% for the VOCAL™ and 4–5% for the SUM-OF-CYLINDERS method.
Fitted regression lines are presented with 95% confidence intervals (shaded) and raw data (markers).
According to Bland–Altman analysis, based on 140 VOCAL™ and 140 SUM-OF-CYLINDERS bladder volumes, the mean difference and SD were 0.64 and 5.07 ml, respectively. No systematic difference existed between the two methods; the difference was not significant, p = 0.07. 24
The mean and SD of seven repeated bladder volume measurements with the VOCAL™ and SUM-OF-CYLINDERS methods for each foetus
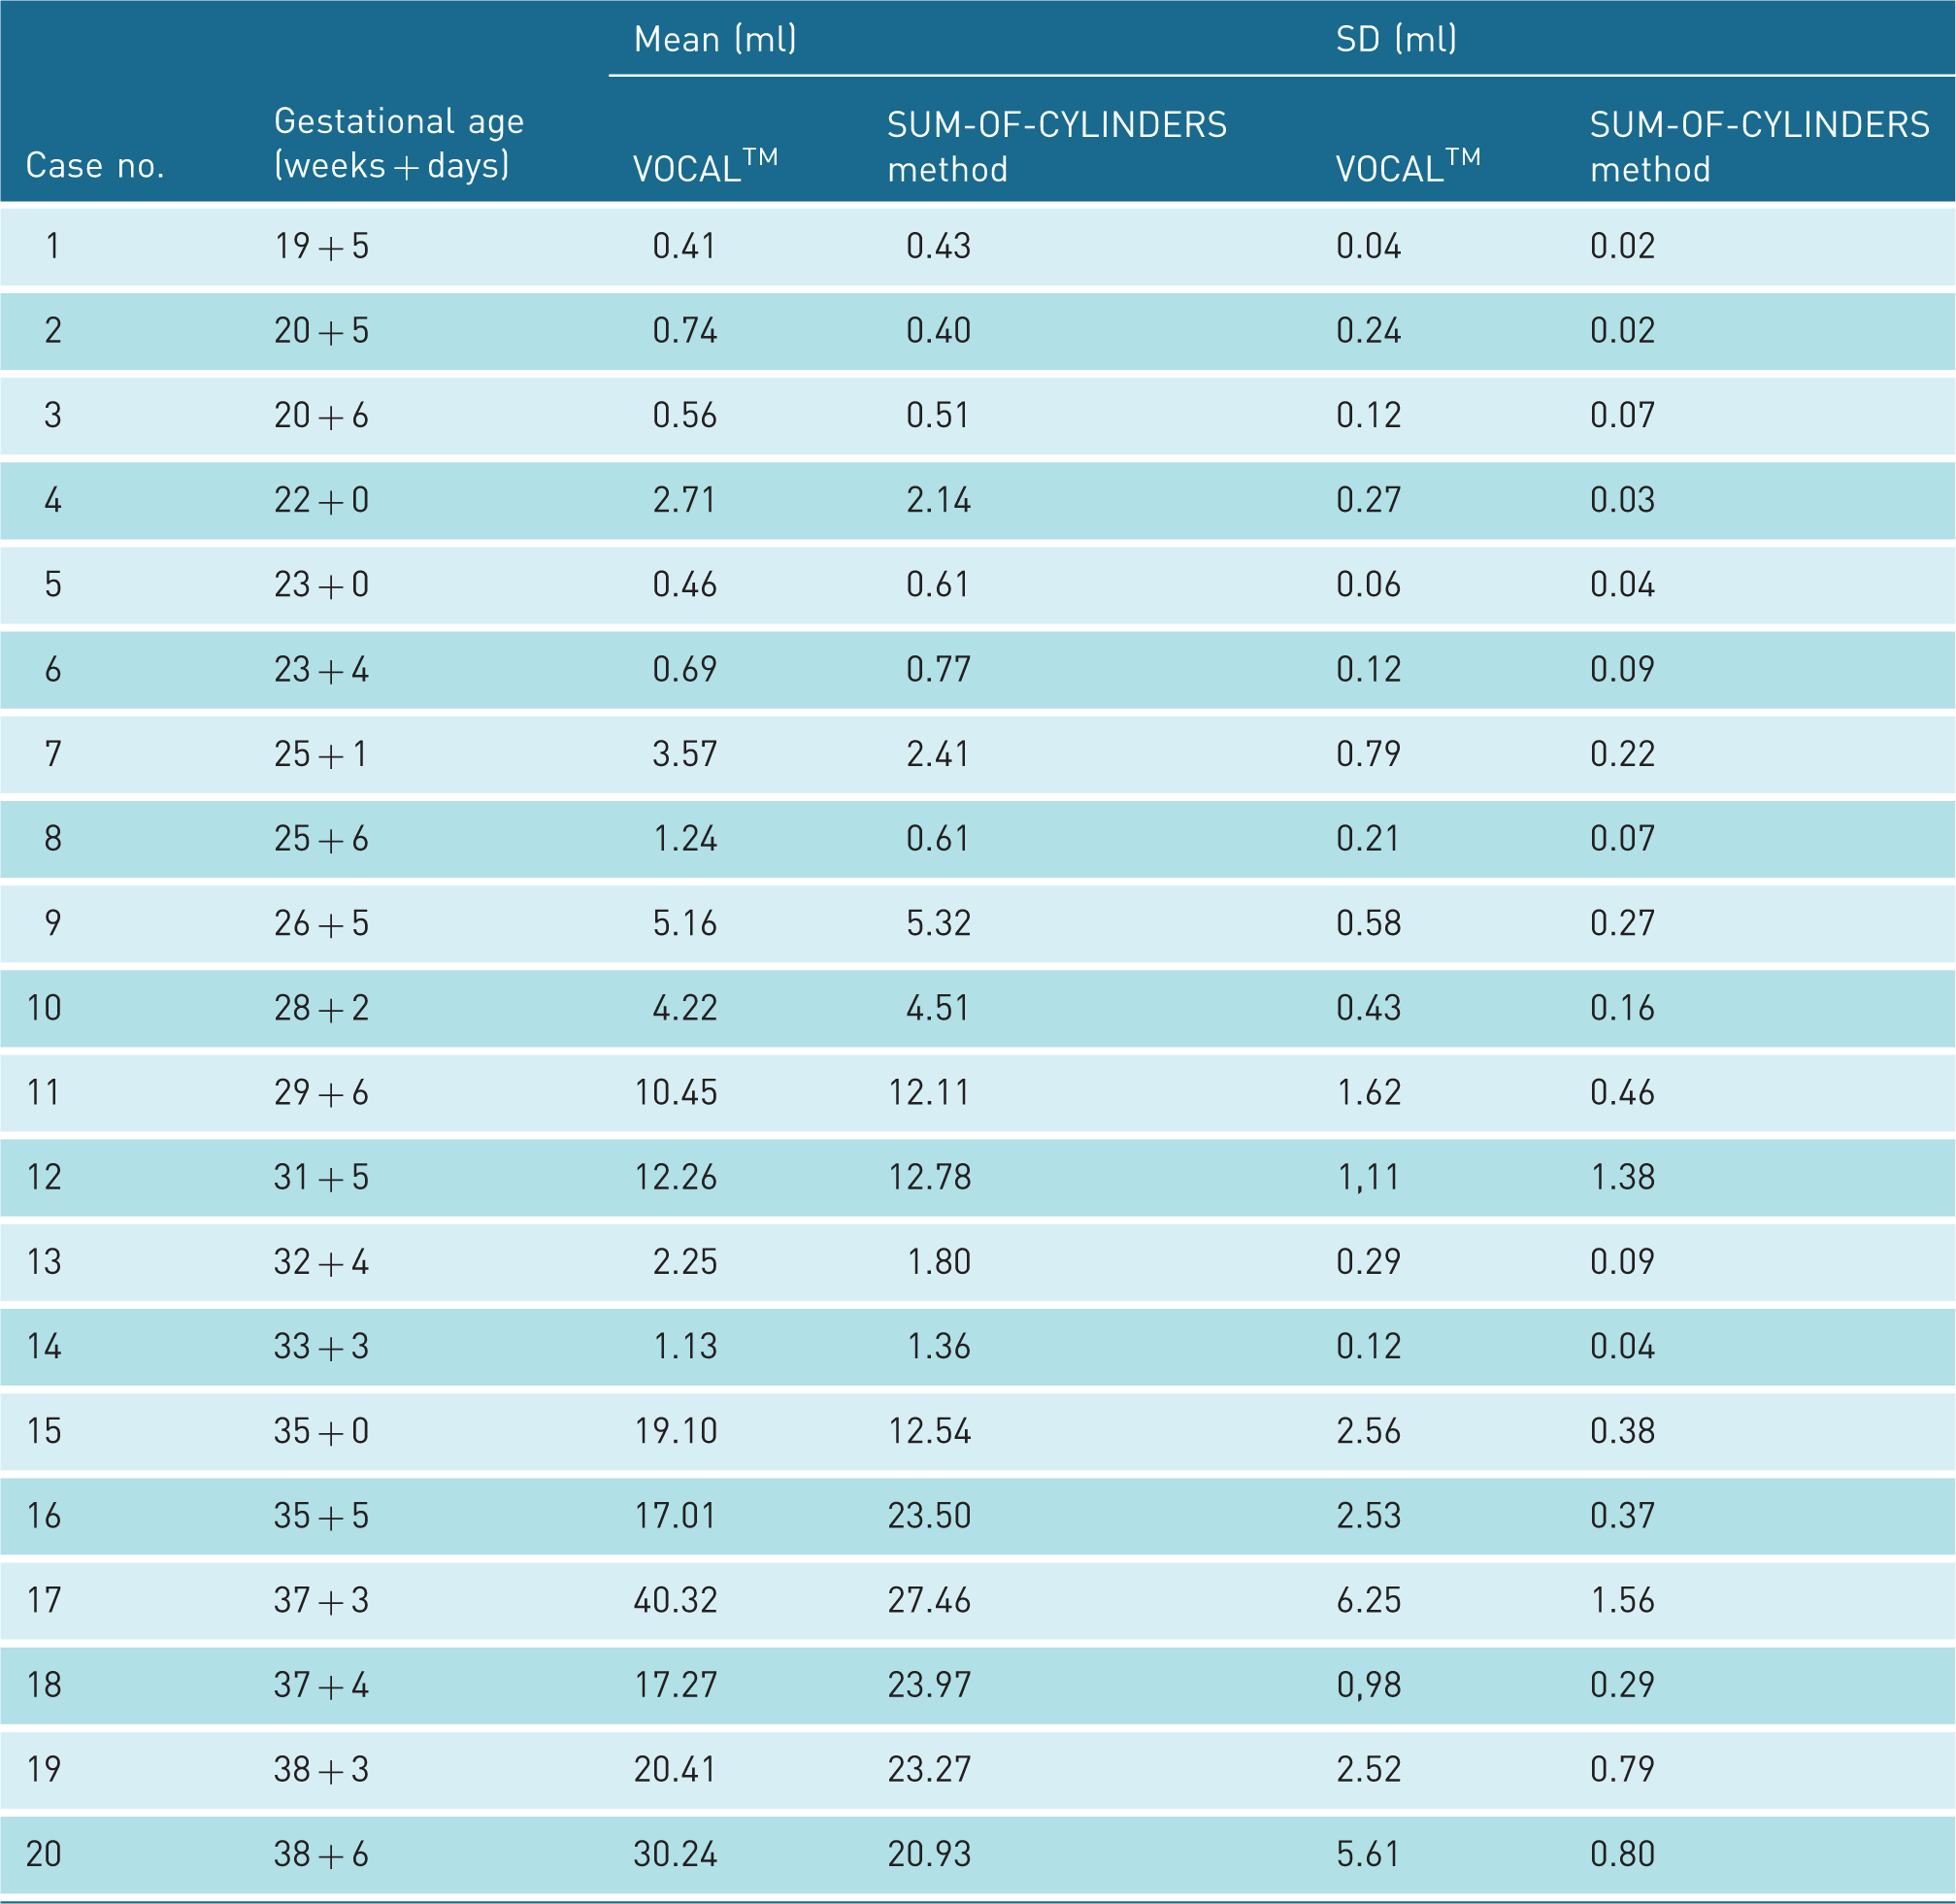
The maximum volume was 40.32 ml (case 17) when using the VOCAL™ method but 27.46 ml (case 17) when using the SUM-OF-CYLINDERS method. The transverse images of cases 4 and 10 were free from shadows.
SD: standard deviation; VOCAL™: Virtual Organ Computer-aided AnaLysis.

No significant difference was found for the total material, but there is a tendency of increasing differences for larger volumes >35 ml. In 8 of 140 cases the difference in relation to volume was 46−59%. This may depend on overestimation by the VOCAL™ method or underestimation by the SUM-OF-CYLINDERS method.
When using the VOCAL™ method, none of the longitudinal but 18 out of 20 perpendicular bladder images were covered by shadows to some degree (5–30%). The angles of sweep and image sectors were 55–65° and 16–46°, respectively.
Discussion
According to the SUM-OF-CYLINDERS method, volumes are estimated by calculating the number of pixels included within the borders of a data image, which is a new approach for volume estimation of foetal urinary bladder. When validated for volumes up to 51 ml in a previous study, the SD was <0.02%. 23 In addition to report the differences between 20 SDs for the 2 methods, 2 formulas for volume calculation are presented, which allow SD calculation for any arbitrary bladder volume (within the volumes of this study): one for the SUM-OF-CYLINDERS and one for the VOCAL™ method. Thus, for any volume estimated by these two methods, the corresponding SD could be calculated by the method-specific formula. It is probably of limited interest to calculate this SD but the presented SD-formulas for volume calculation enable SD assessment of foetal urine production rate, which might reflect foetal condition.
In previous papers, volume estimations by the SUM-OF-CYLINDERS method were based on 2D ultrasound images. The current study demonstrates the utilisation of 3D images for volume calculation of the foetal urinary bladder by this method. The observer is not always able to achieve an optimal orientation of the longitudinal bladder projection while 2D scanning but with this technique it is possible to modify the scan afterwards. The study demonstrates two different processes for volume estimation. The observer traces the foetal bladder border in the PC software, Microsoft Paint, which offers the capability of magnifying the image. This is an example of the technical advances in diagnostic ultrasound available when using the SUM-OF-CYLINDERS method. Using the VOCAL™ method, by contrast, the observer traces directly on the scanner display of the ultrasound machine, where the image is divided into four sections (see Figure 2). It is not possible to magnify the active section without losing parts of the bladder image.
Volume estimation by the SUM-OF-CYLINDERS method led to a smaller SD (higher intra-observer repeatability) than by the VOCAL™ method. The two methods demonstrated substantially different estimates for bladder volumes greater than 35 ml. However, due to the limited number of observers (2, namely E.S. and M.F.), the result is not generalisable. It remains to be proven if one of the methods is more reliable than the other or if this finding shows how difficult and unreliable volume measurements by ultrasound can be.
A larger SD when using the VOCAL™ method could depend on the imprecise procedure of outlining the bladder border. Forty electronically interconnected dots in a loop are available for tracing the bladder borders. The electronic connection between the dots prevents a single dot from being moved separately. When moving a dot to a position corresponding to a specific part of the bladder contour, the other dots also change position. Furthermore, due to the VOCAL™ method's use of a second image in the elevation plane (i.e. at 90° to the standard 2D plane), the image resolution will be limited by the elevation resolution of the transducer. The issue of major importance, however, might be the difficulties encountered due to shading from the foetal pelvis, which is a weak point of the VOCAL™ method when estimating the volume of the foetal urinary bladder. Although the initial longitudinal bladder images were free from shadows, parts of the perpendicular projections were hidden in 18 of 20 cases.
The reliability when measuring the foetal bladder volume by the VOCAL™ method was presented in a previous study; the intra-observer reliability was described by the level of agreement according to Spearman’s correlation coefficient and the inter-observer reliability by the 95% limits of agreement (−3.9 to 3.1 ml) in Bland–Altman’s graphical approach. 26 A shortcoming of the study was that cases (the authors did not mention how many) with undefined bladder limits were excluded. Shadows due to the foetal pelvis might cause undefined bladder limits, preventing volume estimation. In another study including 167 normal singleton pregnancies, the inter-observer reliability was evaluated in 19 cases as 95% limit of confidence (−1.1 to 1.5 ml). Unfortunately, the selection procedure of these 19 cases was not described. 15 These two studies present reliability of volume estimation on average only. However, it is to be noted that the accuracy of HFUPR estimation depends on the measurement precision for each one of the assessed volumes during a filling phase. The current study focused on the intra-observer repeatability, demonstrated by volume-related SD for each estimated bladder volume.
Shortcomings in the current study must be pointed out. The estimation procedure was performed on identical bladder images but there was a deviation from a fundamental principle when it comes to scrutinising different methods. Different observers performed the measurements by the VOCAL™ (observer E.S.) and SUM-OF-CYLINDERS methods (observer M.F.). This is not a unique shortcoming of our study, however. 27 Observer V.S. and E.S. are accustomed to the VOCAL™ method and M.F. alone has experience of the experimental SUM-OF-CYLINDERS method. If the SUM-OF-CYLINDERS method will be implemented in the ultrasound computer's program and used by operators, a more well-designed study could be performed.
Furthermore, bladder images must be transferred to a PC for tracing the bladder border and volume calculation. Another shortcoming is that the maximum volume estimated by the SUM-OF-CYLINDERS method was 27.5 ml and consequently this volume is the limit of the presented formula for SD. The result was, however, in parity with the finding in a previous study including bladder volumes up to 79.5 ml. 23
To avoid a poor perinatal outcome, a skilful management and timing of delivery in high-risk pregnancies is crucial. The challenge is an early identification of abnormal events. Different procedures of survey are available, but the foetal urine production rate is a parameter not yet utilised. Several studies demonstrate reduction of blood flow in foetal renal arteries and urine production rate in compromised foetuses.1,28−30 This indicates that estimation of foetal urine production might be an accompanying survey method. However, it is essential to use a method that can quantify the foetal bladder volume very precisely. Otherwise, small deviations in urine production may be overlooked. The estimation of SD for bladder volume calculation is fundamental for future assessment of the accuracy of HFUPR. So far, comparisons of HFUPR accuracy are missing using the SUM-OF-CYLINDERS and VOCAL™ method.
Conclusion
Using 3D ultrasound images adapted for the VOCAL™ method, foetal urinary bladder volumes can also be estimated using the SUM-OF-CYLINDERS method. The SUM-OF-CYLINDERS method employs technical advances which may result in a lower SD and therefore higher intra-observer repeatability.
Footnotes
Declaration of Conflicting Interests
The author(s) declared no potential conflicts of interest with respect to the research, authorship, and/or publication of this article.
Funding
The author(s) received no financial support for the research, authorship, and/or publication of this article.
Ethical approval
The study was approved by the Medical Ethics Committee in Oslo 15 April 2009 ref. S-05207c 2009/2645.
Guarantor
N/A
Contributors
MF, VS and ES conceived the study. Also, MF researched the literature and was involved in protocol development, gaining ethical approval and wrote the first draft of the manuscript. AO developed the protocol and analysed the data. All authors reviewed the manuscript.
Acknowledgement
Thanks to Aubin Vanns for his linguistic expertise and Rosa Moa Brynnel for her assistance in the discussion and proofreading of this paper. We are sincerely grateful to Andreas Carlsson for his excellent preparation of the included figures. Thanks also Dan Bergsten, who was able to refer me to the Mathcad expertise of Richard Jackson. Finally, thanks to Henrik Imberg for his dedication in the statistical work.