



Abstract
Objective
Impairment of flow-mediated dilation of the brachial artery is a marker of endothelial dysfunction and often predisposes atherosclerosis and cardiovascular events. In this study, we propose a user-guided automated approach for monitoring arterial cross-section during hyperemic response to improve reproducibility and sensitivity of flow-mediated dilation.
Material and methods
Ultrasound imaging of the brachial artery was performed in 11 volunteers in cross-sectional and in 5 volunteers in longitudinal view. During each examination, images were recorded continuously before and after inducing ischemia. Time-dilation curves of the brachial lumen cross-section were measured by user-guided automated segmentation of brachial images with the feed-forward active contour (FFAC) algorithm. %FMD was determined by the ratio of peak dilation to the baseline value. Each measurement was repeated twice in two sessions 1 h apart on the same arm to evaluate the reproducibility of the measurements. The intra-subject variation in flow-mediated dilation between two sessions (subject-specific) and inter-group variation in flow-mediated dilation with all the subjects within a session grouped together (group-specific) were measured for FFAC. The FFAC measurements were compared with the conventional diameter measurements made using echo tracking in longitudinal views.
Results
Flow-mediated dilation values for cross-sectional area were greater than those measured by diameter dilation: 33.1% for cross-sectional area compared to 22.5% for diameter. Group-specific flow-mediated dilation measurements for cross-sectional area were highly reproducible: 33.2% vs. 33.0% (p > 0.05) with coefficient of variation CV of 0.4%. The group-specific flow-mediated dilations measured by echo tracking for the two sessions were 21.1 vs. 23.9% with CV of 9%. Subject-specific CV for cross-sectional area by FFAC was 10% ± 2% versus 24% ± 10% for the conventional approach. Using correlation as a metric of evaluation also showed better performance for cross-sectional imaging: correlation coefficient, R, between two sessions for cross-sectional area was 0.92 versus 0.72 for the conventional approach based on diameter measurements.
Conclusion
Peak dilation area measured by continuous automated monitoring of cross-sectional area of the brachial artery provides more reproducible and higher-sensitivity measurement of flow-mediated dilation compared to the conventional approach of using vascular diameter measured using longitudinal imaging.
Introduction
Flow-mediated dilation (FMD) has been widely used as a surrogate marker to evaluate the endothelial response of the artery when stimulated by reactive hyperemia. Several important studies in vascular biology have shown high morbidity, mortality, and pathological changes associated with cardiovascular diseases and vascular endothelial dysfunction.1,2 Studies demonstrate that FMD provides useful information beyond traditional risk stratification. 3 Therefore, there is compelling need to evaluate endothelial function noninvasively in humans.4,5 Over the past two decades, there have been many attempts to develop accurate imaging approaches for assessing endothelial function in humans. A common FMD test involves inducing reactive hyperemia by forearm occlusion to promote nitric oxide production and vasodilatation of the brachial artery. Ultrasound imaging has emerged as a common noninvasive method to measure brachial artery dilation by FMD.6–8 The imaging of the artery is performed in the longitudinal view and the change in diameter relative to pre occlusion is measured after occlusion.2,9 The usefulness of this approach has been demonstrated in a wide range of studies.9,10
Despite continued success, the technique is also known for user dependence and poor reproducibility.11,12 The coefficient of variation (CV) for %FMD in healthy volunteers can range from 1.8 to 24.9%.9,13,14 The sensitivity of the technique is also low. The change in diameter due to dilation, and differences in the FMD between disease and non-disease groups, are small.8,15,16 As a result, the current applications of FMD measurement are confined to studying population differences. FMD for evaluating individual patients remains challenging, and it is not recommended for routine clinical examination.12,17,18
The primary reason for choosing longitudinal imaging to measure FMD is that it exhibits good boundary definition for the vessel wall. This allows convenient measurement of artery diameter with echo tracking. 1 However, the technique is based on an implicit assumption that the longitudinal imaging plane passes through the mid-plane of the artery throughout the examination, which lasts several minutes. This can be limiting and prone to errors due to lateral displacements of the imaging planes from the centerline during the examination. Furthermore, imaging along the long axis cannot account for vasodilatation that occurs in all orthogonal directions. In contrast to measurements in the longitudinal plane, area measurements in the imaging plane that cuts through the cross-section of the artery does not suffer from these limitations.16,19,20 The area measurements made in the cross-sectional plane are not affected by the slight variation in transducer location during image acquisition and they also capture arterial vasodilatation in all radial directions. The difficulty with cross-sectional imaging is that specular echoes are obtained only from the top and bottom of the artery, and its side walls are often not well defined.
The goal of this study is to address current limitations outlined above to improve the reproducibility and sensitivity of FMD measurements with ultrasound. Towards this goal, we propose continuous monitoring of brachial artery cross-sectional area with a user-defined feed-forward active contour (FFAC) algorithm that finds enough detail in the noisy image to delineate vascular margins in cross-sectional images. It has been demonstrated that active contours, also known as snakes, using a feed-forward approach to segment each image in a time sequence, can reliably measure the vasomotion waveform over cardiac cycles on ultrasound images. 21 Vasomotion measurements from imaging arterial cross-section are less variable than those obtained from imaging along the long axis (longitudinal view). Additionally, FFAC to measure the brachial artery dilation at discrete time points exhibits less inter-observer variability when the imaging plane is cross-sectional. 22 In this study, we propose using the FFAC algorithm on continuous cross-sectional imaging before and following the pressure release to measure brachial FMD. Subject-specific and session-specific variability of the proposed method are evaluated and compared with variability from longitudinal imaging. The aim is to improve the reproducibility and sensitivity of FMD measurements to facilitate their integration in clinical medicine.
Materials and methods
Data and image acquisition
With approval from the institutional review board (IORG0000029), the study was performed in 11 subjects, 4 women (36%) and 7 men (64%), with ages ranging from 23 to 65 years. Written consent was obtained from the participants before enrollment. None of the subjects had prior history of symptomatic cardiovascular disease, hypertension, or diabetes. Participants were asked to fast and refrain from consuming caffeine for 8 h prior to the exam. The subjects rested for 10 min prior to examination in a quiet room at 25℃ to achieve a hemodynamic state.
Vascular ultrasound imaging of the brachial artery was performed on subjects lying supine with the non-dominant arm extended and supported by a soft pillow. Images were acquired with a Zonare ZS3 scanner (ZONARE Medical Systems, Bernardo, CA, USA) using a broadband high-resolution 14-5sp hockey stick transducer. The scanner uses plane wave transmission and two-way (transmit and receive) focus at each point in the image to construct uniform, spatially invariant, high-resolution images. The scanner provides different modes of operation including fundamental, harmonic, and compound imaging. Based on an initial visual survey of different modes for imaging the brachial artery, the spatial harmonic mode at 12 MHz (SH12) was found to best define arterial lateral walls. SH12 with dynamic range of 75 dB was used for all scanning.
Each examination started with a preliminary scanning where the brachial artery with clear anterior and posterior walls and no branching was identified in the upper arm. This sonographic landmark in the image was used to guide repeated studies. The location of the transducer was marked on the skin with an ink marker. The upper arm cuff was placed 1 cm distal to the transducer to ensure that nothing was touching the cuff. To ensure that the cross-sectional plane was orthogonal to the long axis, the orientation of the transducer was adjusted such that the intima could be seen both in the anterior and posterior walls, and the bright echoes were aligned along the axis of ultrasound propagation. Baseline images were recorded in three 10-s video clips followed by occlusion of the artery with a pressure cuff placed proximally and inflated to supra-systolic pressure of 250 mmHg. After 5 min of occlusion to induce limb ischemia, the pressure cuff was deflated, and ultrasound images were recorded continuously for 5 min in a video clip. The FMD examination was repeated in the same subject at the marked site after waiting for 1 h to evaluate the variability. In 11 subjects, imaging was performed along the short axis (cross-sectional view) of the brachial artery.21,22 For comparison, five of these subjects were also scanned on a different day in the longitudinal view along the long axis. 23
Quantitative image analysis using FFAC
Video clips from the ultrasound scanner were analyzed offline using software custom written to segment the lumen-arterial margin in ultrasound images by the active contour algorithm, also known as a snake algorithm. Snakes are parametric curves that find or track edges in images by iteratively evolving a curve through energy minimization.21,24 They are deformable curves that balance the pull of image forces with the resistance to change by internal forces to arrive at a final configuration that fits the object. On a 2D image, a snake can be parametrized either as a closed curve or as a line-snake between two fixed endpoints. In this study, closed curves were used to assess cross-sectional area in transverse views of the arteries. 21 Each FMD measurement was made on a series of images consisting of 3300 frames. These images were analyzed by FFACs, where lumen contours found on each frame were propagated sequentially to the following frame for tracking changes in lumen area.
The snake used on each 2D image frame is a canonical active contour as described by Kass et al.,
25
parametrized as a closed curve for cross-sectional cases (as opposed to a line-snake stretching between two fixed endpoints for distal and proximal longitudinal margins in non-cross-sectional studies):

The active contour gets its name because it is iteratively deformed by a force field defined on an image until reaching a configuration of minimum energy

When energy is minimized in the final snake configuration on a frame, forces on either side of the contour balance each other, inside and outside in the case of the cross-sectional closed snake, satisfying a force balance equation

External forces come from the curve's attraction to image edges, whereas internal forces are imposed by the curve's shape: its resistance to bending or stretching. We did not use any optional constraints or generators on curve evolution such as spring or balloon forces.
The edges that attract the snake are found by convolving the image I with finite differencing and smoothing kernels to obtain the Sobel edge map G:

The external energy to be minimized is then defined as the magnitude of the edge map

Internal energy comes from the shape of the snake

To minimize energy, we deform the snake shape iteratively over time t under the influence of the forces, and then solve the following equation using finite differencing:



Snake algorithm default parameters for cross-sectional view

The analysis for each subject began by defining the lumen-arterial margin manually as the region of interest (ROI) in every 50th frame of the image sequence data. The manually drawn margin was used as an initialization for the active contour to detect the lumen-arterial margin of the first frame. The detected margin was fed forward to the next image of the series, used to initialize the next active contour to detect the new margin in the image. The process of active contour detection and feed-forward initialization was repeated serially on consecutive images until all images in the time sequence were analyzed. Vascular area enclosed within each detected margin was determined in mm 2 and plotted as a function of time. The area-time profile from FFAC analysis was used to determine the peak vascular area (Ap) and the corresponding time (tp) at the peak dilation. Cross-sectional FMD of the brachial artery at peak dilation (c-FMDp) was determined by (Ap – A0). 100/A0, where A0 is the baseline area of the brachial artery obtained from feed-forward analysis of the images acquired prior to the induction of hyperemia. The c-FMDp was compared with FMD at a fixed time (c-FMD1 min) determined by measuring the cross-sectional area at 1 min post ischemia.
C-FMD measurements were also compared with the standard FMD measurements made on longitudinal images. The diameter was measured by echo tracking at peak dilation for FMD calculations1,23 Variability in FMD of subjects individually and as a group was assessed by CV, defined as the ratio of standard deviation to mean, and was used to compare FMD measurements. The appeal of CV is that it accounts for the effect of the size of the blood vessel by standardizing the standard deviation by its mean. 26
Results
Examples of cross-sectional and longitudinal ultrasound grayscale images of the brachial artery are shown in Figure 1. The left panels (A and C) show systolic images before cuff inflation. The right panel images (B and D) show peak dilation of the blood vessel post ischemia following pressure cuff release. The anterior and posterior walls of the artery are well visualized in both cross-sectional and longitudinal images. Lateral arterial walls of the vessel in cross-sectional images are less well defined (Figure 1(a) and (b)). The change in cross-sectional area due to FMD can be easily appreciated. In the images shown, the cross-sectional area changes from 13.67 mm
2
(13,304 pixels) to 17.00 mm
2
(16,547 pixels). The longitudinal images (panels C and D) also show an increase in diameter due to FMD but the change is not as well depicted as it is in the cross-sectional images. The diameter change measured from longitudinal images is 3.7 mm (115 pixels) for pre pressure cuff inflation and 4.0 mm (125 pixels) post cuff inflation. When the data from all the subjects were pooled together, the mean change in area measured by cross-sectional imaging was 5.3 ± 1.2 mm
2
(4238 ± 1377 pixels) compared to the mean diameter change of 0.66 ± 0.36 mm (18 ± 7 pixels) measured from longitudinal imaging.
Cross-sectional and longitudinal ultrasound grayscale images of the brachial artery. The left panels (a and c) show systolic images before cuff inflation. The right panels (b and d) show peak dilation of the blood vessel post ischemia following pressure cuff release.
A time-dilation curve of the brachial artery obtained from the FFAC analysis of the cross-sectional images recorded after the release of pressure cuff is shown in Figure 2. The graph shows a rapid increase in vascular area immediately following pressure release at time 0 of the graph. The cross-sectional area overshoots the baseline pre-cuff-inflation value (dotted horizontal line) and gradually plateaus to a peak at around 150 s before returning to a baseline value. Although a decline in cross-sectional area following a peak was observed in all the cases, the area did not always return to the baseline value within the 5 min following the pressure cuff release. The time to peak varied between trials and between subjects (Figure 3). On average, the time to peak was around 150 s, ranging from 91 to 267 s (Table 2).
Changes in the real area of the brachial artery, cross-sectional view, continuously monitoring for 5 minutes following deflation using the feed-forward active contour (FFAC) algorithm. The horizontal dashed line represents pre-inflation area. The black solid line is the average trend. Cross-sectional brachial artery FMD difference between 5 min and 1 min for each subject using FFAC. FFAC: feed-forward active contour; FMD: flow-mediated dilation. Comparison of cross-sectional FMD on brachial artery at peak dilation. Note: The table shows variation in brachial FMD (cross-section) between two sessions with 1 h difference. CV=Coefficient of variation between the two sessions. FMD was measured at peak dilation following pressure cuff release. PT represents time at which maximum dilation occurs. The bottom row shows the variation in FMD for all the subjects as a group. FMD: flow-mediated dilation.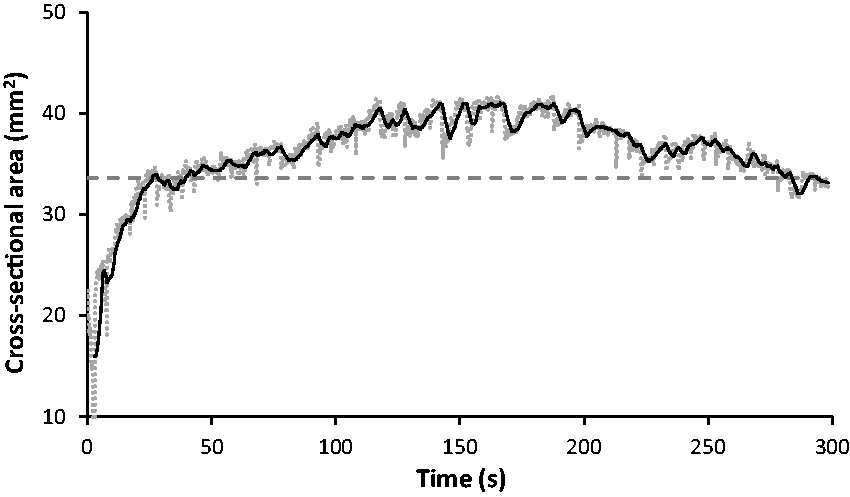


Variation in longitudinal FMD determined by manual measurements on the images acquired in two sessions 1 h apart
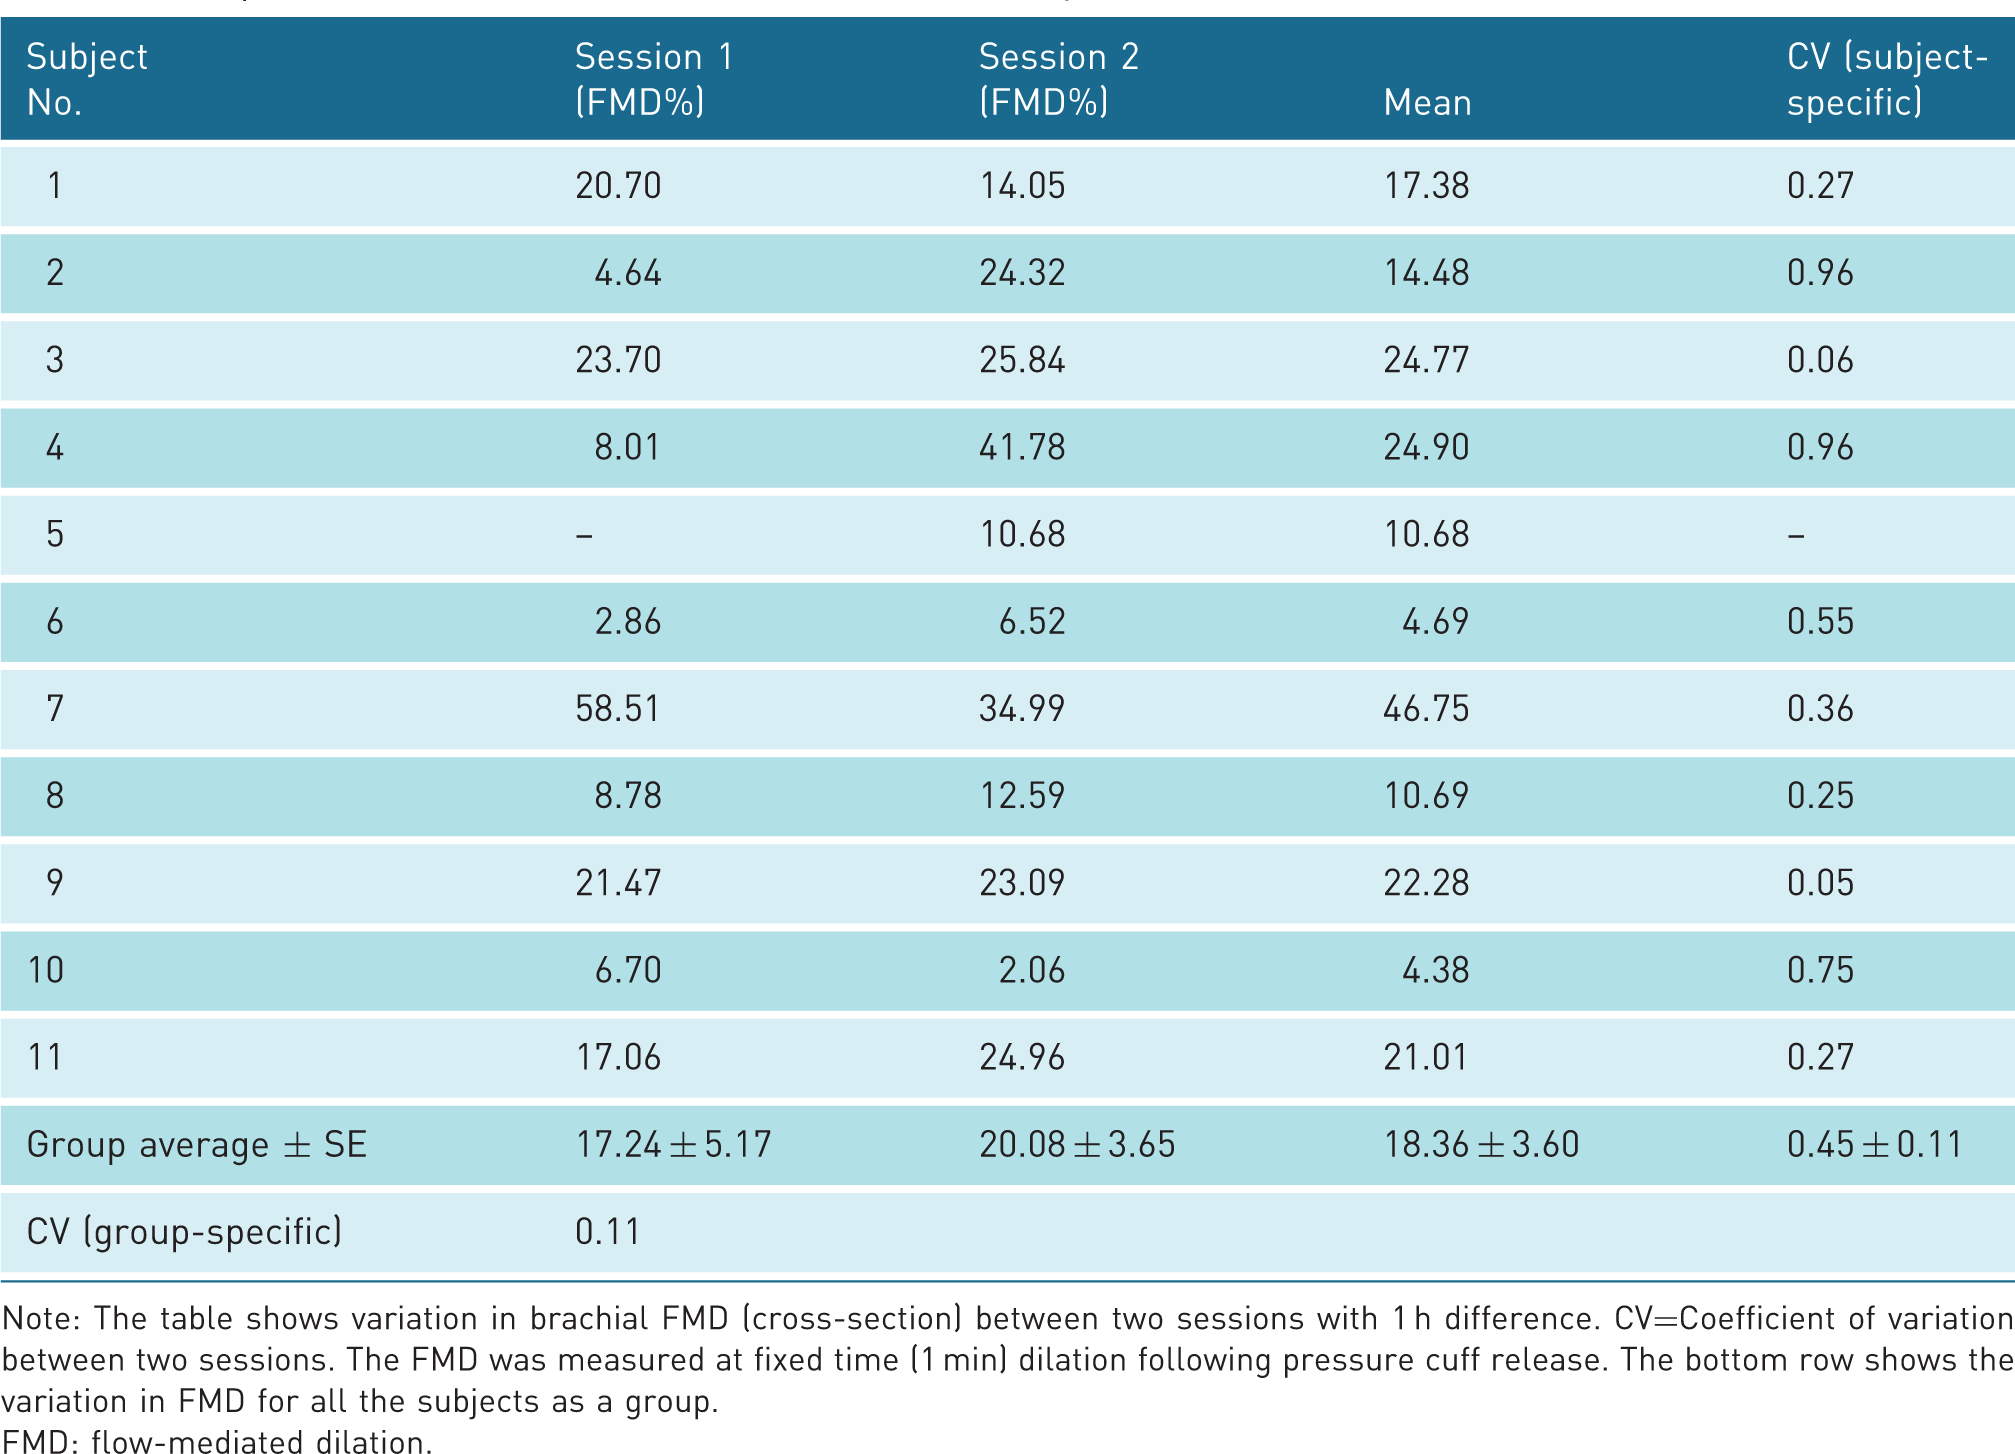
Note: The table shows variation in brachial FMD between two sessions with 1-h difference. FMD was measured at peak dilation following pressure cuff release using echo tracking. The bottom row shows the variation in FMD for all the subjects as a group.
FMD: flow-mediated dilation; CV: coefficient of variation.
Comparison of cross-sectional FMD on brachial artery at fixed time (1 min) dilation
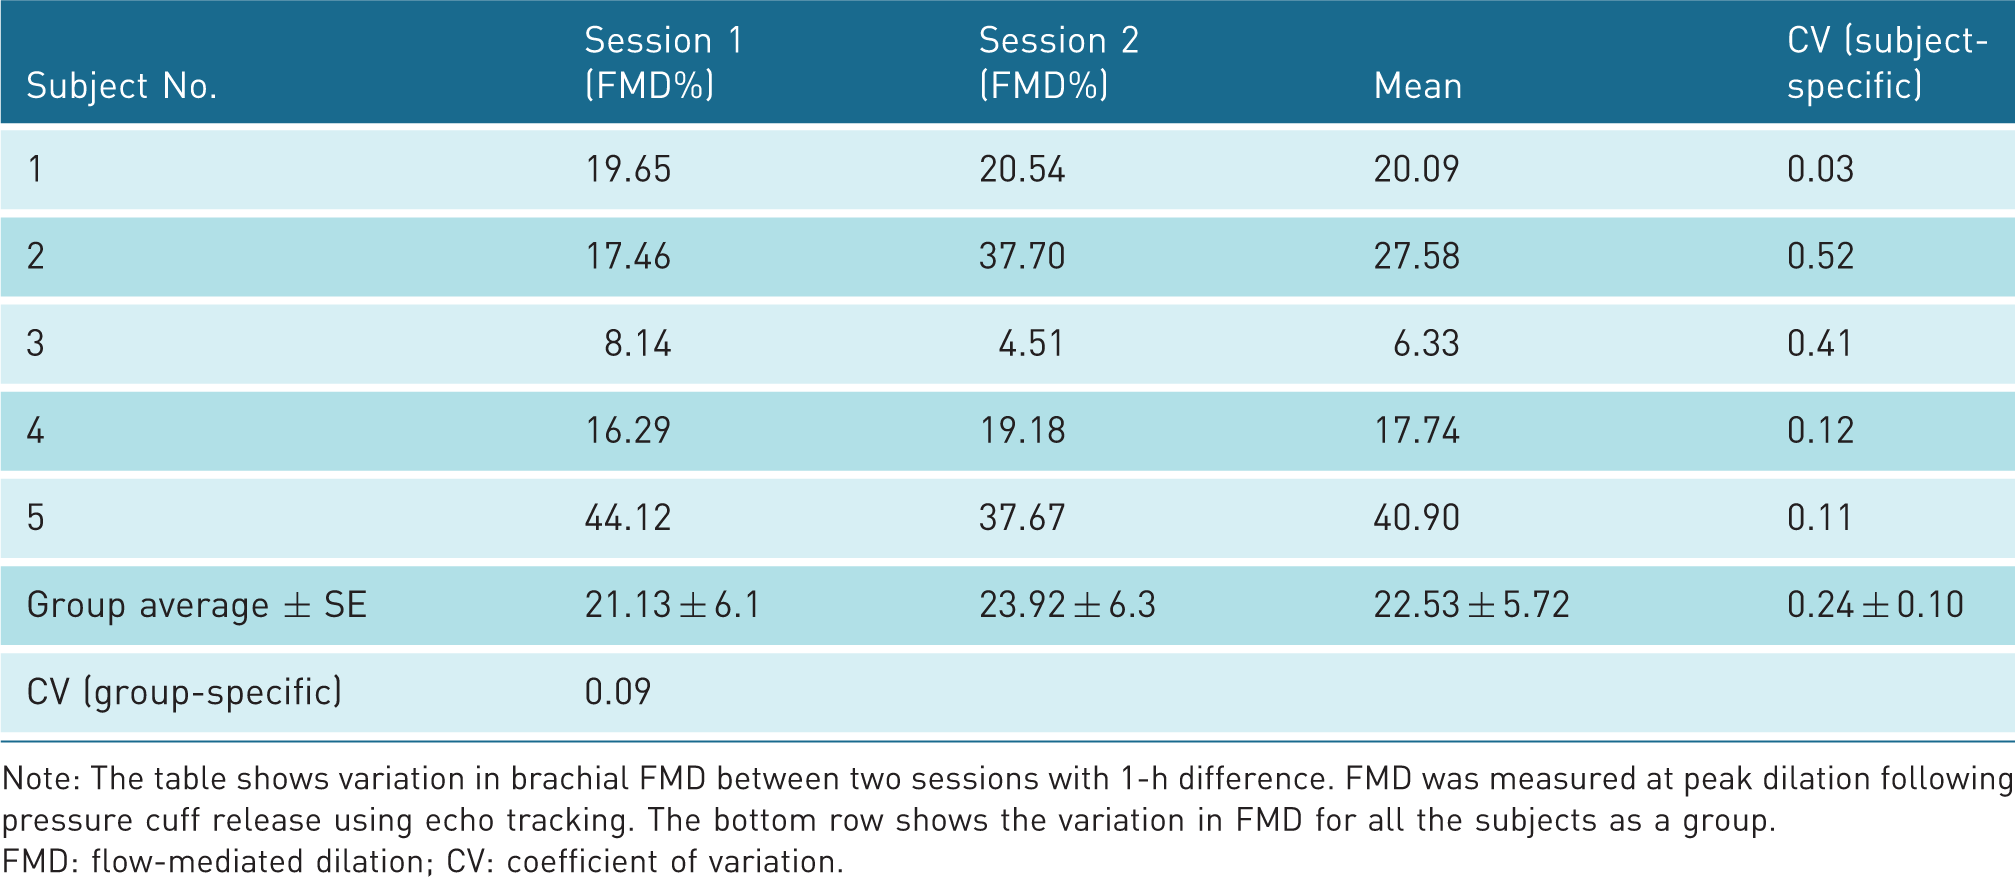
Note: The table shows variation in brachial FMD (cross-section) between two sessions with 1 h difference. CV=Coefficient of variation between two sessions. The FMD was measured at fixed time (1 min) dilation following pressure cuff release. The bottom row shows the variation in FMD for all the subjects as a group.
FMD: flow-mediated dilation.
The c-FMDp measurements from peak dilation versus c-FMD1 min measurements made at 1 minute post dilation were compared (Figure 3). Each bar in the figure represents the mean of two trials. In each case, the FMD measurement made at 1 min was lower than at peak dilation. The c-FMDp and c-FMD1 min were 33.1% ± 3.94% and 18.4% ± 3.60%, respectively. The difference between the two groups was significant, p < 0.05. The lower c-FMD1 min values at 1 min were accompanied by greater variability between measurements. The correlation coefficient (R) between two trials for c-FMD1 min was 0.68 versus 0.96 for c-FMDp. Table 4 lists the values for the two sessions. The mean c-FMD1 min values for the session as a group were 17.2% versus 20.1% with CV of 11%. The CV for intra-subject variation was 45% ± 11% (range: 5% to 96%).
Discussion
Easy accessibility, low cost, and the real-time capability of vascular ultrasound makes it an ideal candidate for assessing endothelial dysfunction in subjects. Additionally, the noninvasive nature and strong safety record of ultrasound are well suited for repeated examinations for monitoring therapy,27,28 and lifestyle interventions.9,29 Despite many benefits of the technique, its full potential has not been realized; the technique continues to demonstrate low reproducibility and low sensitivity, and its use has been limited to studying population or group differences, not for evaluating vascular health of individual subjects.12,13,19,30 Current limitations of the technique originate from at least two sources. First, the current approach uses longitudinal imaging, which measures distension in only one direction, whereas dilation occurs in all radial directions. The problem is further compounded by the image plane not staying fixed during the course of imaging due to the movement of the transducer and blood vessels. Secondly, while the current recommendation is measuring peak vascular dilation, 1 it is often reported at a fixed time of 1 min following pressure cuff release.3,6,11,16 While convenient, this approach introduces inconsistencies in the measurement due to the variability in the time at which vascular dilation peaks during hyperemic response.
In this study, we aimed to address the above limitations by combining cross-sectional imaging of the brachial artery across the short axis with continuous real-time monitoring of vasodilatation to detect peak dilation during the course of hyperemic ischemia response. Since continuous monitoring generates an enormous number of images for analysis, automation by FFAC algorithm was used to improve accuracy of measurements and to reduce user effort. The results of the study were analyzed to compare variation in measurements within subjects between two imaging sessions (subject-specific variation) and variation in the measurements between two sessions (groups) where the measurements of all the subjects are pooled together (group-specific variation). Each of the above issues is discussed individually below.
Transverse vs. longitudinal FMD
In healthy populations, the brachial artery diameter usually ranges from 3 to 5 mm. The maximal change in brachial artery diameter in the longitudinal plane is expected to be 10 to 20%,3,19,21 corresponding to a change of 0.3 to 1.0 mm. In subjects with endothelial dysfunction, maximal change in diameter is likely to be less than 10 to 20%, requiring an even higher sensitivity to detect the smaller changes in FMD.
In longitudinal imaging, FMD is measured in only one plane and does not take advantage of the distension that occurs in all orthogonal directions, resulting in reduced sensitivity. In contrast to longitudinal imaging, cross-sectional FMD analysis involves two-dimensional measurements and measures distension in all directions over 360°. Because measurement in each direction is independent, the area measurement provides better sensitivity and more stable values than measurement made in only one direction. On individual subject, the cross-sectional area changed by 3243 pixels (3.33 mm2), whereas the diameter change measured from longitudinal images was substantially lower, on the order of 10 pixels (0.32 mm) (Figure 1). Similarly, as a group, cross-sectional imaging showed a change of 4238 ± 1377 pixels (5.3 ± 1.19 mm2) during ischemic response compared to only 18 ± 7 pixels (0.66 ± 0.36 mm) change for longitudinal imaging. That is, cross-sectional imaging detected a change of 235 times more pixels compared to longitudinal imaging. An error of a few pixels due to slight movement of the transducer in longitudinal imaging can easily lead to significant % error in FMD measurements. On the other hand, the amplified change observed by considering dilation in all directions gives cross-sectional imaging greater sensitivity and reduced variability compared to longitudinal imaging. These results are consistent with our earlier observations that reproducibility is greater for cross-sectional imaging. The number of pixel changes observed for area was amplified 150 times for cross-sectional imaging, which is lower than observed in the present study.16,19 This is largely because of the limitation of the previous study, where those measurements were made at a fixed time and not at peak dilation.
The FMD values measured in the cross-sectional plane by the FFAC algorithm were approximately 1.5 times greater than those measured by longitudinal diameter dilation (Tables 2 and 4). Taking the diameter to area conversion into consideration, the c-FMD should be two times the longitudinal FMD. The reason for this apparent discrepancy is not known but could be part of variation between groups or difference in response because the studies were performed on different days.
Cross-sectional imaging also showed the broadening of the brachial artery along the horizontal axis from its compression by the ultrasound transducer (Figure 1(a)). Such compression is often unavoidable due to the need to press the transducer for better coupling of the ultrasound energy into the body. While this compression can be accounted for in transverse imaging by measuring area, it can be a potential source of error in longitudinal imaging.
FFAC analysis
Continuous monitoring of vasodilatation in real time generates large datasets. One FMD examination involving pre and post pressure release generates 3300 images on average. Automated analysis provides a means to analyze such large datasets. Although different approaches for automated analysis are possible,31,32 in this study we used an active contour algorithm. The approach has been described before for tracking vascular dilation. 21 In brief, the active contour identifies the margin by fitting flexible curves called “snakes” to the lumen-tissue border by energy minimization on image properties. Unfortunately, the margins of the blood vessels in the short axis plane are not uniformly defined in all directions. In particular, the side wall of the blood vessel is often poorly delineated with low-contrast diffuse borders due to oblique incidence of ultrasound. Use of image compounding improves the delineation of the side borders, but the problem persists due the limited angles available for compounding. The advantage of using the active contour is the flexibility of choosing the constraints, the parameters used in energy minimization. When the algorithm fits curves to weak portions of the border along the lateral walls of the artery, it is guided by information from neighboring sharply defined vascular regions in the anterior and posterior walls of the artery according to these constraints, allowing it to estimate the margin even where it is lost in noise. This study used a novel ultrasound imaging system with zone sonography for image acquisition and processing. Unlike the conventional approach of acquiring echoes line-by-line, the system transmits approximately 10 broad plane-wave beams per frame to cover the field of view. 33 Backscatter data from the transmit-receive zones are used together with sophisticated tissue-specific processing to extract all the information from the echoes and improve image uniformity, resolution, and contrast. All these factors along with the use of harmonic imaging which is known to reduce image clutter 34 could have contributed to the success of FFAC in delineating vascular margins.
The user-guided FFAC algorithm is so called because the snake contour is manually initialized on only the first frame of a sequence, then the contour actively reconfigures itself to find the margin in that frame, and then that found margin is fed forward as the initialization of the snake on the next frame. The feed-forward process repeats frame after frame to track the margin over time. This is possible because the time difference between frames is typically so small (1/30 s) that the shape has barely changed. If there is a sudden or regular shift in position, for instance when the subject exhales during breathing, another manual region can be drawn to correct the snake, but this is rare, around once every 50 frames. For 1800 frames in 1 min of 30-frame-per-second video, the algorithm saves the user the labor of manually tracing on 1764 frames.
The approach to propagate or feed-forward the detected margin to the images in sequence automates margin detection and enables the analysis of an enormous number of images without user participation. The results of the analysis are shown in Figure 2. The first few seconds of missing data are due to the delay between pressure release and image recording. The results show that the FFAC was able to track the rapid increase in vascular area following pressure cuff release. As expected, the cross-sectional area overshoots the baseline area and after peaking at around 150 s then returns to the pre-pressure-cuff baseline by 300 s. Overshooting the baseline was observed in all the cases, and the dilation did not always return to the baseline value during 5 min of image recording.
Continuous monitoring of cross-sectional imaging
Hyperemic response following pressure cuff release is slow and takes several minutes to peak. Continuous monitoring of vasodilatation following pressure cuff release allows detection of peak dilation. The results of the study show peak dilation varies significantly between two measurements made on the same subject. The time difference between two nearly identical trials can vary from 4 to 113 s (Table 2). Although variability in biologic response to stimuli is not unexpected, it can have profound influence in the assessment of %FMD. From our continuous measurements (Figure 2), we estimated %FMD at a fixed time (1 min) and compared the results with the measurements made at peak dilation. In all cases, the c-FMD1 min was lower in value with larger CV than c-FMDp (Figure 3). Fixed-time measurement not only underreported %FMD but also introduced significant variation on the order of 45%. These results suggest that continuous monitoring of vasodilatation following pressure release could play a vital role in improving FMD measurements, which is consistent with the recommendations made in earlier studies.1,23
Subject-specific and group-specific variation
The cumulative effects of the above factors that contribute to improving FMD measurements were evaluated by comparing FMD measurements made on the same subjects in two sessions with 1 h of time difference. Since the same experimental conditions were used in both of the two sessions, the expectation is that the obtained FMD measurements should be similar. The results show that while the measured c-FMDp values for the two sessions were close, there were some differences (Table 2). The mean CV for subject-specific analysis was 10% (range of 2% to 18%). When a similar comparison was made for longitudinal imaging, the difference was more pronounced for the two sessions. The mean CV for the subject-specific analysis for the longitudinal imaging was 24% (range of 3% to 52%). Continuous cross-sectional imaging had nearly two times lower subject-specific CV, an improvement over current approaches for evaluating individual subjects.
The observed subject-specific variation of 10% variation in c-FMDp is still significant. The reason for this difference is not known and could be related to factors that have not been considered in this study. One potential source of variation is the use of the pressure cuff for applying flow stimulus. The manual pressure inflation and release are difficult to control and a small difference between sessions could influence the flow stimulus and contribute to the observed variation. Future studies involving automation of stimulus and normalizing the measurement with the measured blood velocity by spectral Doppler could address some of these challenges.35,36
A large number of studies have employed brachial ultrasound FMD to differentiate groups based on endothelial dysfunction, for example, young versus old,37,38 smoker versus nonsmokers,11,39,40 normal versus diseased,41,42 treated versus untreated.43,44 In our study, we grouped subjects from each session and compared the mean measurements. Since the two groups were the same, the expectation was to observe no difference. Consistent with the expectation, measured values for both cross-sectional and longitudinal imaging showed no statistical difference, though with very different coefficients of variation. For cross-sectional imaging, the mean c-FMDp for the two sessions was nearly identical, 33.2% vs. 33.0% with group-specific CV of 0.4% (p > 0.05) indicating the reproducibility of the test. The mean l-FMD for the two sessions measured with longitudinal imaging was 21.1% vs. 23.9% with group-specific CV of 9.0%. A marked reduction in group-specific CV with cross-sectional imaging suggests that this technique could provide better separation between groups using smaller samples per group.
Limitations
While the results of the study are encouraging, the study also has several weaknesses. First, the sample size is small. The need to perform measurement on the same day with subjects fasting makes the study complex and recruitment difficult. Second, the study was performed in all normal subjects. While this provides a uniform subject population and is a reasonable first step, further testing of the technique comparing different groups is warranted. Third, other factors that contribute to variability in measurements like standardization of pressure release should be included to improve the measurement. Finally, lack of clear lateral margins of the artery in the ultrasound images from currently available scanners, and the long processing time of the images are weaknesses of the technique. Towards the important goal of detecting lateral margins, some progress has already been made and this study took advantage of the advances in harmonic imaging and zone sonography to improve the FMD measurements. While further improvements are necessary, the limitations listed above are primarily methodological and could be addressed by future technical advances in ultrasound imaging and in artery tracking algorithms.
Conclusion
FMD measured by continuous, user-guided monitoring of brachial artery area on cross-sectional imaging provides more reproducible and sensitive measurements than the conventional method using longitudinal imaging. Future studies with larger sample size and new technical advances will pave the way for cross-sectional imaging techniques for evaluating individual subjects and for making robust comparisons between different study groups.
Footnotes
Declaration of Conflicting Interests
The author(s) declared no potential conflicts of interest with respect to the research, authorship, and/or publication of this article.
Funding
The author(s) received no financial support for the research, authorship, and/or publication of this article.
Ethics approval
University of Pennsylvania institutional review board approved the study.
Guarantor
Chandra M. Sehgal.
Contributors
CMS designed the study. ZC and SMS responsible for image acquisition. ZC and LRS responsible for image and data analysis. TWC designed the software. All authors contributed to the manuscript.
Acknowledgments
The authors thank the Department of Radiology at the University of Pennsylvania for supporting this study.