




Abstract
Introduction
We aimed to establish baseline normal values of ElastPQ® (Philips Healthcare, Bothell, Washington, USA) renal shear modulus, evaluate changes in intrarenal resistive index and renal shear modulus in various stages of diabetic nephropathy, their diagnostic potential and role in follow-up.
Methods
Our prospective observational study was performed over two years. In total, 130 adult cases with diabetic nephropathy and 130 normal adult controls were selected. Diabetic nephropathy was confirmed by persistent albuminuria on 24-hour urinary albumin testing at three month intervals and staged by albuminuria quantification. Measurement of intrarenal resistive index and renal shear modulus in all subjects was performed and their variation with stage of nephropathy was statistically analyzed using Pearson’s correlation. Receiver operating characteristic curves were plotted and their individual and combined diagnostic potentials were assessed. Statistical significance was tested using t tests and analysis of variance. Interrater agreement was tested using Cohen’s kappa coefficient.
Results
Mean intrarenal resistive index was significantly higher for cases (mean 0.72 ± 0.05) than controls (mean 0.62 ± 0.04) and showed significant age variation (p < 0.05). Normal values of ElastPQ® renal shear modulus ranged from 3.87 to 4.72 kPa and was significantly higher for cases (mean 8.59 ± 1.77 kPa) than controls (mean 4.32 ± 0.45 kPa) and showed significant differences between each stage of nephropathy, being highest in stage 2. Maximum diagnostic accuracy was at 0.65 (sensitivity 90%, specificity 76.2%, area under curve 0.916) for intrarenal resistive index and at 5.31 kPa (sensitivity 90.8%, specificity 84.6%, area under curve 0.923) for renal shear modulus. Combination of the two further improved diagnostic performance (highest accuracy of 89%, sensitivity 81.7%, specificity 96.3%).
Conclusions
Normal range of ElastPQ® renal shear modulus values could be established. Intrarenal resistive index and renal shear modulus can be used as imaging parameters for early diagnosis and follow-up of diabetic nephropathy.
Introduction
Diabetes mellitus (DM) is a leading cause of end stage renal disease. Diabetic nephropathy is defined by at least one of the following
1
:
Persistent albuminuria (> 300 mg/day or > 200 µg/minute) on at least two occasions three to six months apart Progressive reduction in glomerular filtration rate (GFR)
The early stage of renal involvement with 30–300 mg of albumin in a 24-hour urine collection sample is the stage of microalbuminuria or incipient nephropathy. 2
The time of diagnosis of diabetic nephropathy is important in determining the prognosis. Early diagnosis and initiation of treatment can mitigate progression of diabetic chronic kidney disease (CKD). In the earliest stages, the disease is detectable only by histopathological examination. However, due to inherent risks of performing repeated renal biopsies, it is impractical for early diagnosis or follow-up. 3 At present, diagnosis continues to depend on microalbuminuria testing, which is neither sensitive nor specific. 4 Besides, the procedure of 24-hour urinary albumin testing is also cumbersome. Follow-up of diabetic nephropathy patients also relies on urinary albumin and GFR measurements. The development of a correlative, easy to perform, non-invasive, and radiation-free imaging technique would be very useful for early diagnosis and follow-up of diabetic nephropathy.
The role of ultrasonography in diabetic nephropathy has been limited to grey-scale ultrasound imaging for renal size and echotexture, changes which are seen late in the disease course. Renal hemodynamic changes are detectable on Doppler sonography in the early stages, although studies show that it is less specific. 5 Shear wave elastography is a novel and non-invasive modality for quantitative tissue elasticity assessment. 6 Although very few studies have been performed on renal elastography, it appears to be a promising technique for early diagnosis and follow-up of diabetic nephropathy. 7 Baseline normal point shear wave elastography ElastPQ® (Philips Healthcare, Bothell, Washington, USA) renal elasticity values have not been previously established. Some studies have shown that ElastPQ® values are significantly lower than the more widely used acoustic radiation force impulse (ARFI) values by about 10%. 8
In this background, our study aims to evaluate changes in intrarenal resistive index using renal Doppler and renal cortical elasticity using ElastPQ® shear wave elastography in diabetic nephropathy and to correlate these changes with the stage of diabetic nephropathy. Further, our study aims to evaluate their diagnostic performance. In the process, we also aim to establish baseline normal ElastPQ® renal shear modulus values.
Materials and methods
Our prospective observational case–control study was carried out over a period of two years from June 2015 to May 2017. The necessary sample size was calculated using the standardized formula for sample size n = 4 pq/L2 where p = population proportion of positive character, q = 1 − p and L = allowable error. Prevalence of diabetic nephropathy in the USA in type 2 diabetics is about 3%.9,10 The prevalence among Indian type 2 diabetics is 5–9%10,11 and may even be higher according to recent studies. 12 Prevalence (p) was hence taken as 9%, q as 93%, and L as 5% (for 95% confidence interval). Sample size was calculated to be approximately 130.
The study protocol was presented to the institutional ethical committee and approval was obtained. Written and informed consent was obtained from all subjects before recruiting them into the study. In total, 165 normotensive adult (age > 18 years) patients with a history of type 2 DM and presence of albuminuria were selected by consecutive sampling. There were 35 subjects excluded on the basis of features falling under exclusion criteria and 130 were eventually included in the study in the diabetic nephropathy group (designated as cases). A total of 146 normotensive adult subjects with normal blood sugar and normal serum creatinine without any known renal pathology were selected by convenience sampling but 16 subjects were excluded on the basis of features falling under exclusion criteria leaving 130 as normal controls (one control per case).
For all subjects, demographic data were collected, blood pressure recorded, random blood sugar and serum creatinine values obtained, and a preliminary grey-scale ultrasound performed in order to exclude unsuitable subjects. Exclusion criteria included all hypertensives, patients with obstructive uropathy, coexistent renal pathologies or anomalies, nephrotoxic drug treatment, patients with kidneys > 8 cm from the surface (due to technical limitations of shear wave elastography beyond that depth) or kidneys too small for the fixed size of the ElastPQ® region of interest (ROI) sample box (15 mm × 5 mm) to be placed completely within the renal cortex, and patient refusal to enter study protocol. All subjects underwent 24-hour urinary albumin examination performed using the highly sensitive LogoTech ISE SrL Hemo-One autoanalyzer to accurately quantify even minimal levels of albuminuria. A repeat testing was performed three months later. Only those with persistent albuminuria were included as cases.
Estimated GFR (eGFR) for all subjects was calculated from laboratory and demographic data using the modified modification of diet in renal disease (MDRD) formula
13
as follows

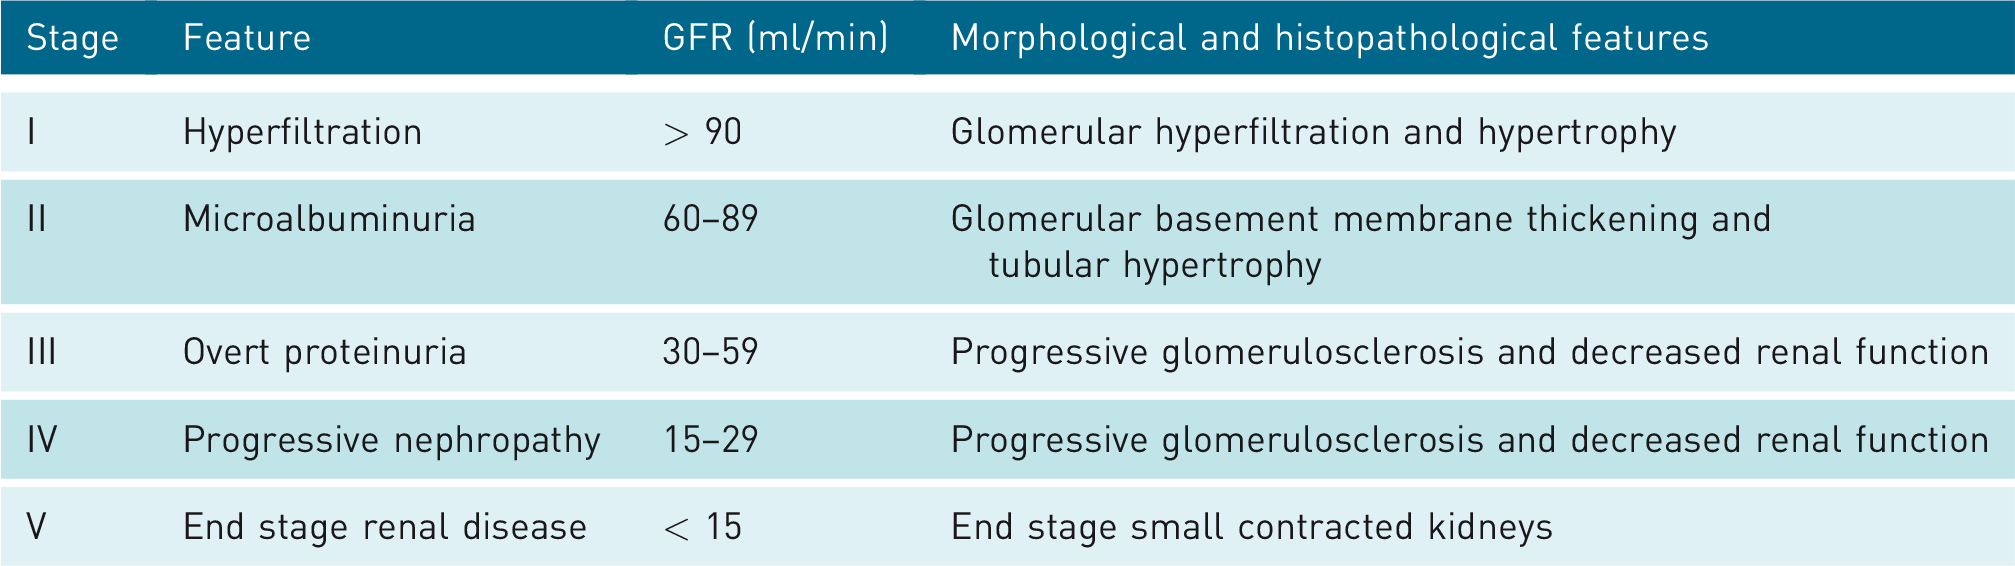
Cases were classified according to the standardized CKD grading system (National Kidney Foundation) on the basis of eGFR into five stages (Table 1).
Stages of chronic kidney disease (CKD) in diabetic nephropathy.
All subjects were then evaluated using an ultrasound scanner (iU22, Philips Healthcare Bothell, Washington, USA) with a 1–5 MHz convex transducer with duplex Doppler and point shear wave elastography ElastPQ® capabilities. In each subject, renal duplex Doppler was performed and two waveforms each from the interlobar arteries of the upper, mid, and lower poles of each kidney were obtained (total of 12 readings per observer). Resistive index in each reading was measured as follows

Mean resistive index for both kidneys was calculated. Shear wave elastography was then performed. The ROI cursor was placed over cortical regions of upper, mid, and lower poles with suspended breathing and two readings were taken from each region of each kidney (total of 12 readings per observer). The results were obtained as shear modulus in kPa which is approximately one-third of Young’s modulus for human soft tissues. 14 Mean shear modulus for both kidneys was calculated. All readings were acquired independently at the same sitting by two radiologists, one with over five years’ experience in elastography and duplex Doppler who were blinded to the diabetic/non-diabetic status of subjects. Mean of the total readings of both observers was obtained.
Statistical analysis of data was performed using Microsoft Excel enabled with XLSTAT (version 2016.5, Microsoft Corporation, Redmond, Washington, USA). The continuous variables were expressed as mean ± SD. Data were tested for normality using Kolmogorov–Smirnov test and confirmed to be normally distributed. Variations in resistive index as well as shear modulus with age and sex of subjects were analyzed using Pearson’s regression analysis and point biserial correlation, respectively. Differences in resistive index as well as shear modulus values between cases and controls and between the various stages of diabetic nephropathy were compared using unpaired t tests and one-way ANOVA, respectively. For each test, p < 0.05 was considered significant. Correlation between resistive index and stage of diabetic nephropathy was also analyzed using Pearson’s correlation as the data were normally distributed. Statistical measures of diagnostic performance of resistive index and shear modulus were assessed by generating receiver operating characteristic (ROC) curves and cut-off values were identified by selecting the point from the curve showing highest accuracy with the best balance between sensitivity and specificity. Combined diagnostic performance parameters were calculated, both when the tests were combined in an “AND” manner, that is if positive result in both tests was considered presence of disease, and when they were combined in an “OR” manner, that is if positive result in either test was considered presence of disease. Interrater agreement between resistive index and shear modulus was analyzed using Cohen’s kappa coefficient.
Results
The mean age of the normal controls was 43.05 ± 8.82 years (mean ± SD), and there were 65 males and 65 females. The majority of controls were in the age group 31–50 years. The mean age of the diabetic nephropathy cases was 54.62 ± 8.69 years. In this group, 77 were males and 53 were females. The majority of diabetic nephropathy cases were in the age group 51–60 years. The demographics and clinical parameters of cases and controls are presented in Table 2.
Demographics and clinical parameters of controls and cases.
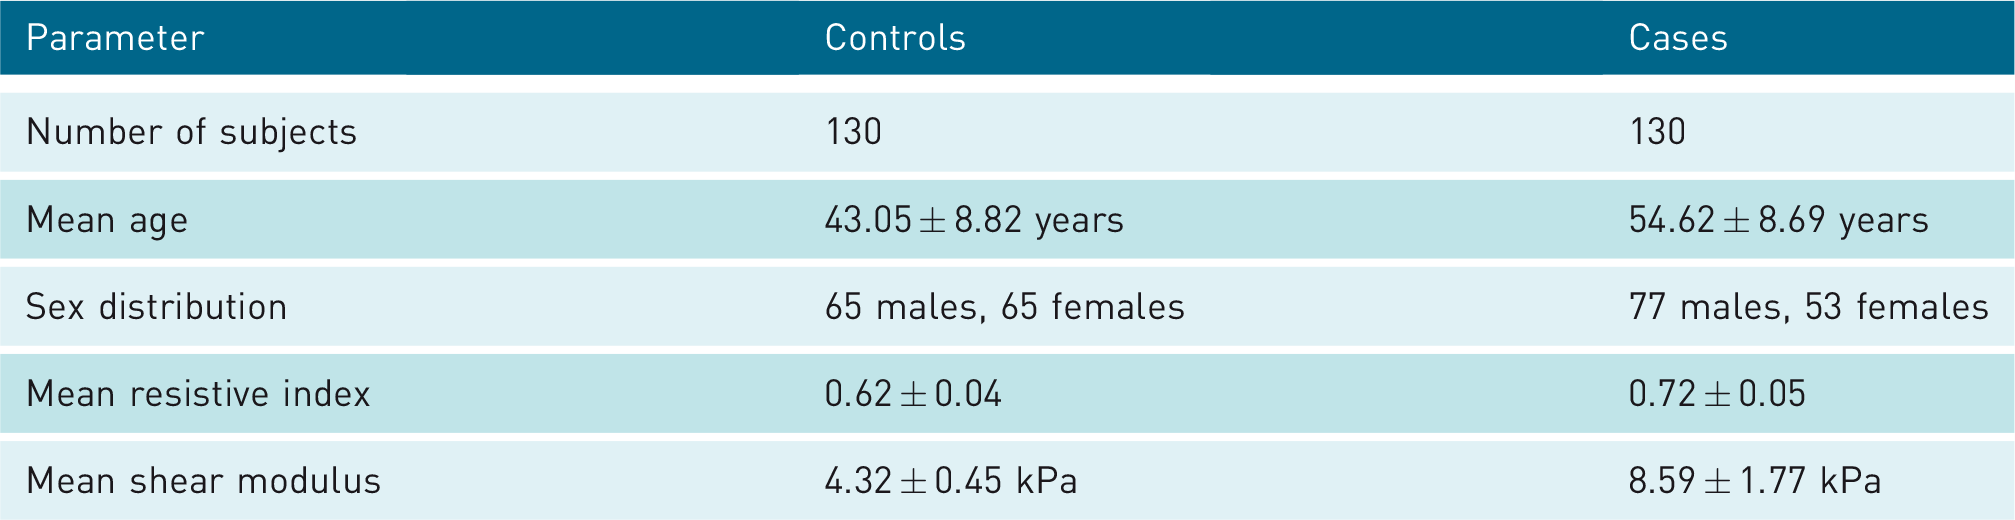
For all healthy controls, the mean resistive index of the kidneys was 0.62 ± 0.04 (range 0.54–0.70 between 95% confidence intervals) (Figure 1). A moderate positive correlation was observed between age of the controls and mean resistive index of the kidneys (Pearson’s r value of 0.52, p < 0.05). No significant correlation was observed between sex and resistive index (r value of 0.06, p < 0.05). For diabetic nephropathy cases, the overall mean resistive index of the kidneys was 0.72 ± 0.05. Unpaired t test showed significant differences between the mean intrarenal resistive index of cases and controls (p < 0.001).

Forty-two-year-old non-diabetic woman with normal kidneys. Renal cortical echotexture appears normal. Renal Doppler (left) shows intrarenal resistive index of 0.57. ElastPQ® shear wave elastography (right) shows renal shear modulus of 4.27 kPa.
The mean shear modulus of the kidneys for controls was found to be 4.32 ± 0.45 kPa (range 3.87–4.72 kPa between 95% confidence intervals) (Figure 1). No significant correlation was found between the age (Pearson’s r value of 0.13, p < 0.05) or sex (r value of −0.01, p < 0.05) of controls and the mean renal shear modulus. For diabetic nephropathy cases, the mean renal shear modulus was found to be 8.59 ± 1.77 kPa. Unpaired t test showed significant differences between the mean renal shear modulus of cases and controls (p < 0.001).
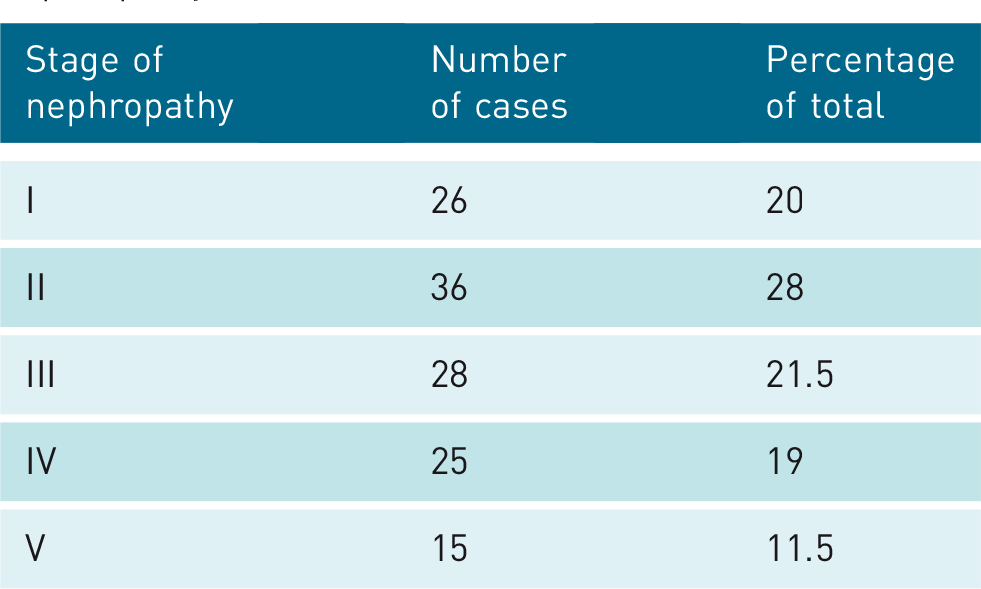
The distribution of diabetic nephropathy cases according to the stage of diabetic nephropathy was then analyzed (Table 3). The majority of the cases were in stage II of diabetic nephropathy. The mean resistive index for cases in each stage of diabetic nephropathy and the range of values between the 95% confidence intervals were calculated (Table 4). Statistically significant differences were observed between controls and cases in each stage and also between the cases in various stages (p < 0.05). Mean resistive index was found to increase progressively with the stage of diabetic nephropathy (r value of 0.67, p < 0.05). Likewise, the mean renal shear modulus for diabetic nephropathy cases in each stage of diabetic nephropathy and the range of values between the 95% confidence intervals were calculated (Table 5). Statistically significant differences were observed between controls and cases in each stage and also between the cases in various stages (p < 0.01). The mean shear modulus values were found to show a significant rise in the initial stages of diabetic nephropathy up to stage II (Figure 2), after which a progressive decrease was observed up to stage V (Figure 3).
Distribution of cases by stage of diabetic nephropathy.
Resistive index by stage of diabetic nephropathy (p < 0.01 for all stages).

Shear modulus by stage of diabetic nephropathy (p < 0.01 for all stages).

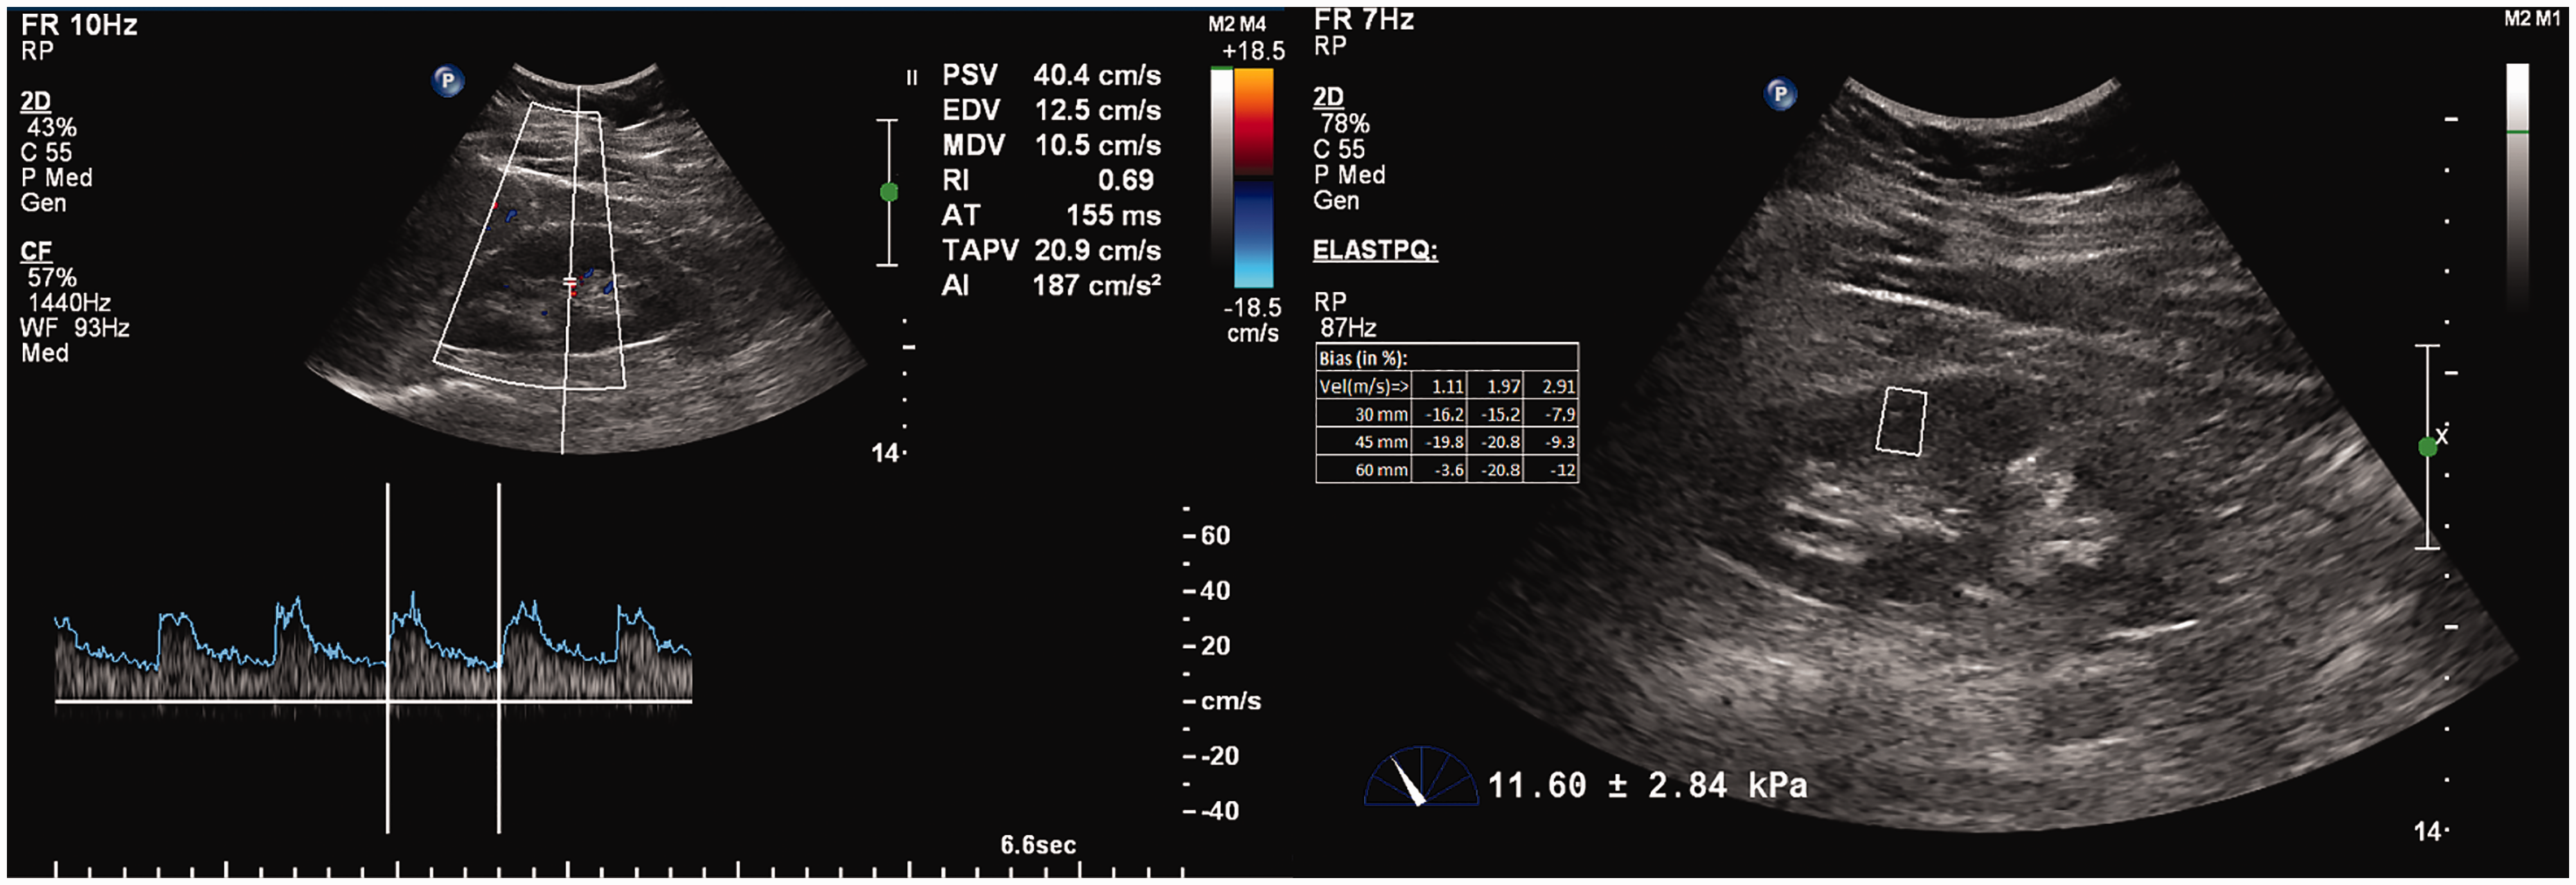
Forty-eight-year-old diabetic man with stage II diabetic nephropathy. Renal cortical echotexture appears normal. Renal Doppler (left) shows intrarenal resistive index of 0.69 (elevated). ElastPQ® shear wave elastography (right) shows renal shear modulus of 11.60 kPa (significantly elevated).

Fifty-three-year-old diabetic woman with stage V diabetic nephropathy. Renal cortical echogenicity appears raised. Renal Doppler (left) shows intrarenal resistive index of 0.77 (significantly elevated). ElastPQ® shear wave elastography (right) shows renal shear modulus of 5.29 kPa (mildly elevated).
ROC curve for resistive index was plotted and maximum accuracy of 83.1% was obtained at a cut-off of 0.65 for the diagnosis of diabetic nephropathy (Figure 4). At this cut-off, the sensitivity was 90%, specificity was 76.2%, positive predictive value was 79.1%, negative predictive value was 88.4%, positive likelihood ratio was 3.774, and negative likelihood ratio was 0.131. The area under curve (AUC) value for the ROC curve was 0.916 (p < 0.001, α of 0.05).
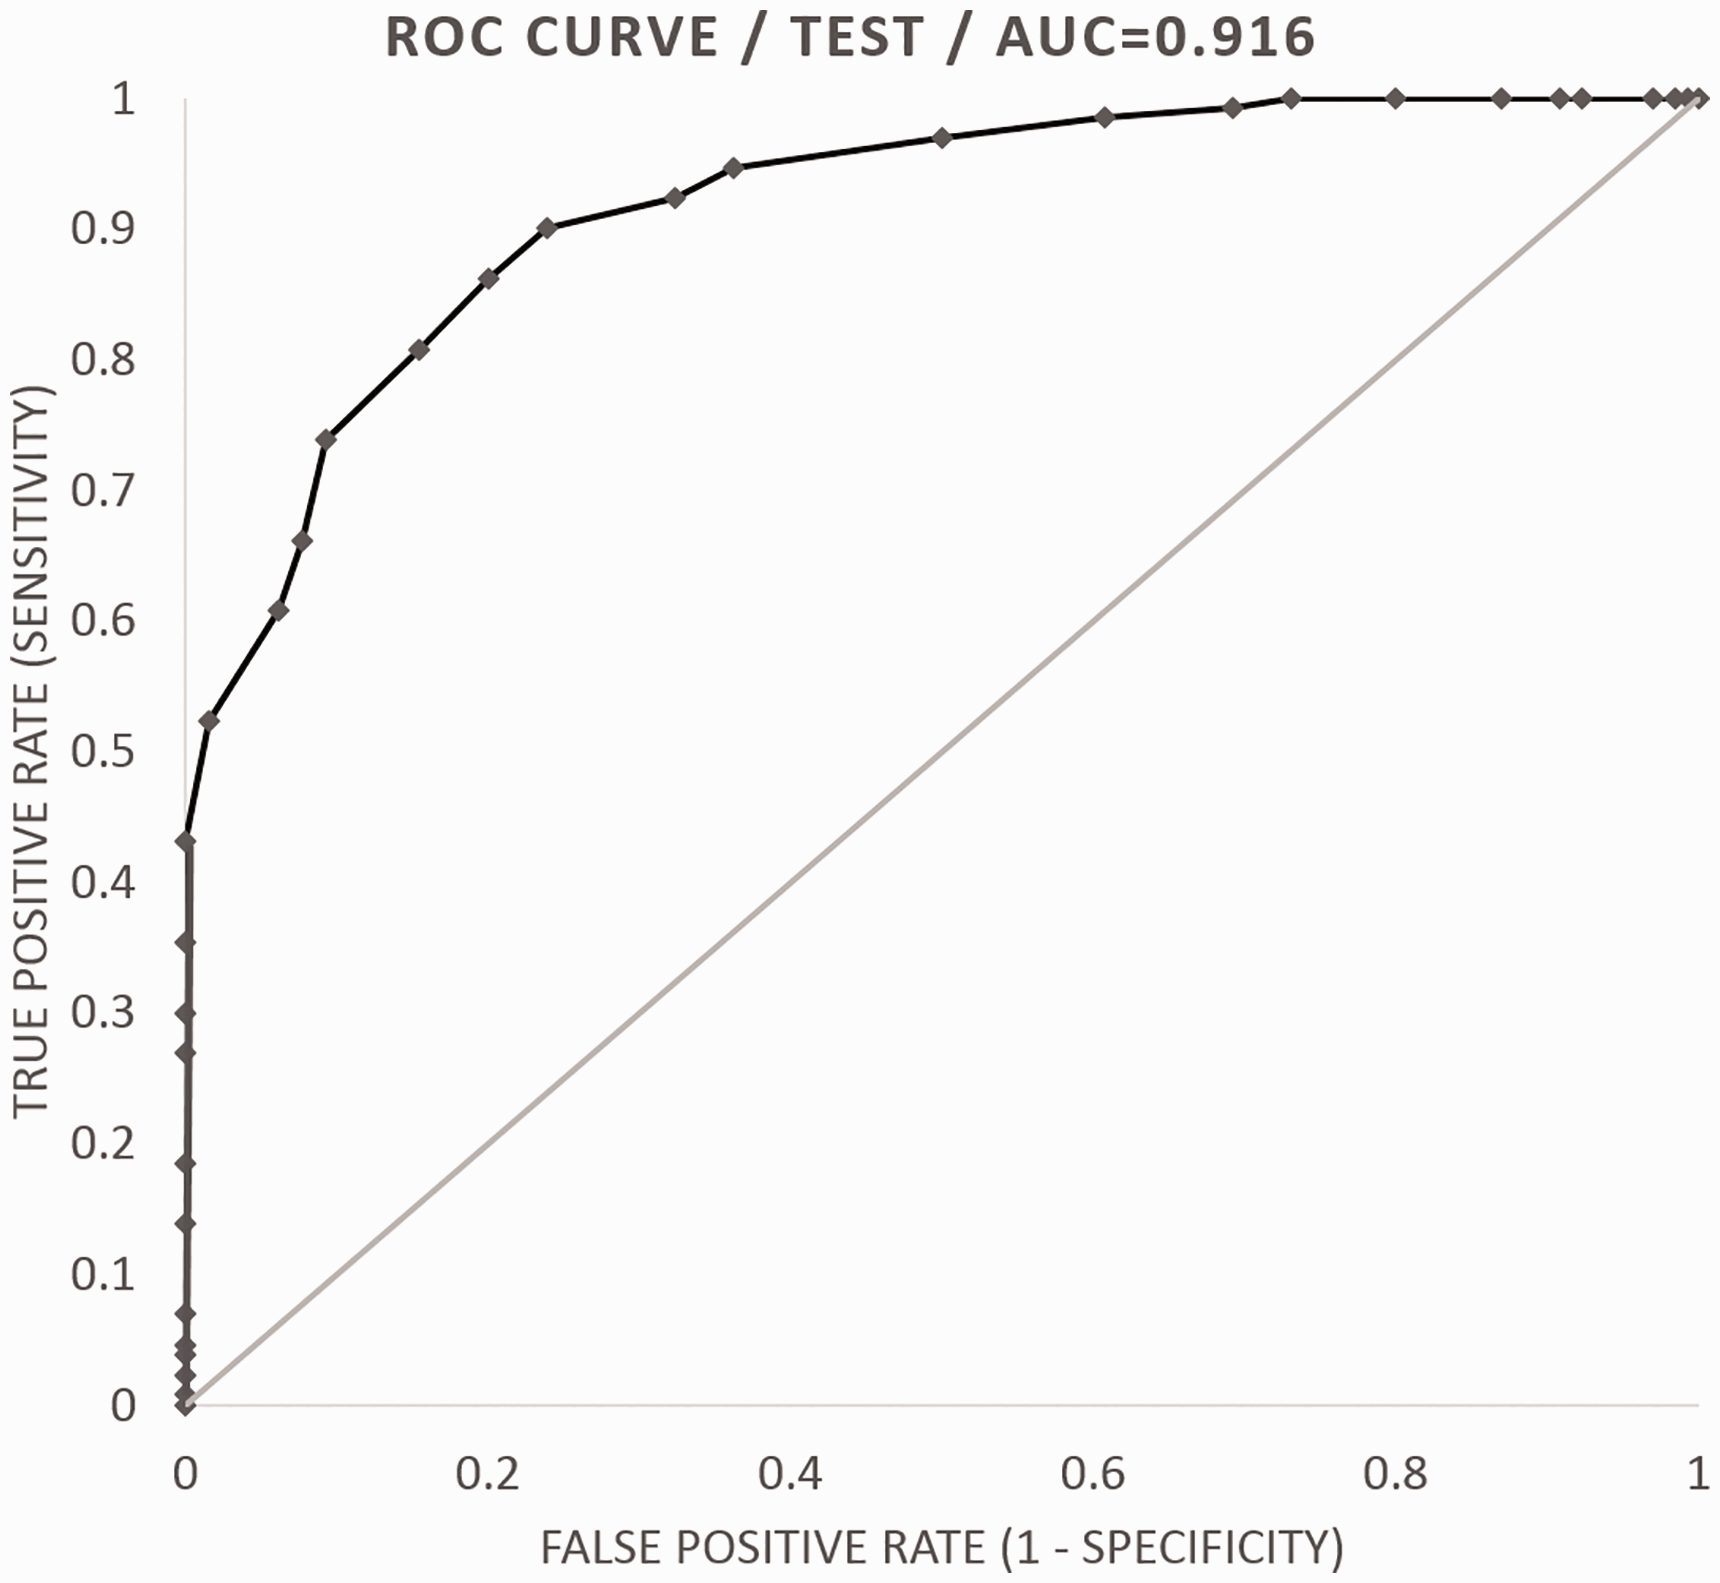
ROC curve for intrarenal resistive index between controls and cases of diabetic nephropathy. AUC: area under curve; ROC: receiver operating characteristic.
Likewise, ROC curve for shear modulus was plotted and maximum accuracy of 87.7% was obtained at a cut-off of 5.31 kPa for the diagnosis of diabetic nephropathy (Figure 5). At this cut-off, the sensitivity was 90.8%, specificity was 84.6%, positive predictive value was 85.5%, negative predictive value was 90.2%, positive likelihood ratio was 5.900, and negative likelihood ratio was 0.109. The AUC value for the ROC curve was 0.923 (p < 0.001, α of 0.05).
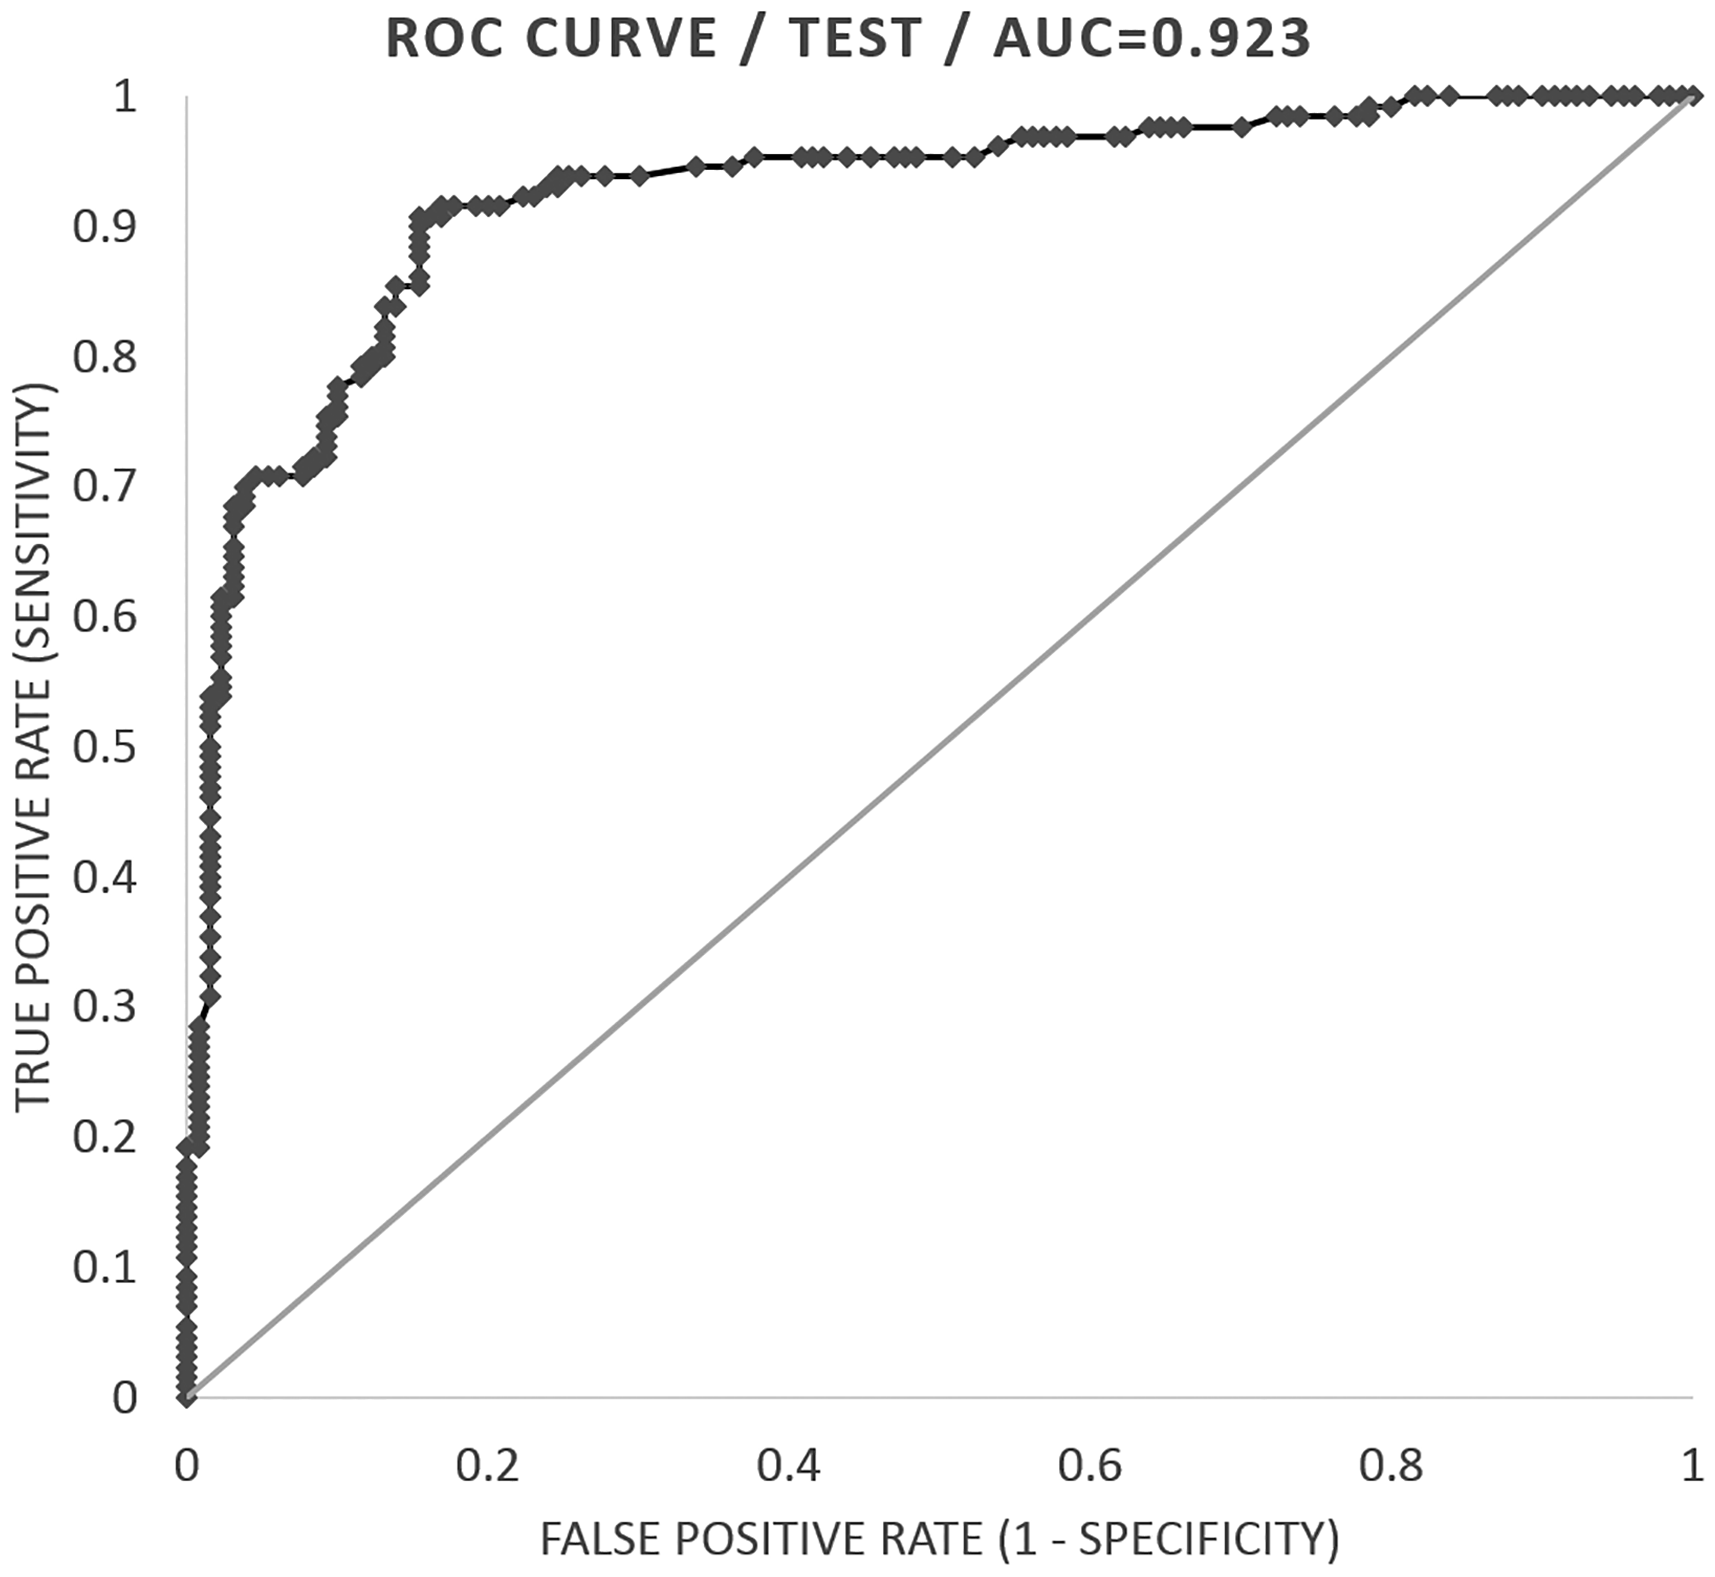
ROC curve for renal shear modulus between controls and cases of diabetic nephropathy. AUC: area under curve; ROC: receiver operating characteristic.
Further the combined diagnostic performance of intrarenal resistive index and renal shear modulus was calculated. When they were combined in an “AND” manner, overall sensitivity was found to be 81.7% and overall specificity was found to be 96.3%. Overall accuracy was 89%. When they were combined in an “OR” manner, overall sensitivity was found to be 99% and overall specificity was found to be 64.5%. Overall accuracy was 81.8%. The interrater agreement between intrarenal resistive index using a cut-off of 0.65 for resistive index and 5.31 kPa for shear modulus (maximum accuracies as determined by the ROC curve) for the diagnosis of diabetic nephropathy yielded a Cohen’s kappa value of 0.85 implying very good agreement.
Discussion
Diabetic nephropathy is characterized by progressive renal damage. Conventional imaging modalities have not played a major role in the diagnosis or follow-up of diabetic nephropathy. Detection of albuminuria has remained the mainstay for diagnosis. The early stage of microalbuminuria lasting from 5 to 15 years cannot be detected by conventional albuminuria testing methods but is predictive of eventual development of significant proteinuria. 2 The sensitivity and specificity of microalbuminuria for diagnosis of diabetic nephropathy is quite low as demonstrated by various studies. 4 Microalbuminuria may be seen due to various other causes, with significant day to day variation in urinary albumin excretion and serial testing is usually necessary to confirm the diagnosis. 15 Diabetic nephropathy is also frequently observed with declining GFR but without significant albuminuria, especially in females. 16 Clearly the diagnosis of diabetic nephropathy is far from simple, especially in early stages.
Invasive inulin clearance measurement provides accurate GFR measurements, but is impractical for routine use. Nuclear medicine techniques are also unsuitable for follow-up because of the associated repeated radiation exposure. The modified MDRD formula for eGFR has been found by several studies to be sufficiently accurate for standard clinical and research applications.17,18
Grey-scale renal ultrasound may show progressive diminution in renal size and increase in renal cortical echogenicity with progression of diabetic nephropathy but definitive echotexture changes appear only in stage IV CKD. Mogazhi et al. 19 concluded that cortical echogenicity correlates predominantly with tubular atrophy and interstitial inflammation but not with interstitial fibrosis. Diabetic nephropathy involves interstitial fibrosis as an important pathological change. 3 Hence cortical echogenicity shows poor correlation with extent of renal involvement in diabetic nephropathy.
Hemodynamic changes in the kidney are assessed using Doppler sonography. Two important parameters in renal Doppler include intrarenal resistive index and venous impedance index. Casadei et al. 20 concluded that the most relevant clinical information is provided by the intrarenal resistive index, which also has the ability to allow early diagnosis of diabetic nephropathy. Jeong et al. 21 found that the venous impedance index decreases in diabetic nephropathy but does not offer a significant advantage over resistive index. Resistive index values are higher in interstitial pathologies as compared to purely glomerular pathologies. 22 The literature reports good correlation of resistive index values with interstitial fibrosis, focal fibrosis, and arteriolar sclerosis, but not with glomerular changes which are also seen in diabetic nephropathy. 23
The influence of age on resistive index has been assessed by several studies. Some studies show no significant correlation 24 while some show a progressive increase in resistive index with age. 22 Kaiser et al. 25 found that the intrarenal resistive index increases by 0.01 per decade in healthy adults, likely due to progressive arteriosclerosis. Our study also showed a positive correlation of resistive index with age.
Resistive index increases with the progression of diabetic nephropathy, as was also observed in our study. There was significant overlap in resistive index ranges between the stages of diabetic nephropathy, indicating that it would not be helpful in identifying the stage of diabetic nephropathy but serial measurements can be performed for follow-up of progression. An RI value of 0.70 is considered the upper normal threshold by most authors.26,27 In our study, we found that using a cut-off value of 0.65 provides the best diagnostic accuracy. This discrepancy may be due to the inclusion of subjects with persistent low level microalbuminuria and the use of a highly sensitive autoanalyzer, both of which would have led to the inclusion of more early stage diabetic nephropathy cases. The influence of age on intrarenal resistive index makes it difficult to define a single cut-off value for diagnosis. Based on these findings, we recommend further studies with age matched controls in order to establish age-wise diagnostic cut-off values.
Shear wave sonoelastography is a novel technique to quantitatively estimate tissue elasticity. Sporea et al. 8 performed a comparative study between ARFI and ElastPQ® techniques of shear wave elastography in determining liver stiffness and found that values obtained by ARFI were about 10% higher than those of ElastPQ® technique. The application of shear wave elastography to the kidney has shown encouraging results. 7
Guo et al. reported a negative correlation between shear wave velocity and age in healthy adults. Shear wave velocity was also found to be lower in men 28 ; however, Lee et al. 29 found an increase in shear wave velocity with age. Guo et al. concluded that further studies were necessary to study the influence of age on shear wave velocity. In our study, we could not find any significant correlation between mean renal shear modulus and age.
Yu et al. 30 in 2014 performed the first study on renal shear wave elastography in diabetic nephropathy using virtual touch quantification and found that the best cut-off point for predicting diabetic nephropathy was 2.43 m/second with sensitivity and specificity of 85.7 and 84.5%, respectively. Goya et al. evaluated changes in the renal parenchymal elasticity in various stages of diabetic nephropathy using ARFI. The highest values were seen in stage II diabetic nephropathy. The best cut-off point for predicting diabetic nephropathy in their study was 2.43 m/second with sensitivity of 84.1% and specificity of 67.3%. 31 Similar findings were also seen in a study by Bob et al. 32 In our study, we found maximum diagnostic accuracy at 5.31 kPa.
We also observed a significant rise in renal shear modulus in the early stages of diabetic nephropathy. This may be due to the pathophysiology underlying the disease as hypothesized by Goya et al. 31 Increase in shear wave values in early stages reflects the histopathological changes of glomerular and tubular hypertrophy. Progressive decrease in stages III–V reflects progressive glomerulosclerosis and decline in renal function which overshadow the effect of interstitial fibrosis. As the early stages not only put forth a challenge in diagnosis but also have maximum implications for the management and ultimate prognosis, shear wave elastography may serve as an appropriate tool for early diagnosis of the condition.
There were some limitations in our study. Obese patients had to be excluded due to the limited depth (8 cm) of the shear wave elastography system. Size of the ElastPQ® sample box was fixed (15 mm × 5 mm), which meant exclusion of patients with small contracted kidneys. Age matching of cases and controls would have yielded more accurate age specific cut-offs for resistive index, which was not done. In addition, albuminuria was used for the diagnosis of diabetic nephropathy, which means normoalbuminuric nephropathy patients were excluded. This translates into sampling bias, especially for stage I nephropathy patients. Another source of sampling bias in our study was the fact that all hypertensive patients had to be excluded.
Conclusion
We established normal and abnormal ranges of ElastPQ® renal shear modulus values in our study. Renal Doppler and shear wave elastography can be used as radiological techniques for early diagnosis and follow-up of diabetic nephropathy with high sensitivity and specificity. Shear wave elastography is also useful in assessment of the stage of diabetic nephropathy. They can also be combined as a single sitting procedure to further increase the diagnostic performance. Further studies with age matched controls and long term follow-up of diabetic patients to corroborate these findings will definitively establish the role of these modalities in diabetic nephropathy.
Footnotes
Acknowledgements
Not applicable.
Contributors
Both authors were involved in conception and design, acquisition of data, analysis and interpretation of data, drafting the article and revising it critically for important intellectual content and final approval of the version to be published.
Declaration of Conflicting Interests
The author(s) declared no potential conflicts of interest with respect to the research, authorship, and/or publication of this article.
Ethics Approval
Institute Ethics Committee, VMMC and Safdarjung Hospital, New Delhi 110029.
Permission from patient(s) or subject(s) was obtained in writing for publishing their case report.
Funding
The author(s) received no financial support for the research, authorship, and/or publication of this article.
Guarantor
AM.
