



Abstract
Introduction
The study objectives were to develop standard charts for fetal renal artery blood flow to define normal ranges and to assess the reliability of the measurements.
Methods
This prospective, longitudinal study reviewed 72 low-risk singleton pregnancies who had serial ultrasound examinations. Pulse wave Doppler was used to obtain the resistivity and pulsatility indices of the fetal renal arteries. Standard charts of the fetal renal arteries were created using mixed effects modelling and the intra- and interobserver reliability for the renal blood flow measurements was analysed.
Results
Standard charts of the normal ranges of the renal artery resistive index (RI) and pulsatility index (PI) of the fetal renal arteries were created. The 3rd, 5th, 10th, 50th, 90th, 95th and 97th centiles were calculated. The intraclass correlation coefficient was acceptable for intraobserver reliability (RI = 0.66, PI = 0.88) and poor for interobserver reliability (RI = 0.11, PI = −0.56).
Conclusions
These novel charts demonstrate the change of the fetal renal artery blood flow during pregnancy. These may be used in clinical practice to detect variations from these normal ranges and be useful in future studies of kidney function projection.
Introduction
Appropriate vascularisation and blood flow to fetal organs are crucial for normal fetal development and organ growth. 1 To enable glomerular filtration and tubular reabsorption and secretion, the mature kidneys require a complex arterial and venous system. 2 It is therefore essential to understand what blood flow is expected for the normal development of the fetal kidneys.
Increasing advancements in antenatal ultrasound have allowed the investigation of many fetal vessels including the renal arteries. 3 Pulsed wave Doppler is the best, non-invasive method to study the haemodynamic changes in fetal vessels. Quantification of the normal evolution of the fetal renal blood flow during pregnancy will enable identification of aberrations in blood flow, such as may be seen during fetal hypoxia when blood is preferentially shunted away from the kidneys to more vital organs. 4 Analysis of the resistivity index (RI) and pulsatility index (PI) of the fetal renal arteries may potentially provide a more sensitive method to assess renal haemodynamics and may be used to assist in the diagnosis of renal pathologies.
The study aimed to use serial ultrasound examinations to develop standard charts of the normal ranges of RI and PI of the fetal renal arteries from 16- to 38-weeks’ gestation for use in clinical practice. This study also aimed to evaluate the reliability of RI and PI measurements.
Materials and methods
This prospective, observational study was conducted in the Maternal Fetal Medicine Unit and Ultrasound Department of the Townsville University Hospital, Australia, between May 2017 and February 2019. Serial obstetric ultrasound exams were performed on a cohort of low-risk pregnancies. The Townsville Hospital and Health Service Human Research Ethics Committee approved the study (HREC/16/QTHS/216).
Study population
Townsville University Hospital provides tertiary perinatal facilities to North Queensland, which has a population of around 700,000. 5 Between May 2017 and October 2018, pregnant women aged 18 years or older, who attended the Medical Imaging Department at the Townsville University Hospital for a second trimester ultrasound exam were informed of the study and invited to participate. Patients were also informed about the study by their midwife, obstetrician, or sonographer. Informed, written consent was obtained from all participants.
This study was part of a larger investigation which assessed multiple factors that influence fetal kidney growth and blood flow. Accurately dated singleton pregnancies from 16- to 28-weeks’ gestation were recruited to the study. Pregnancy dating was based on their last normal menstrual period and 1st trimester ultrasound crown-rump length (CRL), that agreed within seven days, or on 1st trimester ultrasound if the last normal menstrual period (LNMP) was uncertain. The International Society of Ultrasound in Obstetrics and Gynecology recommends gestational age (GA) should be determined from 1st trimester CRL measurement. 6 However, for the creation of fetal size charts, a systematic review into the methodology for the creation of these suggested that it is more appropriate in these cases to estimate GA using an independent technique, such as the LNMP, if it correlates with the CRL measurement. 7 Women with multiple pregnancy, uncertain dates, maternal disease that was likely to affect the growth of the fetus (diabetes mellitus, hypertension requiring treatment, pre-eclampsia, kidney disease, heart disease), congenital or chromosomal fetal abnormality, and subsequent preterm birth less than 32 weeks were excluded.
Study process
On commencement of the study, the participant completed a questionnaire which included demographic, medical and obstetric data. Typically, the first ultrasound scan was conducted between 16 and 26 weeks; however, for six women their first scan was between 28 and 29 weeks. Women were required to attend ultrasound scans every four weeks from their first scan until delivery. If participants had additional clinically indicated ultrasounds, such as for reduced fetal movements, fetal renal Dopplers were performed if this additional scan was two or more weeks from the previous. After birth, data were collected on GA at birth, mode of delivery, birth weight, gender and condition of infant at birth from the electronic medical record.
Ultrasound measurements
All examinations were performed by three Australian accredited medical sonographers who were required to have more than two years post ultrasound qualification experience. A clearly defined protocol was developed, with instruction of the conduct of the examination to the sonographers performed by the authors (DW and SB). Three months into the study, a follow-up audit of the ultrasound examinations was performed to verify adherence to the study protocol. An Epiq 7 (Philips Ultrasound, Bothell, WA, USA) or Voluson E8 (GE Healthcare Ultrasound, Milwaukee, WI, USA) were used for the ultrasound scans. A curved linear transducer of the highest frequency possible, which matched the mother’s body habitus, was selected (ranging from 1 to 9 MHz) so that the maximum image resolution could be achieved.
A coronal view of the fetal kidneys was obtained, and colour flow Doppler was utilised to identify the renal artery originating from the aorta and entering the kidney. A 2–3 mm sample gate was positioned in the mid trunk of the main renal artery and a low wall filter of between 30 and 60 Hertz was selected. A pulse wave signal was acquired from both fetal renal arteries using an angle as close to 0 degrees as possible; an example is shown in Figure 1. To calculate the RI and PI, the mean of at least three consistent, consecutive waveforms was used.
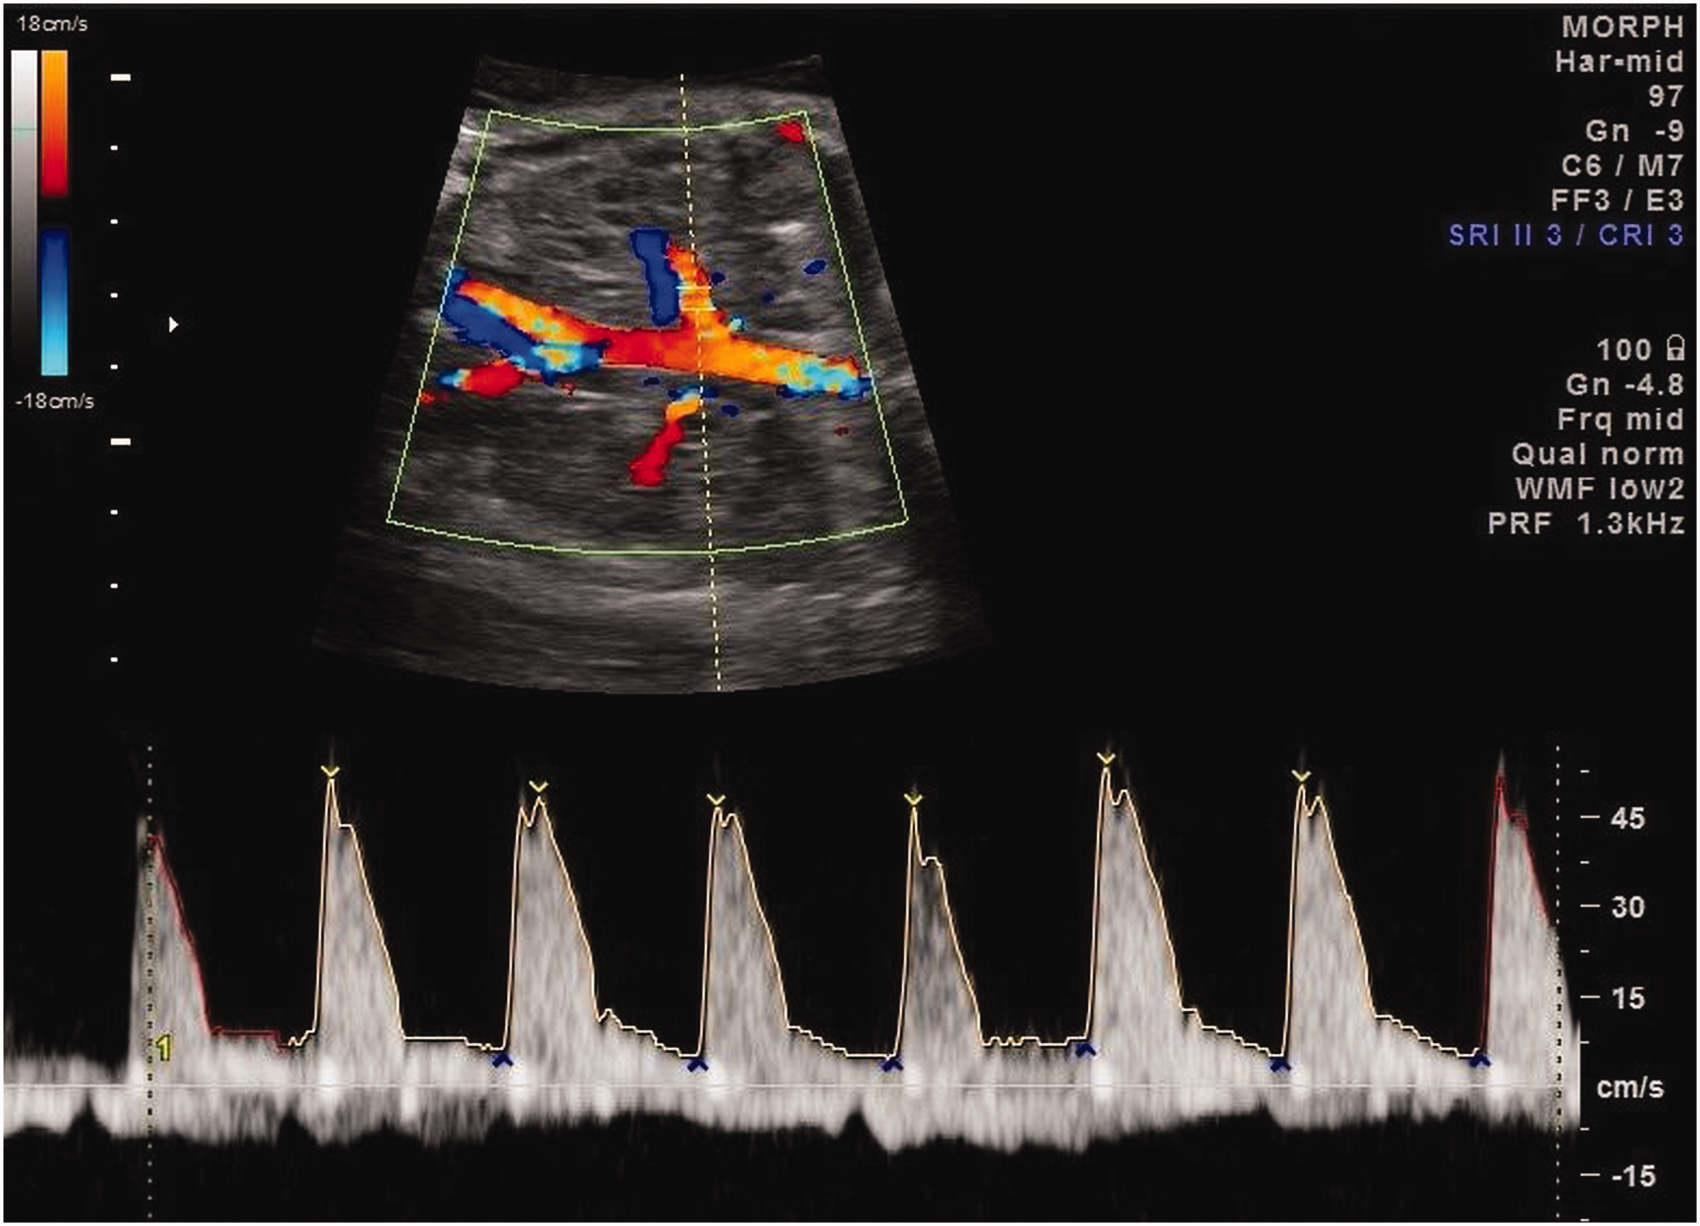
Left renal artery mid-trunk colour and pulse wave Doppler (28 weeks’ gestational age).
Measurement reliability
For analysis of intra- and interobserver reliability, a sample of 15 pregnant women across a range of 19 to 36 weeks’ GA underwent these assessments. Some were a part of the study and some were additional pregnant women who met the inclusion criteria for the study and all were happy to have multiple measurements. All three sonographers engaged in the study obtained real-time measurements of each renal artery Doppler twice. The measurements were concealed on the ultrasound monitor so that each sonographer would be blinded to the measurements. The mean of each sonographer’s two measurements was analysed.
Statistical analysis
IBM SPSS (Version 25, Armonk, NY, USA) was utilised to analyse maternal and neonatal characteristics, and intra- and interobserver reliability. Normality of the maternal and infant data was examined by visually inspecting histograms and a Kolmogorov–Smirnov test. Variables that were normally distributed were reported as mean and standard deviation (SD) and non-normally distributed variables as a median and interquartile range. An ANOVA model (a two-way random effects model with random subject effects and random observer effects) was used to analyse intra- and interobserver reliability. The SD, Cronbach’s alpha (α) and the intraclass correlation coefficient (ICC) with 95% confidence intervals were calculated.
Stata/MP v14.2 for windows (Stata Corp LP, College Station, TX, USA) was used for all other statistical analyses. The program ggplot2 8 in R Studio (version 1.2.1335) 9 was used to create the graphs. Statistical significance was taken as p < 0.05. Statistical methods similar to those of the INTERGROWTH 21st Project for fetal growth were applied. 10 Utilising the Stata function fp, the best fitting model for the mean RI and PI of the renal artery as a function of a fractional polynomial in GA (rounded down to whole week) was found. A two level, mixed effects regression model for RI and PI was then built. This included fixed effects for the polynomial function of GA, and accounted for repeated measures on participants using a random intercept and slope with unstructured covariance. This allows for variation within and between participants as each participant had their own starting value and growth trajectory. The standard charts were developed for 16 to 38 weeks’ GA.
Quantile plots and histograms were used to evaluate normality of the residuals. As there was non-constant variance, the standard error estimation was calculated using the Huber-White sandwich (robust) estimator. To determine the ideal fractional polynomial terms for the standard deviation function in the fixed effects model, scaled (multiplied by √(π/2)) absolute residuals from this model were regressed on GA. The percentile distributions of RI and PI by GA were assumed normal. They were calculated using the formula

Differences between the RI and PI of the fetal renal arteries were explored according to kidney side (right/left) and gender. The cohort needed to be divided for these analyses resulting in a reduction in the sample size of the groups. Therefore, the models are possibly underpowered, resulting in a risk of overfitting. As there were less data at some gestational weeks, for these analyses, the GA was in two weekly blocks (rounded down to the nearest even number). For the variables side and gender, a two-level saturated mixed effects model was fitted. The fixed effects were GA and the variable (side or gender) and a term for the interaction of GA and exposure. To allow for repeated measurements on participants, a random intercept was applied and the Huber-White (robust) estimator was utilised to estimate standard errors for non-constant variance.
Results
In total, 155 pregnant women were recruited into this study. As this was part of a larger study, 83 participants were excluded, due to maternal disease likely to affect fetal growth (73), fetal abnormality (6), premature birth before 32 weeks’ GA (3) or failure to attend (1), resulting in 72 low-risk pregnancies being included in the study. Participant inclusion and exclusion is shown in Figure 2. The characteristics of the mothers and infants are summarised in Table 1. A total of 393 ultrasound scans were performed between 16 and 39 weeks’ GA, with the median number of scans per pregnancy being five (range of three to nine scans). There were 761 RI and PI measurements each. The renal artery Doppler was unable to be obtained for 1 kidney in 12 scans and for both renal arteries in 4 scans. This was due to the renal artery Doppler being technically difficult to obtain due to fetal position, movement and breathing. No significant difference was demonstrated between right and left kidneys or gender for RI or PI of the fetal renal arteries.

Participant inclusion and exclusion flowchart.
Characteristics of participants and their neonates.
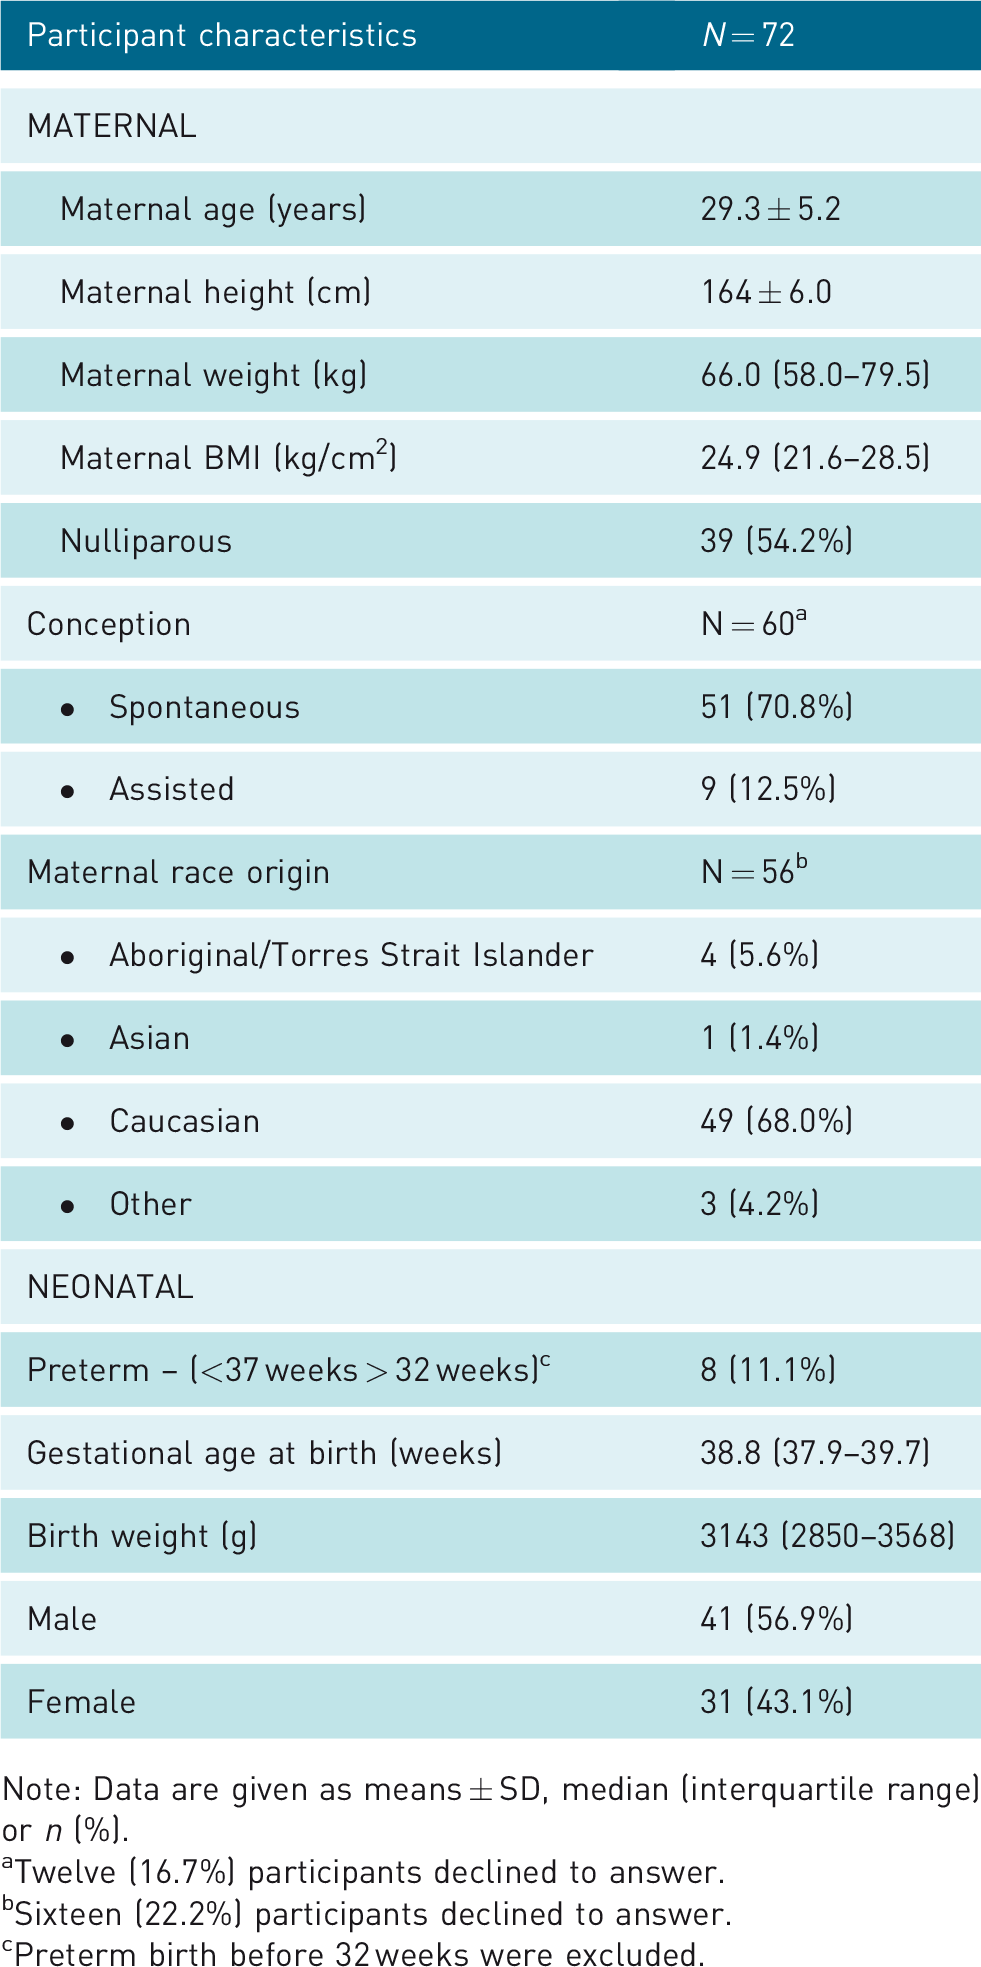
Note: Data are given as means ± SD, median (interquartile range) or n (%).
aTwelve (16.7%) participants declined to answer.
bSixteen (22.2%) participants declined to answer.
cPreterm birth before 32 weeks were excluded.
Fetal renal artery RI and PI charts
Centiles for the RI and PI of the renal arteries were calculated using the equation
mean +Z×SD, where Z is the Z score for the respective centile.
The fetal renal artery RI and PI standard charts of the measurements between 16 and 39 weeks’ GA are presented in Figures 3 and 4 with the 3rd, 10th, 50th, 90th and 97th smoothed centiles. All the calculated centiles for RI and PI are shown in Tables 2 and 3. The equations for RI and PI are:

Fetal renal artery resistivity index (RI) standard chart of all raw measures (dots) and the 3rd, 10th, 50th, 90th, and 97th smoothed centiles calculated from the derived equations for the mean and SD according to gestational age.

Fetal renal artery pulsatility index (PI) standard chart of all raw measures (dots) and the 3rd, 10th, 50th, 90th, and 97th smoothed centiles calculated from the derived equations for the mean and SD according to gestational age.
Fitted 3rd, 5th, 10th, 50th, 90th, 95th and 97th centiles calculated from the derived equations for the mean and SD of fetal renal artery resistivity index (RI) for gestational age (GA) in weeks rounded down.

Fitted 3rd, 5th, 10th, 50th, 90th, 95th and 97th centiles calculated from the derived equations for the mean and SD of fetal renal artery pulsatility index (PI) for gestational age (GA) in weeks rounded down.

Mean RI = −0.2556362 – (0.043501×GA) + (0.449057 ×GA0.5)
SD RI = 0.0781253 – (0.0003515×GA2) + (0.0000903 ×GA2×ln(GA))
Mean PI = −0.7966501 – 176.19×GA−1 + 79.45009× GA−1×ln(GA)
SD PI = 0.3675488 – 0.0000423×GA3 + 0.0000119 ×GA3×ln(GA)
Measurement reliability
The intraobserver and interobserver reliability analyses for renal artery RI and PI are summarised in Tables 4 and 5. The intraobserver ICC for measuring the renal artery was moderate at 0.66 for the RI and good for the PI at 0.88. However, the interobserver ICC for measuring the renal artery was poor at 0.11 for RI and −0.56 PI. Poor reliability was assessed as an ICC less than 0.50, moderate as between 0.50 and 0.75, good as between 0.75 and 0.90 and excellent as more than 0.90. 11
Intraobserver reliability for fetal renal artery Dopplers

Interobserver reliability for fetal renal artery Dopplers.

Discussion
This study developed standard charts of fetal renal artery RI and PI from 16 to 38 weeks’ gestation to provide more detailed information on normal ranges of fetal renal artery blood flow during pregnancy. We showed that the RI and PI of the fetal renal arteries demonstrated little alteration during the pregnancy. These charts may be utilised to provide additional information in cases of high-risk pregnancy and possible fetal renal abnormalities. The strengths of this study are the wide range of gestational ages assessed and that these charts are derived from longitudinal data using mixed effects modelling which considers every data point and allows for variation between and within participants. This provides true change of renal haemodynamics over the duration of the pregnancy.
There are a limited number of studies investigating normal fetal renal artery blood flow, and most have small sample sizes, are cross-sectional in design and have heterogeneous inclusion and exclusion criteria making direct comparison difficult.12–17 Some earlier studies showed that the PI decreased with increasing GA.12,13 The study most similar to our study, in that it was a longitudinal design and used mixed effects modelling, also demonstrated that the RI and PI remained relatively unchanged throughout the pregnancy. 16 Other studies demonstrated similar findings; however, these were not longitudinal in design.14,15 A study in 2015 reported longitudinal reference intervals for fetal renal arteries, however was not truly longitudinal as although the design was longitudinal, the data were not analysed as longitudinal data. 15 The mean of the renal Doppler measurements was calculated for each gestational age group disregarding the repeated measures and non-independence of the data. 15 Minimal change in renal haemodynamics during pregnancy is likely due to the fetal kidneys having limited true function in-utero as the placenta performs most of the prenatal renal excretory functions and the proportion of cardiac output to the fetal kidneys is low at only 3 to 5%.1,18
Our study had adequate intraobserver reliability for RI and PI; however, the interobserver reliability was poor for both indices. Few studies have assessed intra- and interobserver reliability of the RI and PI of the fetal renal artery. One recent study assessed the reliability of the fetal renal artery PI and, similar to our study, found adequate intraobserver reliability (ICC = 0.528) but poor interobserver reliability (ICC = 0.114). 15 Obstetric care is becoming increasingly dependent on fetal Dopplers; however, most investigations do not investigate or report on intra- and interobserver reliability. 19 Current studies on maternal and fetal blood flow that have reported on reliability of these Dopplers have revealed poor-to-moderately poor results.20,21 Arguably, there is known physiological variation in spectral Doppler traces of fetal blood flow due to fetal movements, breathing and heart rate changes that should be factored into reliability of these Doppler indices. 22 To obtain the highest quality Doppler trace, fetal Dopplers should be performed in the absence of fetal movement and breathing, with a small sample gate and an angle as close to 0 degrees as possible. We also need to acknowledge that the variability of fetal Doppler traces will always be more than a fixed two-dimensional measurement of a fetal structure and that innovative techniques will likely not initially have a high enough reliability for clinical decision making. They may require further development and refinement. Ultrasound blood flow analysis is rapidly improving, and with implementation of new techniques the variability of the Doppler trace may improve.23–25 The concerns around variability are important and should not be underrated. Care should be employed in having too much confidence in a diagnostic test with unclear or questionable reliability.
These normative ranges of renal artery RI and PI, which include multiple different centiles, could be useful for future studies to investigate the redistribution of blood flow away from the kidneys that is thought to occur in most growth restricted fetuses.4,26 If changes in the renal artery blood flow profile could be quantified, these alterations in renal haemodynamics might become a useful diagnostic tool for fetal growth restriction. Renal blood flow indices may also have the potential to predict the severity of fetal growth restriction or be a novel marker for postnatal renal function, particularly in instances of renal abnormalities. At this stage, however, the findings for RI and PI of fetal renal artery Dopplers are variable and need to be validated. They should be utilised with care as the usefulness of fetal renal artery blood flow measurements in clinical practice is still unclear. It should also be noted that RI and PI are not measures of perfusion but rather a reflection of vascularity and flow intensity. Further larger studies utilising newer enhanced Doppler techniques with standardised methods may identify and refine their future value.
Recently, novel 3D volume Doppler flow techniques have been investigated to obtain vascular indices of flow index, vascular index and vascularisation flow index of the fetal renal arteries.23,24 They are showing promise to assess the renal haemodynamic characteristics and their relationship to variations in flow associated with fetal growth restriction. Currently, they suffer from poor reproducibility due to technical matters such as multiple non-standardised machine settings to select prior to acquisition of data, depth of insonation, patient habitus and fetal movements which result in measurements with high variability.23,25,27
A limitation of the study was the small sample size at gestational ages prior to 20 weeks and after 36 weeks. The charts would be most reliable in the GA range from 20 to 36 weeks. Additionally, our cohort was recruited through a mixed risk hospital service. It therefore does not represent the whole community and caution should be employed in extrapolating these results to different populations.
Conclusion
Pulse wave Doppler of the fetal renal arteries allows detailed analysis of the haemodynamic characteristics of the blood supply to the developing kidneys. Our standard charts provide the normal ranges of the RI and PI of the fetal renal arteries during pregnancy. They may provide some information on potential physiological or pathological alterations in renal blood flow or could be used in future research studies. Considering the problems with reliability, these charts do need to be used with caution. Further studies of fetal renal artery blood flow are required to evaluate improved techniques and assess the value of fetal renal artery Dopplers in clinical practice.
Footnotes
Declaration of Conflicting Interests
The author(s) declared no potential conflicts of interest with respect to the research, authorship, and/or publication of this article.
Funding
This work was supported by a Townsville Hospital Study, Education and Research Trust Account grant (SERTA grant:27_2016) and an Australasian Society for Ultrasound in Medicine (ASUM research grant 2018).
Ethics Approval
The Townsville Hospital and Health Service Human Research Ethics Committee approved the study (HREC/16/QTHS/216).
Guarantor
SB & YK.
Contributorship
SB designed the study with assistance of YK, DW, DR and MS. SB and DW recruited patients and SB performed some of the ultrasound examinations. The statistical analysis and interpretation were done by SB with the support of Hunter Medical Research Institute and other assistance from YK. SB wrote the manuscript and YK, DW, DR and MS contributed to the critical revision, editing and approved the final manuscript.
Acknowledgments
Thank you to the women who participated in the study. The authors would like to acknowledge their significant contribution. Thank you to sonographers Ms Sue Bloomfield and Ms Kate Gerard for helping to perform the ultrasound examinations, to Ms Nicole Clapham for organising participants and data management, and Hunter Medical Research Institute (HMRI) for statistical analysis support. Author Sonja Brennan is supported by a Queensland Advancing Clinical Research Fellowship.
Availability of data and materials
Datasets are available from the corresponding author on reasonable request and with permission of Queensland Health, Australia.
