
Abstract
Background:
Novel ultrasound technology and software processing allow offline evaluation of tricuspid annular plane systolic excursion and mitral annular plane systolic excursion measurements. We wished to compare both novel 4D matrix (eM6C) and conventional (RAB6-D) transducers with variable settings (electronic spatiotemporal image correlation, spatiotemporal image correlation and four-dimensional real time) to determine if there was a significant difference in absolute value, quality and repeatability of the resultant reconstructed image and M-mode trace.
Methods:
A blinded prospective cross-sectional study of normal fetuses from 23 to 38 weeks’ gestation were recruited. After routine sonography, four-dimensional volumes were stored and analysed using GE 4DView™ software. Statistical analysis explored variability, correlations and repeatability of the measurements with chi-square analysis, intraclass correlations and the Bland–Altman comparison plots. A scoring system was devised for image quality.
Results:
Eighteen participants generated 282 data volumes. Absolute values demonstrated some inconsistencies for both tricuspid annular plane systolic excursion and mitral annular plane systolic excursion measurements with variations between transducers: the highest for the RAB6-D/spatiotemporal image correlation setting and the lowest for the four-dimensional real-time settings. The RAB6-D/spatiotemporal image correlation setting was the most repeatable combination (intraclass correlation coefficient = 0.85). Poorest image quality (M-mode trace, four-chamber view, annuli) came from the RAB6-D/four-dimensional real-time combination with the eM6C/electronic spatiotemporal image correlation and RAB6-D/spatiotemporal image correlation settings being nearly identical.
Conclusion:
We show that transducer and setting combinations influence absolute tricuspid annular plane systolic excursion/mitral annular plane systolic excursion measurements, so need to be articulated in future research. The transducer setting (electronic spatiotemporal image correlation/spatiotemporal image correlation/four-dimensional real time) was a more significant factor than the type of transducer (conventional vs matrix). Subjective image evaluation does not correlate well with repeatability of image acquisition. Further studies are needed to compare measurements using four-dimensional post-processing tools against conventional real-time measurements.
Keywords
Introduction
The M-mode ultrasound technique (time motion mode) has been used since the 1950s to display the changing position of moving structures within the heart. 1 Technological evolutions continue including spatiotemporal image correlation (STIC) and electronic spatiotemporal image correlation (eSTIC) that generate four-dimensional (4D) volume data sets of anatomy, such as the fetal heart2,3 or adult kidneys. 4 Both STIC and eSTIC software reconstruct a set of two-dimensional (2D) frames acquired over multiple cardiac cycles into a 4D volume (allowing post-processing for spatial reconstruction of desired anatomical planes) and temporal (M-mode) evaluations that may be otherwise unachievable with 2D real-time imaging. 5 This may overcome difficulties such as inaccurate volume measurements, rapid fetal cardiac motion and undesirable fetal positions. STIC may enable cardiac function measurements such as tricuspid annular plane systolic excursion (TAPSE) and mitral annular plane systolic excursion (MAPSE) to be generated with similar results to real-time measurements and potentially higher success rates. 6
Further transducer improvements include matrix technology; combining a thin scan plane, wide field of view and elevation compounding to produce fast acquisition speeds and high image resolution. The electronic curved matrix transducer (eM6C) uses eSTIC software on the Voluson E10™ (GE Healthcare, Zipf, Austria) and has previously demonstrated superior image resolution compared to the conventional mechanical transducer (GE RAB6-D). 3 This is beneficial in fetal echocardiography, where longer scan times with mechanical 4D transducers and slower frame rates may result in suboptimal diagnostic images secondary to fetal movement. Visualisation of the fetal cardiac anatomy has been reported to be subjectively superior with eSTIC technology,3,7 with improved image quality for normal cardiac anatomy in mid gestation. 7 Addition of this imaging technology does not appear to increase scan time for a standard second trimester screening examination. 3
The GE software 4DView (GE Healthcare, Australia) allows offline (post-processed) acquisition of an M-mode trace facilitating measurements TAPSE and MAPSE of the fetal heart. These measures of longitudinal ventricular function may be affected in the early stages of fetal cardiac dysfunction including hypertrophic cardiomyopathy secondary to maternal gestational diabetes. 8 Reference ranges have recently been published for TAPSE and MAPSE using real-time STIC;9–11 the measurements are small therefore minor variations in calliper placement, image quality and subjective evaluation may significantly alter the TAPSE or MAPSE measurement. Alterations in ultrasound settings and equipment may affect absolute values and repeatability of Doppler measurements; therefore, standardisation is crucial.12,13 Therefore, we sought to analyse the difference in the quality of the M-mode trace between matrix and mechanical conventional 4D transducers and determine the impact upon TAPSE and MAPSE measurements.
The aims of this study were to compare absolute values and repeatability for TAPSE and MAPSE using both 4D Matrix and conventional transducers with variable settings (eSTIC, STIC and 4D real time (4DRT)) and develop a qualitative scoring system for both resultant reconstructed images and M-mode traces.
Materials and methods
A blinded, prospective cross-sectional cohort of fetuses were scanned once between 23 and 38 weeks gestational age using the GE Voluson E10 with matrix eM6C and mechanical conventional RAB6-D transducers (GE Healthcare, Australia). Participants were low-risk pregnant women recruited with written and informed consent and local ethics committee approval (SESLHD ref 2020/ETHO2517). Inclusion criteria were women aged 18–45 years, with singleton pregnancies, body mass index (BMI) < 35, following a normal morphology scan in mid trimester. Exclusion criteria included fetuses with structural fetal abnormalities (cardiac or non-cardiac), aneuploidy, maternal age <18 and >45 years, medications or diseases with the potential to affect Doppler measurements, fetal growth restriction, psychiatric illness or a poor understanding of the English language.
A single sonographer (A.F.) recorded biometry, amniotic fluid index, estimated fetal weight (EFW), umbilical artery, middle cerebral artery and ductus venosus Doppler measurements. An apical 2D four-chamber view of the heart was the starting point to acquire each STIC volume. The angle of rotation used for reorienting the image was always less than 90 degrees and normally as close as possible to 0 degrees, to minimise any negative impact on valve resolution.
4D volumes of third trimester fetal hearts using both transducers with a combination of preset settings including eSTIC, STIC and 4DRT were saved for offline analysis. Fetal volumes were acquired by different probes/settings and consecutively saved on the same patients, ensuring consistency in scanning penetration depth and fetal and placental position. Harmonic imaging was utilised with a range between 4.4 and 7.2 MHz. The speckle reduction imaging filter, edge enhancement, dynamic contrast and grey map number were all consistent with only a minor adjustment of the persistence using the 4DRT setting. Acquisition time is influenced by the transducer and setting with the eM6C/eSTIC and RAB6-D/STIC taking approximately 130–140 frames per second; the eM6C/4DRT imaging at 27 frames per second and the RAB6-D/4DRT is the slowest at 13 frames per second. This is due to the eM6C transducer capturing several ‘subvolumes’ in quick succession (approximately 3 seconds) and reconstructing an image. This is significantly faster than the singular 10–12 seconds sweep using the RAB6-D. The angle size for each volume was predetermined for each setting depending on the speed of acquisition and frame rate to reduce the impact of motion artefacts. A set protocol was used with the smallest angle size used for the 4DRT volumes: the RAB6-D/4DRT 20 degrees; eM6C/4DRT 25 degrees; eM6C/eSTIC 30 degrees and RAB6-D/STIC 35 degrees. A second sonographer (S.T.) analysed and annotated these data sets, obtaining an offline four-chamber apical view with the interventricular septum reformatted to be positioned at 0 degrees (±15°). The Z-plane was rotated between 0 and less than 90 degrees depending on the saved cine loop (Figure 1).
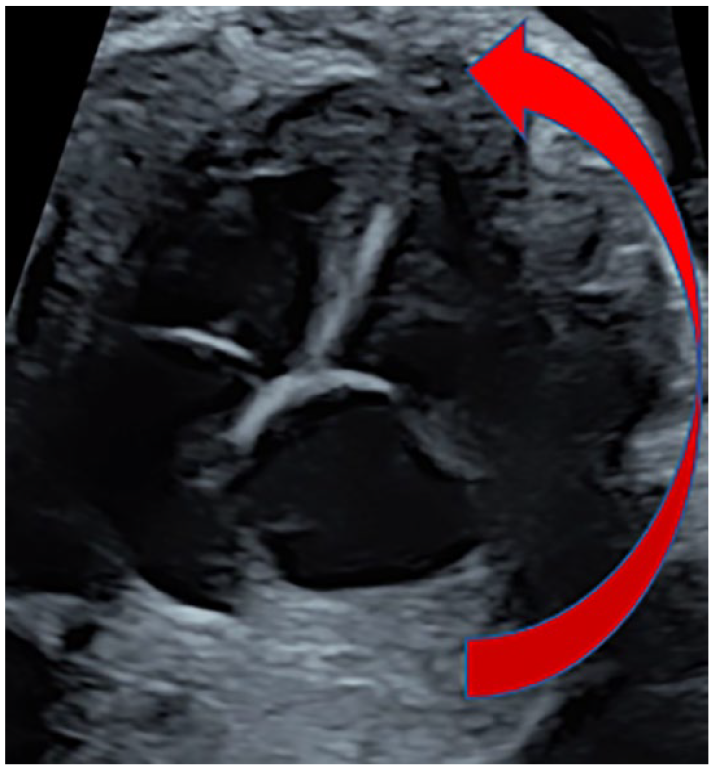
Rotating ‘Z-plane’ to obtain a vertical interventricular septum at 0 degrees.
TAPSE and MAPSE measurements were derived from an M-mode trace using 4DView. The volumes were rotated in the X-, Y- and Z-planes to visualise both annuli in the four-chamber apical view. An M-mode cursor was placed through the lateral leaflet of the tricuspid or mitral annulus aligned parallel to the interventricular septum (±15°) (Figure 2(a)), and a wave pattern was obtained. The amplitude of the M-mode wave was measured from its highest point (zenith) to its lowest point (nadir) between the end of systole and the end of diastole (Figure 2(b)), and TAPSE and MAPSE measurements were performed when image quality for both greyscale and M-mode trace were considered satisfactory.
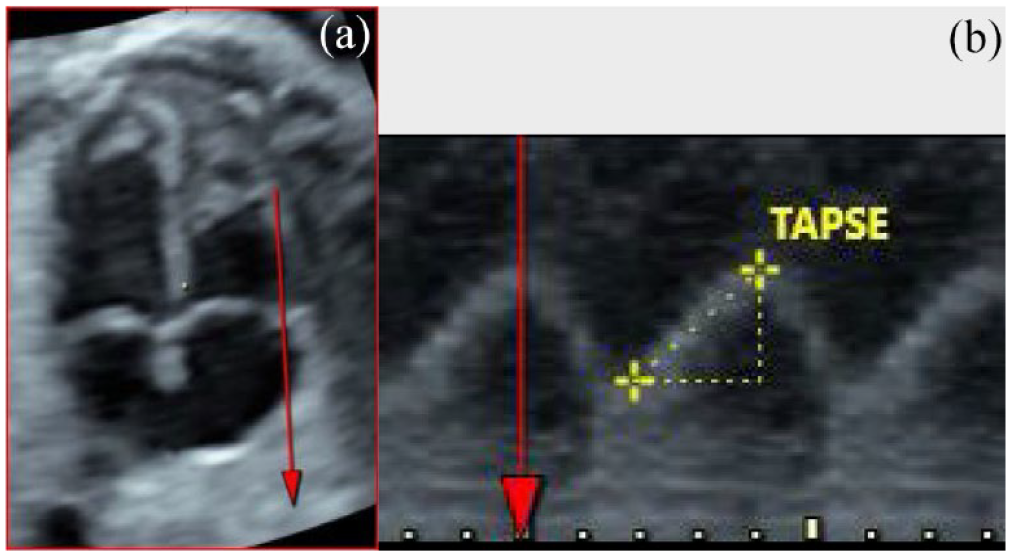
Obtaining TAPSE and MAPSE measurements from 4D fetal heart volumes. (a) M-mode cursor positioned through the lateral tricuspid annulus in the four-chamber apical view with visualisation of both annuli. (b) In the generated M-mode wave, the callipers are positioned at the nadir (lowest peak) and zenith (highest peak) to measure the TAPSE or MAPSE.
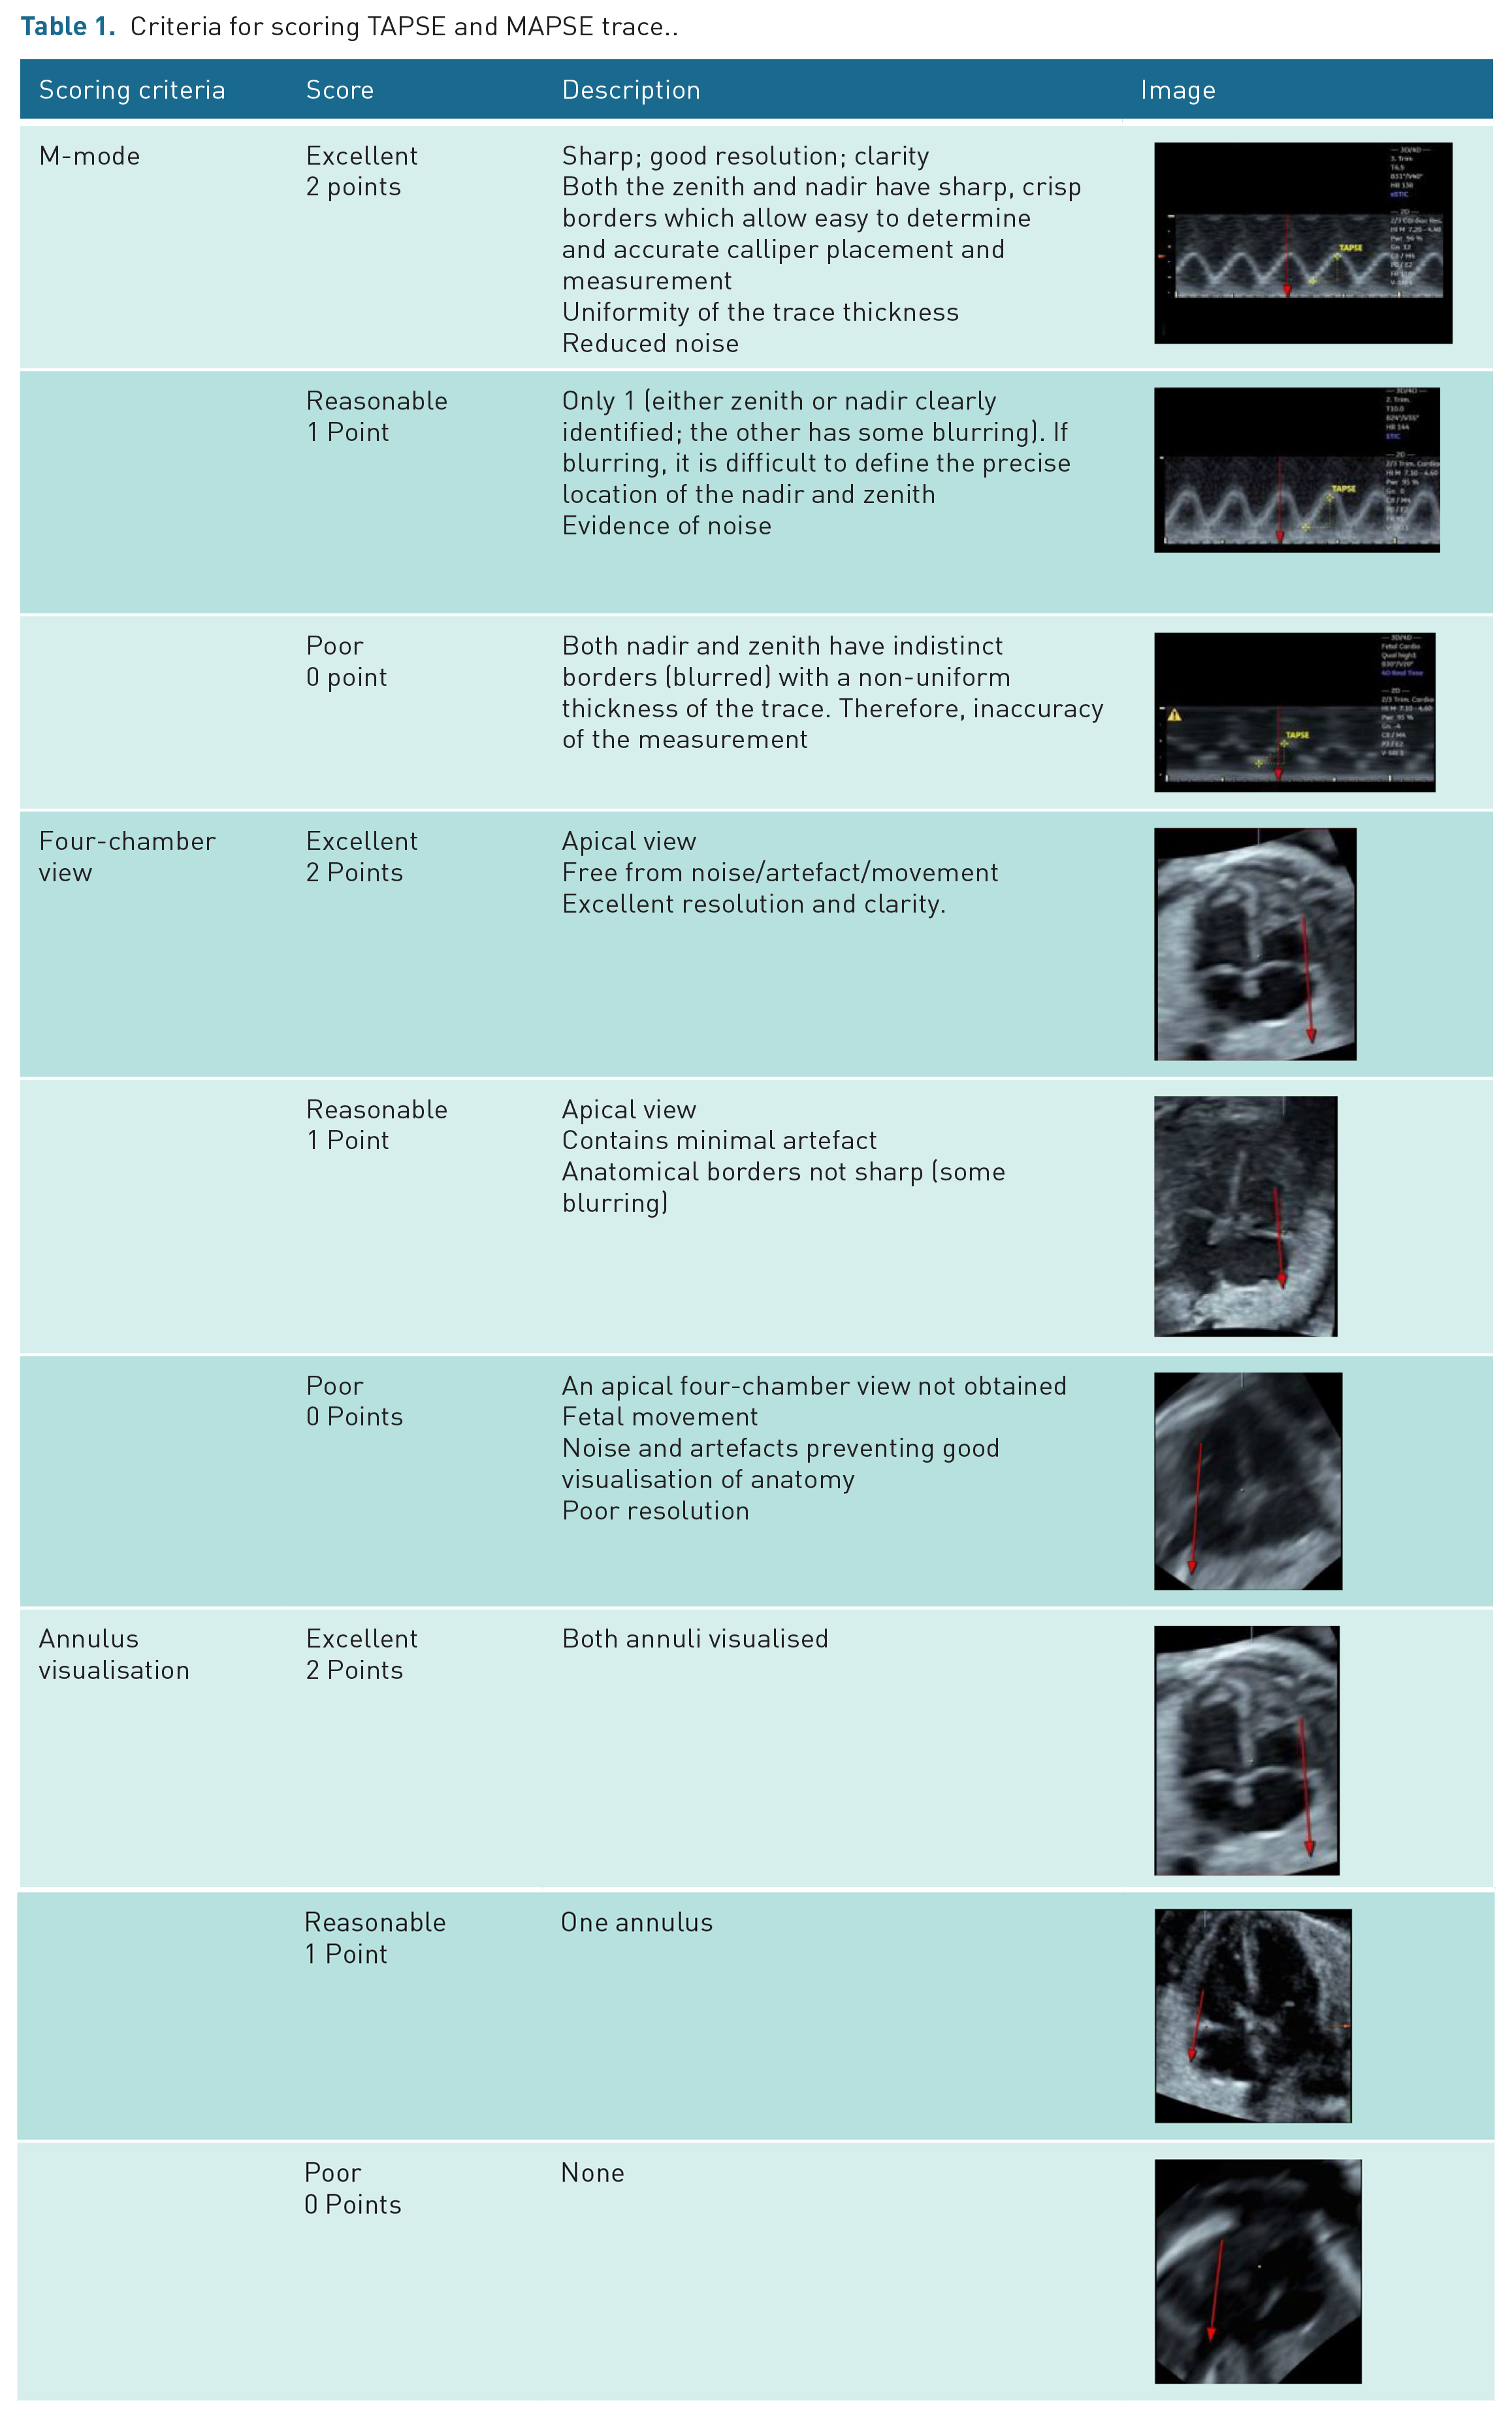
A fixed-point scale quality scoring system (Table 1) was developed through adaptation of peer-reviewed studies14–17 based on: quality of the four-chamber view (Excellent (2), Reasonable (1), Poor (0)); number of annuli visualised (Both (2), One (1), None (0)) and M-mode trace quality (Excellent (2), Reasonable (1), Poor (0)). The best cardiac cycle within the waveform was selected for evaluation, and any images affected by artefacts which negatively impacted visualisation of anatomy such as blurring because of fetal motion or shadowing from fetal limbs were excluded. One hundred images (50 eM6C and 50 RAB6-D) were randomly selected to be scored including 50 MAPSE and 50 TAPSE measurements. To ensure internal validity of fetal heart 4D volume assessment, there was separation of the acquirer (A.F.), TAPSE/MAPSE measurer (S.T.) and quality assessors (S.T., A.W., A.E.).
Criteria for scoring TAPSE and MAPSE trace..
Statistical analysis explored variability, correlation and repeatability of measurements using chi-square, intraclass correlation coefficients (ICCs) and Bland–Altman plots 18 using SPSS version 26 19 and SAS 9.4 software. 20 Each outcome was analysed using a mixed effects ICC, assessing the influence of transducer and machine settings. Random effects were estimated for individual, within transducer replication and setting combination and error. ICC was calculated as the proportion of total variability (error, individual and combination) that was attributable to individual. A mixed model with random effect for individual and separate error variances for each transducer/setting was specified for the Bland–Altman plots with fixed effects for TAPSE and MAPSE values and transducer/setting. Statistical predictive models using coefficient of determination graphs were also analysed.
Results
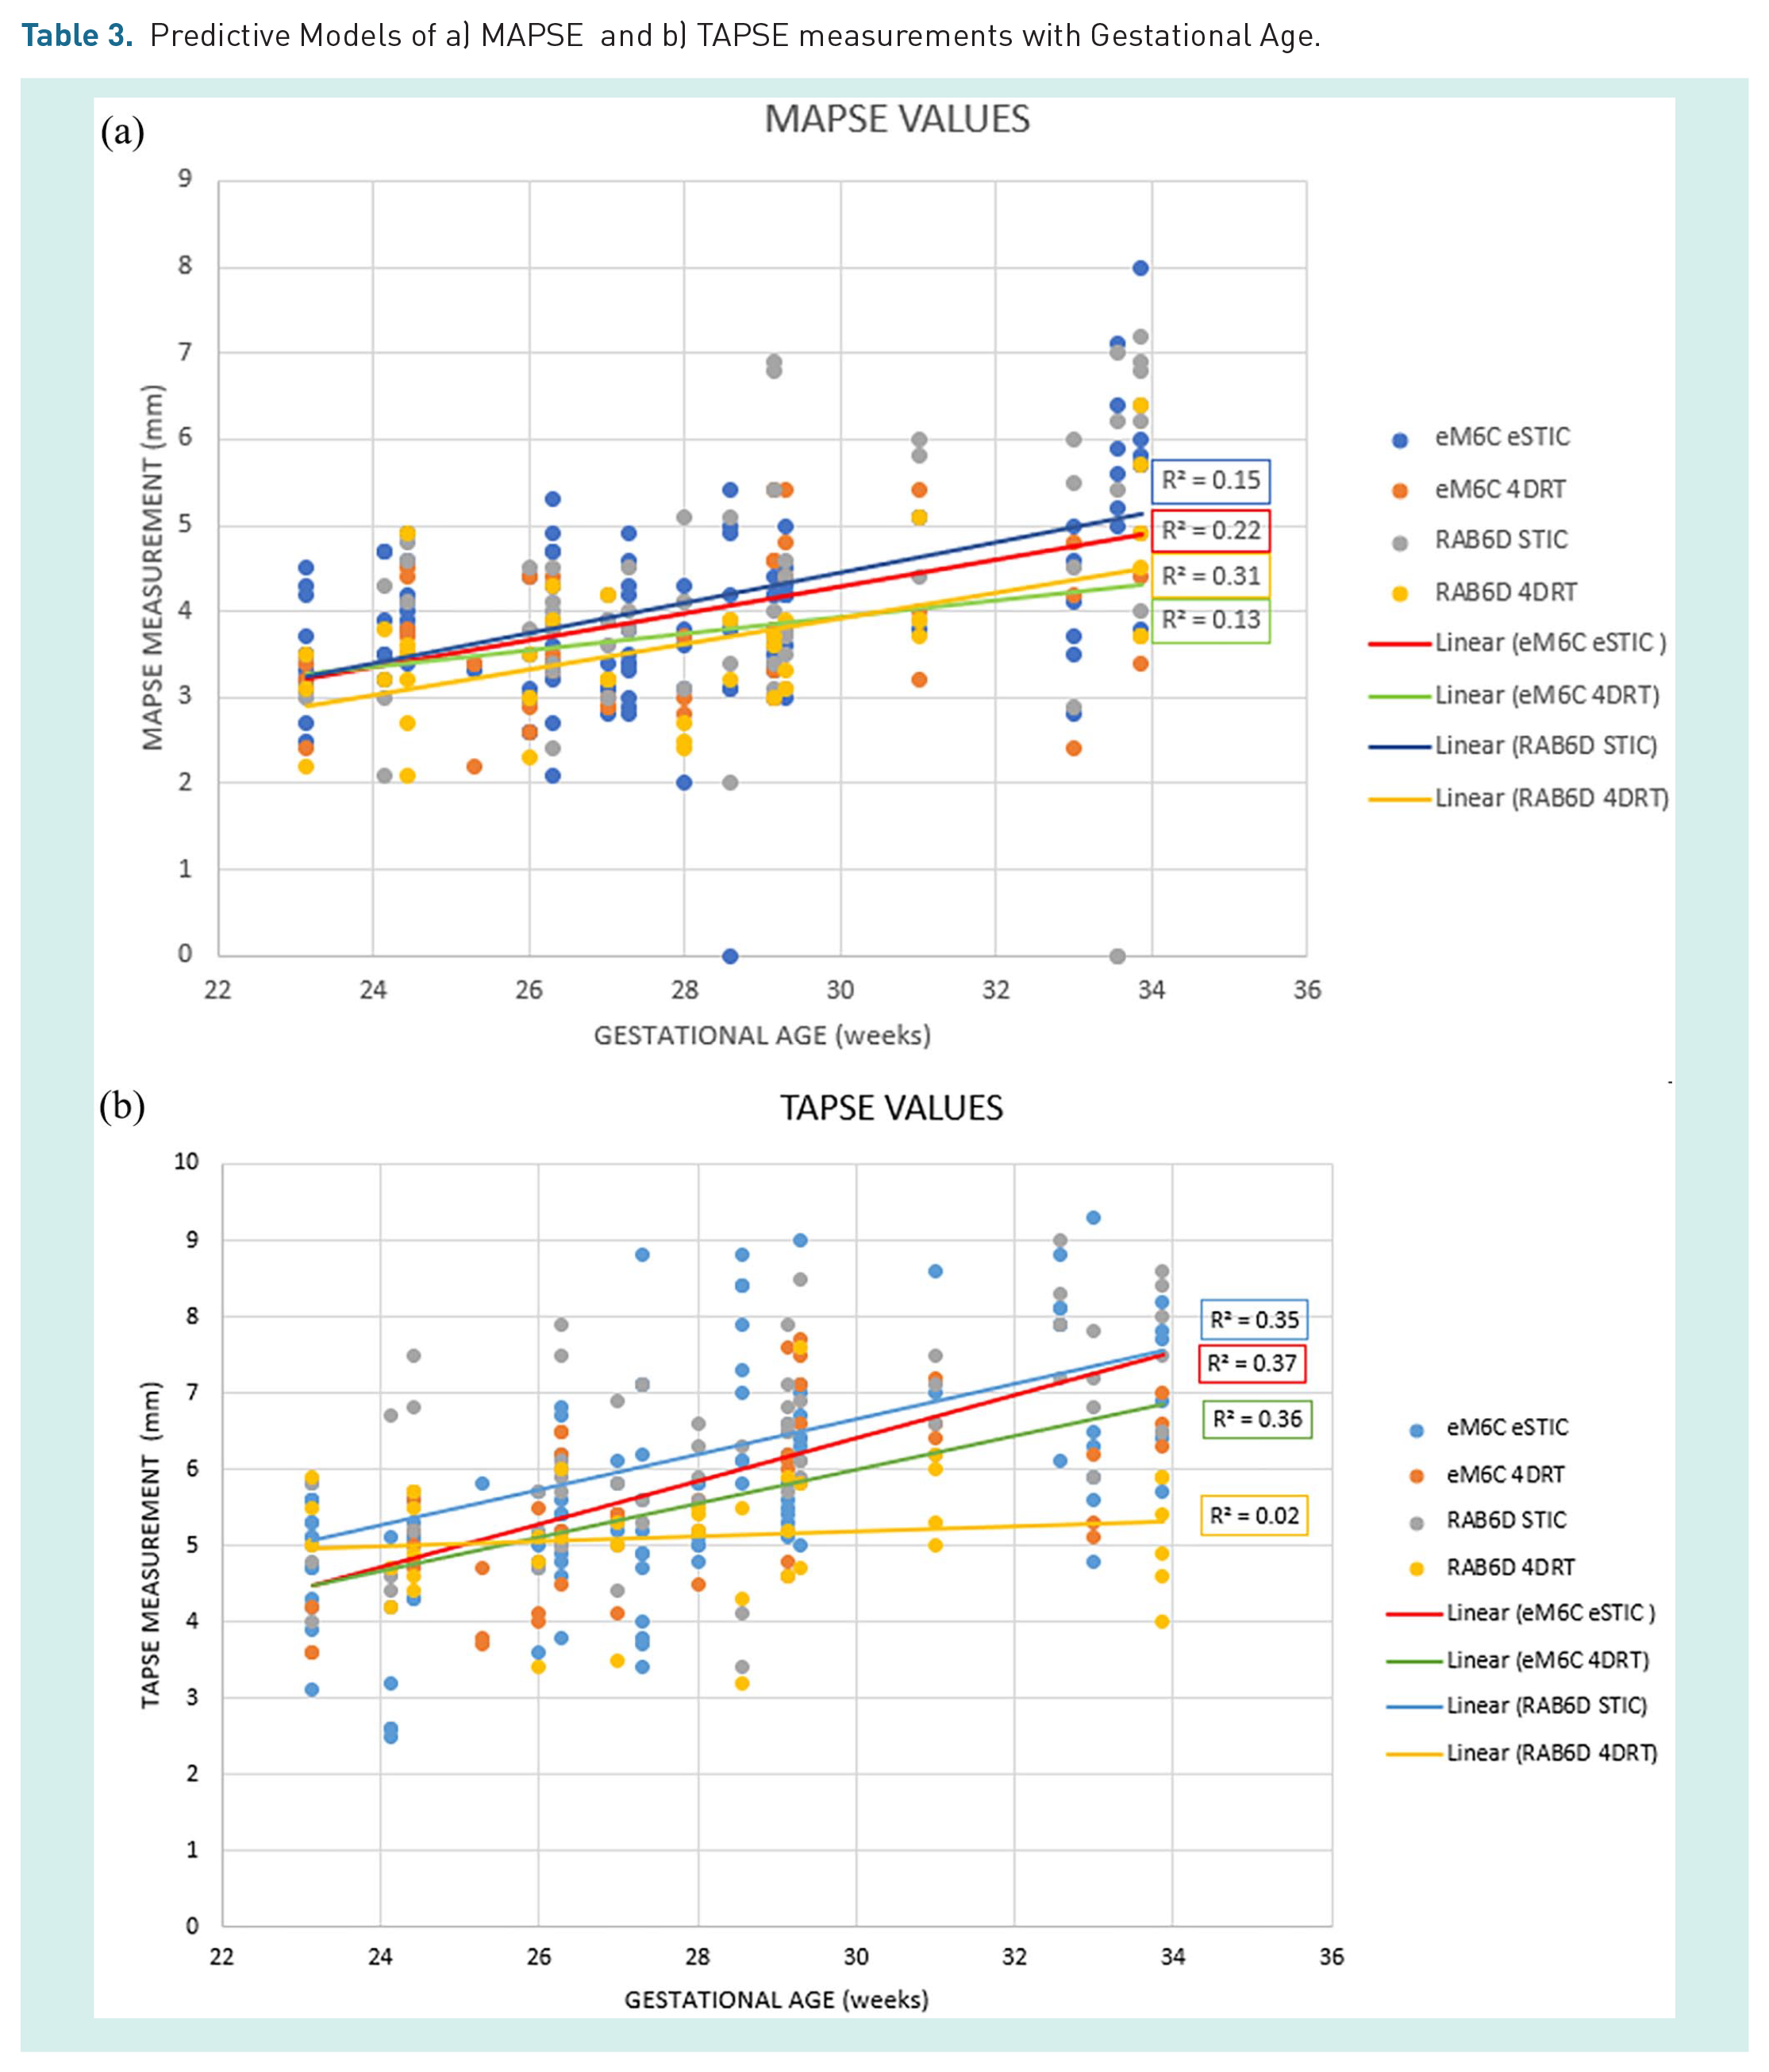
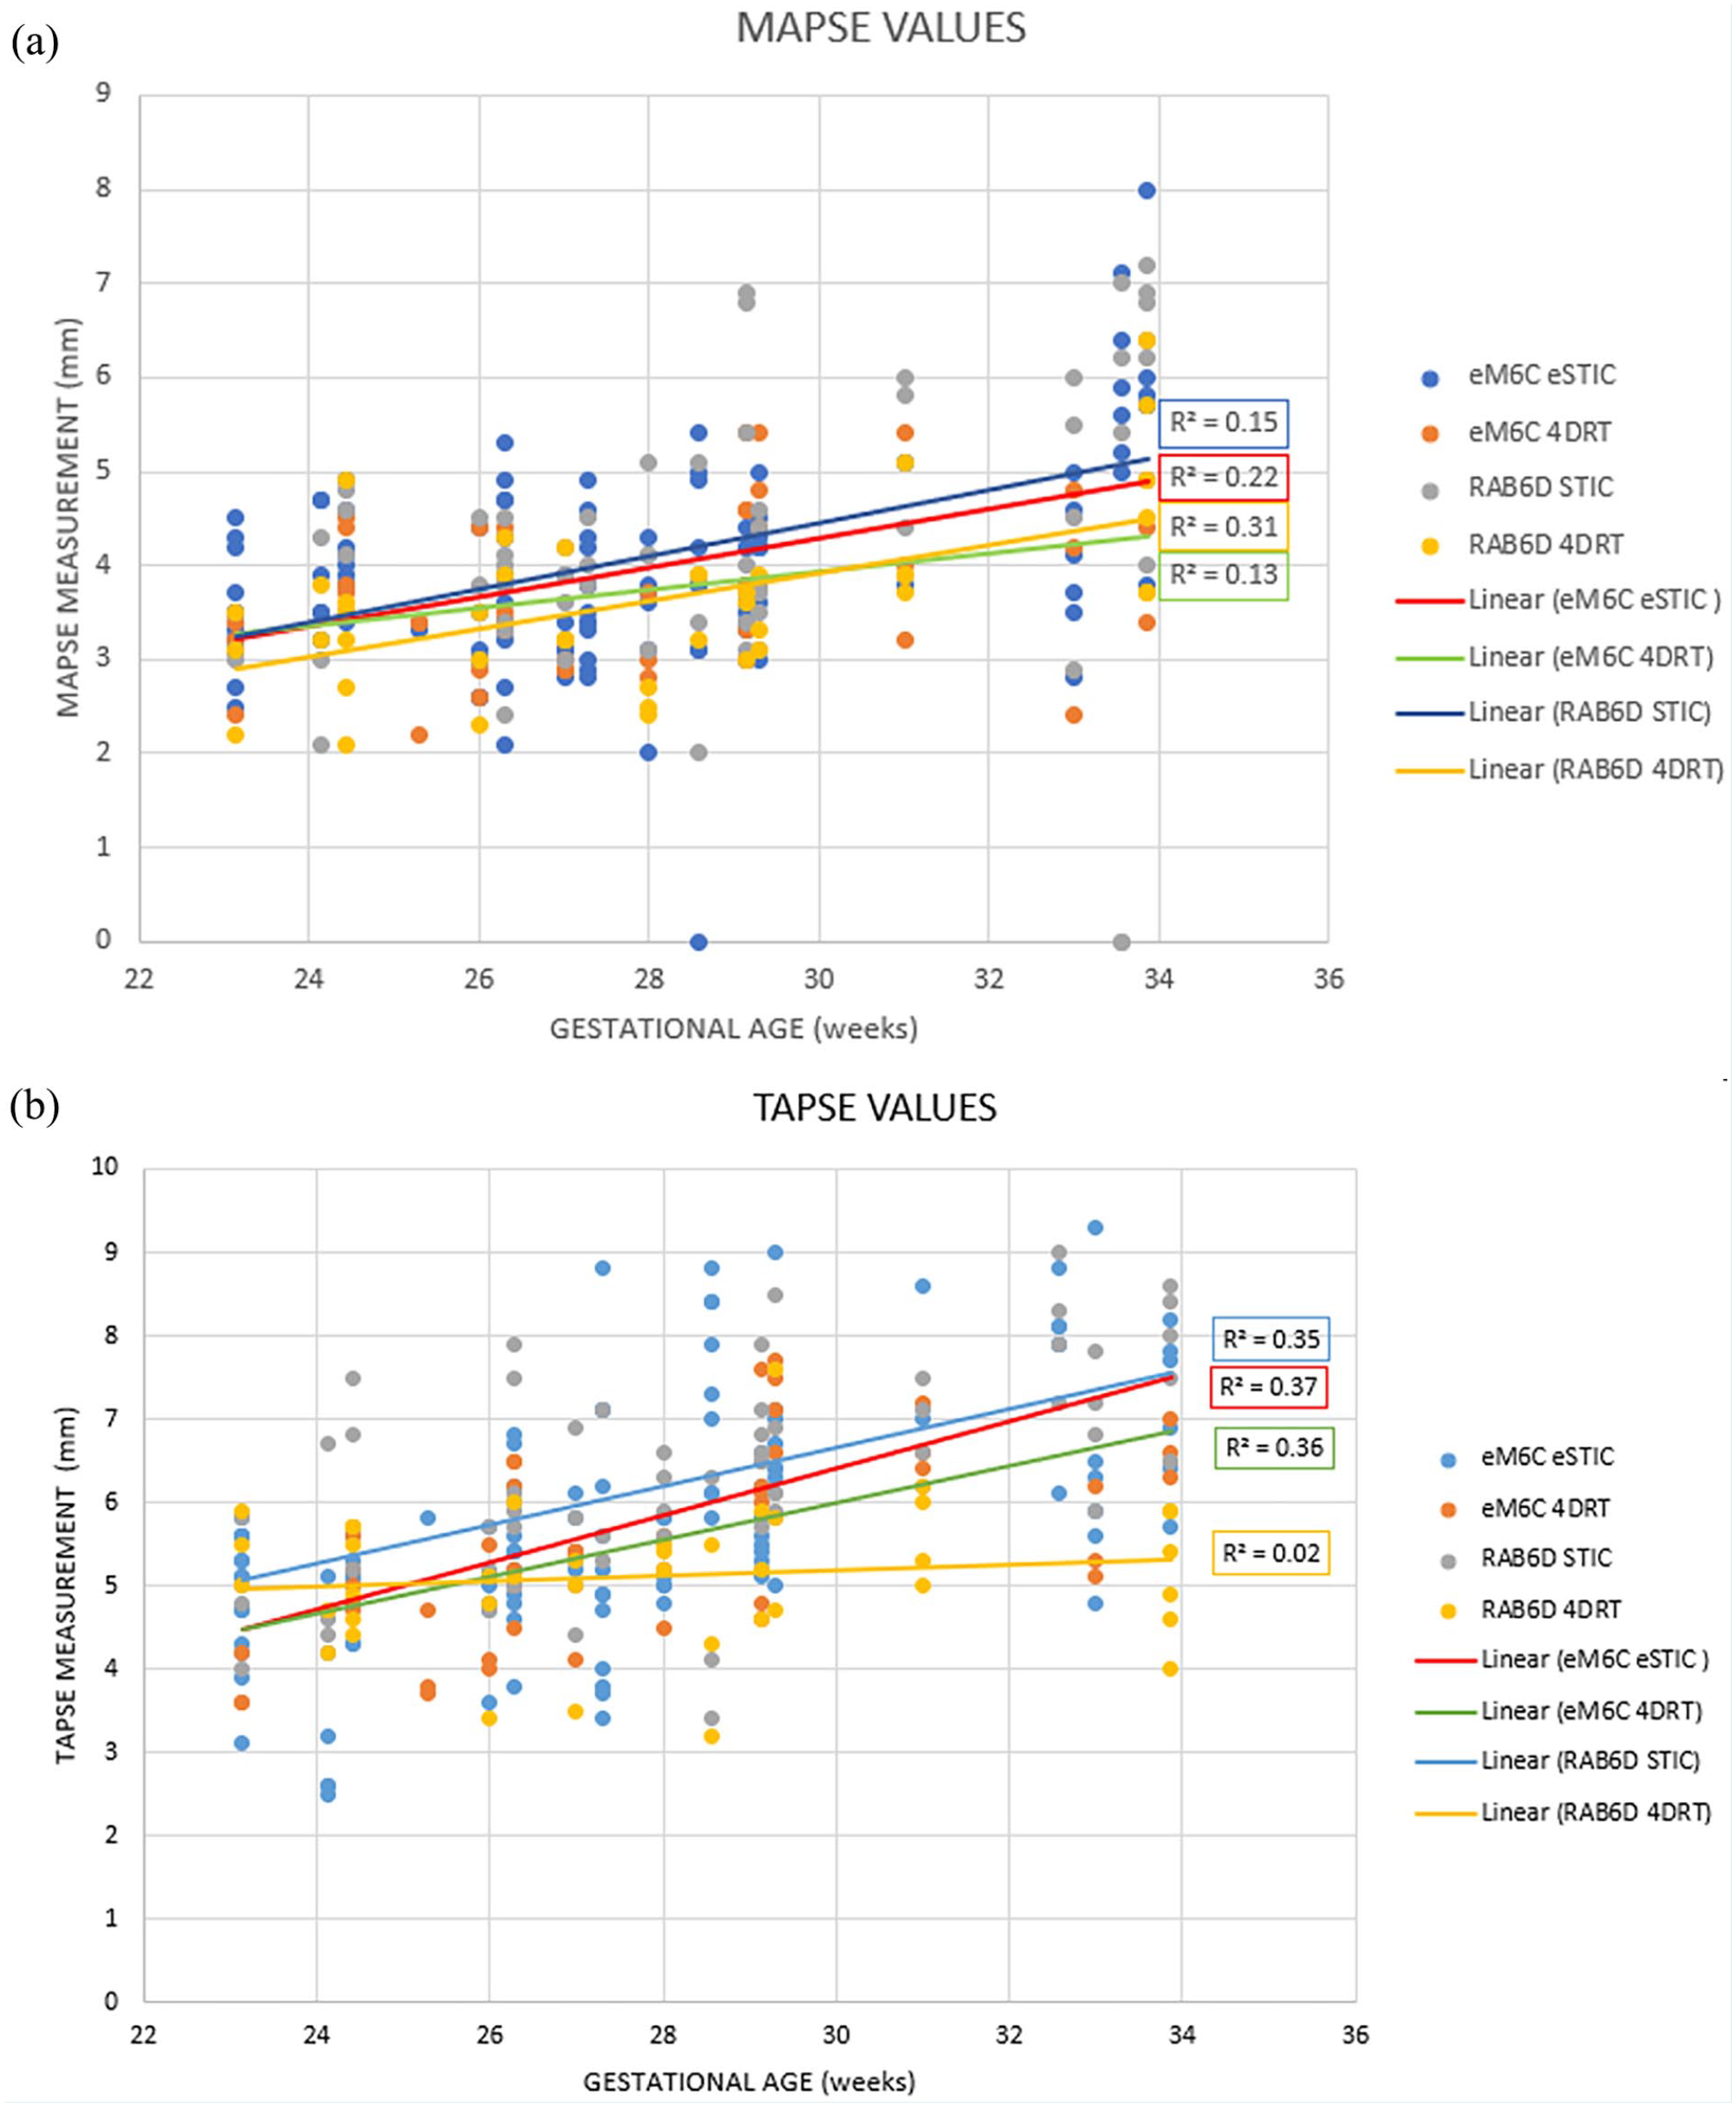
Eighteen participants had a single examination which generated 282 data volumes with 335 measurements using the eM6C and 211 using the RAB6-D as shown in Table 2. Absolute measurements for both TAPSE/MAPSE varied by transducer: the highest for the RAB6-D/STIC setting followed by the eM6C/eSTIC and then lowest with the 4DRT settings on both transducers. There was a trend towards higher RAB6-D STIC values for both TAPSE and MAPSE measurements compared to other settings, with eSTIC measurements being slightly higher than the 4DRT setting for either transducer (Table 2). To evaluate whether these differences were consistent, we evaluated transducer and setting combinations further using the Bland–Altman (difference-average) plots.18,21 These aimed to demonstrate proportional change in mean differences between transducer/setting combinations as annular plane systolic excursion average values increase as shown in Figure 3. Table 3 demonstrates the goodness of fit line and the coefficient of determination (R2) between gestational age and TAPSE and MAPSE measurements. There is increasing TAPSE and MAPSE values with increasing gestational age; however, the value of R2 is low indicating the observations are not good predictors because of the large spread of values.
Mean gestational age, TAPSE and MAPSE measurements.
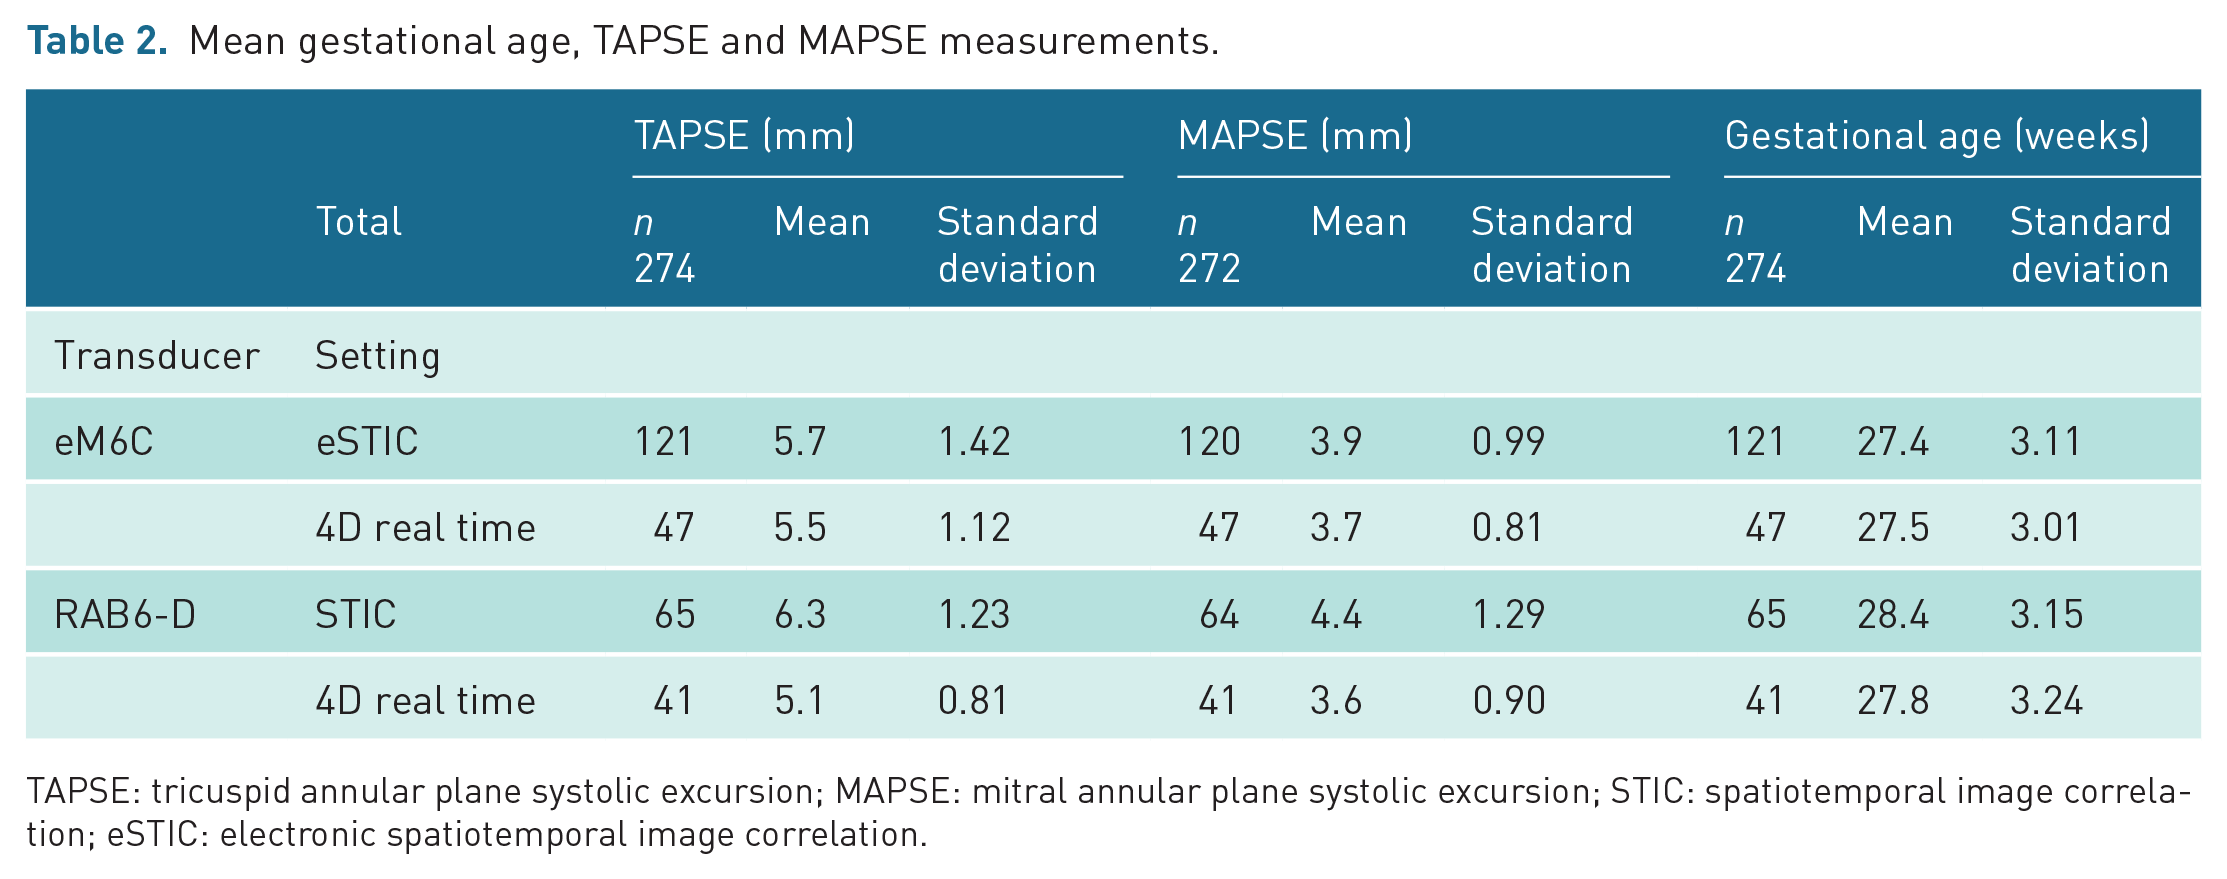
TAPSE: tricuspid annular plane systolic excursion; MAPSE: mitral annular plane systolic excursion; STIC: spatiotemporal image correlation; eSTIC: electronic spatiotemporal image correlation.
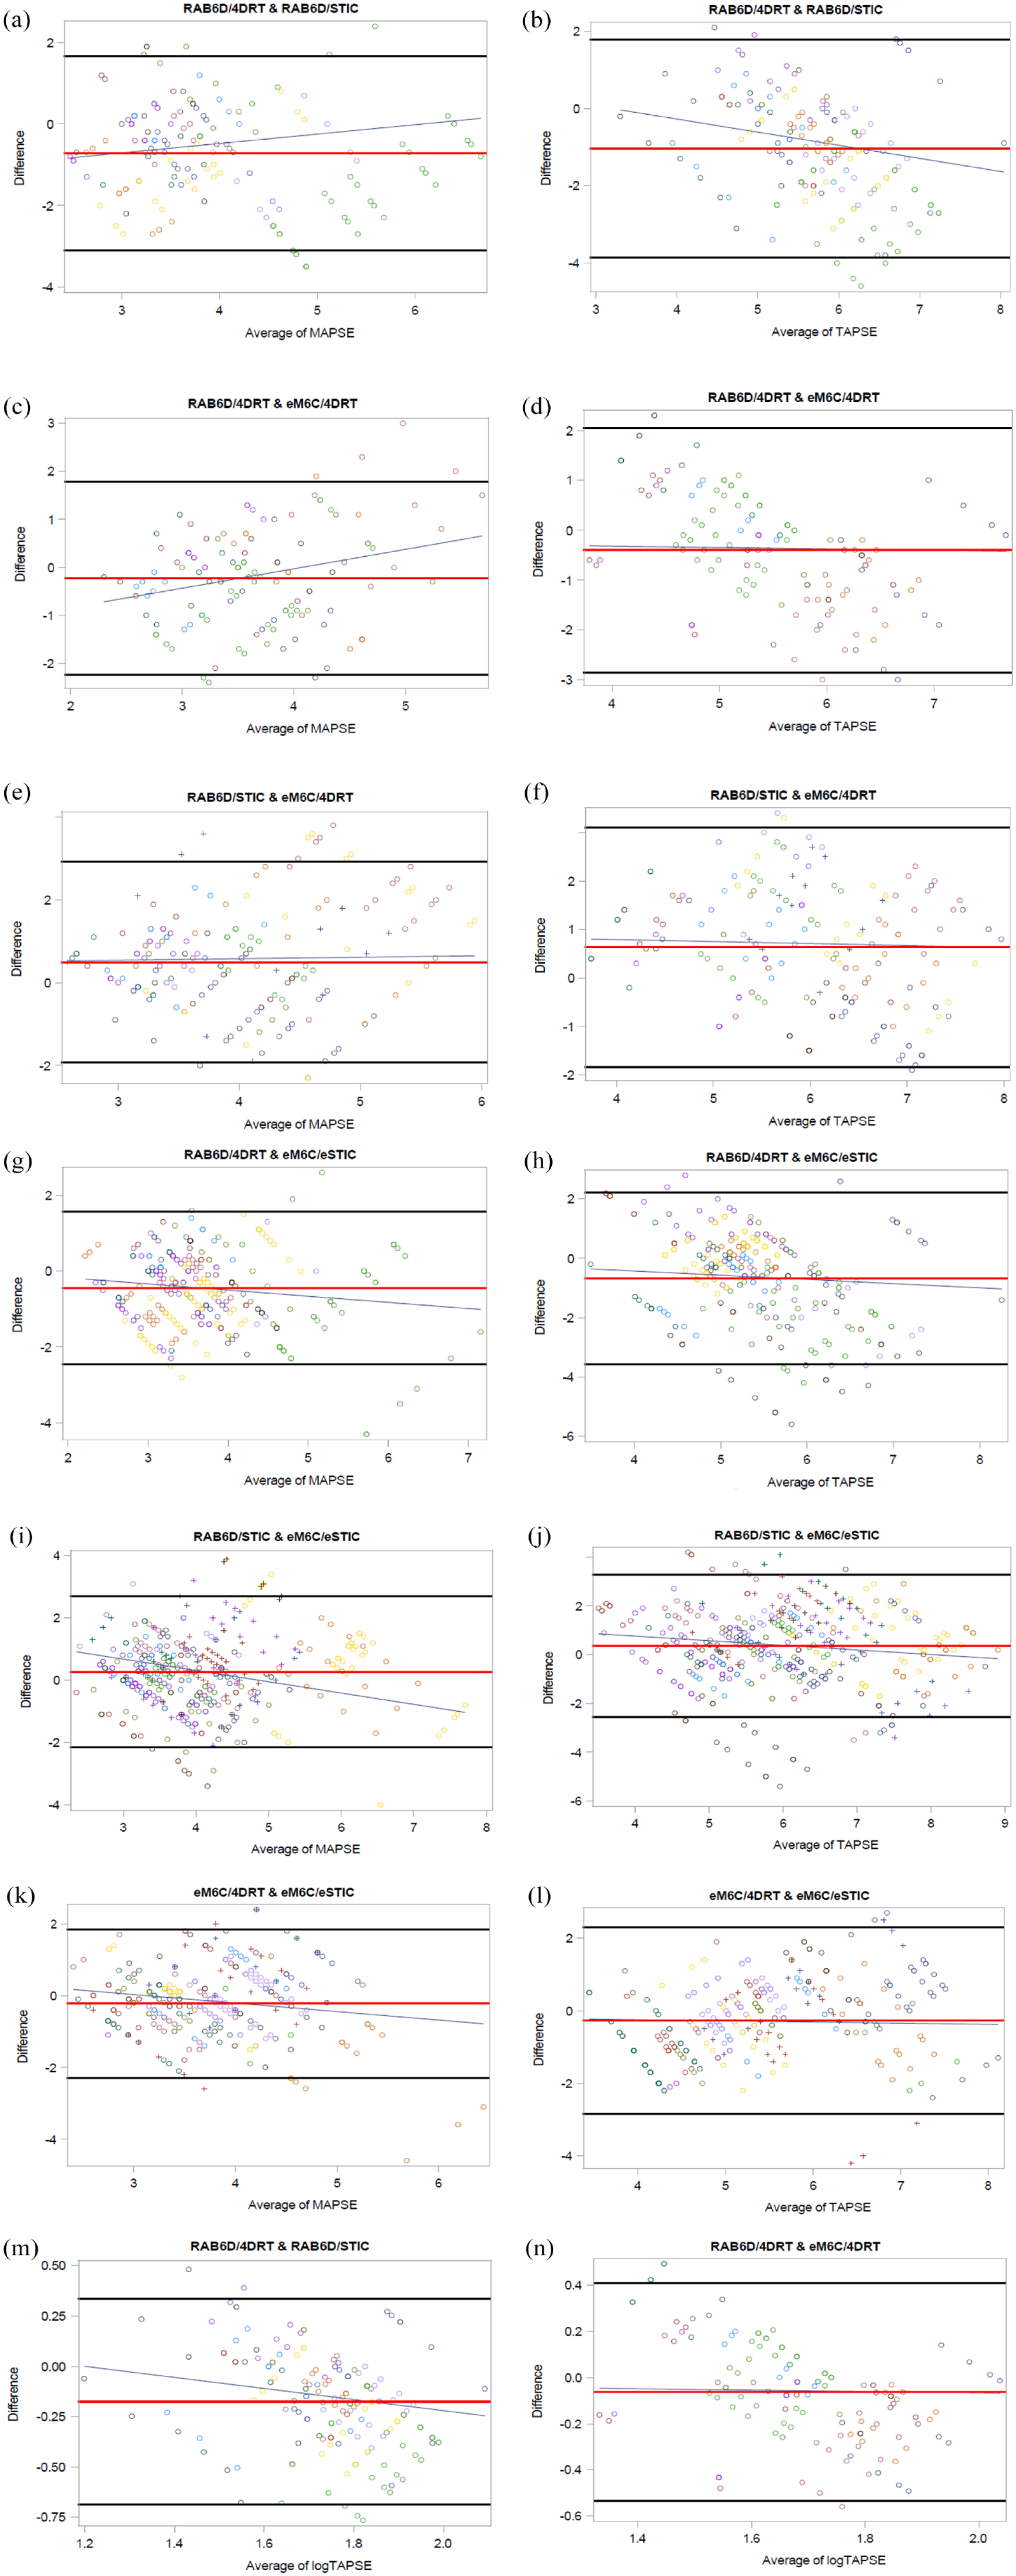
Comparing MAPSE and TAPSE Bland–Altman plots for all transducer and setting combinations (a–l). Logarithmic transformation of TAPSE measurements (m and n). Each participant is represented by a separate-coloured set of markers. The X-axis is the MAPSE or TAPSE measurement (mm). The plots are TAPSE and MAPSE mean values expressed as the average of the measurements from the two transducer and setting combinations reported on the X-axis; the corresponding difference between the estimations carried out by the two different combinations is on the Y-axis. The red horizontal line is the mean of the difference. The two black solid lines are the two standard deviation limits to provide an estimate of where 95% differences should lie if the differences are normally distributed. The trend lines are displayed as a blue line.
Predictive Models of a) MAPSE and b) TAPSE measurements with Gestational Age.
All TAPSE measurements (Figure 3(b), (d), (f), (h), (j) and (l)) showed a clear downwards (negative) slope comparing the difference between transducer mean measurements; however, the MAPSE measurement differences were mixed, only showing consistent change in difference when comparing the eSTIC setting (Figure 3(g), (i) and (k)). MAPSE measurements (Figure 3(a), (c) and (e)) indicated an upwards trending slope in the 4DRT and STIC comparisons showing inconsistency using the 4DRT transducer. Both eM6C/eSTIC combinations and RAB6-D/STIC values (Figure 3(i) and (j)) with TAPSE and MAPSE increased more rapidly than RAB6-D/4DRT (Figure 3(g) and (h)) (TAPSE p < 0.001 and p < 0.03; MAPSE p < 0.001 and p < 0.0001). The TAPSE RAB6-D/STIC combination had consistently higher values than the RAB6-D/4DRT setting (Figure 3(b) and (m)) (p < 0.0001), and this difference increases as the value of TAPSE increased as demonstrated with a significant negative slope. As the average TAPSE value increased, the RAB6-D/STIC values increased more rapidly than the RAB6-D/4DRT (Figure 3(b)) combination (p < 0.0001). The same trend was seen comparing eM6C/eSTIC and RAB6-D/4DRT (Figure 3(g) and (h)) with the former increasing more rapidly (p < 0.0001) and eM6C/eSTIC and RAB6-D/STIC (Figure 3(i) and (j)). The trend was less clearly shown when comparing eM6C/4DRT and eM6C/eSTIC settings (Figure 3(k) and (l)). The log-transformed TAPSE Bland–Altman analysis (Figure 3(m) and (n)) showed significant differences between the RAB6-D and eM6C transducers which increased as the value of TAPSE increased. RAB6-D/STIC showed consistently higher values than RAB6-D/4DRT and that difference increased in a negative direction with higher values of TAPSE (p < 0.021) (Figure 3(m)).
One hundred images (50 eM6C and 50 RAB6-D) were randomly selected to be scored including 50 MAPSE and 50 TAPSE measurements. The four-chamber view reconstructions and associated M-mode traces were scored by three observers (S.T., A.W., A.E.) (Table 4). When combining all three areas (M-mode trace, four-chamber view, annuli), the total number of 2’s scored for the RAB6-D/4DRT setting only equated to 32, in contrast to both the eSTIC/eM6C (138) and the RAB6-D/STIC (137). These results are shown in Table 4. Correlation in quality assessment between the three observers varied between features: excellent for M-mode trace (ICC = 0.85; 95% confidence interval (CI) = 0.79–0.90), fair for the annuli (ICC = 0.75; 95% CI = 0.63–0.83) but poor for the four-chamber view (ICC = 0.70; 95% CI = 0.51–0.81). When these three criteria were combined, there was excellent correlation (ICC = 0.82; 95% CI = 0.76–0.87).
Observer scores.
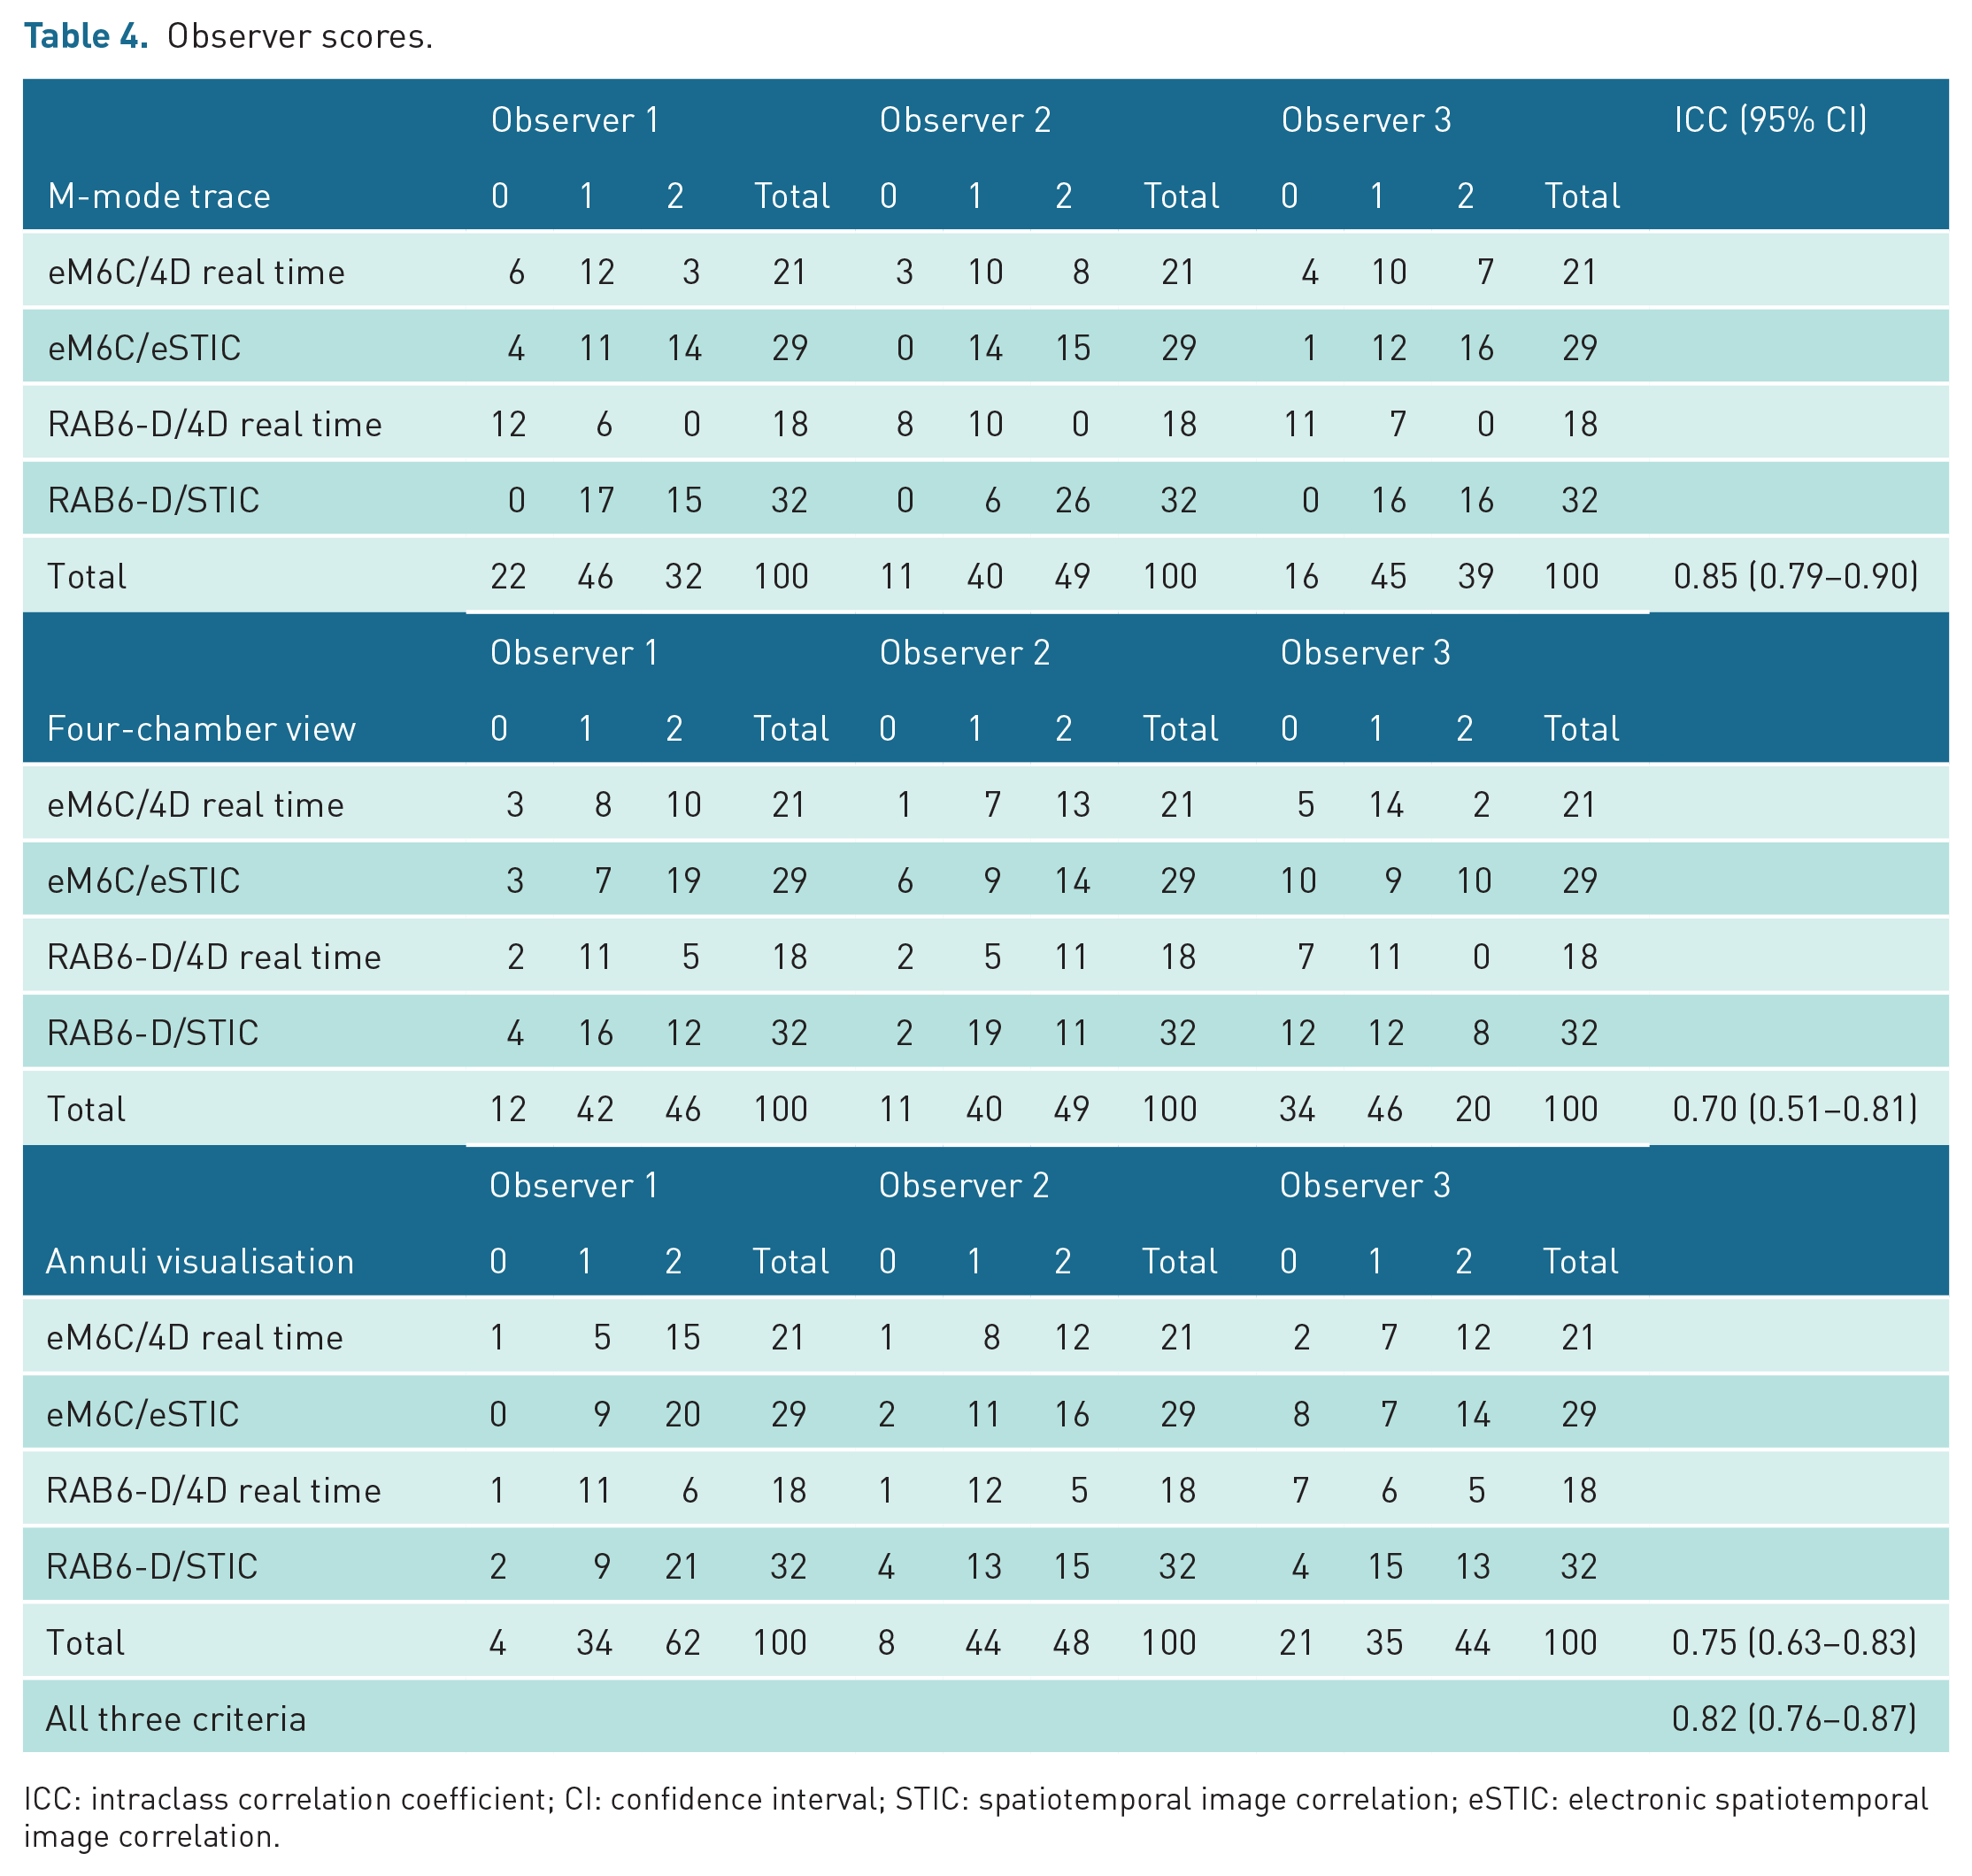
ICC: intraclass correlation coefficient; CI: confidence interval; STIC: spatiotemporal image correlation; eSTIC: electronic spatiotemporal image correlation.
Comparing transducer machine setting combinations, the RAB6-D/4DRT had consistently lower quality scores than the other three settings by all observers with the M-mode trace not receiving a single score of ‘2’ by any observer. Observer three did not score a 2 for any of the four-chamber view images with this setting, with Observer 1 also scoring their images with very few maximal scores (two points). Repeatability was evaluated for the last 10 participants who had TAPSE data for all four settings. One hundred and twenty images were reconstructed into a four-chamber view, and a TAPSE measurement was recorded at the most optimum position as determined by the examiner (S.T.). Repeatability was poor for the RAB6-D/4DRT (ICC = 0.57), good for the eM6C/eSTIC (ICC = 0.77) and the eM6C/4DRT (ICC = 0.80) and highest for the RAB6-D/STIC (ICC = 0.85).
Discussion
High-resolution ultrasound has long been acknowledged as crucial for image visualisation and correct diagnosis of pathology, 22 with technological advances continually advancing this ability. We evaluated both conventional and novel 4D matrix transducers using common acquisition settings looking at absolute TAPSE/MAPSE measurement values, visual image quality (anatomical appearance) and repeatability. We recruited fetuses with a relatively broad gestational range as our intention was to compare transducers and not make specific inferences regarding gestations. Our primary finding from this work was that there was poor reproducibility of measurements using differing transducers and settings.
We found a disparity in absolute measurements with RAB6-D/STIC setting having the highest absolute values followed by the eM6C/eSTIC, and then lowest values using the 4DRT settings on both transducers for both TAPSE and MAPSE measurements. The differences in these values were inconsistent as shown by the Bland–Altman plots. The trend of the STIC and eSTIC means in the Bland–Altman plots showed higher values than the 4DRT setting. It cannot be determined by this study the reason for these differences; however, the authors believe it may relate to the slower frame rate of the 4DRT resulting in a poorer quality image, as demonstrated by the low observer scores using the 4DRT setting, consistent with the literature.3,5,7 The larger TAPSE/MAPSE measurements using the STIC setting may be due to a reliability issue of the RAB6-D/STIC combination as indicated as there was a significant mean difference for TAPSE (1.2 mm).
The eM6C/eSTIC scored highest with regard to four-chamber view image quality, although TAPSE measurement using the RAB6-D/STIC combination was the most repeatable, indicating that subjective quality does not necessarily correlate with repeatability. While previous studies indicated eSTIC superiority over STIC regarding quality of the resultant four-chamber image, our observer scores which also included an M-mode trace comparison did not indicate a significant difference.3,5,7 Thus, it may be possible to have an easily measurable M-mode trace that is associated with an imperfect four-chamber image; we believe this to have clinical relevance.
These findings indicate that it is important for authors to indicate which scanning combination (including machine model, transducer type and settings) is used to provide reference ranges for M-mode measurements because of the disparity and inconsistency in absolute measurements. At 25-week gestation, average MAPSE measurement is 3.7 mm and 5th centile is 2.5 mm, 10 and for TAPSE, the 5th and 50th percentiles at this gestation are 4.1 and 5.5 mm. 9 When differences between ‘normal’ and ‘pathological’ values may be close to the differences shown in quoted ‘normal ranges’ from differing research groups, this could have significant clinical implications.12,13 Subjective differences in image quality may not correlate with repeatability and therefore utility of the measurement in 4D volumes, and it may be that the classical 2D M-mode measurement is of most utility. In addition, information should also include the use of real-time or 4D post-processing tools for acquisition of the measurements.
Limitations of our study include the higher number of volumes with the eM6C/eSTIC combination, likely reflecting the associated shorter acquisition times and improved image quality, as well as the relatively small number of subjects 10 used for the repeatability study. Therefore, there is a need for a larger study to avoid potential bias.
As functional fetal cardiology gains increasing importance, and novel Doppler parameters are used to evaluate fetal wellbeing, it is important that aspects of image quality and repeatability are considered along with subjective image evaluation. There may be variation in apparent ‘normal ranges’ because of equipment or setting selection that need to be clearly stated in future publications. Further research comparing the MAPSE and TAPSE differences using 4D view and real time is needed to ensure standardised reference ranges are used in all circumstances.
Footnotes
Acknowledgements
Statistical advice was provided by Dr Nancy Briggs.
Contributors
S.T. produced the measurements, analysed the data and made a substantial contribution to the writing of the manuscript. A.F. designed the research, acquired and assisted with the interpretation of data. M.C., A.E. and G.S. assisted with revising the manuscript. A.W. designed the research and assisted with revising the manuscript.
Declaration of conflicting interests
The author(s) declared no potential conflicts of interest with respect to the research, authorship and/or publication of this article.
Funding
The author(s) disclosed receipt of the following financial support for the research, authorship and/or publication of this article: This project was supported by an eM6C probe loan from GE Healthcare (Zipf, Austria).
Ethics approval
Written and informed approval through the South Eastern Sydney Local Health District Human Research Ethics Committee (HREC) (SESLHD ref 2020/ETHO2517).
Informed consent
Written informed consent was obtained from the patient for publishing the case details and images.
Guarantor
S.T. is the guarantor of this article.