
Abstract
This study evaluates the indoor thermal performance and qualitative humidity trends of social housing buildings constructed with thin reinforced concrete walls in a humid tropical climate. A hybrid methodology combining dynamic simulations using DesignBuilder and field measurements using Testo 605i and EasyLog WiFi devices was applied to a four-story residential building in Santo Domingo, Dominican Republic. Operative temperature and relative humidity of the base model (BM) were compared against three passive intervention strategies (M1: EPS insulation + double glazing; M2: EPS insulation + double glazing + green roof; M3: mineral wool insulation + double glazing + green roof). Results reveal that the BM exhibited high operative temperatures (up to 34°C) and extreme relative humidity (80%–99%), exceeding ASHRAE 55 comfort limits. Passive strategies reduced daily thermal variability by up to 6.8%, but humidity control remained limited, with only marginal improvements (<10%). Simulated relative humidity results were interpreted as trend indicators within the modeling scope adopted. Stratification effects were identified, with lower floors experiencing higher humidity and upper floors higher temperature peaks. The findings highlight the vulnerability of thin concrete wall housing in tropical climates and the limited role of envelope-only passive measures for humidity regulation. This study provides empirical evidence for the need to integrate passive and hybrid solutions, offering valuable insights for building codes and housing policies in tropical regions.
Keywords
Introduction
Human activities, mainly through greenhouse gas emissions, have unequivocally caused global warming, with the global surface temperature reaching 1.1°C above 1850–1900 levels during the period 2011–2020 (Core Writing Team et al., 2023). Global warming affects all areas of consumption and production, while urbanization processes play a significant role in shaping the built environment. This transformation is driven by the accelerated vertical growth of cities, resulting from population increases projected to peak at approximately 10.3 billion people by the mid-2080s (United Nations, 2024). Additionally, metropolitan areas are expected to absorb nearly 1 billion new inhabitants over the next 15 years (United Nations, 2020). This trend has increased pressure on housing systems, generating a significant housing deficit.
In response to this demand, the construction sector has adopted low-cost and rapid-assembly solutions based on industrialized technologies. Among them, thin reinforced-concrete wall systems using modular formwork have gained relevance in Latin America and the Caribbean because of their construction speed and economic feasibility (Blandon et al., 2018; Blandón and Bonett, 2020). Previous studies on these systems have mainly focused on structural and seismic performance, while their indoor environmental behavior remains insufficiently documented (Cuesvas et al., 2022; Ortega et al., 2023; Santa María et al., 2017).
From the thermal perspective, thin-wall systems often present limited thermoacoustic performance due to their low thermal mass and reduced insulating capacity (Choong et al., 2023; Danny Bravo-Martínez et al., 2023). Thermal mass is recognized as a key parameter for damping indoor temperature fluctuations and delaying heat transfer through the envelope (del Coz-Díaz et al., 2021; Soret et al., 2021). In tropical climates, insufficient thermal inertia may lead to rapid indoor overheating and increased dependence on active cooling systems.
Several passive strategies have been reported to mitigate overheating in warm climates. Green roofs and living walls can reduce solar heat gains and surface temperatures (Ruiz-Valero et al., 2022), thermal insulation can improve envelope resistance and indoor stability (García Frómeta et al., 2019; Raimundo et al., 2023), improved glazing systems can reduce solar transmission (Kheybari et al., 2025), and cross-ventilation can enhance heat dissipation and occupant comfort (García et al., 2019; Palomo Amores et al., 2025). However, many of these studies were developed under controlled conditions or in buildings with construction systems different from thin reinforced-concrete walls. Therefore, their direct applicability to humid tropical social housing remains uncertain.
Unlike higher-mass construction systems, thin reinforced-concrete walls have limited capacity to damp both thermal oscillations and moisture variations. Their low porosity and reduced hygric inertia diminish their ability to store and release water vapor, leading to rapid increases in indoor humidity in response to changes in outdoor conditions. This behavior is especially critical in warm-humid climates, where high relative humidity is persistent and constitutes a key factor for comfort, health, and material durability.
Despite advances in building performance research, significant gaps remain in the literature. Most available studies focus on temperate or cold climates, or on buildings constructed with masonry or lightweight systems. Few investigations combine in situ monitoring with simulation methods in dwellings built with thin reinforced-concrete walls under tropical conditions. In addition, limited evidence is available regarding the vertical stratification of temperature and humidity in multi-story social housing buildings, despite its relevance for indoor comfort and ventilation performance.
Another challenge is the limited availability of experimental data from occupied tropical social housing units, which restricts the calibration and interpretation of thermo-energetic simulation models. For this reason, hybrid approaches that combine field monitoring with dynamic simulation are valuable to better represent real occupancy conditions and local climatic specificities.
Accordingly, this study aims to evaluate the indoor thermal behavior and qualitative humidity trends of a social housing building constructed with thin reinforced-concrete walls in Santo Domingo, Dominican Republic. The specific contributions are: (1) field-informed assessment of the base case under real occupancy conditions, (2) analysis of vertical temperature and humidity stratification across dwelling levels, and (3) comparative evaluation of three passive retrofit strategies using a hybrid simulation–measurement approach. These findings provide empirical evidence to support design decisions and public policy guidelines for improving thermal resilience and comfort in tropical social housing.
Methodology
The methodology employed in this study was structured into four stages: analysis of the context and study model, thermal simulations of the base model, in situ data collection of comfort variables, and simulations of improvements to the building elements. This methodology is schematically summarized in Figure 1.
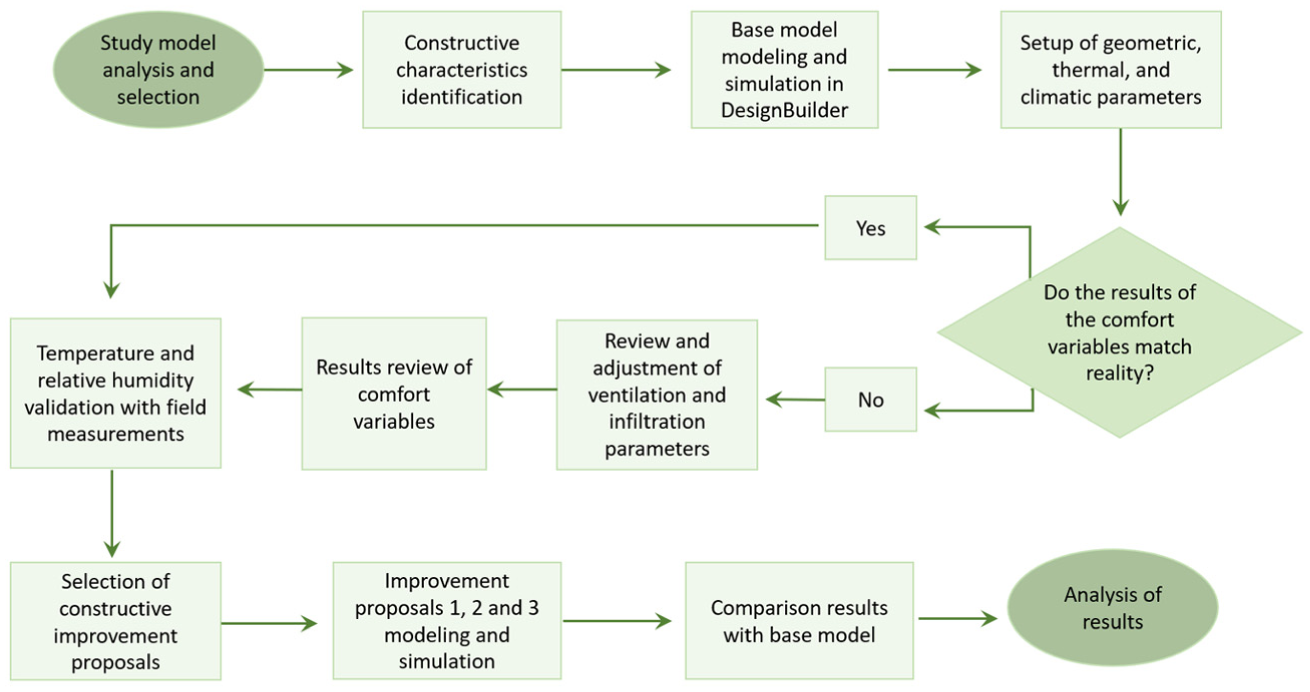
Schematic diagram of the methodological process used in the research.
Dominican Republic is located in the Caribbean, south of the Tropic of Cancer, within the Greater Antilles archipelago. Its geographic coordinates range between 17°36’ and 19°58’ north latitude, and 68°19’ and 72°01’ west longitude (Oficina Nacional de Estadística, 2024). Due to its location, the country is frequently affected by meteorological phenomena such as troughs, tropical waves, and low-pressure systems, especially during the cyclone season (June–November). The climate is classified as humid tropical according to the Köppen–Geiger classification (Beck et al., 2018). Between 2018 and 2022, meteorological stations recorded an average maximum temperature of 30.84°C and a minimum of 22.16°C (Oficina Nacional de Estadísticas, 2023a). The study was conducted in Greater Santo Domingo, in the southern part of the country, facing the Caribbean Sea. This is the most populous region, with 3,798,698 inhabitants according to the 10th National Census (Oficina Nacional de Estadísticas, 2023b).
Geographic location and characteristics of the study area
To fulfill the main objective (aim) of this investigation, the selected case study corresponds to a building typology based on monolithic construction with modular single-portable formwork (aluminum formwork panels). This method, which employs reinforced concrete thin walls, has experienced significant growth in its application during the last decades, although there exist a limited amount of studies that analyze it deeply.
Study case and model description
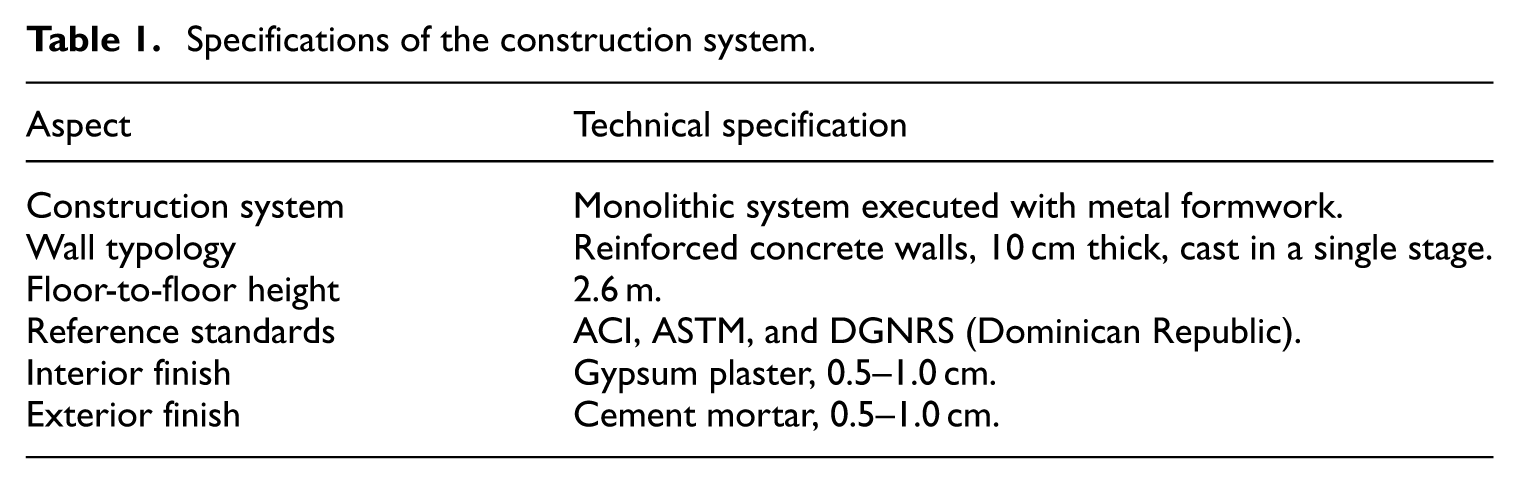
The building analyzed corresponds to a four-story multifamily housing project located in a high-density urban area of Santo Domingo. The specifications of the construction system are detailed in Table 1. The building is characterized by direct solar exposure and limited natural ventilation conditions due to the proximity of adjacent structures. Figure 2 shows the architectural floor plan, the cross-section, and an exterior view.
Specifications of the construction system.
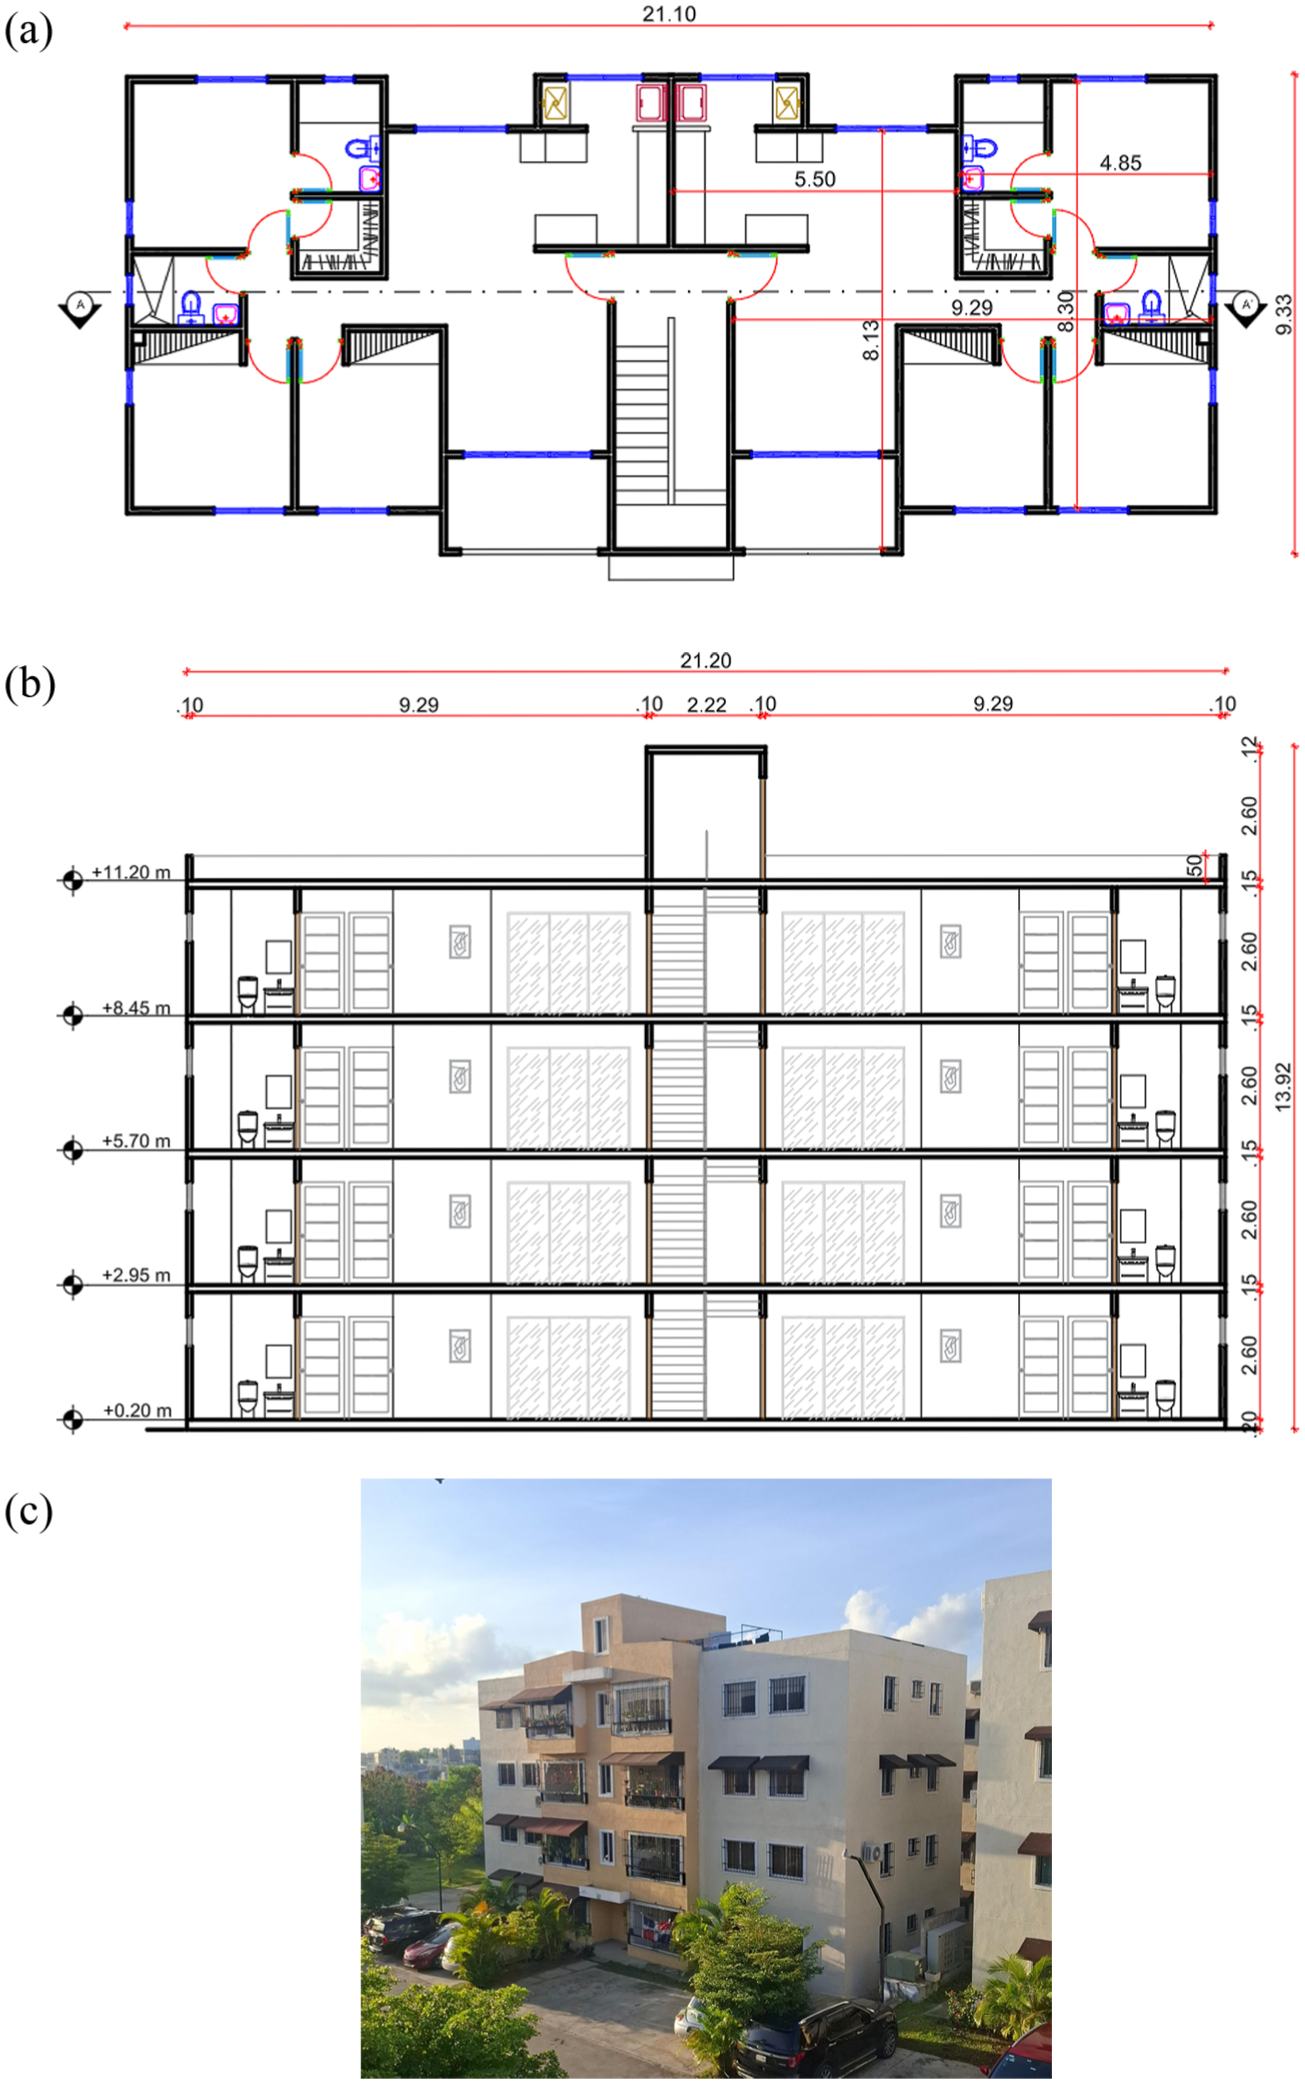
Building typology: (a) architectural floor plan, (b) cross-section, and (c) exterior view.
These characteristics, added to the thinness of the walls and the absence of thermal insulation, negatively affect the building’s thermal performance (Rodriguez et al., 2019), making it a representative case for evaluating passive strategies to improve thermal comfort in tropical climates.
Simulation parameters
Thermal simulations were carried out using DesignBuilder v.7.0.2.006 (Design Builder, 2022) and Meteonorm v.5.1 (Meteonorm, 2025) were employed for the thermal simulations and climatic data generation. DesignBuilder is a widely recognized tool for analyzing the thermal and energy performance of buildings. Meteonorm was used to generate the EPW climate file based on interpolated data from nearby meteorological stations. This type of climatic input is considered appropriate for comparative building simulations and representative annual analyses. It was not intended to reproduce the exact hourly microclimatic conditions of the monitored week. Therefore, the measured data was used to assess consistency of indoor trends rather than to perform strict hour-by-hour calibration. Comparison with ONAMET records (2018–2022) showed deviations below 0.7°C and 4% relative humidity, supporting the suitability of the climatic file for the scope of this study.
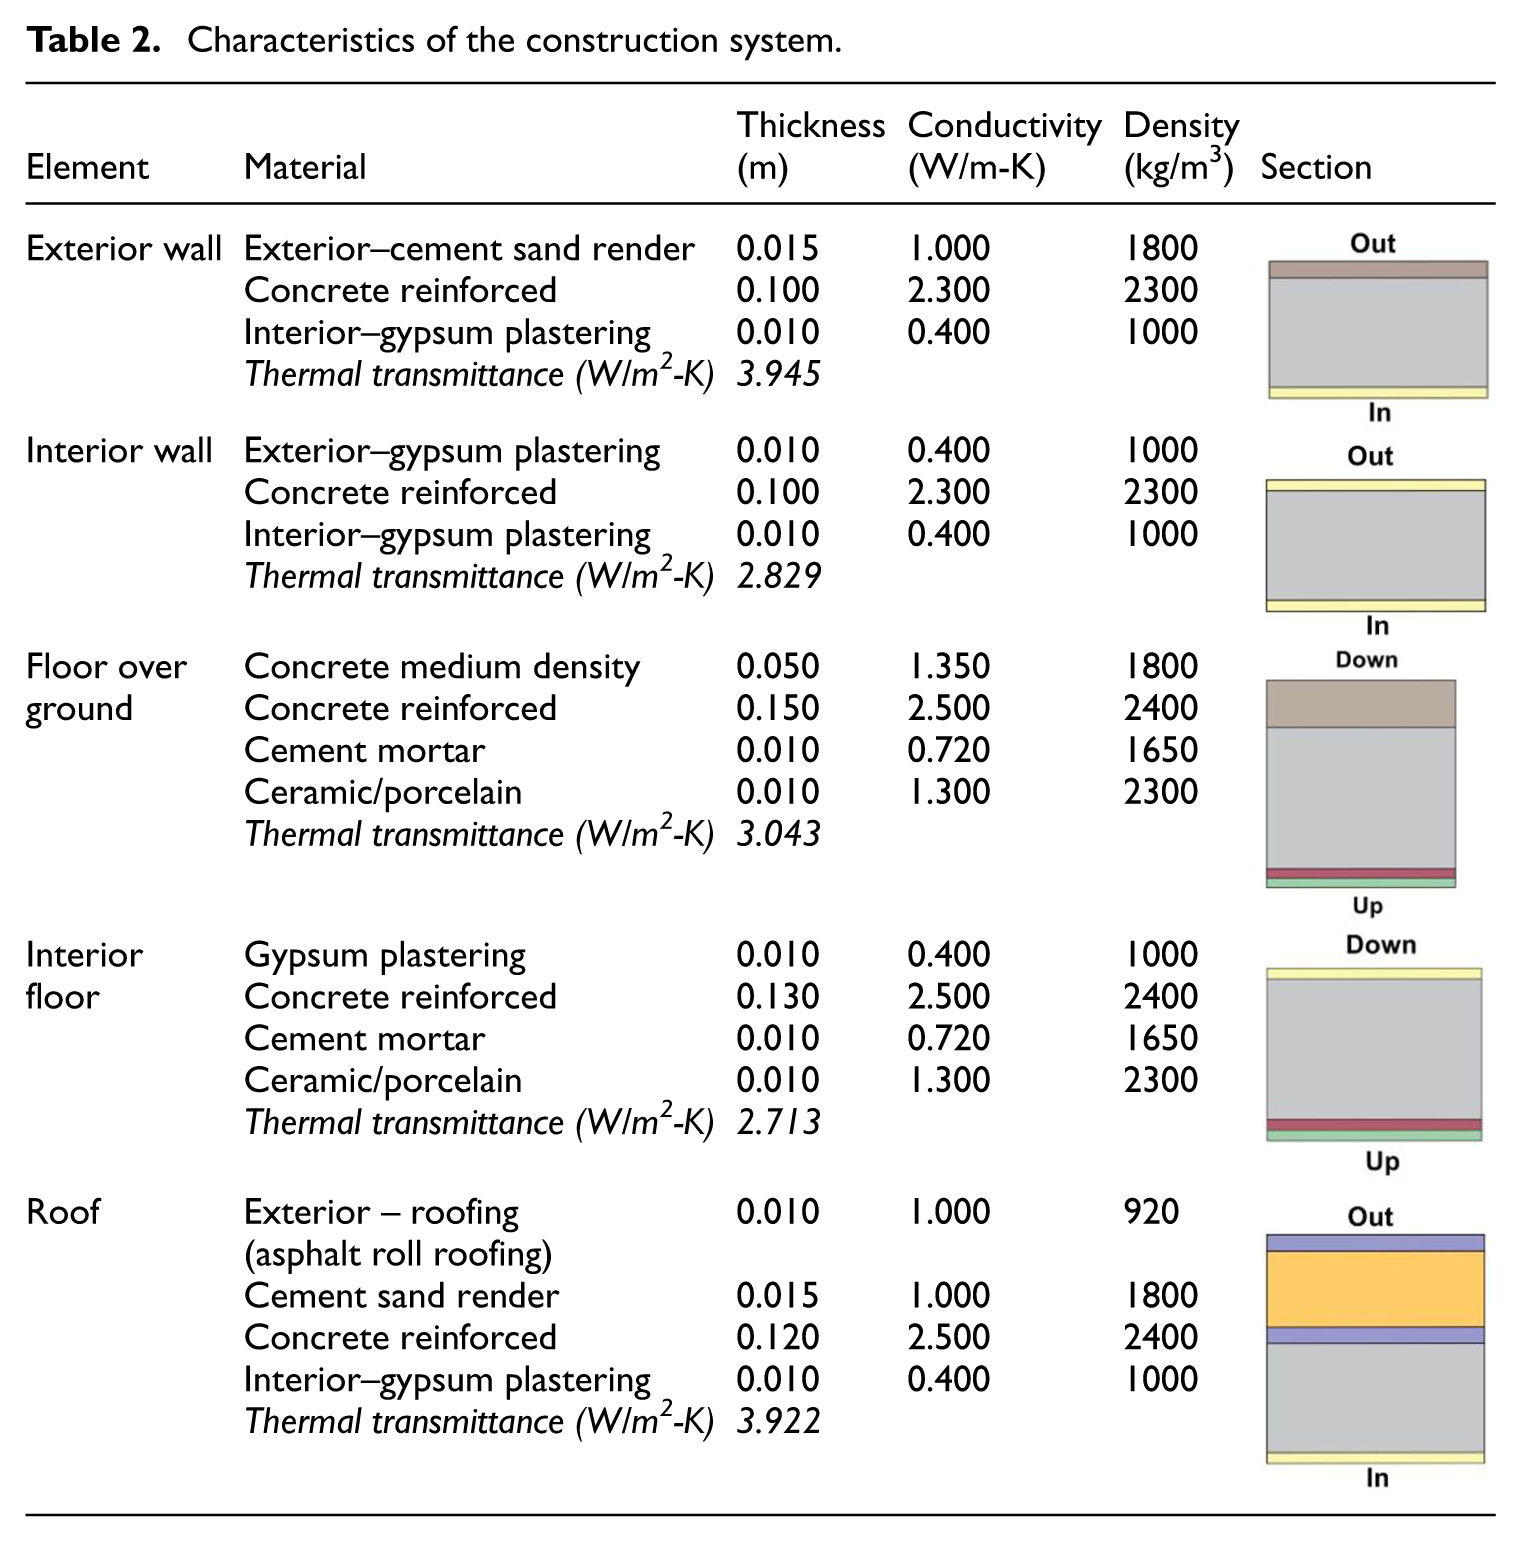
The model was configured according to the ASHRAE 55 Standard (American Society Of Heating, 2020), considering climate zone 1A and a representative scenario of an urban dwelling. The thermal properties and construction characteristics of the simulated building are summarized in Table 2. Only natural ventilation was modeled as the environmental conditioning strategy, consistent with the typical use of the building.
Characteristics of the construction system.
Indoor humidity in the present DesignBuilder model was calculated using the zone air moisture balance routine available in EnergyPlus, considering outdoor air exchange through natural ventilation/infiltration and internal latent gains from occupants. In this context, the approach corresponds to a standard thermo-energetic model and does not include a couple Heat-Air-Moisture (HAM) scheme; therefore, moisture transport through envelope materials (vapor diffusion, sorption/desorption, and hygroscopic buffering) was not represented in the model.
To analyze exclusively the passive behavior of the building, the simulation was configured with constant occupancy with simplified latent gains from occupants only, excluding scheduled household moisture sources such as cooking, laundry, and bathing. This decision reduced the influence of operational factors and allowed thermal differences to be attributed primarily to the properties of the envelope. The general configuration of the model and its simulation conditions are summarized in Table 3. It is important to note that, since the exact manufacturer specifications for the glazing were not available, standard values for clear single glazing were adopted based on the default parameters in DesignBuilder and ISO 9050. The parameters Solar Heat Gain Coefficient (SHGC = 0.63), Solar Transmittance (τsol = 0.75), and Visible Transmittance (VT = 0.78) were used to model solar radiation transmission through the facade.
Parameters considered in the simulation.
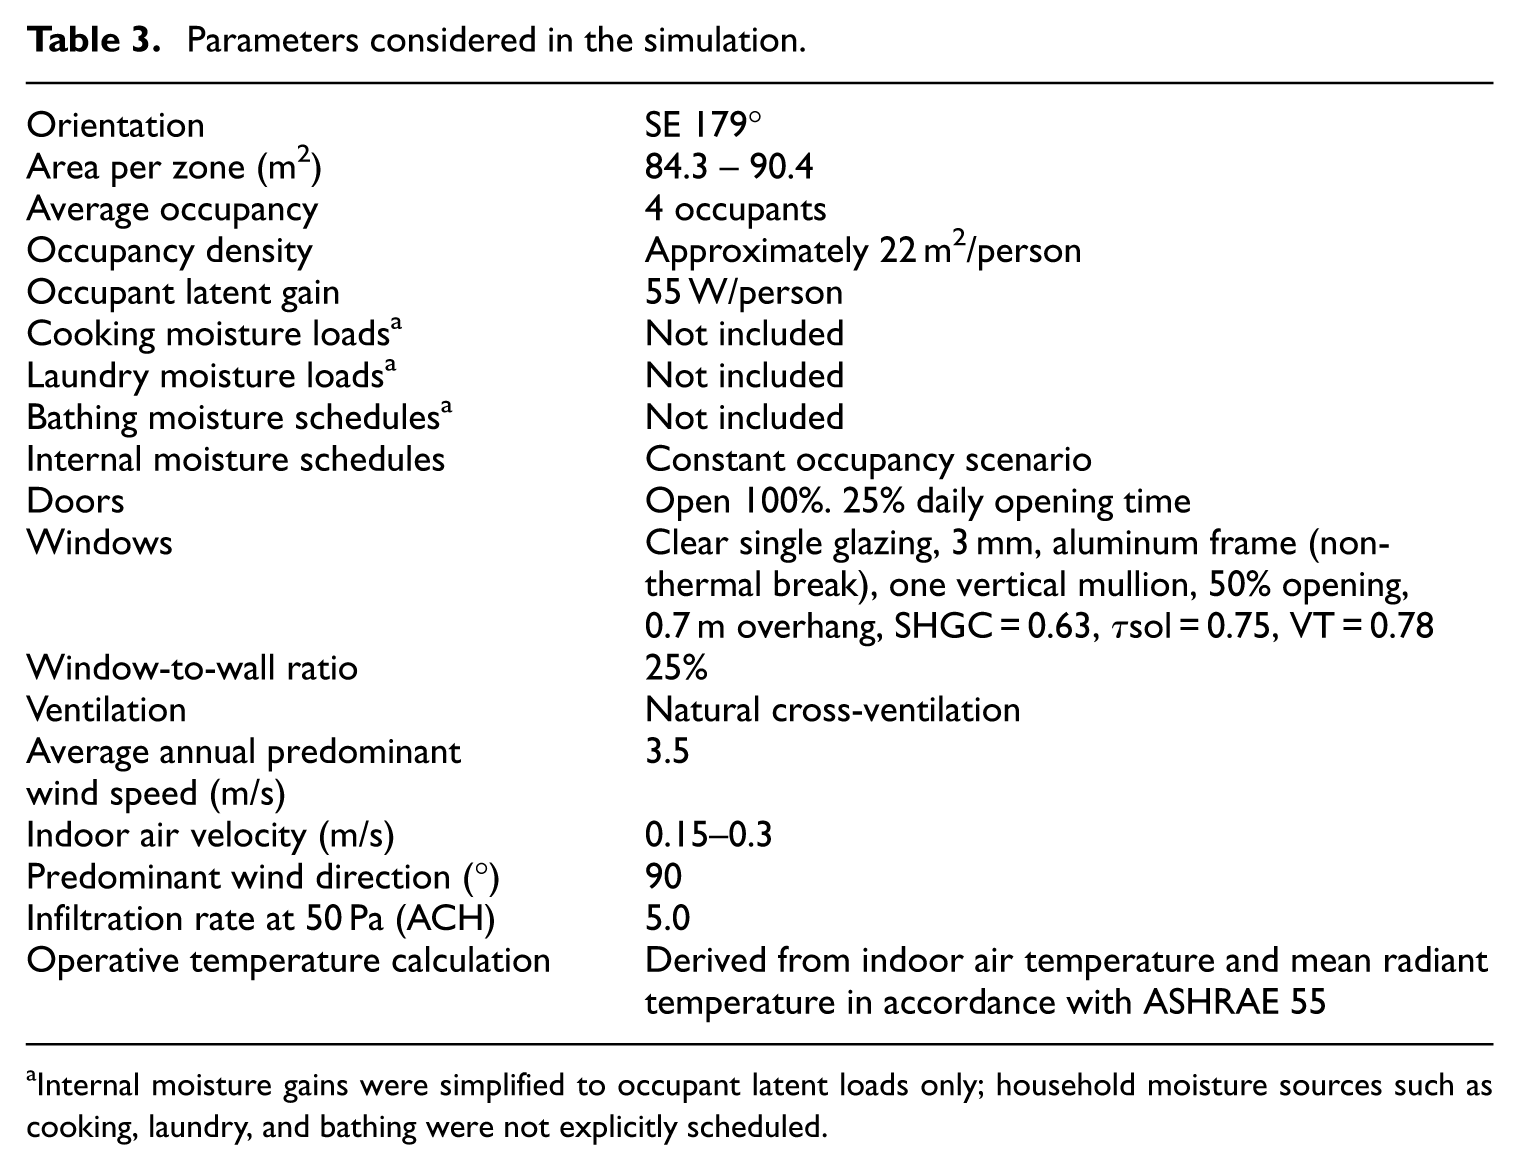
Internal moisture gains were simplified to occupant latent loads only; household moisture sources such as cooking, laundry, and bathing were not explicitly scheduled.
These construction and environmental conditions served as the basis for the development of the model, with the aim of assessing its thermal performance and exploring potential improvements through passive strategies. Operative temperature was used as an indicator of indoor thermal conditions, while humidity was analyzed independently through measured and simulated relative humidity trends. Based on this model, different simulation scenarios were defined to analyze the impact of non-invasive interventions on indoor temperature and thermal comfort in a tropical urban context.
Verification of the base model (BM)
To compare the trends obtained through simulation, in situ environmental measurements were conducted over a 7-day period. A Testo 605i thermohygrometer (Testo, 2025) was used to record spot measurements of temperature and relative humidity, and an EasyLog WiFi data logger (TC Direct, 2025), was used for continuous monitoring. The sensors were installed in different locations within a dwelling on level 3 (see Figure 3), under real-use conditions and without mechanical cooling.
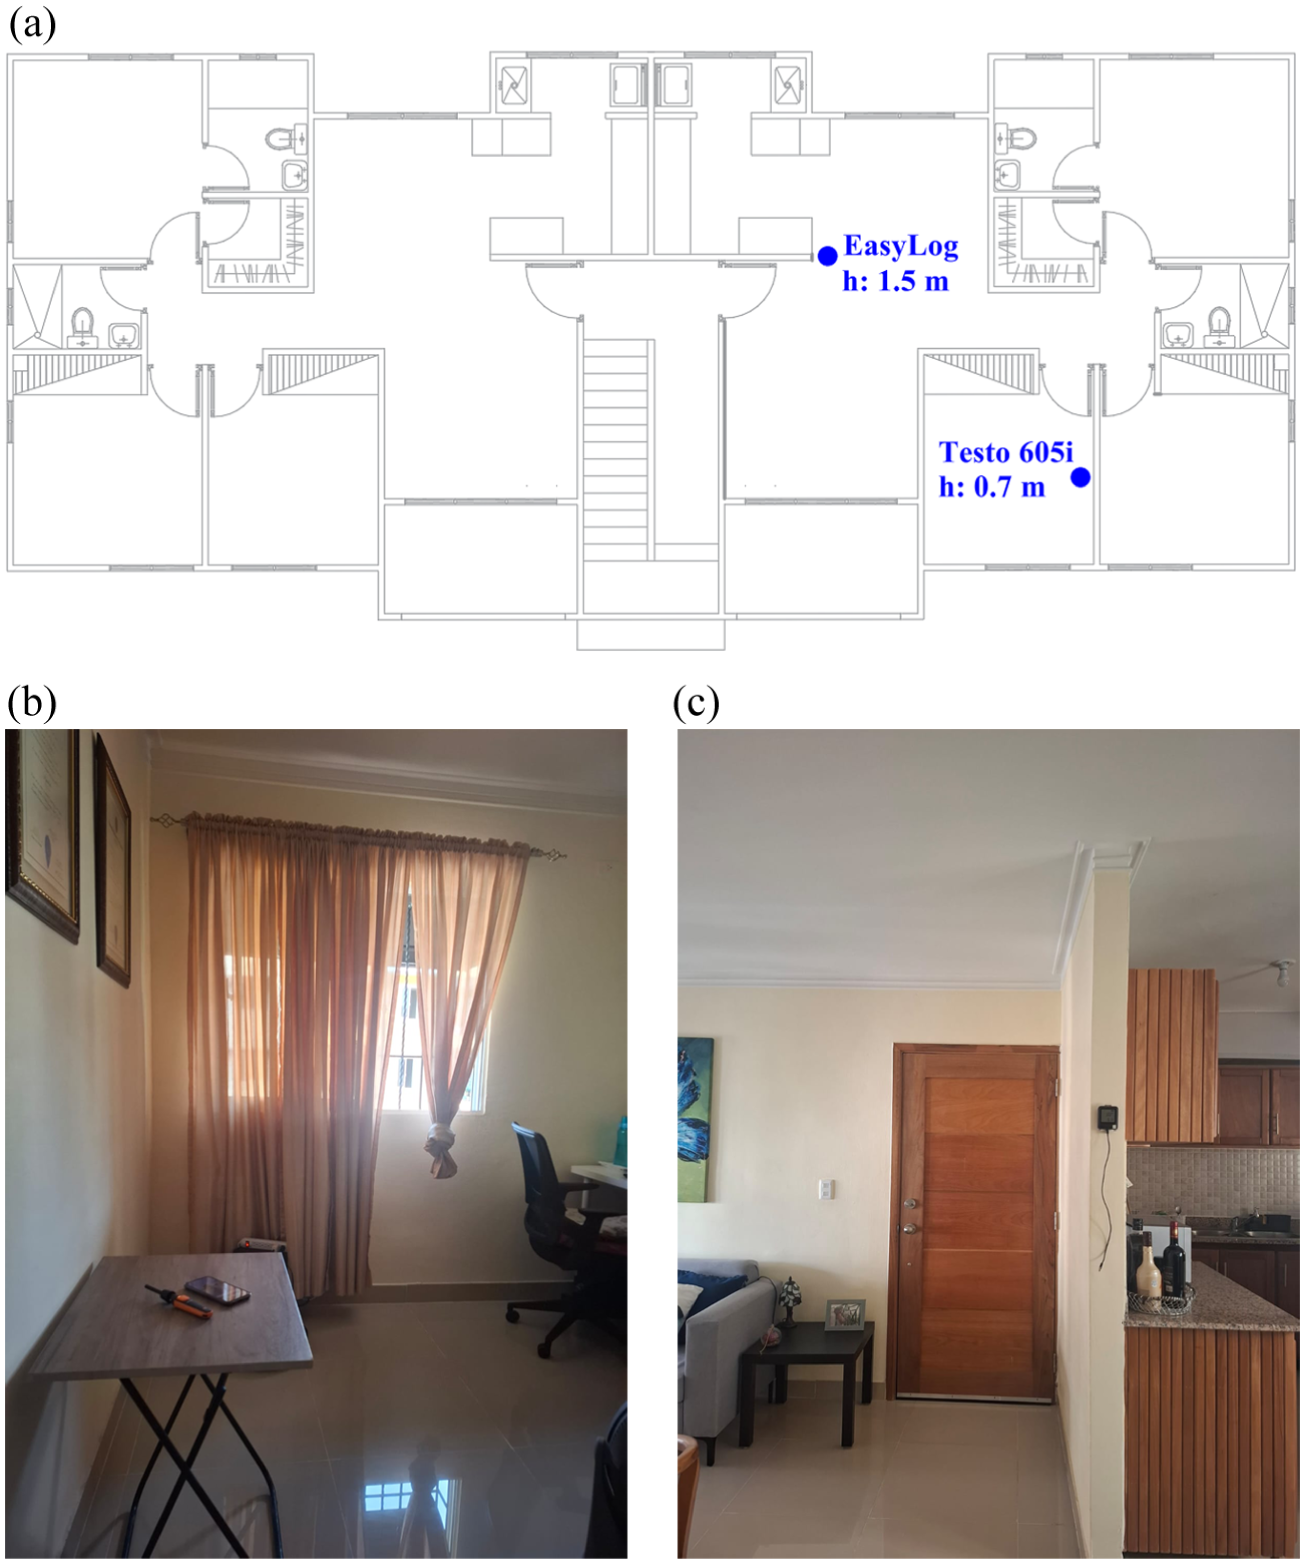
Experimental work: (a) sensor locations, (b) Testo 605i, and (c) EasyLog WiFi.
The measurements reflect typical occupancy patterns, with four occupants following defined departure and return schedules. The dwelling remains unoccupied from 6:30 to 19:30 Monday through Friday, corresponding to 54% of the day, and on Saturdays from 8:00 to 14:00, corresponding to 20.8%. Regarding ventilation habits, 80% of the windows remain 50% open during 75% of the day. This information was used as contextual reference to interpret the simulated results and to compare them with the thermal behavior observed under real conditions.
Simulations scenarios
To validate the thermal comfort optimization models, thermal simulations were carried out. The previously characterized base model (BM) was used as the starting point to assess the impact of three passive strategies. These interventions included solutions aimed at reducing internal thermal loads and improving comfort conditions without incorporating active air-conditioning systems. In all intervention proposals, the base model was maintained without structural alterations, since its construction method does not allow for modifications.
The simulation model is considered a constant occupation of 4–5 people per unit, with internal loads by default and without usage, illumination or equipment schedule variation. This simplified approach allows us to isolate the passive strategies’ effect over the thermal behavior, although it’s known to be a limitation in front of an integral energetic simulation. It’s recommended to incorporate dynamic profiles in future studies for a thorough analysis.
Within this framework, the model corresponds to a standard thermo-energetic scheme without coupled Heat–Air–Moisture (HAM) modeling. Accordingly, relative humidity is calculated from indoor air conditions rather than from vapor transport through materials or hygroscopic storage processes. The discrepancies between measured and simulated relative humidity are primarily associated with deviations in simulated indoor temperature, while simplifications in the adopted moisture balance model may contribute secondarily. Therefore, relative humidity is interpreted as a qualitative trend indicator rather than as a strict quantitative validation parameter.
Intervention proposal 1 (M1)
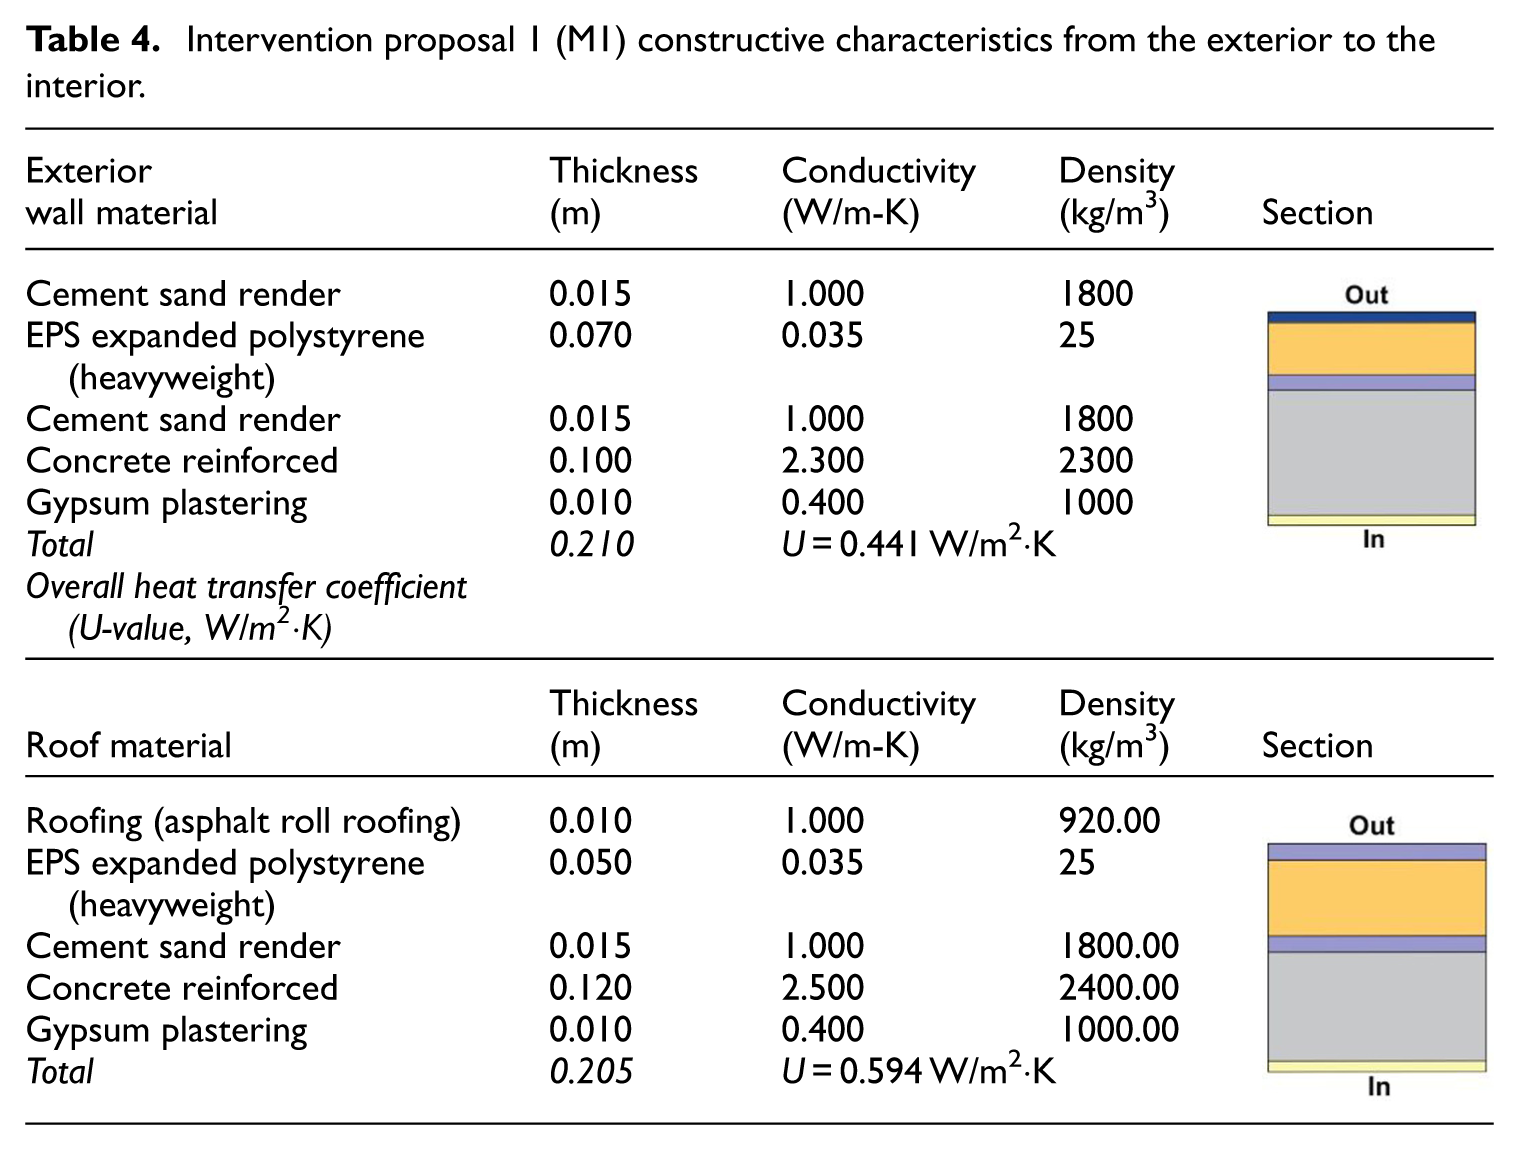
Expanded polystyrene (EPS) was used as an insulating material in exterior walls and roof. 6 mm double glazing with a 6 mm air chamber was used in the windows. Its composition is presented in Table 4.
Intervention proposal 1 (M1) constructive characteristics from the exterior to the interior.
Intervention proposal 2 (M2)
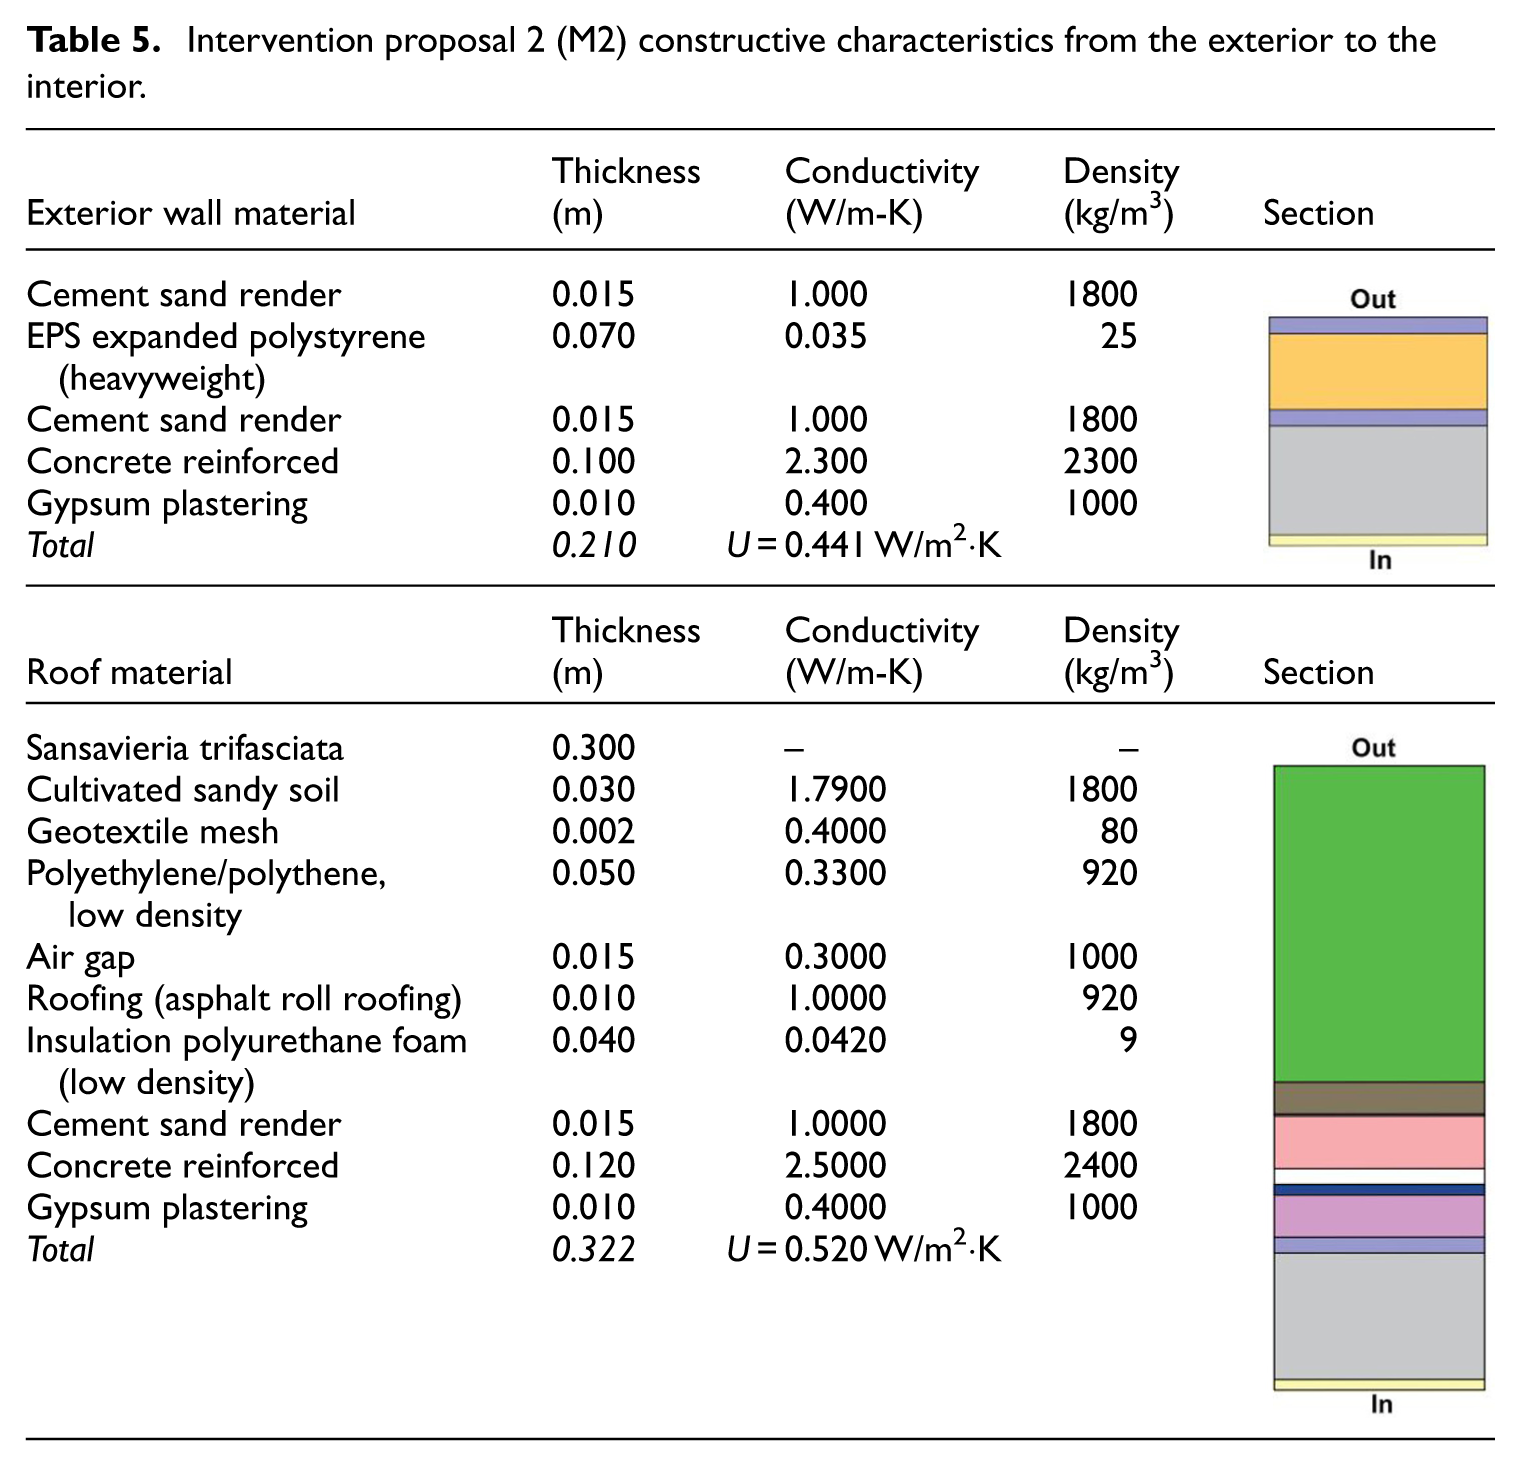
The exterior walls with EPS insulation and the double-glazed windows with an air cavity were maintained. A green roof was proposed for the roof assembly, and its composition is presented in Table 5. The evapotranspiration of the green roof was incorporated into the model through an equivalent increase in the surface convective coefficient and latent heat flux, determined by the moisture content of the substrate according to the simplified algorithm implemented in DesignBuilder.
Intervention proposal 2 (M2) constructive characteristics from the exterior to the interior.
Intervention proposal 3 (M3)
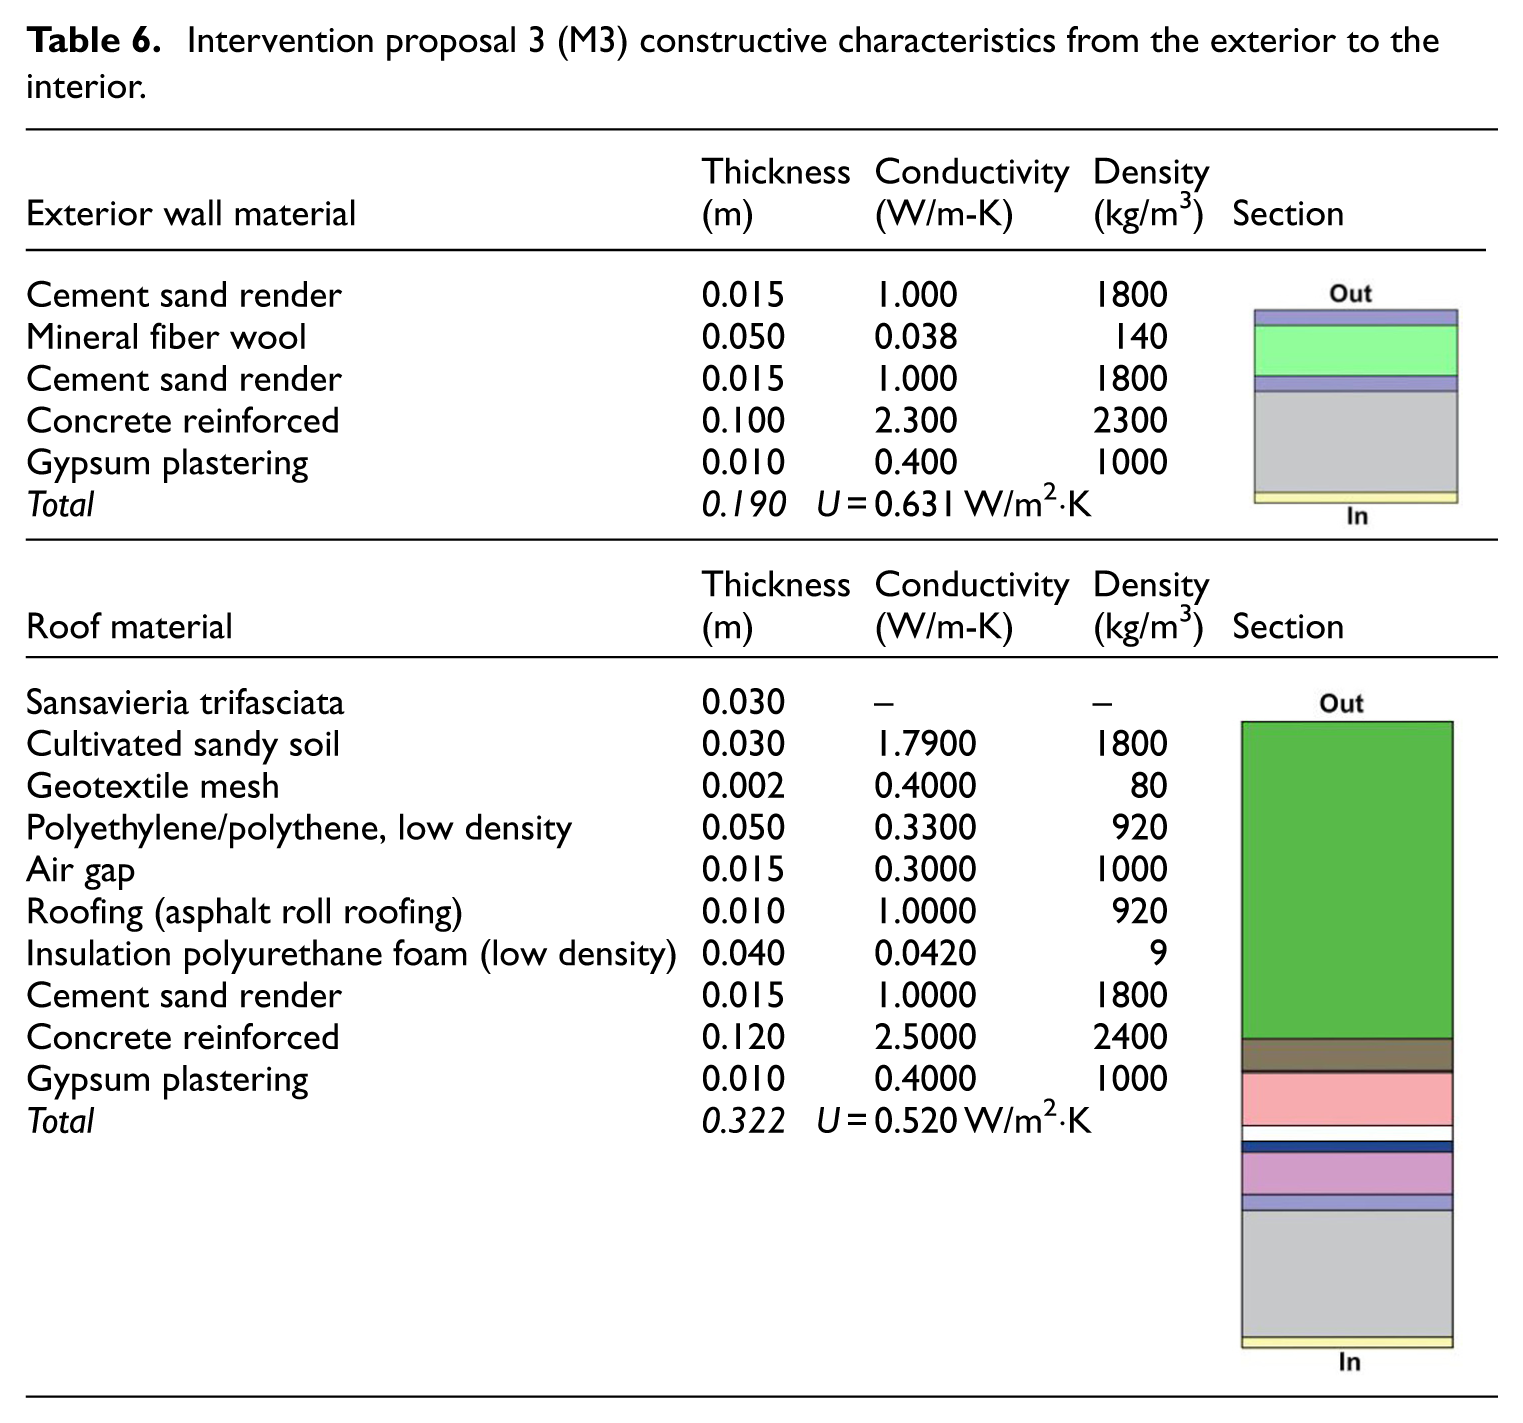
Mineral wool was used as insulation in the exterior walls. For the glazing of the windows, double 6 mm glass with an air gap was used. On the roof, a green roof system was implemented. Its composition is presented in Table 6.
Intervention proposal 3 (M3) constructive characteristics from the exterior to the interior.
Results and discussion
The results presented here are obtained from the analysis of the BM in a typical summer week. The operative temperature was validated through the experimental data collected on the third floor of the studied building, while relative humidity was used as a comparative trend indicator within the modeling scope adopted. With the initial results, it proposes three enhancement scenarios focused on envelope optimization. In each scenario it was considered the passive intervention in the exterior wall, roof and windows glazing. The aim of these simulations was to assess the impact of each strategy on the general thermal performance of the building.
Base model (BM) verification
With the objective to analyze the indoor behavior of the key parameters that influence the BM’s thermal comfort, a specific assessment through DesignBuilder simulation was undertaken. Operative temperature and relative humidity were examined from June 30 to July 6, a period selected for representing one of the hottest weeks of the year in the study location.
The outdoor climatic conditions considered in the simulation were obtained from Meteonorm database. The hygrothermal response of the model shows that indoor air temperature and relative humidity are directly coupled to outdoor conditions (see Figure 4(a)). In the analyzed period, the simulation operative temperature in indoor spaces ranged from 27.0°C to 30.4°C, while indoor relative humidity remained between 80.8% and 98.8%.
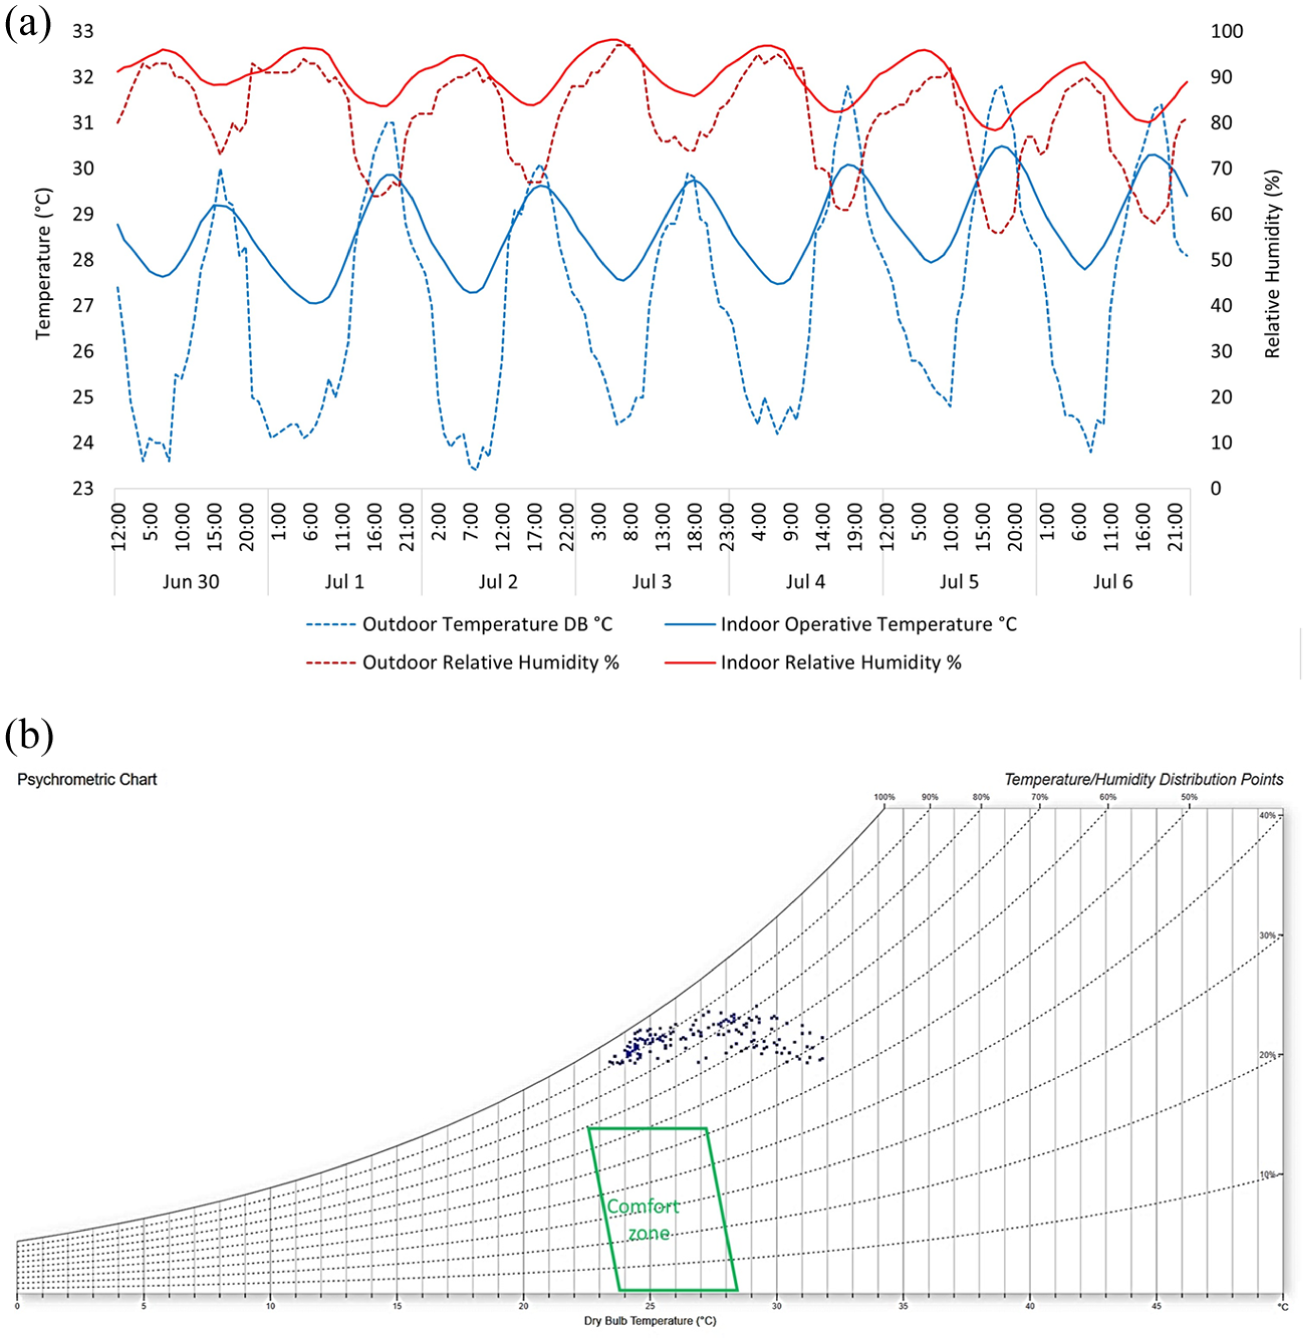
Key parameters affecting the hygrothermal comfort: (a) outdoor and indoor operative temperature and relative humidity and (b) psychometric chart.
The results indicate that both parameters are outside the comfort zone recommended by ASHRAE 55 Standard under the adaptive model for naturally ventilated buildings in tropical climates (see Figure 4(b)), prepared with the Psychrometric Chart (Marsh, 2018). The range oscillates between 27°C and 30°C for temperature and, 40% and 70% for relative humidity. These findings highlight that indoor conditions are unfavorable for occupants’ hygrothermal comfort and reinforce the need to implement improvement strategies.
It was not possible to validate the indoor conditions using vapor pressure or absolute humidity because the instruments employed (Testo 605i and EasyLog WiFi) record only relative humidity and temperature. In addition, the model implemented in DesignBuilder does not incorporate a hygrothermal coupling scheme (HAM), and therefore it cannot simulate sorption, desorption, or moisture storage processes within materials. This limitation prevents establishing a direct correspondence between simulated humidity and measured humidity in terms of absolute vapor content.
To compare the results of the BM, in situ measurements were conducted using two devices: a Testo 605i thermo-hygrometer and an EasyLog WiFi data logger. The data recorded with both devices, compared to the values obtained from the simulation, can be seen in Figure 5(a) for temperature and Figure 5(b) for relative humidity.
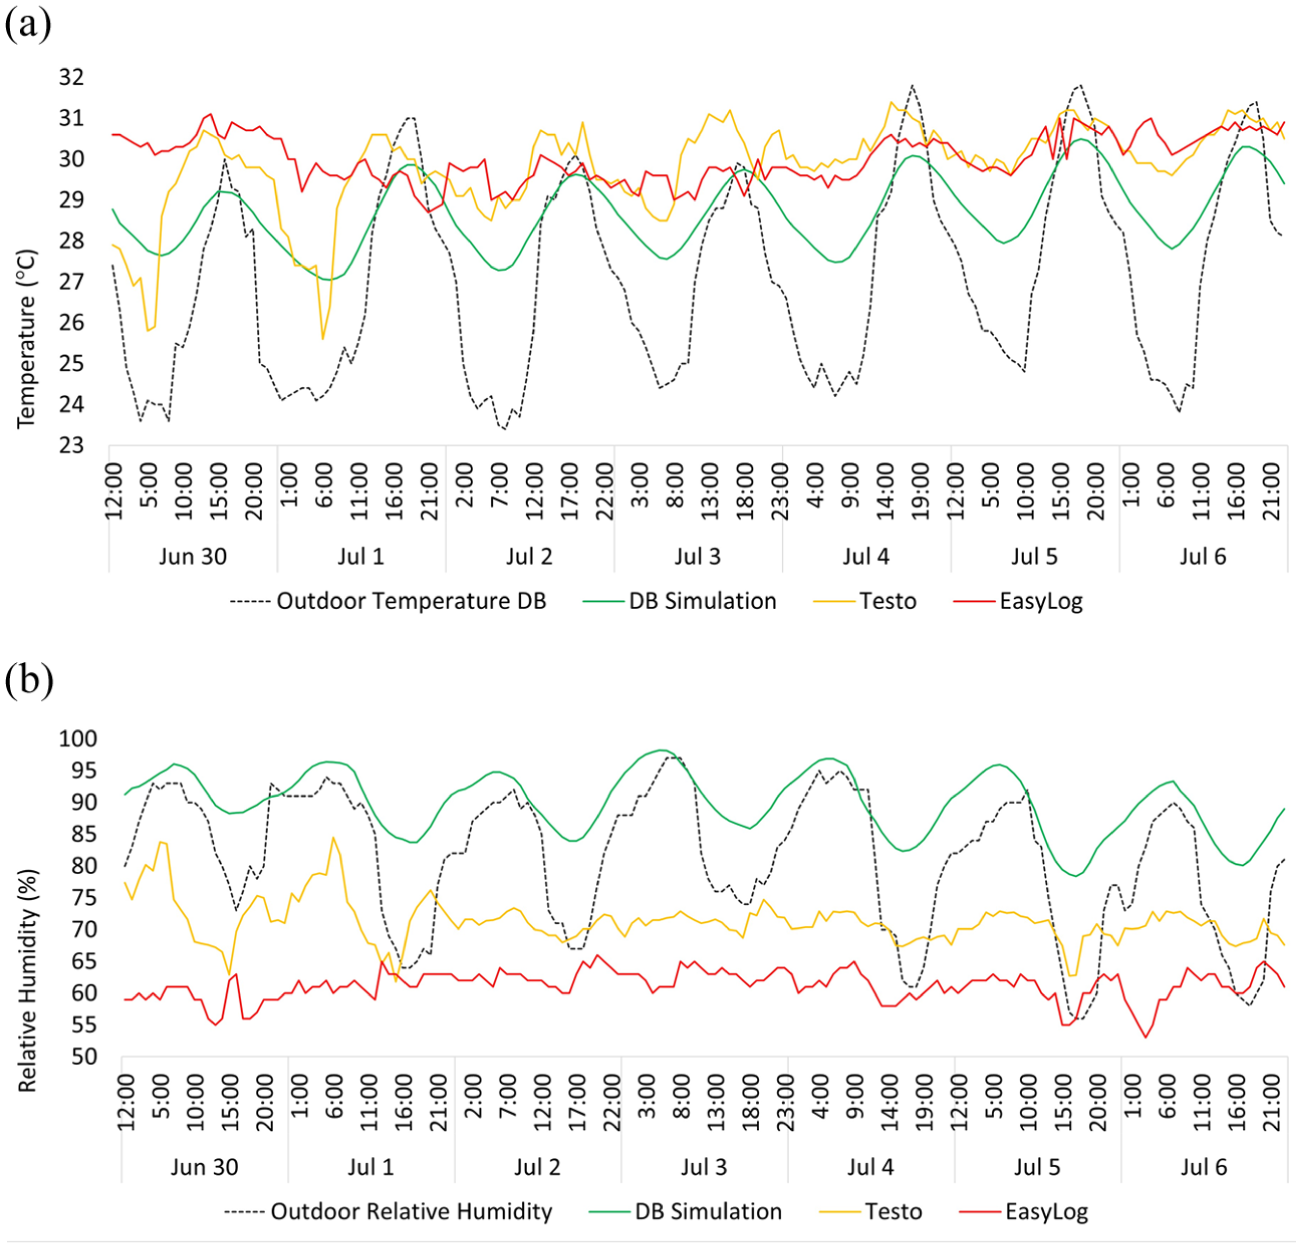
Comparison between simulation, Testo and EasyLog: (a) operative temperature and (b) relative humidity.
The data recorded with the Testo 605i thermohygrometer show temperatures ranging from 25.4°C to 31.2°C and relative humidity levels between 62.8% and 83.6%. The measured temperatures reasonably reproduce the overall trend of the simulation, although persistent deviations are observed in certain intervals of the analyzed period. Even so, the overall coherence in thermal patterns supports the usefulness of the model for comparing relative intervention scenarios. With respect to relative humidity, the measured values are consistent with the trends reported by meteorological stations (Oficina Nacional de Estadísticas (ONE), 2025), but differ from the simulations, which highlights limitations of the model in quantitatively reproducing indoor humidity conditions.
On the other hand, the records obtained with the EasyLog WiFi sensor, although consistent in terms of temperature (29.1°C to 30.9°C), showed lower relative humidity levels (56%–65%). These differences are likely associated with variations in sensor location, localized airflow conditions, short-term micro-environmental effects, and possible differences in sensor response and calibration tolerances during the monitoring period.
Taken together, the DesignBuilder simulation adequately reproduces the general trend of indoor thermal behavior, showing an acceptable correspondence with the temperatures measured by the Testo 605i sensor. These results should be interpreted considering that the model does not include vapor transfer: (1) deviations in simulated indoor temperature, which directly affect RH values, and (2) simplifications in the moisture balance model, including the absence of envelope moisture buffering and detailed occupant moisture schedules. For this reason, the calibration focused on temperature, as it is the variable with the greatest impact on passive analysis and the most consistent among the available data sets.
In this context, the simulated relative humidity is interpreted only as a qualitative trend indicator and not as a strict quantitative validation parameter. Since the thermo-energetic model used does not resolve absolute air humidity or vapor transport through the envelope, it is not possible to compare indoor conditions using vapor partial pressure, which constitutes an explicit limitation in the hygric validation of the study.
Although the model does not reproduce every detail of the indoor climate with precision, it does capture the dominant thermal pattern with sufficient accuracy to support the comparative analysis of passive strategies. On this basis, and acknowledging the limitations mentioned above, the vertical distribution of thermal and humidity conditions across the different building levels (B1–B4) was examined.
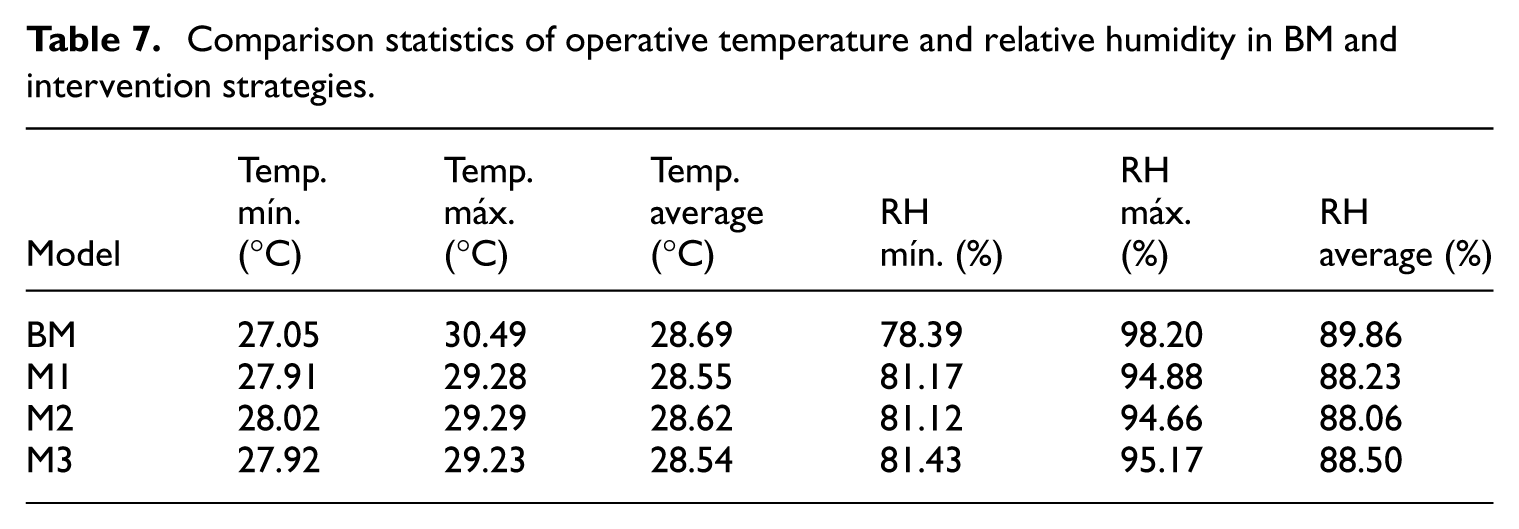
The analysis of indoor conditions as a function of height revealed thermal variations, as shown in Figure 6(a). The lower blocks (B1 and B2) exhibit operative temperatures between 24.2°C and 29.7°C, while the upper levels reach significantly higher values, between 28.3°C and 34.0°C. Relative humidity showed the opposite behavior (Figure 6(b)). The lower blocks, B1 and B2, display higher humidity levels than the upper ones. Block B1 presents the most critical values, reaching 99.7% relative humidity.
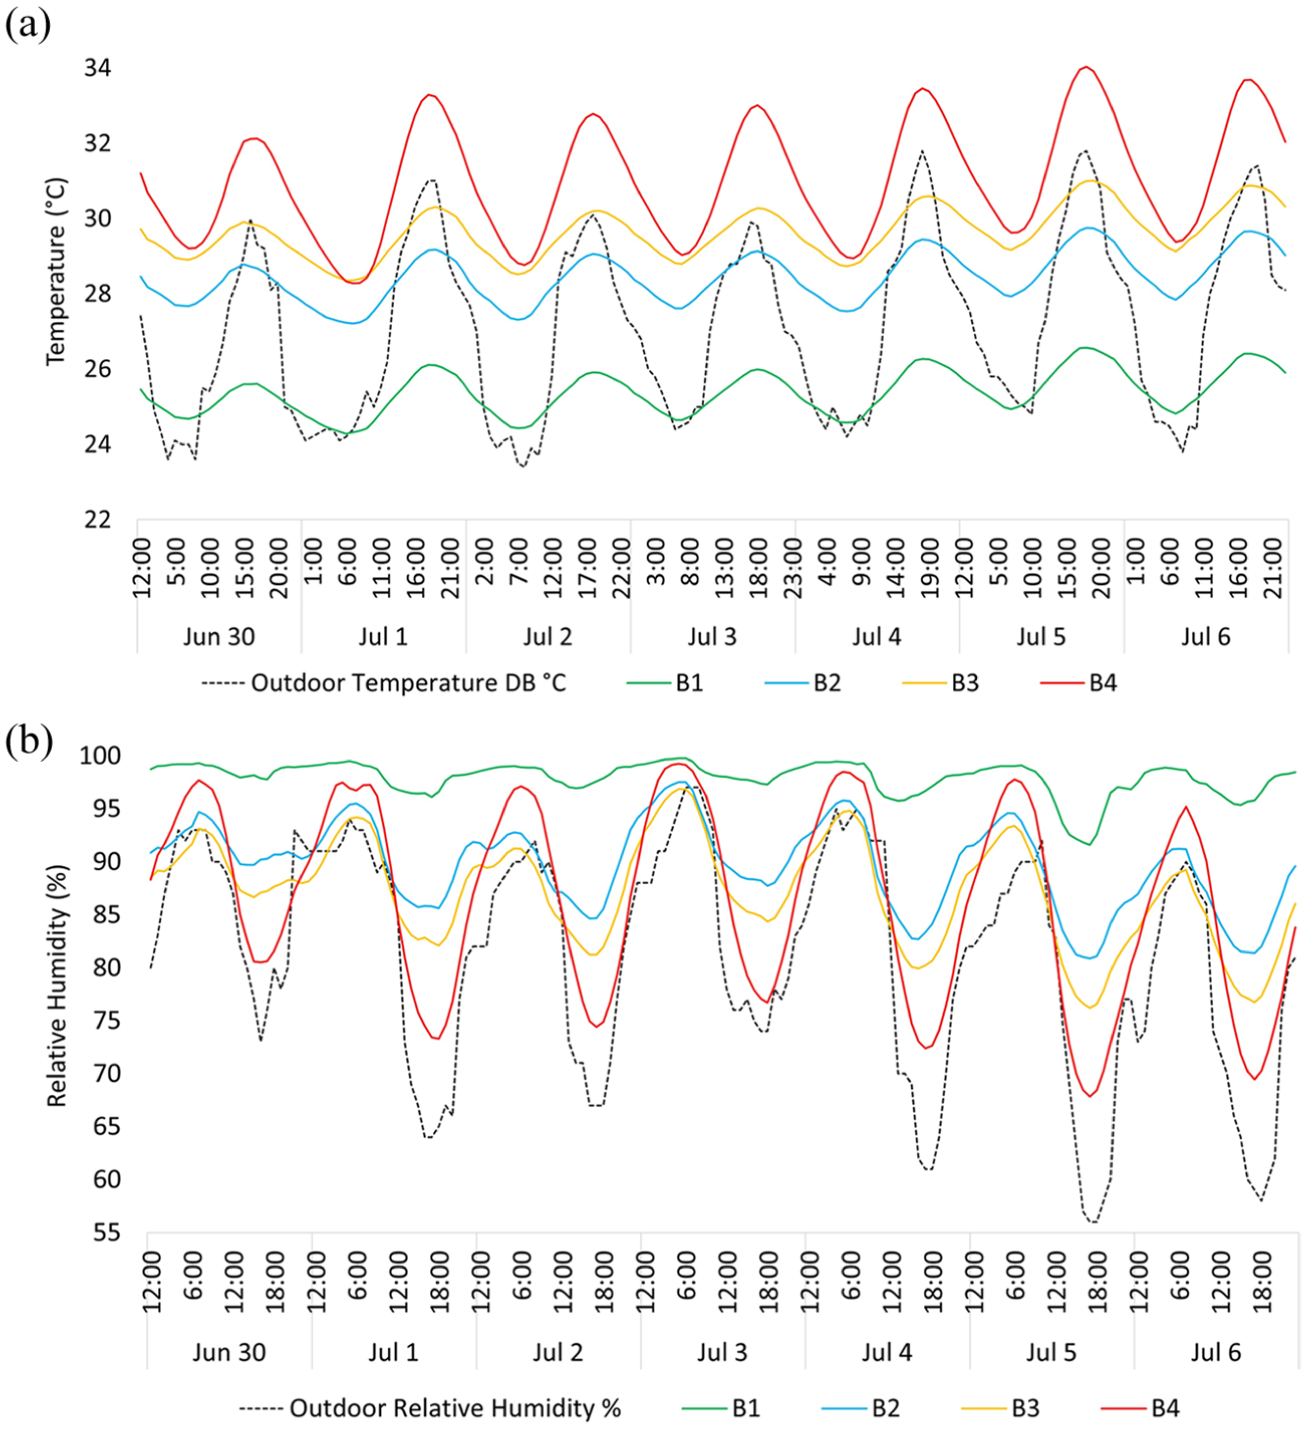
BM’s hygrothermal parameters by blocks: (a) temperature and (b) relative humidity.
These differences reflect an effect associated with thermal stratification of the air (Dai et al., 2022; Tuninetti et al., 2025). Hot air tends to accumulate in the upper levels, which is also drier. Meanwhile, the colder and more humid air descends. This behavior tends to intensify in warm climates, particularly in buildings with limited cross ventilation or without extraction mechanisms in the roof.
Evaluation of passive strategies (M1, M2, M3)
With the purpose of evaluating the building thermal performance in the facades and roof, three intervention strategies were carried out over the BM as reference point.
The first intervention strategy (M1) consisted of incorporating thermal insulation in the exposed envelope (facades and roof), combined with double glazing in the windows. In the second intervention (M2), the EPS insulation on the facades and the double glazing were maintained, while a layer of green roof was placed on top of the roof. Finally, in the third intervention (M3), the EPS insulation was substituted with mineral wool, while keeping the other conditions from M2.
The results of the comparative thermal simulation between the BM and the intervention proposals are shown in Figure 7(a). In the BM, a more pronounced temperature difference is observed throughout the hours of the analyzed week, whereas in models M1, M2 and M3 the daily thermal variability is significantly reduced. The combination of applied strategies allowed for more stable and uniform indoor conditions. However, during the early hours of the day, the BM exhibits temperatures closer to ranges commonly associated with thermal comfort in buildings located in tropical climates, suggesting that the effectiveness of the interventions also depends on the time of day and the dynamic behavior of the building envelope.
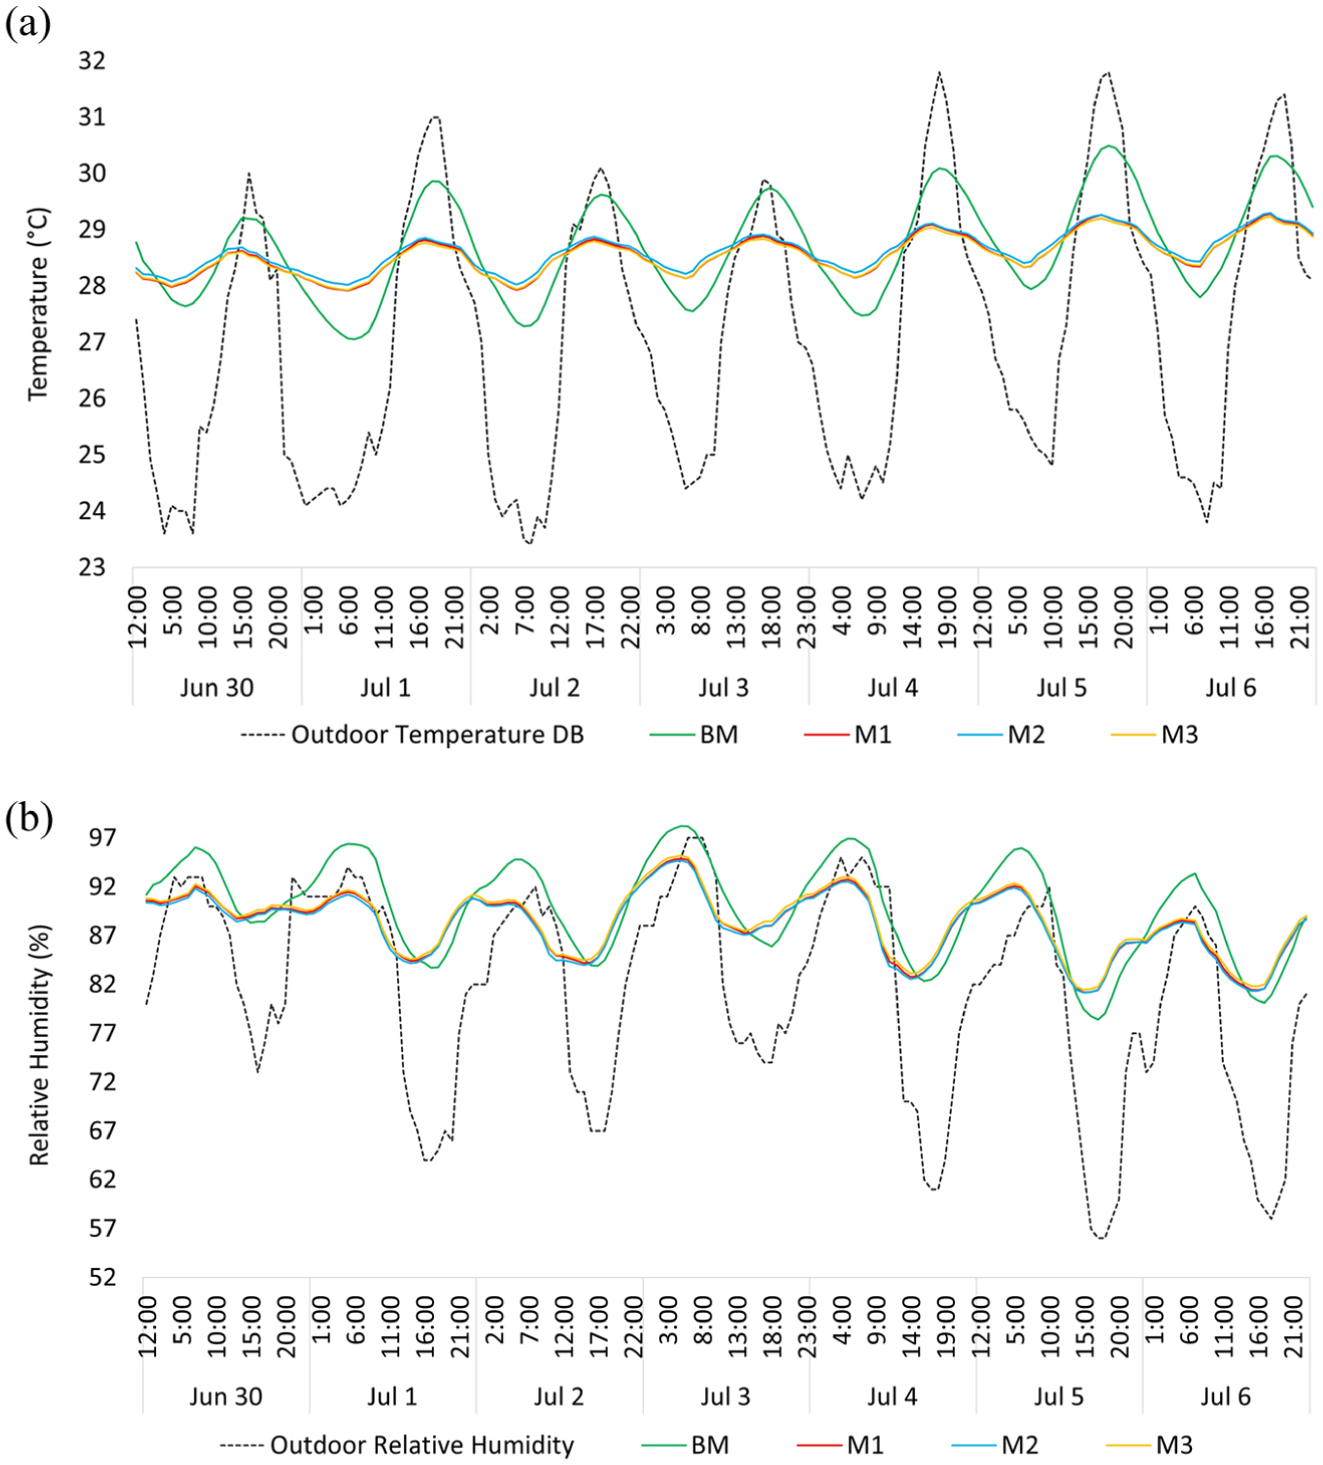
Comparison between BM and intervention strategies: (a) operative temperature and (b) relative humidity.
In addition to the thermal analysis, the relative humidity behavior was evaluated in the different simulated scenarios (Figure 7(b)). The intervention passive strategies showed a slight decrease in the relative humidity levels with respect to the BM, without significant differences among them. This reduction can be attributed to the improvement in the daily operative temperature variation, which affects the air’s capacity to retain water vapor. Despite this, the relative humidity values recorded across the different proposals remained within a similar range. A limited influence of the strategies on relative humidity levels was observed.
Indicative implications for cooling demand and emissions
Although this study did not directly model HVAC energy consumption or operational emissions, the reductions observed in indoor operative temperature suggest potential benefits for future cooling demand when active systems are used. Previous studies conducted in tropical climates have identified that a 1°C decrease in operative temperature can represent between 6% and 10% energy savings in residential buildings equipped with conventional air-conditioning units (split units; Li and Lam, 2001; Omer, 2008).
Therefore, if the passive strategies proposed in this study were complemented with HVAC systems, they could result in substantial energy savings. Applied research under similar climatic conditions has reported reductions in electricity consumption ranging from 15% to 35% through the combined use of thermal insulation, green roofs, and natural ventilation (Arundel et al., 1986; Jaffal et al., 2012). Additionally, the implementation of green roofs has shown further benefits in reducing exterior surface temperatures, thereby decreasing heat gains from radiation and improving the overall energy performance of the building (Santamouris, 2014).
These findings reinforce the potential of passive solutions not only to enhance thermal comfort but also to contribute to energy efficiency and the reduction of carbon emissions. This is particularly relevant in tropical urban contexts, where energy consumption for cooling is a significant fraction of the residential demand.
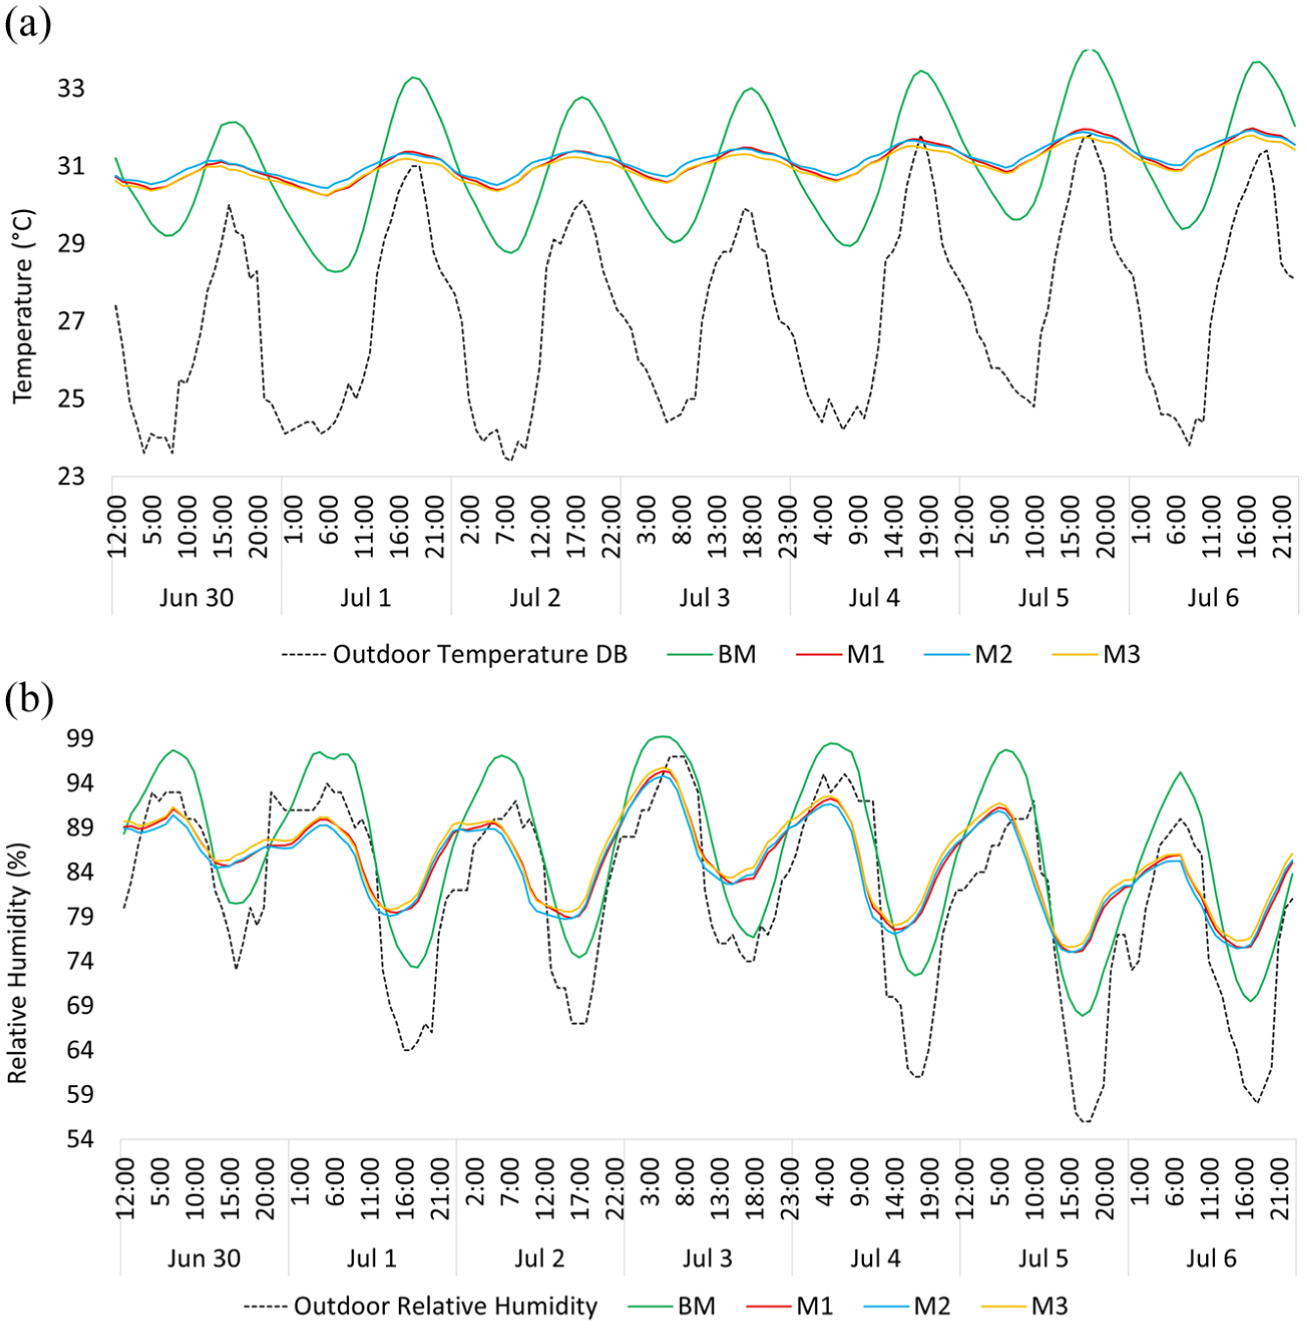
As complement to the operative temperature and relative humidity graphics presented before, a statistical synthesis of the values obtained in the BM and the passive strategies (M1, M2, M3) was conducted. Table 7 presents the minimum, maximum, and average values of operative temperature and relative humidity, allowing a comparative assessment of each intervention and highlighting the differences between configurations.
Comparison statistics of operative temperature and relative humidity in BM and intervention strategies.
Despite the thermal improvements observed with the intervention strategies, relative humidity levels remained high and showed minimal variations compared to the BM. This behavior has been reported in previous studies performed in tropical climates, where it has been demonstrated that passive solutions based solely on thermal insulation or improved envelopes have a limited impact on indoor humidity, particularly when controlled ventilation strategies, hygroscopic materials, or mechanical dehumidification systems are not incorporated (Kharchi and Imessad, 2018).
Moreover, the model used did not account for water vapor exchange with materials and only considered simplified internal latent gains from occupants, excluding detailed household moisture schedules (cooking, bathing, laundry), which may limit the model’s ability to accurately predict relative humidity variations. Since the model does not calculate the absolute humidity of the air, it also cannot estimate or validate the indoor vapor partial pressure, so the hygric analysis is restricted to comparing RH trends. These conditions reinforce the need to combine passive solutions with active or mixed strategies to effectively control humidity in warm–humid climates.
Vertical hygrothermal variation: Block 1 versus Block 4
To observe the operative and relative humidity behavior in different height conditions inside the building, blocks B1 and B4 were analyzed independently. The selection of both responded to the results obtained in the BM simulation where B1 showed lower results of operative temperature and B4 showed higher values. When compared with the BM, it was possible to assess the impact of the intervention strategies on the hygrothermal performance of the building.
As shown in Figure 8(a), the intervention strategies achieved a reduction in operative temperature in B1, with improvements ranging from 1.5% to 6.8% compared to the BM. This decrease was more pronounced during the afternoon hours of the week analyzed, when the greatest thermal differences between the evaluated configurations and the BM were observed.
B1’s comparison in BM and intervention strategies: (a) operative temperature and (b) relative humidity.
Regarding relative humidity, the results obtained for the three evaluated intervention strategies show values very similar to those of the BM, with no significant variations among them (see Figure 8(b)). Relative humidity increased on average by 0.75%, and despite the applied strategies, it remained well above the comfort range, which lies between 40% and 60%. This parameter highlights a limitation of the proposed passive strategies, which, although they contributed to reducing operative temperature, were not effective in decreasing humidity (Kharchi and Imessad, 2018).
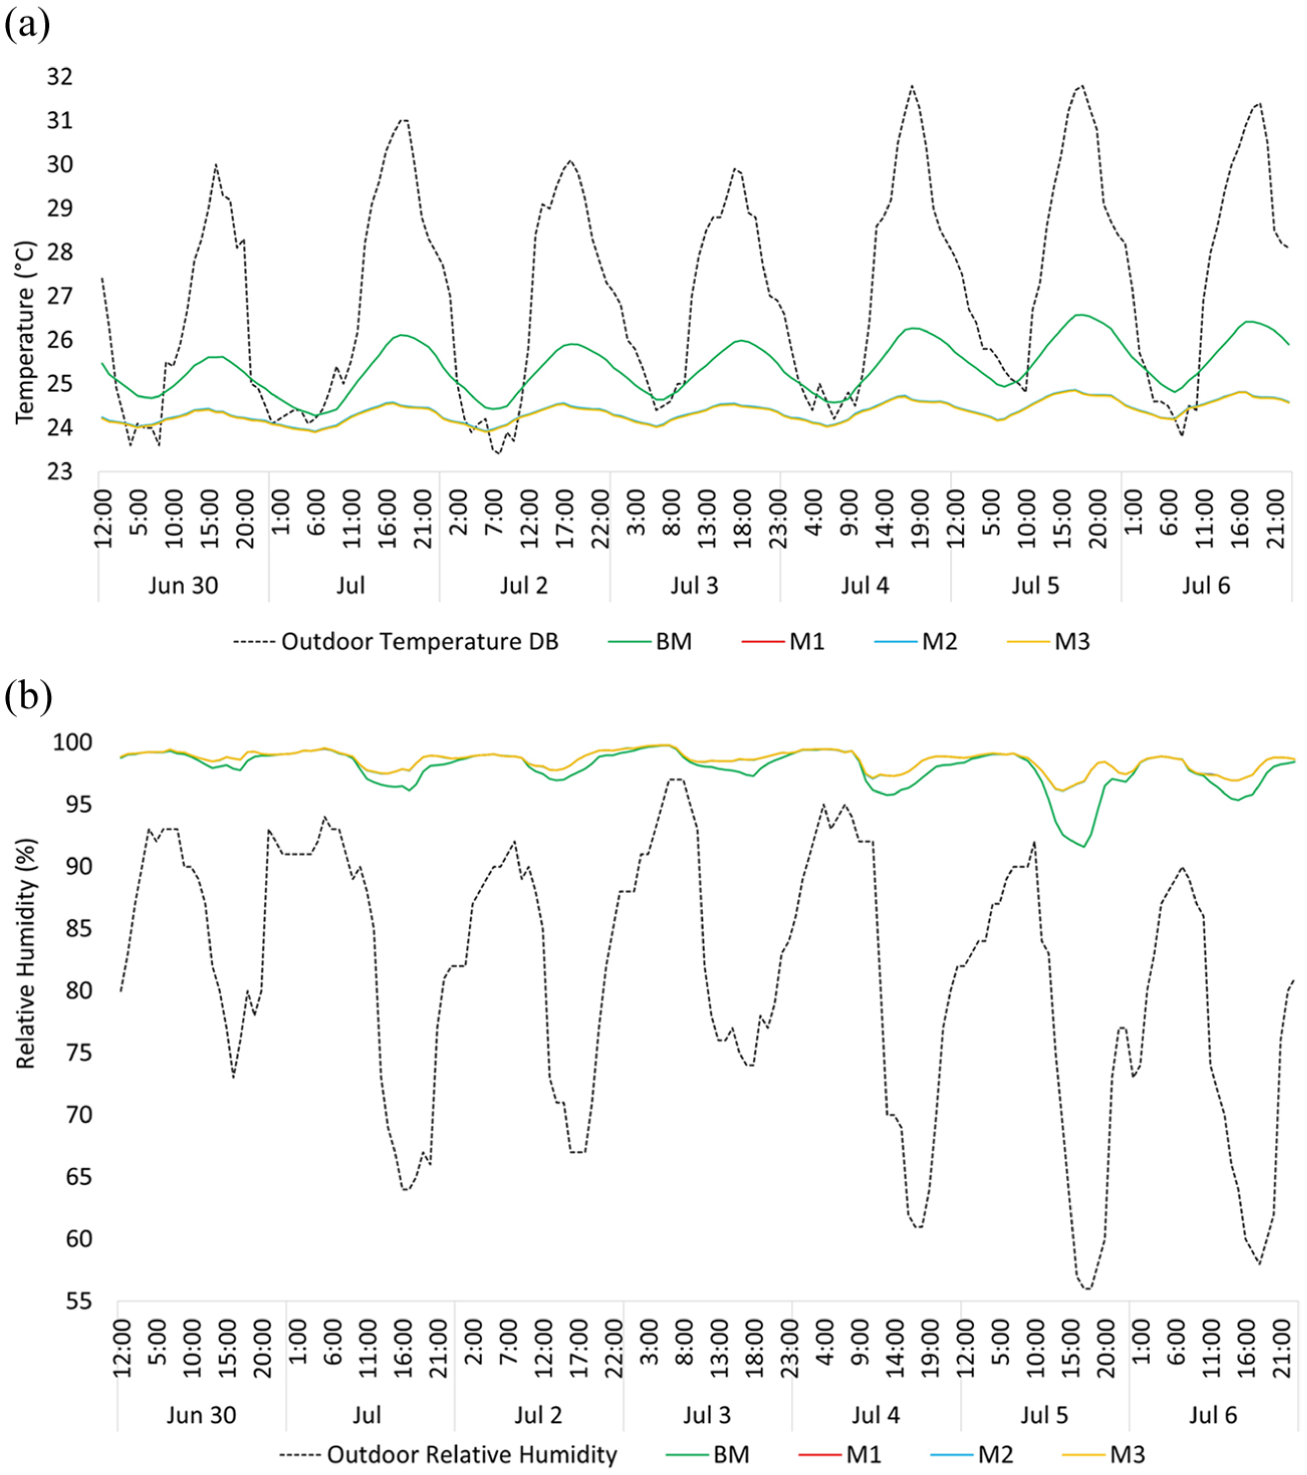
The results obtained from B4 are shown in Figure 9. The operating temperature (Figure 9(a)) of the proposed interventions displays a consistent behavior throughout the study week. No abrupt temperature spikes are observed. M1, M2, and M3 all showed an improving trend during the time transition from 12:00 p.m. to 1:00 a.m., reaching up to a 6.7% improvement compared to the BM. However, during the time slot from 1:00 a.m. to 12:00 p.m., the behavior was reversed. The temperature increased by up to 7.4% compared to the BM during the same time period.
B4 comparison in BM and intervention strategies: (a) operative temperature and (b) relative humidity.
The relative humidity values of the proposed interventions, shown in Figure 9(b), exhibit a general trend similar to that of the BM. A significant improvement can be observed during most of the study period, reaching up to a 9.3% reduction. However, despite this improvement, during the 18:00 p.m. time slot, the relative humidity of proposals M1, M2, and M3 increases by between 5.2% and 12.9%.
Both the operative temperature and the relative humidity of the intervention strategies showed consistent fluctuation during the measurement period. This indicates that indoor conditions remained stable. Such stability helps minimize impacts on the thermal perception of the occupants.
Integrated discussion
The results obtained show that the thermal performance of dwellings built with thin reinforced concrete walls in warm–humid climates exhibit significant variations depending on the conditions analyzed. Nevertheless, the comparative assessment of the evaluated scenarios reveals a series of key considerations:
Limitations and future work
This study was conducted using a single-zone model without incorporating a Heat-Air-Moisture (HAM) coupling, which limits the detailed representation of hygrothermal processes and the dynamic interactions between air, temperature, and moisture. Consequently, phenomena such as hygroscopic buffering and coupled vapor flows are not captured with the level of resolution required to comprehensively describe the behavior of the building envelope.
A fully coupled whole-building Heat–Air–Moisture (HAM) model would improve the representation of vapor transport, moisture buffering, infiltration effects, and envelope–indoor interactions. Such an approach is proposed as the next phase of this research.
In particular, the inability to estimate and validate the indoor vapor partial pressure using the current model constrains the scope of the hygric evaluation. Future work implementing HAM schemes will allow explicit calculation of absolute humidity and vapor pressure, thereby improving both the quality of the validation process and the representation of hygrothermal behavior in warm and humid climates.
Additionally, the absence of dynamic internal loads and operational profiles based on real occupancy limits the model’s ability to represent the building’s response to ventilation, internal heat gains, and hourly variations in humidity.
For future studies, it is proposed to integrate specialized tools, such as WUFI or the HAMT module in EnergyPlus, in order to enhance hygrothermal modeling and broaden the analytical scope. Future developments should integrate tools such as WUFI Plus, EnergyPlus HAMT, or equivalent whole-building HAM platforms, together with expanded monitoring campaigns and multi-objective optimization of passive retrofit measures. It is also recommended to extend the experimental validation to different climatic periods and seasonal scenarios, enabling the assessment of model performance under contrasting environmental conditions and strengthening its predictive capability in tropical climates.
Conclusions
By observing the BM analysis and the three passive intervention strategies (M1, M2, and M3) evaluated in a four-story building with thin reinforced concrete walls in the Dominican Republic, the study found that:
The base model (BM) exhibited high operative temperatures, reaching up to 34.0°C in the upper levels, exceeding the ASHRAE 55 comfort threshold (27.5°C), which confirms its thermal vulnerability in hot–humid climates and the need to apply passive improvements to the building envelope.
Relative humidity levels in the BM remained between 80.8% and 98.8%, well above the recommended range (40%–60%), which significantly compromises indoor comfort and could create favorable conditions for mold growth or negative health effects for occupants. These humidity values should be interpreted as qualitative indicators within the modeling scope adopted in this study.
Strategies M1, M2, and M3 succeeded in reducing daily thermal variability, generating more thermally stable environments, although during the early hours of the day the BM maintained temperatures closer to the comfort range, suggesting the need to consider additional thermal damping strategies or specific modifications to the envelope.
Regarding relative humidity, the passive strategies showed limited improvement. Humidity decreased by up to 9.3% during some periods, but punctual increases (up to 12.9%) were observed in the afternoon. These results indicate that envelope-only passive measures may have limited capacity to control indoor humidity in this type of building under warm–humid conditions.
The height-based analysis showed that the lower block (B1) responded better to the interventions, with temperature reductions between 1.5% and 6.8%, while in the upper block (B4) there were partial thermal improvements but also temperature increases in the morning hours. These differences reinforce the influence of height and direct solar exposure on the effectiveness of passive strategies.
None of the passive strategies succeeded in effectively reducing relative humidity below the critical range, confirming the need to incorporate complementary solutions such as controlled mechanical ventilation, hygroscopic materials, or passive dehumidification systems. These results should be interpreted considering that the model does not include vapor transfer or hygroscopic buffering, meaning that conclusions related to indoor humidity are limited to general patterns rather than absolute values. Future studies using whole-building HAM models may refine these moisture-related findings.
The hybrid approach employed (simulation + field measurements) proved useful for representing the dominant indoor thermal behavior of buildings in tropical climates and represents a useful tool for design and energy retrofit decision-making, especially in contexts where resources for continuous monitoring or advanced measurement systems are limited.
The findings provide relevant inputs for the development of regulations and public policies in tropical climates, particularly in the field of social housing, by highlighting the need for more effective passive strategies and design criteria that prioritize thermal comfort and energy efficiency.
This study contributes to improving the understanding of the real thermal behavior and qualitative humidity trends of tropical social housing and serves as a foundation for future research integrating HAM models and mixed strategies for thermal and hygrometric control.
The present results should therefore be interpreted as a comparative first-step assessment that supports more advanced future HAM-based investigations.
Footnotes
Abbreviations
BM Base Model
M1, M2, M3 Intervention Strategies 1, 2 & 3
HVAC Heating, Ventilation and Air Conditioning
RH Relative Humidity
OT Operative Temperature
EPS Expanded Polystyrene
EPW Energy Plus Weather File
ASHRAE American Society of Heating, Refrigerating and Air-Conditioning Engineers
ACI American Concrete Institute
ASTM American Society for Testing and Materials
DGNRS Dirección General de Normas, Reglamentos
HAM Heat–Air–Moisture
Acknowledgements
The authors would like to thank the Ministry of Higher Education, Science and Technology of the Dominican Republic for funding the doctoral scholarship MESCYT-BI475-2022 through the International Scholarship Program. Special thanks are extended to the ENEDI Research Group at the University of the Basque Country (UPV/EHU) for providing access to the DesignBuilder software license, which was used to carry out the thermal simulations. Additionally, the authors express their gratitude to the Pontificia Universidad Católica Madre y Maestra (PUCMM), specifically the Sustainable Construction Laboratory and its WasteBlocks project (2022-3ª11-153 FONDOCYT), for allowing the use of the Testo 605i thermohygrometer and the EasyLog WiFi devices for field measurements. The authors also thank Ricardo González for reviewing the English translation.
Author contributions
Funding
The authors received no financial support for the research and authorship of this article. Open Access funding was provided by the University of the Basque Country (UPV/EHU) in accordance with its Open Access funding agreements.
Declaration of conflicting interests
The authors declared no potential conflicts of interest with respect to the research, authorship, and/or publication of this article.