
Abstract
Aim
Aim of this study was to develop a valid and reliable measuring tool in order to evaluate comfort of patients receiving hemodialysis treatment.
Background
There has been available a scale developed to evaluate comfort of hemodialysis patients “HDCS (Hemodialysis Comfort Scale).” Due to HDCS consisted of nine items and evaluated comfort in two sub-dimensions, researchers who developed HDCS, stated that number of scale items and dimensions is not sufficient to fully evaluate comfort. Therefore, (Hemodialysis Comfort Scale Version II) HDCS-II was developed with this research and its development process were discussed in this article.
Materials and Methods
Sample of this methodological research was consisted of 436 chronic hemodialysis patients, treated at five hemodialysis centers between October 2018 and May 2019. In process of creation item pool, comfort theory and literature was examined. The items in the old scale were also revised and included. Thereby a new question pool of 87 items was created. This draft scale was sent for expert opinion. In validity of scale; content validity index, exploratory and confirmatory factor analysis were used. In reliability study; Item analysis, cronbach’s alpha reliability coefficient, parallel form reliability and item analysis based on upper-lower group averages were used.
Results
There was consistency between expert views relating to items in scale. According to exploratory factor analysis, scale consisted of six dimensions. Cronbach alpha coefficient of 26-item scale was 0.79. Alpha values of the six factor in scale were, respectively; for physical relief 0.83, for physical ease 0.71, for psychospiritual ease 0.87, for psychospiritual transcendence 0.85, for environmental transcendence 0.82, and for sociocultural ease 0.61.
Conclusion
HDCS-II is a 5-point likert type and consists of 26 items and 6 factors. This scale is a valid and reliable measurement tool that can be used to determine comfort of patients undergoing hemodialysis treatment.
Introduction
Chronic Kidney Disease is an important health problem in the world and in our country. The incidence of it is increasing day by day. An estimated 30 million people (15%) in the United States in 2017 had Chronic Kidney Disease (CKD). 48% of these people had decreased renal function, but did not receive dialysis treatment and were not aware of their condition (National Chronic Kidney Disease Fact Sheet, 2017). According to CREDIT (2011), the rate of CKD in the general adult population in our country was 15.7%. Accordingly, one out of every 20 adults has a critical level of CKD (Suleymanlar et al., 2011). Hemodialysis is the most commonly used method in the treatment of chronic kidney disease in Turkey. According to the TNA (Turkish Nephrology Association) Kidney Registry System data, there were 56,687 hemodialysis patients in our country as of late 2016 (Seyahi et al., 2016). Hemodialysis is a troublesome treatment regimen, which has a complex structure and constraints for the patient, requiring considerable patient participation (Naalweh et al., 2017; Beerappa & Chandrababu, 2019). Hemodialysis treatment requires patients’ adaptation to drug treatment, dialysis sessions (Ibrahim et al., 2015), dietary (Efe & Kocagoz, 2015; Beerendrakumar et al., 2018; Bulantekin Duzalan & Cinar Pakyuz, 2018) and fluid restriction (Baraz et al., 2010; Ibrahim et al., 2015; Albayrak Cosar & Cinar Pakyuz, 2016; Balım & Çınar Pakyüz, 2016). The protection of the vascular access to the dialysis is a great necessity both for the patient and the nurse (Kartal & Cinar, 2010). These restrictions and imperatives complicate the daily lives of patients and affect patient comfort negatively (Orak, 2013). Complications due to dialysis treatment, fatigue, inability to go on vacation, and uncertainties about the future also cause stress and affect patient comfort (Ibrahim et al., 2015). In addition, complications like hyperkalemia, hiperfosfatemia, hipernatremia, and hipervolemia that occur in cases when patients cannot adapt to self-care behaviors negatively affect the comfort level (Naalweh et al., 2017). Therefore, it is important to determine comfort status in HD patients. Comfort is considered to be the expected positive outcome in the patient. The concept of comfort guides planning and organizing nursing care in any settings (Irene, 2013; Sara et al., 2016). Kolcoba explained the comfort theory in two dimensions. The first dimension contains relief, ease, and transcendence phases; second includes physical, psychospiritual, environmental, and sociocultural components (Karabacak & Acaroğlu, 2011; Erdemir & Cırlak, 2013; Orak, 2013). When we look at the concepts in the first dimension, relief refers to the condition of a patient whose specific requirement is met; ease means serenity, satisfaction, and delight; transcendence refers to a situation in which someone overcomes their own problems or pain (Karabacak & Acaroğlu, 2011; Erdemir & Cırlak, 2013; Orak, 2013).
Kolcaba states that nurses can use the comfort theory both for patient care and the development of their working environments, and also emphasizes that satisfaction both patient and nurse will increase when the patient care performed with interventions which provide comfort (Irene, 2013; Orak, 2013; Sara et al., 2016; Pinto et al., 2017). Patient comfort can be evaluated with comfort scales developed for many areas (intensive care and orthopedics nursing), and the effects of various interventions on patient comfort can also be measured by these scales (Wilson & Kolcaba, 2004; Karakaplan & Yıldız, 2010; Kahraman et al., 2014; Kuçuk Alemdar & Guducu Tufekci, 2015).
The literature review has revealed that the Hemodialysis Comfort Scale developed by Sahin, Pakyuz, and Kartal (2017) has been used to determine the comfort level of HD treated patients. Hemodialysis comfort scale consisted of 9 items and evaluated comfort in only two sub-dimensions (ease and transcendence), (Sahin & Cinar, 2018). However, the comfort theory is composed of three stages and four components. While the first dimension includes the stages of relief, ease and transcendence; in the second dimension, there are physical, psychospiritual, environmental, and sociocultural components. These concepts are shown in a crosstab as three stages in columns and four components in rows. This table formed the taxonomic structure of the comfort theory and it was predicted that it could be used in the development of comfort measurement tools specific to different situations (Orak, 2013). Therefore, the researchers who developed hemodialysis comfort scale stated in the relevant article that the number of scale items and dimensions is not sufficient to fully evaluate comfort and suggested that it should be revised. Based on this, the aim of this study was to develop a valid and reliable measuring tool in order to evaluate the comfort of patients receiving HD treatment.
Material and method
Aim
The aim of this study was to develop a valid and reliable measuring tool in order to evaluate the comfort of patients receiving HD treatment. Our goal is not to directly revise the old scale, but to develop a new and valid reliable scale inspired by its starting point. Scale studies were shaped in this research by revising the items of the old scale and adding new items by searching literature.
Methodology
This study was conducted methodologically to evaluate the validity and reliability of the Hemodialysis Comfort Scale Version II. The data were collected in five hemodialysis centers in İzmir and Manisa in Turkey (Private Reniz Dialysis Center-İzmir, Private Diyatrans Dialysis Center-İzmir, Private Can Dialysis Center-İzmir, Private Anemon Dialysis Center-Manisa, Merkezefendi State Hospital Hemodialysis Unit-Manisa) between October 2018 and May 2019.
Sample
The population of the study consisted of 500 patients undergoing hemodialysis treatment in five hemodialysis centers in Izmir and Manisa. The sample consisted of 436 patients who agreed to participate in the study and met the inclusion criteria. As recommended for methodological studies, the sample size was determined by calculating at least 5 times the number of items in the scale (Sencan, 2005). Inclusion criteria was being 18 years of age and over, having no communication problems (having no hearing, vision and perceiving problems), receiving hemodialysis treatment for at least 3 months, having no cognitive impairment, understanding and speaking Turkish, and voluntary participation in the study.
Instruments
The study data were collected with Patient Information Form, Hemodialysis Comfort Scale Version II and Nottingham Health Profile.
Patient information form
This form was developed in line with the literature by the researcher. It intends to collect personal information about the patients (age, gender, marital status, educational status, working status, occupation, and income status) and additional data about the disease and HD treatment (Naalweh et al., 2017; Gunalay et al., 2017; Sahin & Cinar, 2017).
Hemodialysis comfort scale version II
First, the comfort theory was examined, and then new questions were prepared by the researchers for comfort of the patients receiving hemodialysis treatment and a pool of items was created, which was consisted of 87 items. The items in the old scale were also revised and included in the new question pool. The item pool was formed as a result of the examination of the literature including the General Comfort Scale (Kuguoglu & Karabacak, 2008) developed by Kolcaba, the comfort scales developed for specific areas (Alemdar & Tufekci, 2015; Gunalayet al., 2017; Kahraman et al., 2014; Karakaplan & Yıldız, 2010; Ustundag & Eti Aslan, 2010), the HD Comfort Scale (Blinded for peer review), and the qualitative studies in which patients receiving HD treatment expressed their life quality (Anderson et al., 2012; Duran & Gungor, 2015; Ghimire et al., 2017; Meric & Oflaz, 2013). In order to calculate the content validity index, the items in the draft form of the scale were submitted to 11 experts and they were asked to evaluate the items in terms of relationship, simplicity, and clarity via a 4-point Likert type rating scale (1 = not relevant, 2 = requires a lot of correction, 3 = relevant, but needs a small correction, and 4 = relevant). The experts were also asked to write down their proposals near the item if necessary. Necessary corrections were made based on the feedback from the experts. Accordingly, items with 3 or 4 points were regarded as eligible; items with 2 points were considered that they could be used in the scale; while items with 1 point were grouped as inappropriate. Two points means that a lot of correction is required in that item. The items, which scored 2 points, were corrected in line with the recommendations offered by the experts, and it was decided by the researchers, that these items should remain in the question pool at this stage in order to provide an effective evaluation. For this reason, these items were left in the question pool after they were revised. Since no negative feedback was received regarding the understandability and necessity of these items also in the pilot application on patients, no changes were made.
Item-level content validity index (I-CVI) and scale-level content validity index (S-CVI) were calculated. After taking the expert opinions and making necessary changes, to complete the content validity test the new version of the scale with 87 items was administered to 20 HD patients to get their feedback on the simplicity and clarity of the items.
After the final form of the draft version was obtained, item analysis (item-total correlation, Cronbach’s Alpha coefficient) and factor analysis were repeated alternately until expected values were obtained. As a result, a scale consisting of 26 items and six sub-dimensions was obtained.
The Nottingham health profile (NHP)
NHP is used to evaluate health-related quality of life. This scale is a general quality of life scale aimed at measuring the health status perceived by the person from physical, emotional, and social perspectives. It consists of 38 items and evaluates six dimensions related to health status: Energy level (3 items), pain (8 items), emotional reactions (9 items), sleep (5 items), social isolation (5 items), and physical activity (8 items). The questions are responded as “yes” or “no." The scores that can be obtained from each section range from 0 to 100. 0 indicates the best health status, while 100 refers to the worst health status. The validity and reliability study of the Turkish version was conducted by Kucukdeveci (Kucukdeveci et al., 2000). Permission for using the scales was obtained from Kucukdeveci via e-mail.
Quality of life and comfort are concepts that are close to each other. In many studies examining the relationship between quality of life and comfort, it was observed that correlations in the same direction were obtained between the two concepts. Nottingham Health Profile contains items that evaluate the pain, emotional reactions and social isolation status of the individual, as in the hemodialysis comfort scale version II. Therefore, it was used as an equivalent scale in this study.
Data analysis
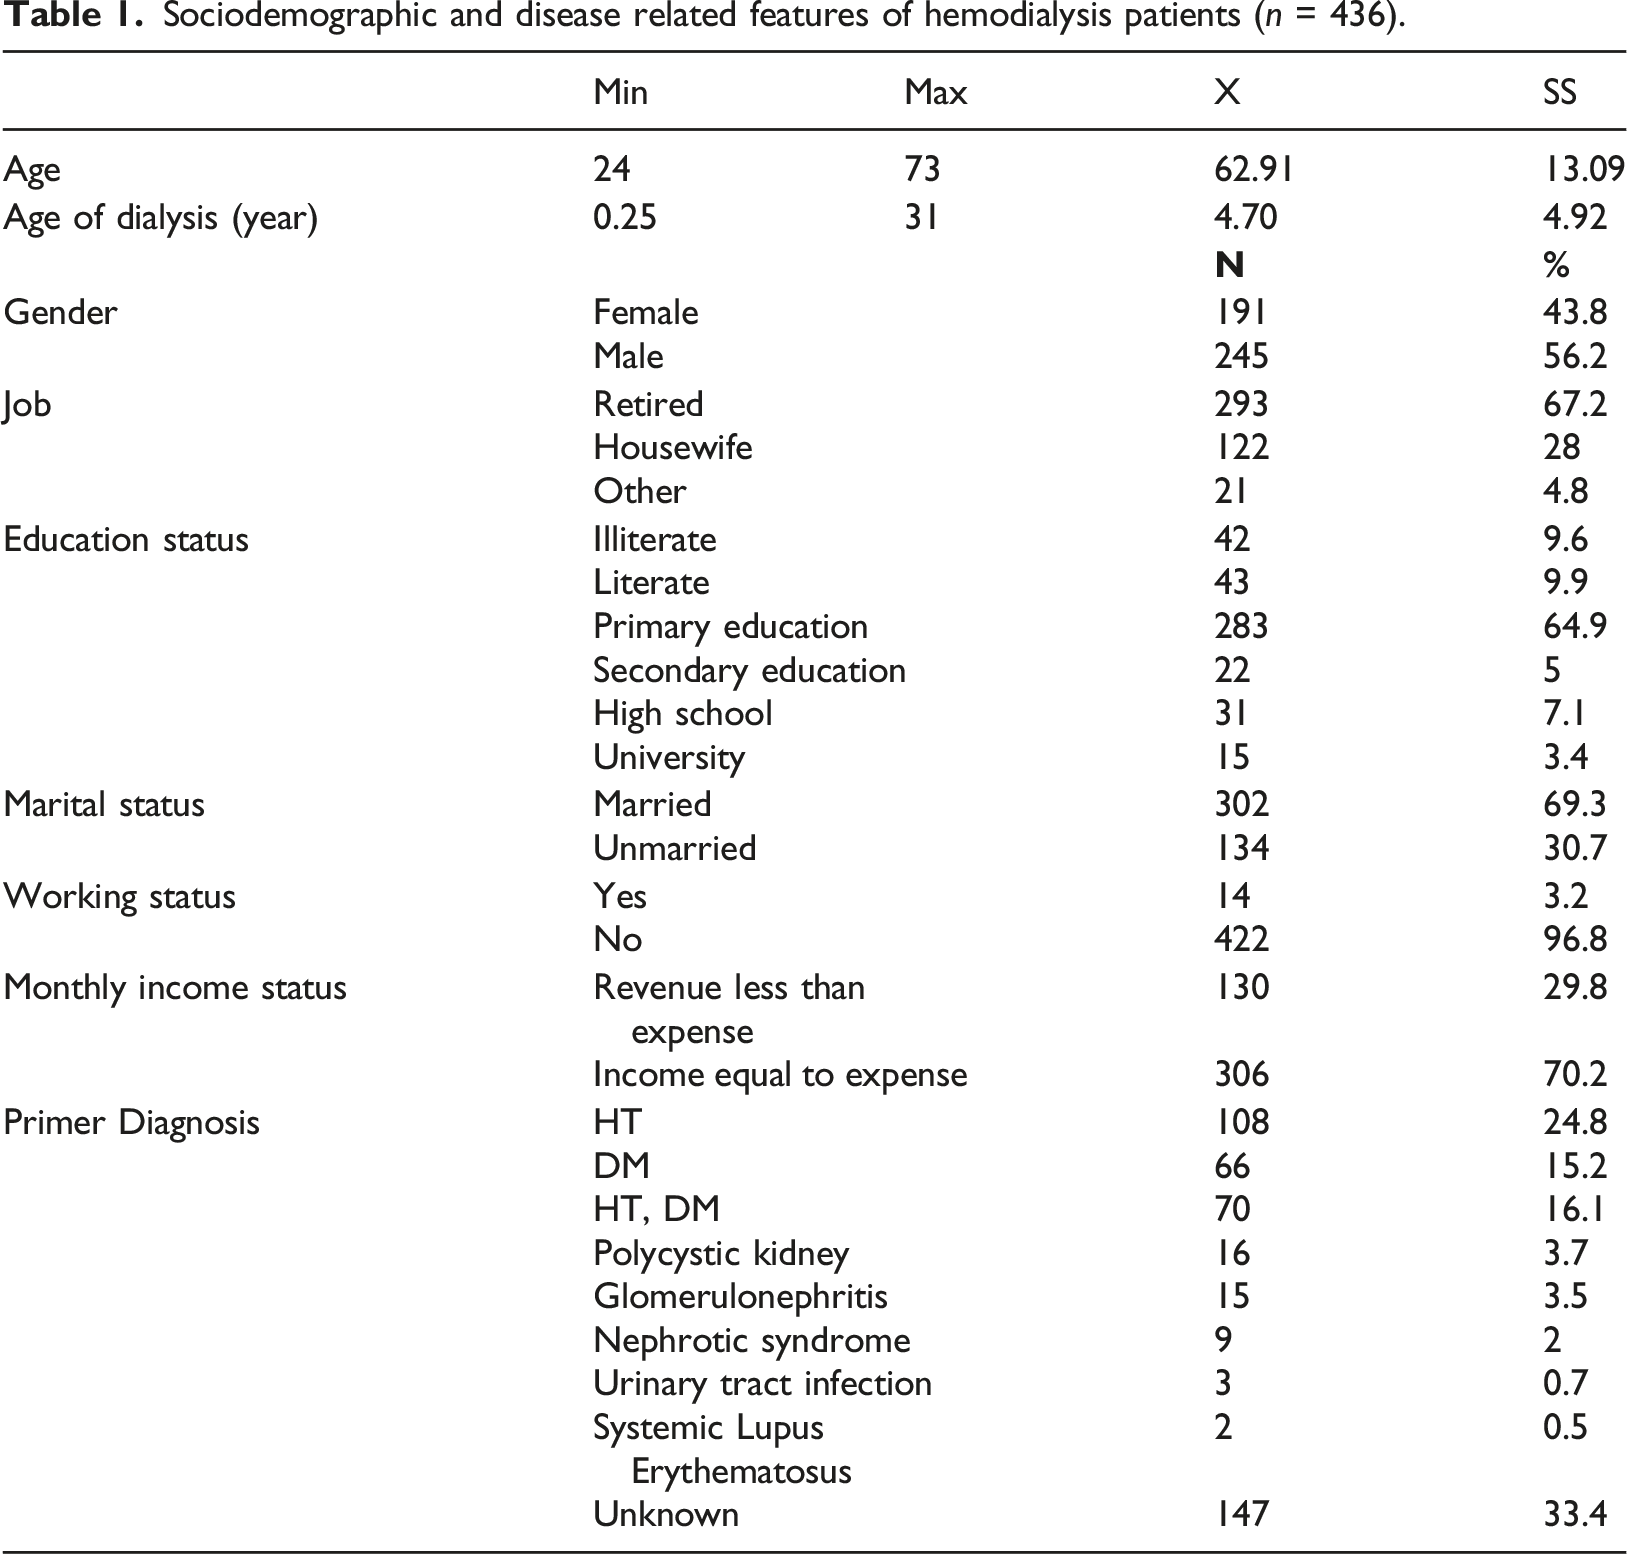
Sociodemographic and disease related features of hemodialysis patients (n = 436).
Firstly item analysis was performed and Cronbach’s alpha coefficient was calculated to evaluate the reliability of the scale. Items with cronbach’s alpha value greater than the scale’s cronbach’s alpha value were excluded from the draft scale. Following the item analysis, construct validity was analyzed for the remaining items. In the exploratory factor analysis, items with factor loadings less than 0.30 were excluded. And also items which were located in different dimensions but showed close values were excluded. EFA was repeated until the appropriate values were obtained. Subsequently, item analysis (item-total correlation, Cronbach’s Alpha coefficient), and exploratory and confirmatory factor analysis (factor loadings) were repeated alternately until expected values were obtained. Then the parallel form reliability was evaluated.
Results
Sociodemographic features of the hemodialysis patients
Item analysis and internal consistency coefficient results of hemodialysis comfort scale version II (n = 436).

Cronbach alfa = 0.79
**p < 0.01 ***p < 0.001.
Reliability analysis of the hemodialysis comfort scale version II
Content validity
During the scale development process, firstly, content validity index examined. Items in the item pool were evaluated by 11 experts in terms of relationship, simplicity, and clarity. I-CVI was found to range from 0.81 to 1.00, and the S-CVI varied between 0.99 and 1.00. Then the draft form of the scale was administered to 20 hemodialysis patients. According to the findings from the pilot study, the questions were clear and comprehensible. As a result of the content validity index studies, items were corrected, but no items were removed from the scale question pool. As a result, the final form of HDCS-Version II with 87 items was obtained.
Cronbach’s alpha coefficient
Factor structure and reliability analyses of hemodialysis comfort scale version II (n=436).
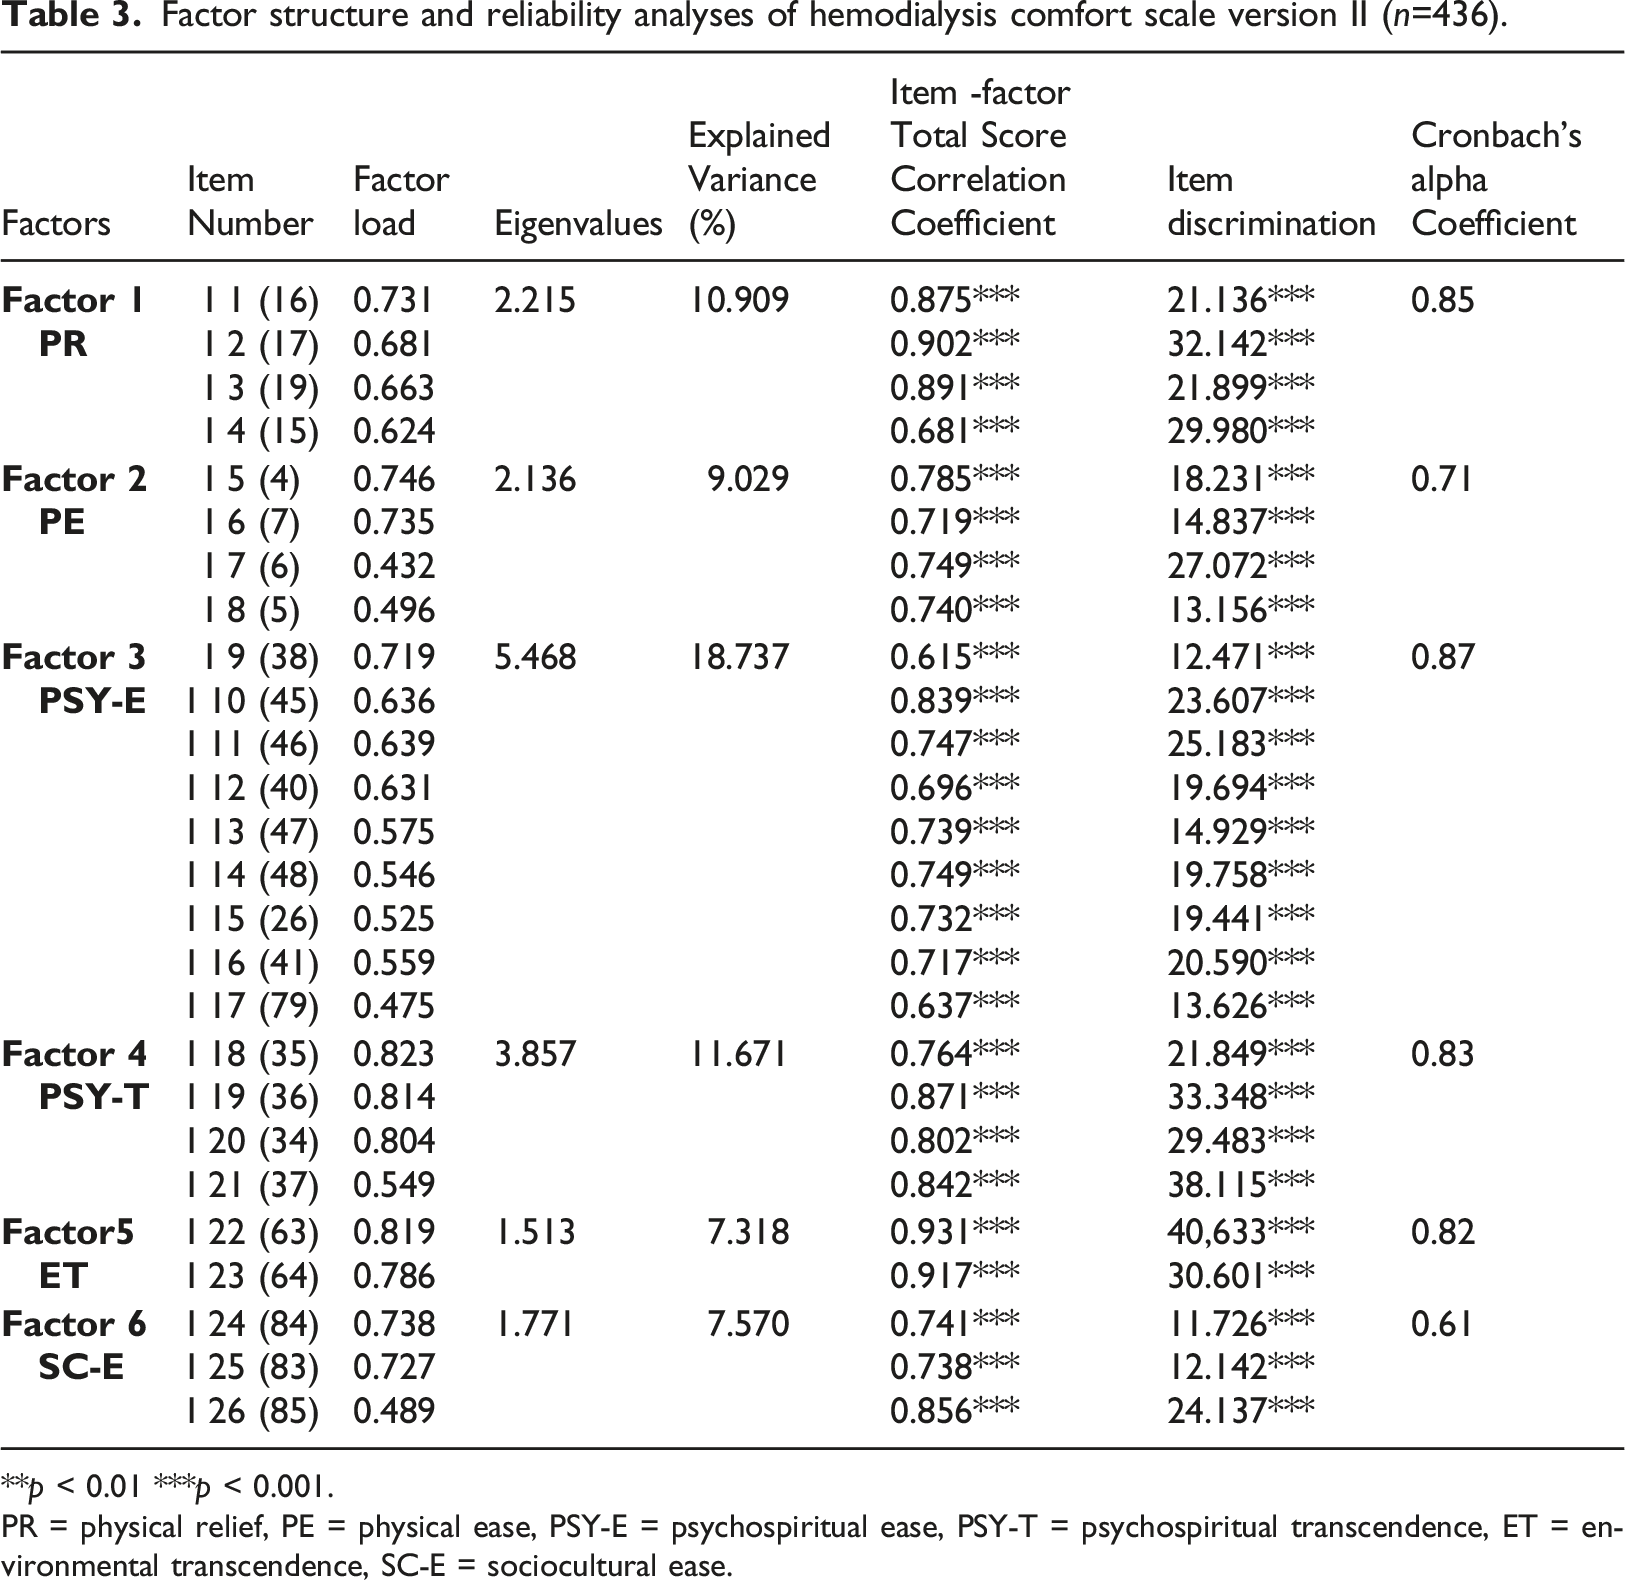
**p < 0.01 ***p < 0.001.
PR = physical relief, PE = physical ease, PSY-E = psychospiritual ease, PSY-T = psychospiritual transcendence, ET = environmental transcendence, SC-E = sociocultural ease.
The correlation results of the hemodialysis comfort scale version II and Nottingham health profile sub-dimensions (n = 436
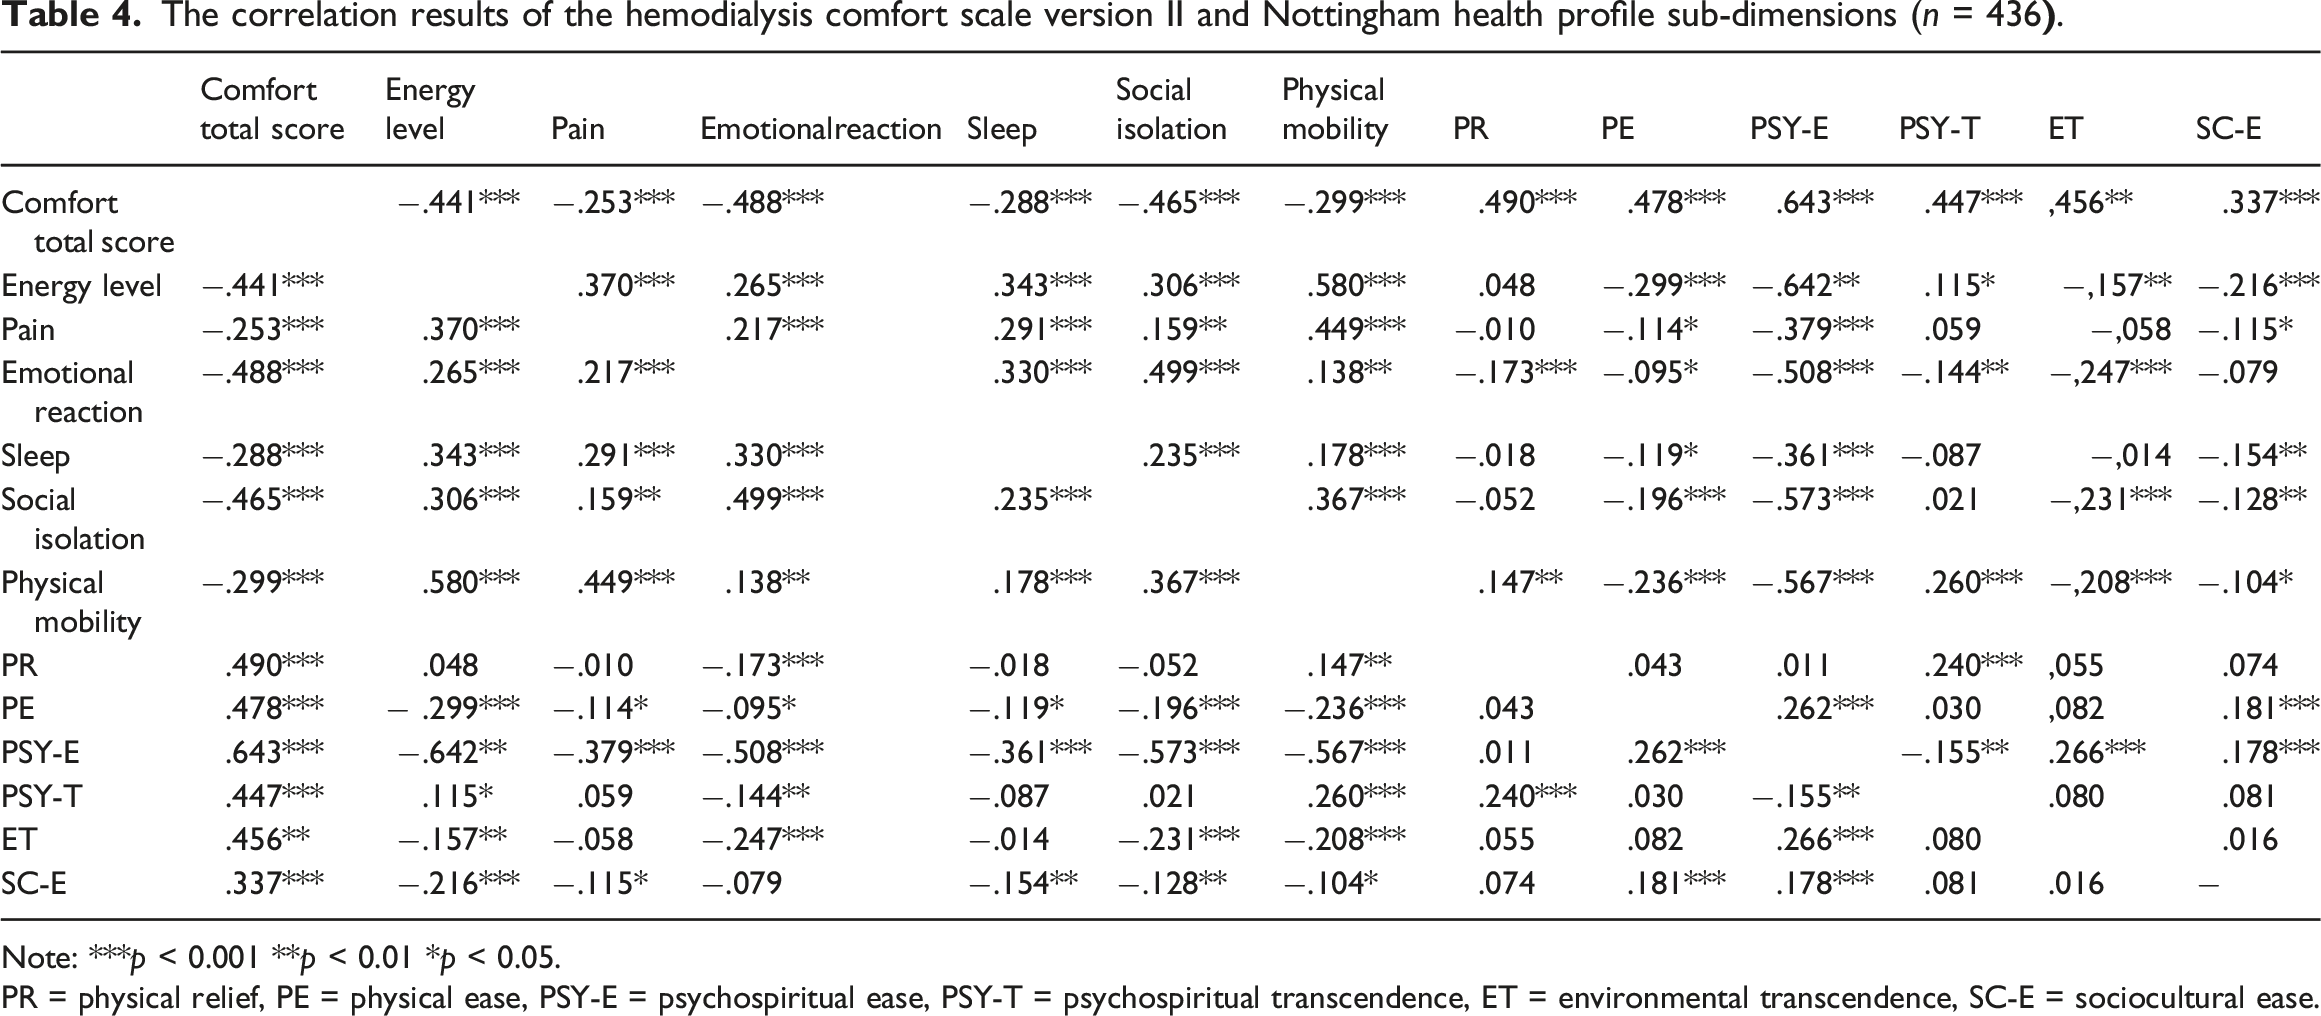
Note: ***p < 0.001 **p < 0.01 *p < 0.05.
PR = physical relief, PE = physical ease, PSY-E = psychospiritual ease, PSY-T = psychospiritual transcendence, ET = environmental transcendence, SC-E = sociocultural ease.
Item analysis according to lower upper group differences
In order to determine the discriminating power of the items of the scale, independent group t-test was applied to the groups which constituted the lower and upper 27%. As a result of the independent group t-test, a significant difference was found between the upper and lower group mean scores of all items (p < 0.01). Thus the scale was found to have discriminating power in measuring comfort in HD patients. (Table 3).
Parallel form reliability
For the parallel form reliability, the correlation between the HDCS-Version II and sub-dimensions of Nottingham Health Profile was examined. There were significant correlations between the HDCS-Version II and the sub-dimensions of the Nottingham Health Profile with regard to Energy Level (r = −0.441 p < 0.001), Pain (r = −0.253 p < 0.001), Emotional Reactions (r = −0.488 p < 0.001), Sleep (r = −0.288 p < 0.001), Social Isolation (r = −0.465 p < 0.001), and Physical Mobility (r = −0.299 p < 0.001) (Table 4).
Validity analysis of the hemodialysis comfort scale version II
Exploratory factor analysis
The convenience of the scale items for factor analysis was determined with Kaiser-Meyer-Olkin (KMO = 0.817) and Bartlett tests (X2 = 5349.386, df = 32, p < 0.001). Accordingly, the scale items were found to be appropriate for factor analysis. In EFA, 25% varimax rotation method was used to release the items and to ensure that they get distributed to sub-dimensions. According to EFA, six factors were found to explain 65.23% of the total variance. The eigenvalues of the factors were 1 or over. The factor loads ranged from 0.432 to 0.823 (Table 4).
Confirmatory factor analysis
According to the results of confirmatory factor analysis (CFA), the values for the fit indices of the scale were found as follows: x2/df = 2.707-good fit; RMSEA = 0.06-good fit; GFI = 0.873-adequate fit; AGFI = 0.848-acceptable fit; and CFI = 0.902-good fit. According to CFA, the factor loads ranged from 0.405 to 0.901.
As a result of the analyses, a 5-point Likert type scale with 26 items was obtained. The majority of the items were negative. The negative items were scored from 1 to 5, while the positive ones were scored from 5 to 1. Comfort increases as the scale score increases, whereas comfort decreases as the scale score decreases. The minimum and maximum scores that can be obtained from the entire scale range between 26 and 130. In addition, sub-dimension scores range between 4 and 20 for PR, PE, and PSY-T; 9–45 for PSY-E; 2–10 for ET; and 3–15 for SC-E, respectively. As the score approaches 130, the comfort level increases.
Discussion
Content validity of hemodialysis comfort scale version II
Content validity index was calculated for 87 items according to the opinions obtained from 11 experts. M-KGO varied between 0.81 and 1.00, while O-KGO ranged between 0.99 and 1.00 in terms of relationship, simplicity, and comprehensibility. According to the content validity index evaluation in the literature, I-CVI value of less than 0.78 and S-CVI value of 0.90 and above is recommended when there are six or more experts (Polit & Beck, 2006). In the study, some items were modified based on expert opinions, but no item was removed from the scale. With the results of the pilot study, the questions were concluded to be clear and comprehensible. Sahin, Cinar, and Kartal (2015) reported that based on the opinions obtained from 11 experts, KGO was 0.72 for the 46-item HDCS. Thus according to all these findings content validity was achieved.
Reliability of hemodialysis comfort scale version II
In the reliability analyses, Cronbach’s alpha coefficient is calculated when the measurement tool has a Likert type structure. According to the evaluation criteria, the reliability interpretation of the coefficient is as follows: 0 < α < 0.40, not reliable; 0.41 ≤ α < 0.60, poor reliability; 0.61 ≤ α < 0.80, quite reliable; 0.81 ≤ α < 1.00, highly reliable (Baydur & Eser, 2006; Tavsancıl, 2006; Buyukozturk, 2010). Cronbach’s Alpha coefficient of HDCS-Version II was 0.79, and it is considered to be quite reliable. The alpha values for the sub-dimensions were determined to be PR, highly reliable with 0.83; PE, quite reliable with 0.71; PSY-E, highly reliable with 0.87; PSY-T, highly reliable with 0.85; ET, highly reliable with 0.82; and SC-E, quite reliable with 0.61, respectively (Table 4). Given the basic view that the internal consistency coefficient is based on, these findings indicated that the items in the scale were homogeneous and the scale consisted of consistent items that measured the elements of the same property. Cronbach’s alpha coefficients of the HDCS was 0.87 and sub-dimensions of HDCS (relief, ease, and transcendence) were 0.87, 0.85, and 0.88, respectively (Sahin & Cinar, 2017). These values were observed to be close to the values of HDCS-Version II. Freitas et al. (2015), stated that Cronbach’s alpha coefficients of comfort scale for relatives of people in critical states of health was 0.92, Ustundag and Eti Aslan (2010), indicated that Cronbach’s alpha coefficients of Perianesthesia Comfort Questionnaire was 0.83, Dowd et al. (2006) showed that Cronbach’s alpha coefficients of Healing Touch Comfort Questionnaire was 0.94, Karakaplan and Yıldız (2010) stated that Cronbach’s alpha coefficients of Postpartum Comfort Questionnaire was 0.78; Alemdar and Tufekci (2015), indicated that Cronbach’s alpha coefficients of Premature Infant Comfort Scale was 0.88, Kahraman et al. (2014), showed that Cronbach’s alpha coefficients of Newborn Comfort Behavior Scale was 0.85. It is seen that the cronbach’s alpha value of HDCS-II is lower than the cronbach alpha values of the comfort scales of other populations except Postpartum Comfort Questionnaire. It is thought that this may be due to the fact that the sample of our study consisted of individuals with chronic disease, unlike other studies.
Another method that demonstrates the internal consistency of a scale is item analysis. Item-total score correlation should not be negative and should be greater than 0.25. Items with a coefficient value of less than 0.20 should not be included in the test (Sencan, 2005; Tavsancıl, 2006; Capık et al., 2018). According to the item analysis results of HDCS-Version II, the item-total score correlations were found to range from 0.262 to 0.646 (Table 3). The correlation coefficients between the subscale item scores and subscale total scores were determined to range between 0.681-0.902 for PR, 0.719–0.785 for PE, 0.615–0.749 for PSY-E, 0.764–0.871 for PSY-T, 0.917–0.931 for ET, and 0.741–0.856 for SC-E, respectively (Table 4). According to these findings and the literature, since all items had a correlation coefficient of greater than 0.25, the items can be said to measure similar properties in the category that they belong to. Each item score in the scale makes up the total score. On the other hand, Orak, Pakyuz, and Kartal (2017) reported that the item-total score correlations ranged between 0.45 and 0.74 for the 9-item version of HDCS, between 0.51 and 0.77 for the "transcendence"factor, and between 0.55 and 0.90 for the "ease" factor. In a research, item-total correlations of comfort scale for relatives of people in critical states of health was between 0.311 and 0.670 (Freitas et al., 2015). In another research, item-total correlations of Perianesthesia Comfort Questionnaire was ranged from 0.30 to 0.62 (Ustundag & Eti Aslan, 2010). Dowd, Kolcaba and Steiner (2006) stated that item-total correlations of Healing Touch Comfort Questionnaire was minimum, 0.28 and maximum 0.77. Karakaplan and Yıldız (2010) indicated that item-total correlations of Postpartum Comfort Questionnaire was between 0.20 and 0.44. Alemdar and Tufekci (2015), stated that item-total correlations of Premature Infant Comfort Scale was ranged from 0.55 to 0.92. Kahraman et al. (2014), stated that item-total correlations of Newborn Comfort Behavior Scale was minimum 0.53 and maximum 0.75. It is seen that the findings of our research about item-total correlation is similar with item-total correlations of the other scales in the literatur.
Hemodialysis Comfort Scale Version II was also tested with an item analysis based on the difference between lower upper group mean scores to determine how satisfactory the scale was in discriminating between individuals in terms of comfort in patients receiving hemodialysis treatment. Accordingly, for all test items, a significant difference at p < 0.05 was determined between the upper and lower group means of the scores obtained from the items (Table 3). The scale was observed to have a discriminating power in terms of measuring comfort in patients receiving hemodialysis treatment, which was shown between the high and low scores obtained from the scale (Buyukozturk, 2010). In the literature, other methodological comfort scale researches did not reveal any findings about lower upper group item analysis.
One of the reliability analysis methods employed in the study was parallel form reliability. To do this, parallel forms are administered to the same group under the same conditions synchronously and then the correlation coefficient between the two forms is calculated. The higher the coefficient, the more equivalent the scale is (Sencan, 2005; Tavsancıl, 2006). For the parallel form reliability in our study, the correlation of the scale with the sub-dimensions of the Nottingham Health Profile was analyzed. Significant correlations were found between HDCS-Version II with the sub-dimensions of Nottingham Health Profile such as energy level (r =-0.441, p <0.001), pain (r = −0.253, p <0.001), emotional reaction (r =-0.488, p <0.001), sleep (r =-0.288, p <0.001), social isolation (r = −0.465, p <0.001), and physical mobility (r =-0.299, p <0.001), respectively (Table 4). The decrease in the mean score of the sub-dimensions in the NHP means that the feature evaluated in that sub-dimensions has improved. In this study, it was concluded that as comfort score increased, sub-dimension scores of NHP decreased. In this case, it is possible to say that while patient comfort increases, energy level, pain, emotional reaction, sleep, social isolation, and physical mobility are improved. Accordingly, parallel form reliability has provided. In a study, it is stated that there was a negative correlation between Perianesthesia Comfort Questionnaire and State-Trait Anxiety Scale as expected. Accordingly, it was determined that the anxiety level decreased as the comfort level of the patients increased (Ustundag & Eti Aslan, 2010). In another study, it is specified that there was a negative correlation between hemodialysis comfort scale and State-Trait Anxiety Inventory. According to this; As comfort scores increase, anxiety scores decrease (Sahin & Cinar, 2017).
Construct validity of hemodialysis comfort scale version II
Exploratory factor analysis was employed to check the construct validity of the scale. As a result of EFA, the Kaiser-Meyer-Olkin coefficient (KMO), which is a measure of how suited your sample size is for factor analysis, was found 0.817. Given the interpretation of KMO (0.00–0.49 unacceptable; 0.50–0.59 miserable; 0.60–0.69 mediocre; 0.70–0.79 middling; 0.80–0.89 meritorious; and 0.90–1.00 marvelous), the sample size was evaluated as adequate for factor analysis (Tavsancıl, 2006). The result of the Barlett test (x2 = 5349.386; p = 0.000), which determines the significance of correlation coefficients between variables and evaluates the suitability of the data set for factor analysis, was found significant, the data set was determined to be suitable for factor analysis (Tavsancıl, 2006). Freitas, Menezes and Mussi (2015), indicated that the KMO was 0.85. Karakaplan and Yıldız (2010) stated that KMO value was 0.64 and the result of Barlett test was p < 0.05. Alemdar and Tufekci (2015) showed that the KMO was 0.86 and Barlett test was p < 0.001. Orak, Pakyuz and Kartal (2017) indicated that KMO result was 0.77 and Barlett test was p < 0.001.
The eigenvalue coefficient is used in calculating the proportion of the variance explained by each factor and in deciding the number of factors. The higher the proportion of variance obtained is, the stronger the factor structure of the scale is (Tavsancıl, 2006; Buyukozturk, 2010). In studies conducted in social sciences, variance rates between 40% and 60% are considered to be adequate (Sencan, 2005). The total variance explained in our study was 65.234%, which was in line with this view.
The relationship of items with factors is explained by the factor loading value (Sencan, 2005). Studies report that factor loadings ranging between 0.30 and 0.40 can be taken as a cut-off point in creating the factor pattern (Tavsancıl, 2006). In this study, the factor loadings of the 26 items of the scale were observed to range from 0.432 to 0.823 and provide the desired values (Table 4). In the Hemodialysis Comfort Scale developed by Sahin, Pakyuz, and Kartal (2017), there were two factors explaining 67.27% of the total variance, and the factor loadings ranged from 0.53 to 0.95. Freitas et al. (2015), reported that the total explained variance of comfort scale for relatives of people in critical states of health was %63. Karakaplan and Yıldız (2010), stated that the total explained variance of Postpartum Comfort Questionnaire was %30 and the factor loads were changed between 0.33 and 0.79. Alemdar and Tufekci (2015), indicated that the total explained variance of Premature Infant Comfort Scale was %57,76 and the factor loads were minimum 0.65 and maximum 0.86. The findings of the current study were found to be similar to those of Sahin et al. (Sahin & Cinar, 2017) and the other studies (Karakaplan &Yıldız, 2010; Alemdar &Tufekci, 2015; Freitas et al., 2015).
Confirmatory factor analysis assesses whether the correlation of the items making up a factor with that factor is adequate (Sencan, 2005; Capık et al., 2018). Confirmatory factor analysis is a method based on the evaluation of fit indices that show the fit between data and the construct (Baydur & Eser, 2006; Erkorkmaz et al., 2013; Kaynak, 2012; Yılmaz, 2004). In our study, the factor constructs determined by EFA were supported by confirmatory factor analysis. According to CFA, the factor loadings of HDCS-Version II were observed to range between 0.405 and 0.901 and all factor loadings were found to be greater than 0.30.
The fit indices of the scale were determined to be x2/df = 2.707, RMSE = 0.06; GFI = 0.873; AGFI = 0.848; and CFI = 0.902, respectively. Since the proportion of x2/df value less than three indicates a good fit, a RMSEA value between 0.5 and 0.8 indicates a good fit, a GFI value equal to or greater than 0.85 shows adequate fit, an AGFI value equal to or greater than 0.80 shows an acceptable fit, and a CFI value equal to or greater than 0.90 lays out a good fit, the model was observed to have a good fit (Baggozi and Yi, 2012; Baydur & Eser, 2006; Erkorkmaz et al., 2013; Kline, 2005; Kaynak, 2012; Sencan, 2005; Steiger, 2007; Steven, 2009; Yılmaz, 2004).
Limitations
In the comfort theory which constitutes the basic structure of the scale, Kolcaba expressed comfort as a theory with three stages (relief, ease, and transcendence) and four components (physical, psychospiritual, environmental, and sociocultural) and showed this in a cross table. In this case, 12 sub-dimensions are expected to emerge, but six sub-dimensions have emerged in our scale (Physical Relief, Physical Ease, Psychospiritual Ease, Psychospiritual Transcendence, Environmental Transcendence, and Sociocultural Ease). This was the limitation of our scale development work. However, the six available sub-dimensions still account for 65.23% of the total scale.
Conclusion and recommendation
Based on the findings of the reliability and validity studies, the 26-item Hemodialysis Comfort Scale Version II was found to be a valid and reliable measurement tool. It can be used to evaluate the comfort status of patients undergoing hemodialysis treatment for at least 3 months. While HDCS is composed of nine items, HDCS-Version II consists of twenty-six items. HDCS evaluates comfort with two sub-dimensions (ease and transcendence), while HDCS-Version II has six sub-dimensions (physical relief, physical ease, psychospiritual ease, psychospiritual transcendence, environmental transcendence, and sociocultural ease). In addition to evaluating the comfort status of HD patients, the scale can also be recommended for evaluating the effectiveness of interventions that aims to improve comfort.
HDCS-II has sufficient validity and reliability to evaluate comfort in patients receiving hemodialysis treatment. HDSC-II is a 5-point likert type scale consisting of 26 items and six sub-dimensions. HDCS-II evaluates the comfort of patients with its six sub-dimensions (physical relief, physical ease, psychospiritual ease, psychospiritual transcendence, environmental transcendence, and sociocultural ease). These available six sub-dimensions explain 65.23% of the total scale. HDCS-II, can be used to evaluate the effectiveness of the interventions to increase comfort.Key points for policy, practice and/or research
Footnotes
Acknowledgements
As a research team, we would like to express our gratitude to all patients who participated in the study and to all institutions that gave permission to practice.
Declaration of conflicting interests
The author(s) declared no potential conflicts of interest with respect to the research, authorship, and/or publication of this article.
Ethical approval
In order to carry out the research, written permission was obtained from Celal Bayar University Local Ethics Committee (Decision date: 03/01/2018; Decision number: 20.478.486), Merkezefendi State Hospital, and Private Anemon, Can, Reniz and Diyatrans Dialysis Centers. The conduction of the study complied with universal ethical principles. Accordingly, the principles informed consent, autonomy, benefit, confidentiality, and equality were taken into considerations in the study. The aim of the study was explained to the patients via verbal and informative forms and the written patient consent was obtained.
Funding
The author(s) disclosed receipt of the following financial support for the research, authorship, and/or publication of this article: Financial project support was received from the Scientific Research Projects Unit of Celal Bayar University (2018-084) in the research.