
Abstract
The outcome of a graduate student’s hunt for employment is often attributed to the student’s own accomplishments, the reputation of the department, and the reputation of the university. In 2007, a national survey of psychology graduate students was conducted to assess accomplishments and experiences in graduate school, part of which was an assessment of employment after completion of the doctorate (PhD). Five hundred and fifty-one respondents who had applied for employment reported whether they had obtained employment and in what capacity. Survey results were then integrated with the National Research Council’s most recent official ranking system of academic departments. The strongest predictor of employment was department-level rankings even while controlling for individual accomplishments, such as publications, posters, and teaching experience. Equally accomplished applicants for an employment position were not equal, apparently, if they graduated from differently ranked departments. The results also show the degree to which school-level rankings, department-level rankings, and individual accomplishments uniquely predict the various types of employment, including jobs at PhD-granting institutions, master’s-granting institutions, liberal arts colleges, 2-year schools, outside academia, or no employment at all.
Every year, psychology doctoral (PhD) students on the cusp of graduation undergo the arduous task of finding a job. What does it take to get those jobs? To what degree do academic accomplishments increase the actual odds of employment? A well-known phrase in academia is “You are your CV” (Lord, 2004). The current article puts that phrase to the test by reporting on a national survey of job-seeking psychology graduate students concerning their accomplishments and experiences in graduate school, including number of publications, posters, and teaching experiences.
However, graduate students’ accomplishments are not the only thing conveyed on a curriculum vitae (CV); students are the products of specific graduate departments at specific universities. Thus, this article also reports the degree to which the quality of the department is associated with employment by matching our survey results with the National Research Council’s recently released “Data-Based Assessment of Research-Doctorate Programs” (or “NRC data” henceforth). The National Research Council (NRC) is a research arm of the United States National Academies and was formed in 1916 to provide public policy recommendations and dissemination of scientific information (History of National Academies, n.d.). Every 10 years the NRC is charged with conducting the preeminent assessment of doctoral programs in the United States in order to “assess the quality and effectiveness of doctoral programs based on measures important to faculty, students, administrators, funders, and other stakeholders” (National Academies Press, n.d., para.1). Through a multilevel data collection process, the NRC completed its most recent ranking of 5,000 programs in 62 fields at 212 institutions in 2011 (National Research Council, n.d.). After years of compiling and processing the data that were collected from the fall of 2006 to the fall of 2007 for the 2005–2006 academic year, the newly released data allow us to integrate the NRC’s department-level ranking system with our national survey that was conducted during the same period in 2007. Using these data, we were able to estimate the role of department reputation in job placement and the degree to which equally accomplished applicants are really equal if they graduated from differently ranked departments.
In addition to matching the individual-level data and department-level data, the other purpose of the current article was to match both with school- or university-level data to provide a comprehensive understanding of what predicts employment after completion of the PhD. Compiled by the Carnegie Foundation since the 1970s, the Carnegie Classification of Institutions of Higher Education (Carnegie) ranks every degree-granting college and university in the United States (Carnegie Foundation for the Advancement of Teaching, n.d.). Integrating the Carnegie ranking system with the NRC data and our national survey provides us with the ability to assess the unique predictive power of each level while controlling for the others in order to determine what best predicts employment in the data sets: individual accomplishments, department reputation, or school reputation. In addition, it is possible to identify whether each of the three variables differentially predicts whether the respondents obtained certain employment categories, such as jobs at PhD-granting institutions, master’s-granting institutions, liberal arts schools, 2-year colleges, or employment outside academia. Given that different applicants may have different employment desires and that employment positions assign different value to research productivity and teaching experience, to what degree does each provide advantage for the different employment categories? The current article is the first to use empirical data to examine these issues.
Graduate Student Survey
Participants were 551 graduate students (171 men and 379 women) in psychology PhD programs in the United States and Canada. The participants were recruited via an e-mail sent to the contact person of each psychology graduate department listed in the American Psychological Association book Graduate Study in Psychology (American Psychological Association, 2007) and also sent directly to the e-mail addresses of graduate students listed on the department Web sites of programs listed in the same book. The e-mail to the contact persons requested that they forward the survey link to all graduate students within their department. Data were collected between May and June 2007. The current data set contains only the 551 respondents who indicated they had recently applied for employment after completing the PhD (out of the 4,162 respondents who completed the survey). 1
Participants completed a 35-question measure that surveyed the type of program (master’s, PhD), their current year in the program, area of specialization, school name, research-related activity, experiences in graduate school, and employment (see Table 1). 2 The question about employment asked, “For those who have already applied for jobs, have you successfully obtained employment?” The option choices were (a) no; (b) yes, at a PhD-granting school with primary focus on research (PhD granting-1); (c) yes, at a PhD-granting school that has less focus on research (PhD granting-2); (d) yes, at a master’s-granting school; (e) yes, at a liberal arts school; (f) yes, at a 2-year school (e.g., community college); (g) yes, outside academia. We split the “PhD-granting institution” options into two parts to examine whether the level of research focus of the institution related to research-related accomplishments from the survey, such as publications and posters. As part of the same question, participants were then asked how many jobs they had applied for both within academia and outside of academia.
Individual-Level Survey Items
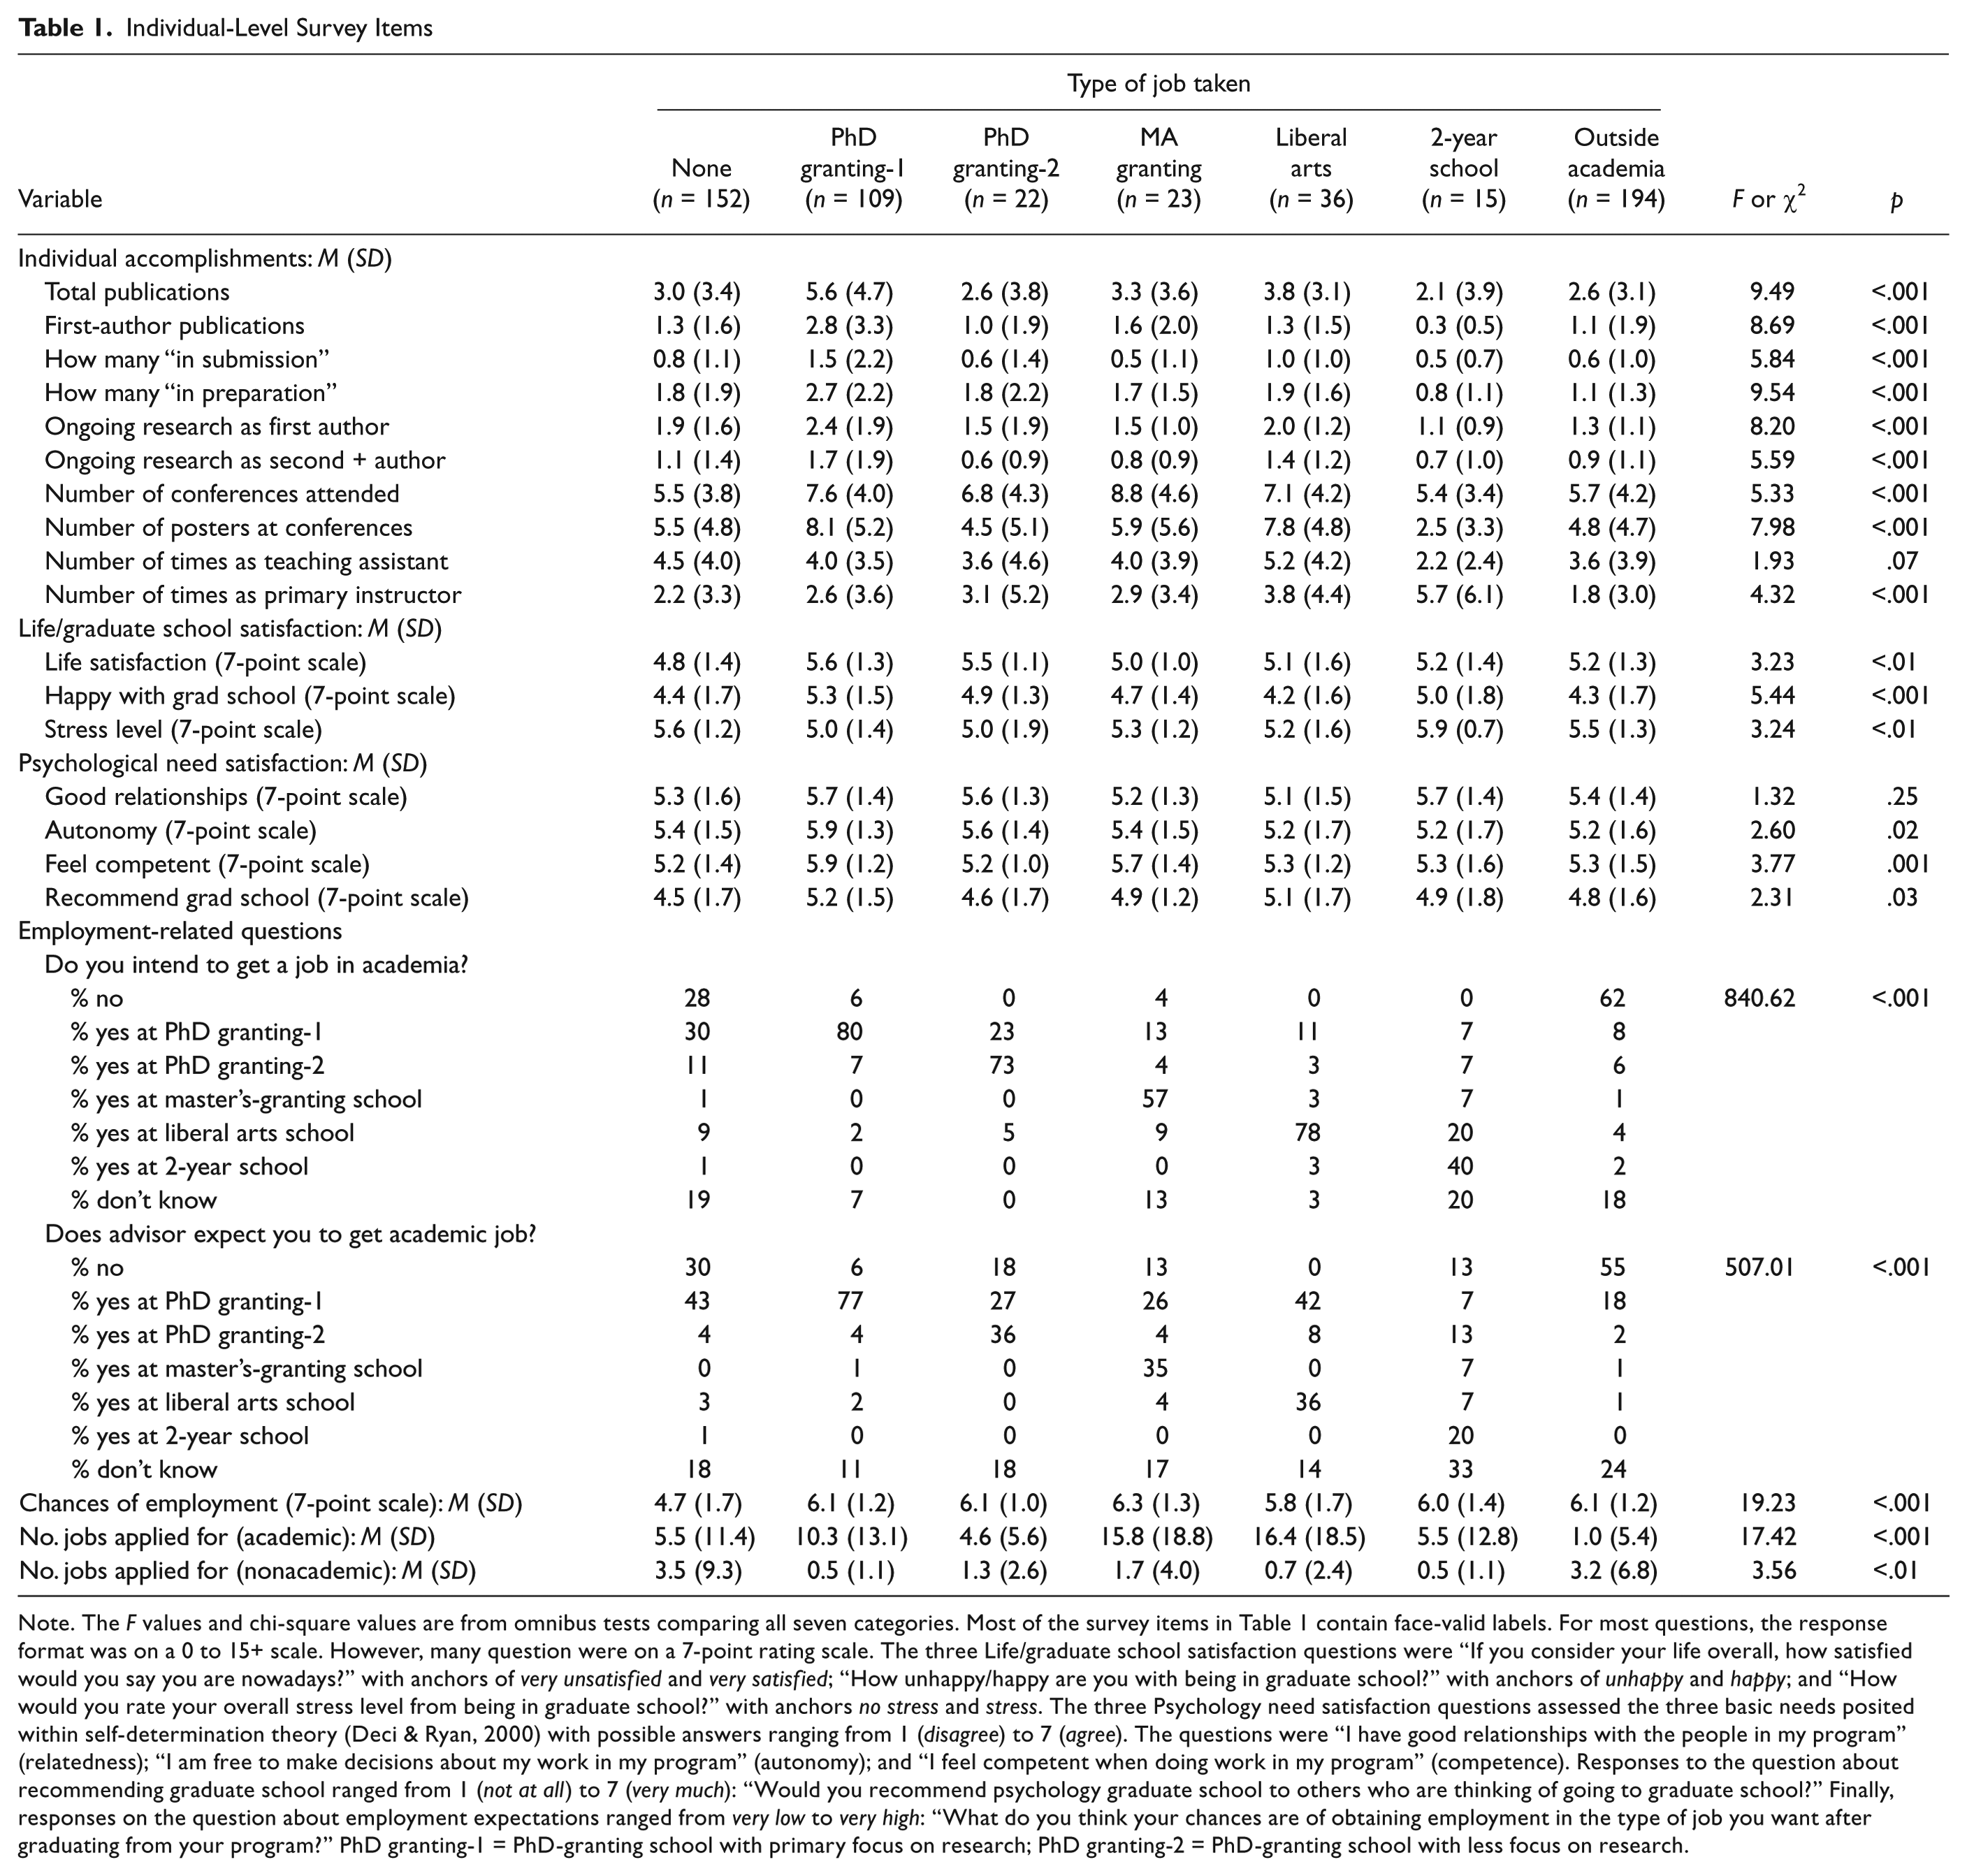
Note. The F values and chi-square values are from omnibus tests comparing all seven categories. Most of the survey items in Table 1 contain face-valid labels. For most questions, the response format was on a 0 to 15+ scale. However, many question were on a 7-point rating scale. The three Life/graduate school satisfaction questions were “If you consider your life overall, how satisfied would you say you are nowadays?” with anchors of very unsatisfied and very satisfied; “How unhappy/happy are you with being in graduate school?” with anchors of unhappy and happy; and “How would you rate your overall stress level from being in graduate school?” with anchors no stress and stress. The three Psychology need satisfaction questions assessed the three basic needs posited within self-determination theory (Deci & Ryan, 2000) with possible answers ranging from 1 (disagree) to 7 (agree). The questions were “I have good relationships with the people in my program” (relatedness); “I am free to make decisions about my work in my program” (autonomy); and “I feel competent when doing work in my program” (competence). Responses to the question about recommending graduate school ranged from 1 (not at all) to 7 (very much): “Would you recommend psychology graduate school to others who are thinking of going to graduate school?” Finally, responses on the question about employment expectations ranged from very low to very high: “What do you think your chances are of obtaining employment in the type of job you want after graduating from your program?” PhD granting-1 = PhD-granting school with primary focus on research; PhD granting-2 = PhD-granting school with less focus on research.
Note that we did not include postdoctoral positions as a type of employment. Future research could examine the characteristics or determinants of why some individuals choose postdoctoral research employment compared with other types of employment and whether completing a postdoc helps applicants obtain other types of employment. As the current study did not explicitly assess whether the respondents were post-docs, it is possible that some post-docs responded affirmatively to the question asking whether they were in a PhD program, and were thus included in the analysis. That said, post-docs are competing for the same jobs and thus are part of the same applicant pool for the employment positions investigated in this study.
What percentage of people obtained each type of employment?
Of the 551 people who applied for jobs, 205 obtained academic jobs (37.2%), 194 secured nonacademic employment (35.2%), and 152 did not find employment (27.6%). Thus, roughly one third of the sample fell into each type. Although we did collect employment data from master of arts (MA) students, the current study contains only PhD students because the employment options were designed for that sample. For those who obtained academic employment, the breakdown within each academic category was 109 (53.2%) for employment at PhD granting-1, 22 (10.7%) for PhD granting-2, 23 (11.2%) for MA granting, 36 (17.6%) for liberal arts, and 15 (7.3%) for 2-year schools.
What are the average qualifications of each employment type?
Table 1 displays the characteristics and accomplishments of those who successfully obtained employment in each job type. Reporting the sample sizes, means, and standard deviations in Table 1 provides all the essential components for the reader to calculate pairwise comparisons of significance and effect sizes. We provide the omnibus F value for the reader to identify whether or not between-group differences exist across the seven employment categories. Given the wealth of data, there is no way to present every possible combination of analyses, and different readers may be particularly interested in different aspects of the data. However, we describe some analyses of interest below.
The columns for each employment category in Table 1 provide information about the characteristics of those who secured each type of employment. For example, the average qualifications of a student who secured a job at a PhD granting-1 institution were five to six total publications, two to three of which were first-author publications, with between one and two “in submission” and another two to three “in preparation.” That student also attended between seven and eight conferences while in the PhD program and presented a poster the same number of times. In terms of teaching experience, that student was a teaching assistant only four times and was the primary instructor in a course between two and three times.
Graduate students seeking jobs are most likely interested in the data on those two things for which they commonly have to write statements: research and teaching. Regarding published research, the total number of publications differentiated between employment at PhD granting-1 institutions only compared with most other academic employment categories. A Tukey post hoc test found that students who secured jobs at PhD granting-1 institutions had significantly more publications that those who ended up at PhD granting-2 institutions, 2-year schools, outside academia, or with no employment (p < .01) and marginally more than those at MA-granting institutions (p = .075). The other academic employment categories, however, were not significantly different from each other in terms of total number of publications. Thus, the number of publications appears to play a role in employment placement at PhD granting-1 institutions; beyond securing a position at this type of university, the number of publications appears unassociated with the other forms of job placement.
In terms of teaching experience, given that some of the employment positions focus more on teaching than on research, we wondered whether experience as a teacher differentiates type of employment. A Tukey post hoc test found that among the academic employment categories, the only significant difference for the number of times as the primary course instructor was between PhD granting-1 and 2-year schools (p = .03); none of the other employment categories differed significantly in terms of the number of teaching positions held by students who secured the job. Being a primary course instructor more often was associated with securing the 2-year school job compared with a PhD granting-1 institution, but otherwise the extra effort to teach more courses did not show differences across employment categories. The correlation between total publications and number of times as a primary course instructor revealed a small and marginally significant association (r = .08, p = .07), thus suggesting a weak relationship between those two benchmarks of academic accomplishments.
Department- and School-Level Rankings
We integrated the NRC data on doctoral programs and the Carnegie data on schools with our data set by matching school name and program-relevant information provided by the respondents in all three data sets (see Appendix for details). In those data sets and in our analyses, lower numbers represent better rankings. The NRC report included both “dimensional” and weighted ranking for each department. The dimensional rankings involved three aspects of the departments: research activity (e.g., average number of publications per allocated faculty), student support and outcome (e.g., percentage of 1st-year students with full financial support), and diversity (e.g., percentage of female students). The complete list of all 14 aspects comprising the three dimensions is detailed on the NRC Web site (National Research Council, n.d.). The dimensional rankings were then factored into weighted rankings, which also included faculty ratings of programs and their characteristics. The current data analysis uses the weighted “R Rankings: 5th percentile” figure computed by the NRC using a statistical sampling technique that takes into account different types of variability in the data. (See Appendix for more details.)
Do department and school rankings predict employment?
Is it the reputation of a specific department within the school or the reputation of the entire school that is associated with the employment categories? The answer is both, but to different degrees. Table 2 reports the multinomial logistic regressions using employment (e.g., the seven employment categories from the survey) as the dependent variable. The department versus school multinomial logistic regression at the top of Table 2 shows an overall model that was significant (χ2 = 60.25, p < .001) and explained 21% of the variance, with each variable a predictor while controlling for the other. In other words, school-level reputation provided unique predictive power separate from the reputation of the psychology department within the school, and vice versa. Thus, a strong psychology department within an otherwise not well-ranked school may still provide substantial advantage for employment.
Multinomial Regressions
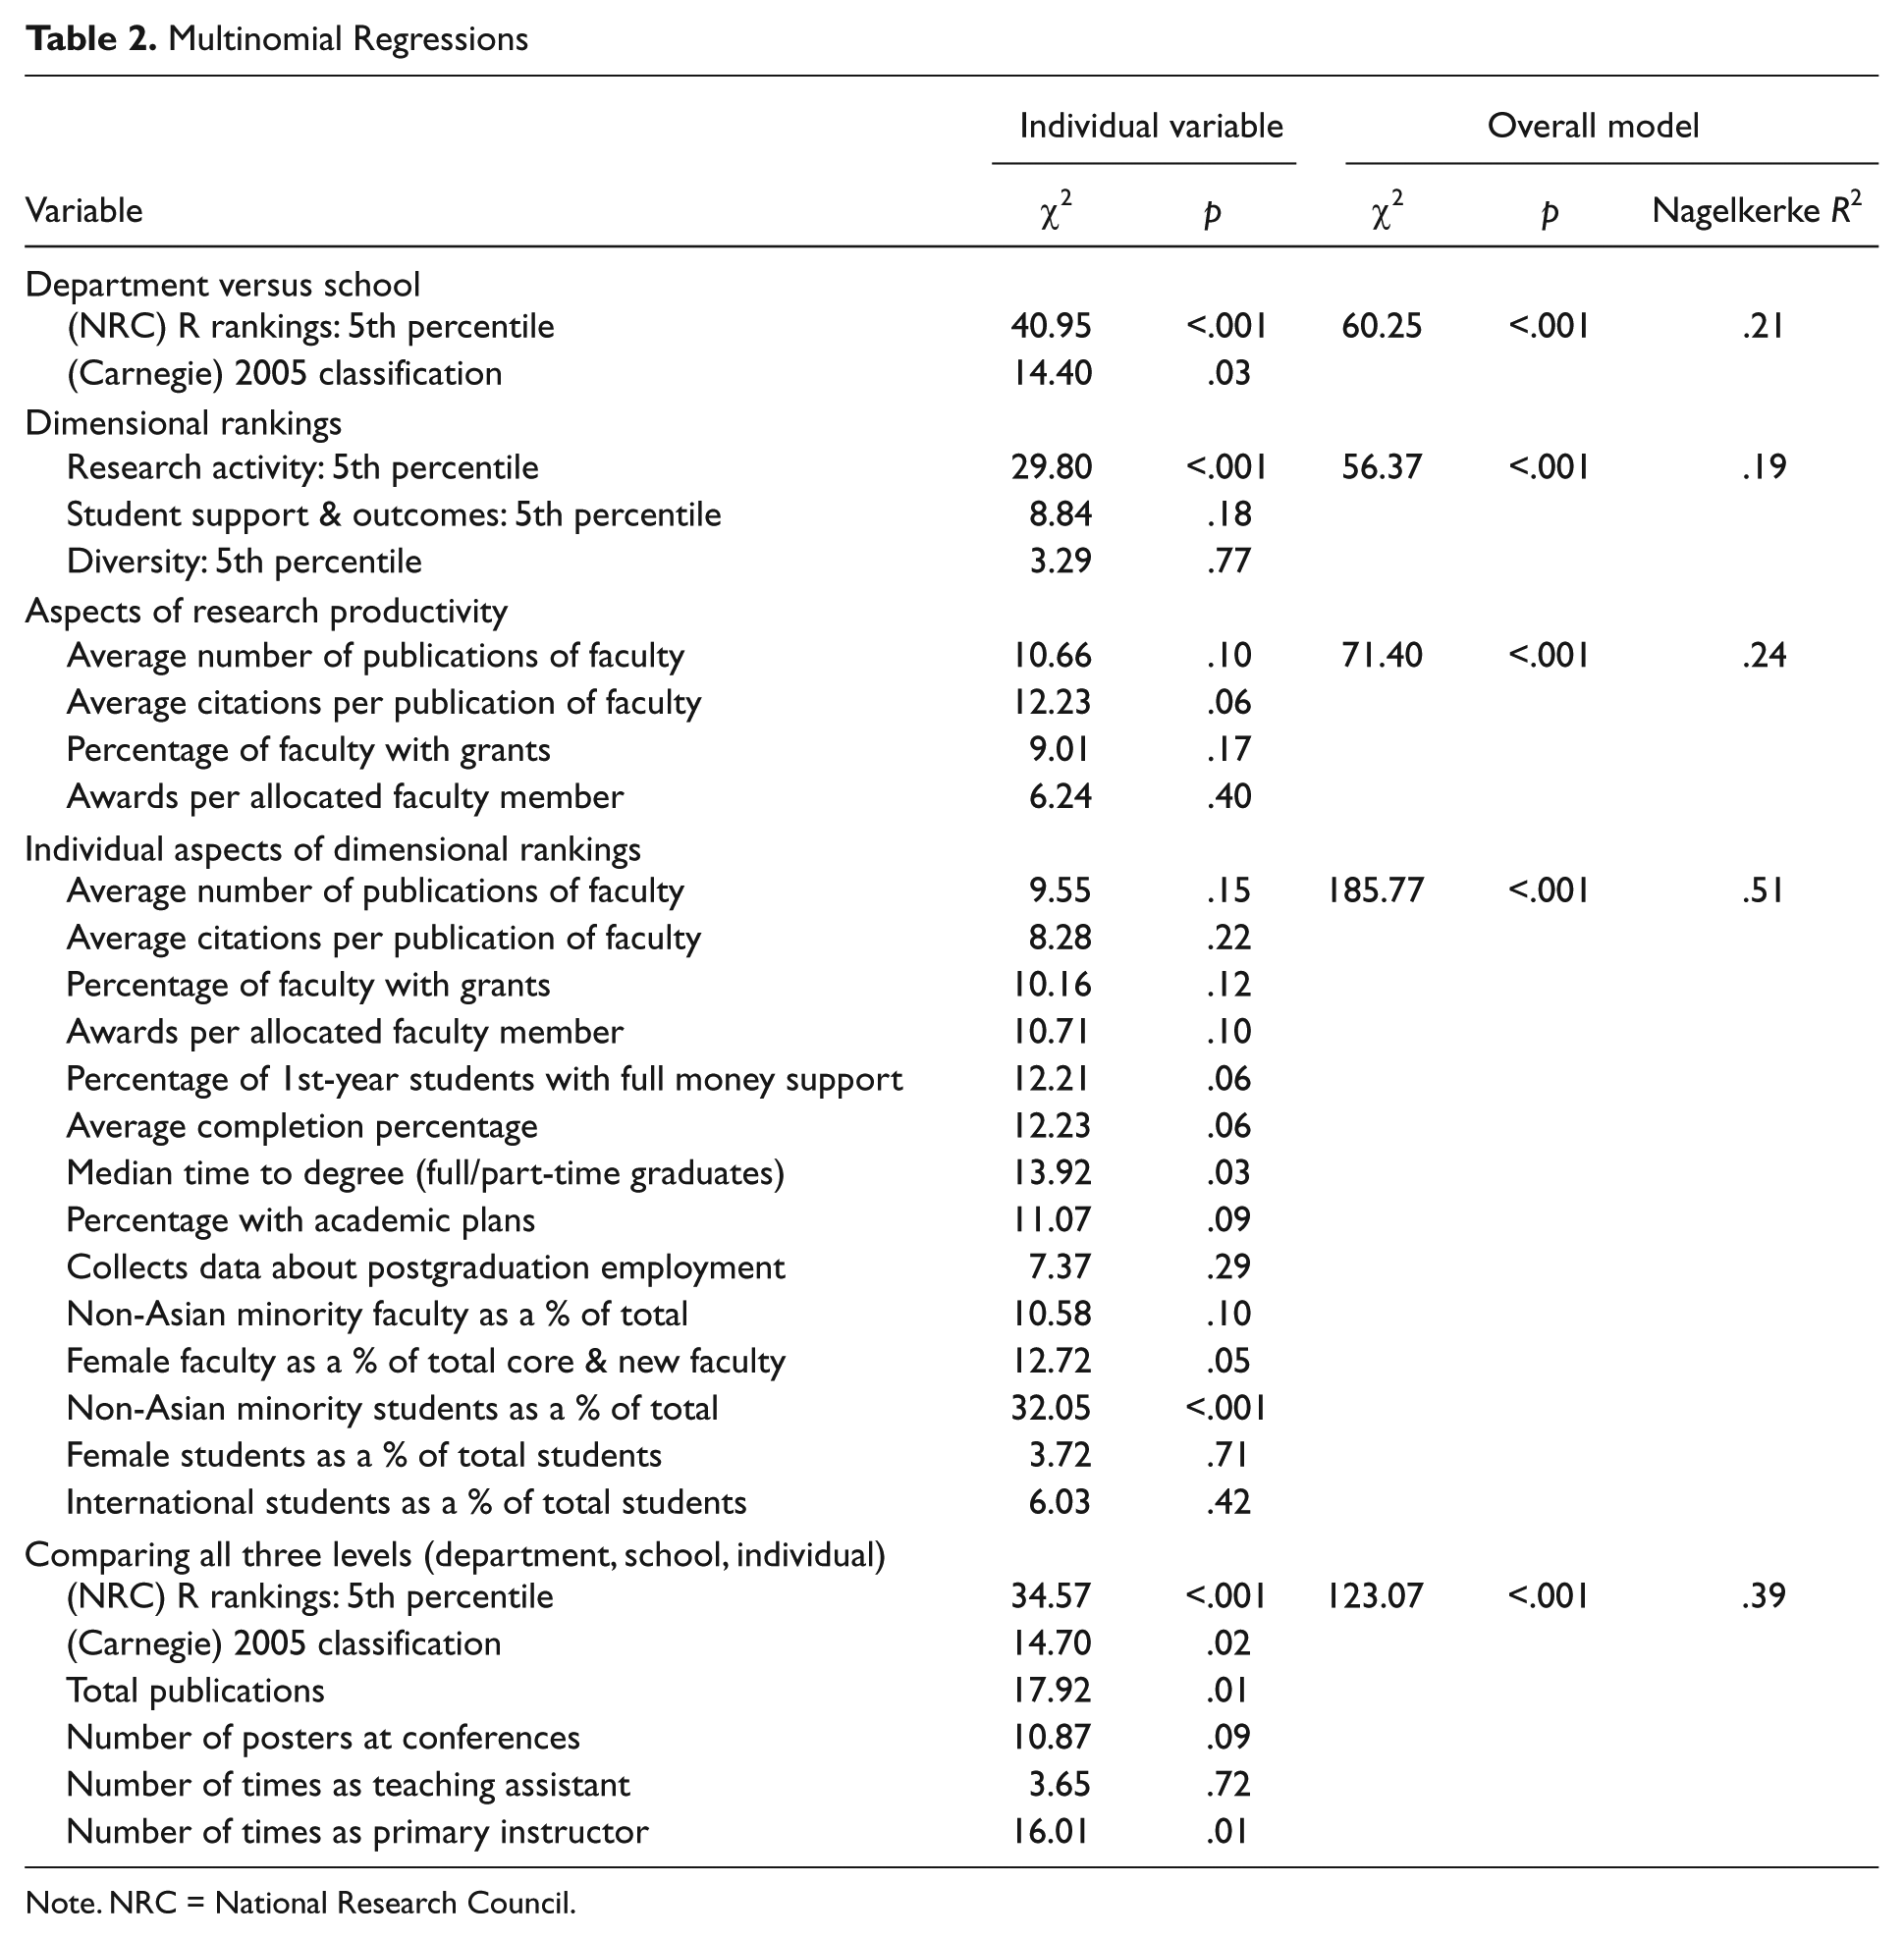
Note. NRC = National Research Council.
Another important question is whether the ranking of a department (R rankings) predicts each of the different job categories. Table 3 provides the analysis of each category for the R rankings.
Parameter Estimates for Multinomial Regression Using R Rankings: 5th Percentile
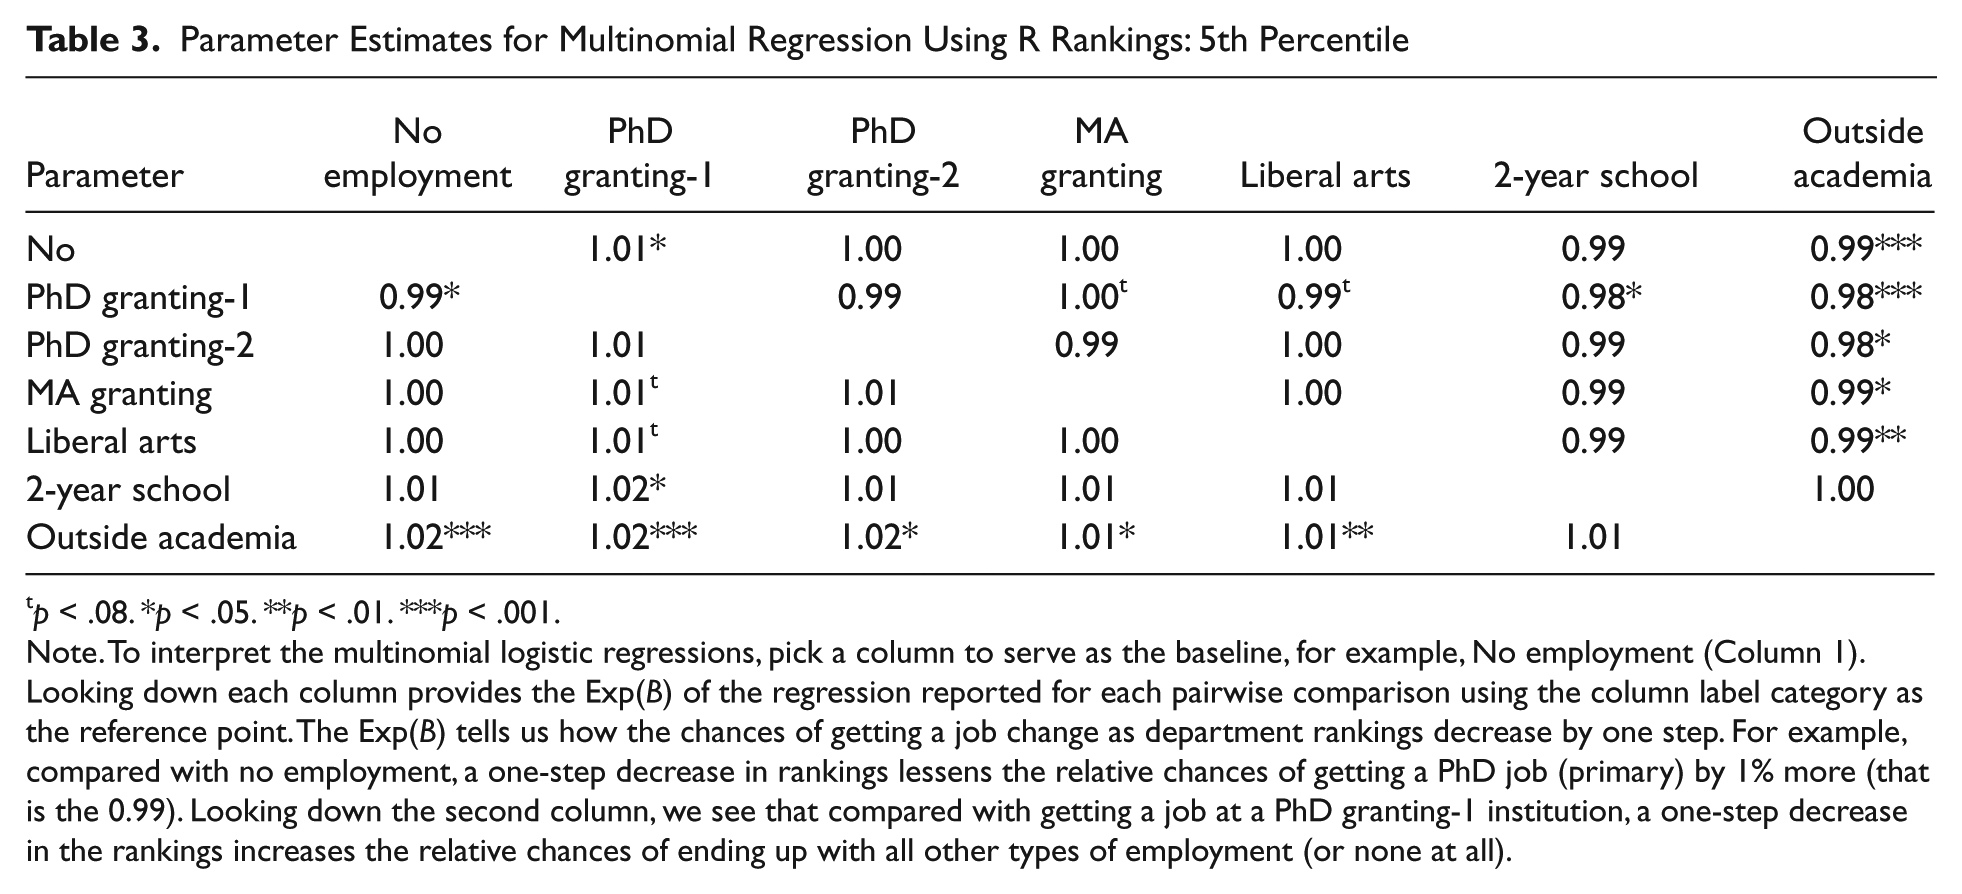
p < .08. *p < .05. **p < .01. ***p < .001.
Note. To interpret the multinomial logistic regressions, pick a column to serve as the baseline, for example, No employment (Column 1). Looking down each column provides the Exp(B) of the regression reported for each pairwise comparison using the column label category as the reference point. The Exp(B) tells us how the chances of getting a job change as department rankings decrease by one step. For example, compared with no employment, a one-step decrease in rankings lessens the relative chances of getting a PhD job (primary) by 1% more (that is the 0.99). Looking down the second column, we see that compared with getting a job at a PhD granting-1 institution, a one-step decrease in the rankings increases the relative chances of ending up with all other types of employment (or none at all).
The average applicant may be applying for many different types of positions, and different applicants may have different employment desires, so each comparison is represented in Table 3. The interesting aspect of Table 3 is that department rankings were not a significant predictor for most of the pairwise comparisons, and when they are significant predictors, the Exp(B) results are tightly located around 1.0. Another notable finding is that most of the effect is driven by the comparison to employment outside academia. Department rankings were a consistent predictor of increasing the odds of success in finding an academic job in comparison to a nonacademic job.
Department rankings were also predictive of finding employment at PhD granting-1 institutions compared with most other employment categories. Better department rankings increased the chances of obtaining a PhD granting-1 job compared with employment (a) at an MA-granting institution (i.e., one unit better ranking increases odds by 1%), (b) at a liberal arts institution (i.e., one unit better ranking increases odds by 1%), (c) at a 2-year school (i.e., one unit better ranking increases odds by 2%), and (d) outside academia (i.e., one unit better ranking increases odds by 2%).
A 1% change in odds is deceptively substantial because it is based on a one-unit change in rankings. So, for example, given that department rankings range from 1 to 225, if a department is 10–20 points better than another department, the odds are increased by 10%–20%. If a department is near the top of the rankings compared with a department near the middle that is 80–90 points away, the odds increase by 80%–90%.
Which aspects of program rankings predict employment categories?
Beyond predicting employment, a related question explores which particular aspects of program rankings predict aspects of employment. Is it due to the research productivity of the psychology departments? The second analysis in Table 2 reports the multiple multinomial logistic regression using all three dimensional variables—research productivity, student support, and diversity—as the predictor. The overall model was significant (χ2 = 56.37, p < .001) and accounted for 19% of the variance of predicting employment categories.
However, by themselves, only research productivity of a department predicted employment categories, whereas student support and diversity were not significant predictors of employment. High research-productive departments were associated with high levels of student support (with a correlation between those two dimensional rankings of .31, p < .001), but the latter did not itself predict employment. The fact that diversity was nonsignificant could be considered a positive and beneficial outcome, in that all the employment types were similar in their diversity rankings, with no particular employment type unequal from the others.
What exactly is “research productivity” and how does it predict employment categories?
“Research productivity” is composed of the average number of publications per allocated faculty, average citations per publication, percentage of faculty with grants, and awards per allocated faculty member. Table 2 shows the multiple multinomial logistic regression using all four predictors of research productivity. Average number of citations was the only predictor that is close to significant (p = .057). Faculty awards, grants, and total number of publications were not predictive of employment. Given that the number of faculty publications was not significant, whereas number of citations of those publications was significant (with a sizable correlation between the two: r = .53, p < .001), it may be the case that working in a highly productive research department (or with a highly productive research mentor) may not be as important as working in a highly cited department (or with a highly cited mentor). Quality may trump quantity. However, it is important to point out that the data sets do not include data at the level of individual faculty mentors, so future research should address the influence of productivity or reputation of individual faculty members and the degree to which different areas within a department with different reputations could impact hiring decisions.
Which individual aspects of the NRC rankings predict employment?
Although only research productivity was a significant predictor of employment categories, the three dimension rankings (research productivity, student support, and diversity) were created by normalizing the weights of the individual characteristics that compose each dimensional ranking, so another important multiple multinomial logistic regression was including all the individual unweighted characteristics that compose the rankings. Table 2 shows those results for all 14 aspects that compose the dimensional rankings listed under “Individual aspects of dimensional ranks” (the student support dimension comprises Variables 5–9, and the diversity dimension comprises Variables 10–14). Many of the individual characteristics of the dimensional rankings were significant or marginal, 3 and those characteristics combined explain half of the variance of predicting employment (Nagelkerke R2 = 51%).
Putting It All Together: Comparison of Individual Accomplishments and Department and School Rankings
Up to this point, we have discussed the individual accomplishments and the rankings separate from each other. In the multinomial logistic regression analysis, we also found that rankings predicted certain employment categories. Do the department rankings still predict employment after controlling for other variables, such as individual accomplishments? We explored this possibility by teasing apart whether attributes of the students themselves (e.g., number of papers, posters, prior teaching positions) or the reputation of the program or school predicts employment.
Which is the strongest predictor of employment: School reputation, department reputation, or individual accomplishments?
The answer is department reputation. The bottom of Table 2 reports a multiple multinomial logistic regression involving all three aspects: school level, department level, and individual level. For the individual level, we included the accomplishments from our survey that would be listed on a CV and evaluated by a hiring committee—publications, posters, teaching assistantships, and being the primary instructor in a course. The model was significant (χ2 = 123.07, p < .001) and explained 39% of the variance. Once again, it was possible to strongly predict employment by using these variables. The strongest predictor was R rankings of the NRC ranking system even while controlling for the other variables, including individual accomplishments. In other words, equally accomplished applicants for an employment position are not equal, apparently, if they graduated from differently ranked departments.
How much value does the reputation of the department provide beyond the individual achievements of the applicants, and vice versa? To address the unique predictive power of each variable in the analysis (i.e., rankings, publications, posters, teaching experience) for each employment category, we report multinomial logistic regressions in an online supplement (http://pps.sagepub.com/supplemental) that provides each pairwise comparison using that category as the reference point. One notable aspect of those multinomial regressions is that for R rankings as a predictor, fewer significant differences emerge among the pairwise comparisons of the employment categories as compared with Table 3. In other words, the multinomial regressions provide the extent to which the predictive power of department rankings diminishes after controlling for individual-level accomplishments. Another notable aspect of the multinomial regressions is the unique predictive power of publications among the employment categories. In reference to the PhD granting-1 institution job, for example, a one-unit increase in publications (so one more publication on a CV) increases the chances of a PhD-granting institution-1 job by (a) 15% when compared with no job, (b) 19% when compared with a job at a PhD granting-2 institution, (c) 19% when compared with a job at an MA-granting institution, (d) 43% when compared with employment at a 2-year school, and (e) 12% when compared with a job outside academia. 4 When controlling for other factors that go into the hiring decision, we now have a better understanding of the value of each new publication on a CV.
How do the academically employed, nonacademically employed, and not employed compare?
Finally, many students may be interested in the basic issue of employment (academic or nonacademic) compared with no employment. If we collapse across the academic positions (PhD granting, MA granting, liberal arts, 2-year schools), how do the academically employed compare with the nonacademically employed or not employed? Table 4 shows a selection of variables that would be relevant to a hiring committee or listed on the CV. For the students interested in remaining in academia, the average accomplishments were four to five publications, two of which were first-author publications; roughly seven posters; and being a primary course instructor course three times. The department rankings also showed differentiation between those academically employed, nonacademically employed, and not employed. In terms of the not employed, however, it is worth noting that some students may have declined a job offer or applied for only a select number of positions within any given employment cycle because they knew that they could remain in their program for another year and thus apply to a wider range of positions in the following year or wait for their preferred employment position in the following year. That said, irrespective of why students may fall into the “not employed” category, there were stark differences in accomplishments and department rankings between those who were offered and took employment and those who were not. Future research replicating or updating the survey every few years could help the field identify whether the patterns discovered in the current research persist or whether employment patterns change over time for any number of historical, cultural, or economic issues.
Academic Versus Nonacademic Versus No Employment
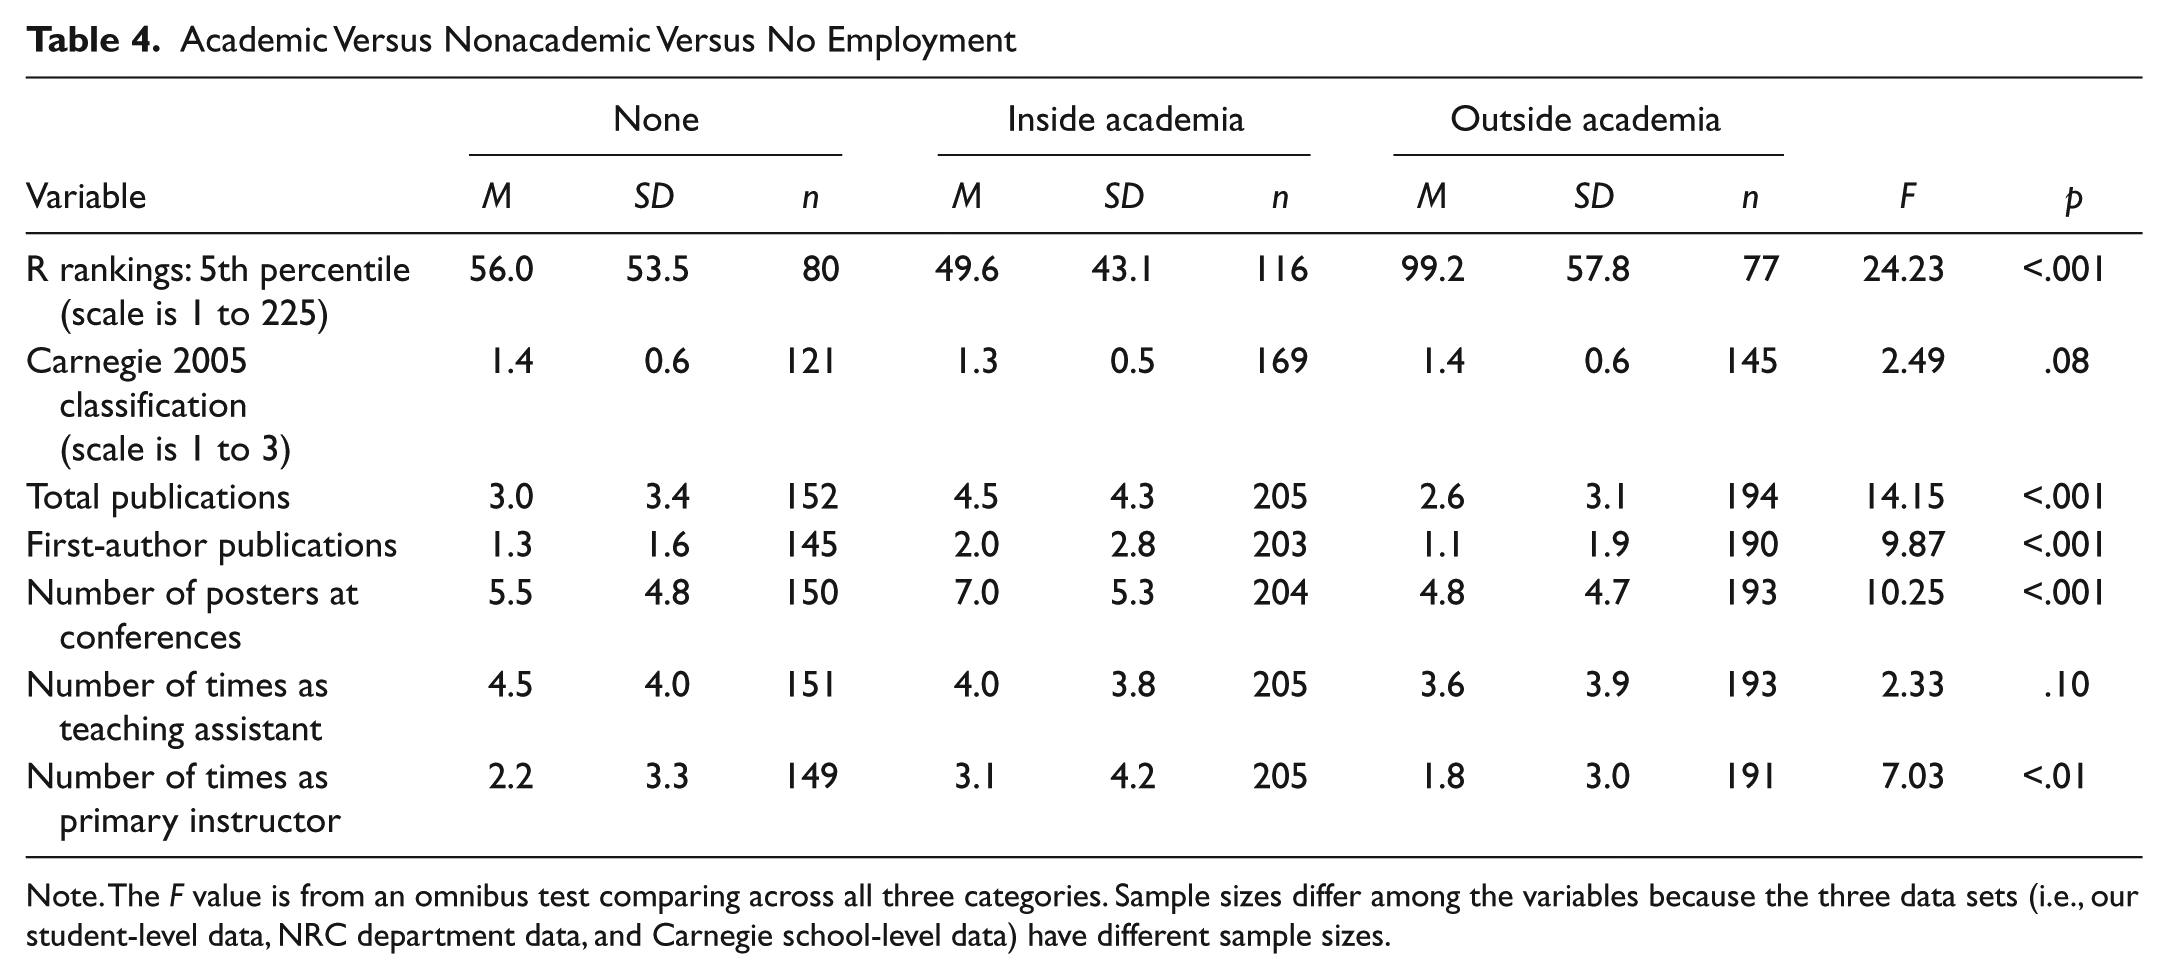
Note. The F value is from an omnibus test comparing across all three categories. Sample sizes differ among the variables because the three data sets (i.e., our student-level data, NRC department data, and Carnegie school-level data) have different sample sizes.
Footnotes
Appendix
Declaration of Conflicting Interests
The authors declared that they had no conflicts of interest with respect to their authorship or the publication of this article.
Notes
References
Supplementary Material
Please find the following supplemental material available below.
For Open Access articles published under a Creative Commons License, all supplemental material carries the same license as the article it is associated with.
For non-Open Access articles published, all supplemental material carries a non-exclusive license, and permission requests for re-use of supplemental material or any part of supplemental material shall be sent directly to the copyright owner as specified in the copyright notice associated with the article.