
Abstract
Differences in ethical behavior between members of the upper and lower classes have been at the center of civic debates in recent years. In this article, we present a framework for understanding how class affects ethical standards and behaviors. We apply the framework using data from a large Dutch population sample. The data include objective measures of class, survey responses relating to ethical behavior, and results from an experiment designed to probe ethical choices. Ethical behavior proves to be affected by (a) moral values, (b) social orientation, and (c) the costs and benefits of taking various actions. Strong class differences emerge in each of these areas, leading to differences in behavior. Moreover, strong differences among different conceptions of class (wealth, education, etc.) produce additional variation. We argue that the relationship between class and ethical behavior is far from a simple pattern; it is a complex mosaic.
In response to the growth of income inequality, particularly in the wake of the 2007–2008 financial crisis, members of the financial and political elite have sometimes been portrayed as unethical or as driven by unconstrained self-interest (e.g., Smith, 2012). In contrast, some recent sociological analyses of these same income-distribution issues present members of the lower class as afflicted with a loss of values and suggest that the upper class should actively promote its virtuous values to help their poor brethren raise themselves (Mead, 2007; Murray, 2012).
This conflict in perceptions of the relationship between class and ethical behavior considerably predates the 21st century. Great works in literature and political economy have argued both sides. In Thomas More’s (1516/1909) Utopia, the character of Raphael Hythlodaeus identifies money and privately held property as the causes of social dysfunction. Reiterating an argument found in Plato’s (380 BC/2006) Republic, he proposes that private property be eliminated because this will dampen two of the main characteristics of upper class individuals: greed and the propensity for unethical behavior. However, low-status individuals have received equally unethical portrayals. Although being fierce supporters of the working class, Karl Marx and Friedrich Engels (1848/1969) referred to the poor in the Communist Manifesto as “the social scum, that passively rotting mass thrown off by the lowest layers of the old society,” and they noted their tendency to engage in criminal activities. Historically, as well as today, the study of class and ethics has produced more finger pointing and selective examples than objective analysis.
In this article, we advance two major arguments regarding the flaws in general claims as to the ethical characteristics of different social classes. The first argument derives from the phenomenon that ethical behavior is the product of multiple interacting dimensions. The second argument relates to the fact that social class is far from a univariate construct. Thus, general claims about whether the upper or the lower classes are more ethical are likely to fail because classes differ in (a) their moral values and understandings of what is correct/ethical, (b) their patterns of social interaction, and in (c) the costs and benefits of taking various actions. Bourdieu’s (1984) classic work on differences in tastes demonstrates that social classes convey aesthetic preferences to their children. Thus, tastes in food, literature, modes of entertainment, and language are likely to be tightly bound to one’s income and education. Judgments of various modes of behavior, deciding what is appropriate and what is not, are imparted by parents and peers (Fraley, Griffin, & Roisman, 2012; Kelley & De Graaf, 1997). Those judgments also involve substantial elements of taste and aesthetics.
Converging evidence identifies class differences in social cognition. Upper class individuals show more dispositional attributions, less empathic accuracy, and more self-focus and less engagement in social interaction (Grossmann & Varnum, 2011; Kraus, Cote, & Keltner, 2010; Kraus & Keltner, 2009; Kraus, Piff, & Keltner, 2011; Lammers, Galinsky, Gordijn, & Otten, 2012).
The opportunities for and returns to different types of unethical behavior differ strongly across the classes—so, too, do the punishments for engaging in such behavior. For example, a behavior that is widespread within one’s class or subgroup within a class is much less likely to lead to social sanctions and erosion of self-image. People trade off these costs and benefits when making ethical decisions (Gneezy, 2005; Mazar, Amir, & Ariely, 2008; Schauer & Zeckhauser, 2009). Therefore, professionals in Greece chisel blatantly on their taxes, as do waiters in the United States. Professors take more liberties in optimistic reporting of empirical data when such practices are more common in their discipline (John, Loewenstein, & Prelec, 2012, Table 2). Physicians who code medical procedures aggressively to upgrade reimbursement from insurers, like executives who push accounting rules to manipulate earnings, are bending a reporting system for personal benefit. Members of each profession might disapprove of the ethics of the other profession, but they feel their own behaviors are justified by the pressures they face and the fact that their peers do the same (Dunning, Heath, & Suls, 2004; Pronin, 2008).
Given the costs and benefits they face, it is no surprise that lower class men are much more likely to impregnate a woman without intending to support the child (Murray, 2012, Chapter 8), whereas upper class men are much more likely to exploit an abusive tax shelter (Murray, 2012, Appendix E). The lower class man has neither the money to hide nor an available accountant accomplice. Conversely, his upper class counterpart would have to pay handsomely in reputation and child support for an illegitimate child.
The second argument that we advance in this article is that general claims about the ethics of different classes are undermined because class membership is far from a univariate construct. Status has been shown to have both a dimension of social power relating to responsibility and a dimension relating to self-interest and independence (Galinsky, Gruenfeld, & Magee, 2003; Lammers, Stoker, & Stapel, 2009). Casual observation shows that, for example, highly educated people may have views and behaviors that differ from those of very wealthy people, and the two groups are often antagonistic toward each other’s value system (Inbar & Lammers, 2012).
Ethical Behavior and Class Status: A Multifaceted Structure
In this article, we demonstrate the importance of accounting for the complexity in the relationship between class and ethics. We question the external validity and the interpretation of studies that have claimed that individuals high in socioeconomic status (SES) behave more unethically than low-status individuals across a wide range of situations and a wide range of status measures. Piff, Kraus, Cote, Cheng, and Keltner (2010) argued that upper class individuals are found to be less social and helpful. Piff, Stancato, Cote, Mendoza-Denton, and Keltner (2012) suggested that upper class individuals are more likely to cheat, to lie, to take goods from others to foster their own material outcomes, and to drive ruthlessly. Notably, none of these researchers in these studies used objective or unambiguous measures of SES. Some researchers have used indicators of status, such as the quality of one’s car, that are noisy and potentially biased because of conspicuous consumption: Low-status individuals may overconsume highly visible goods, and such overconsumption may be correlated with other traits and attitudes (Charles, Hurst, & Roussanov, 2009). Researchers have conducted other experiments with convenience samples of participants who have varied little in SES, using priming tasks to induce the subjective perception of class. 1 Thus, these studies have failed to establish an unambiguous relationship between objective social class and ethical behavior.
Building on research that shows class differences in the patterns of social cognition and orientation, these authors have proposed a theoretical pathway that proceeds from social class to self-focused social cognitive tendencies to unethical behavior. However, such a unifying simplification would be valid only if social cognition is the prime determinant of ethical behavior, but it is not. The theoretical framework presented here allows for a much richer interpretation of class differences in ethical behavior. That framework, we later show, helps to identify structure in complex empirical data on ethical behavior and judgments.
Objective Measures of Class: The Population Survey
We study the ethics underlying behavior and judgments using a representative Dutch population panel, the Longitudinal Internet Studies for the Social Sciences (LISS) panel, administered and collected by CentERdata, a professional data-collection company. All study data are publicly available at www.lissdata.nl. Subsets of the approximately 9,000 participants take part in various surveys and experiments, which are administered four times per year. Comprehensive background data are available for the panel participants, including data on financial assets, income, education, and occupation; data from the European Values Study (EVS); and data on political and social issues. Through the unique identification numbers of the panel members, we can connect these survey measures and can combine them with experimental data on ethical behavior. The data enable us to define dimensions of the individuals’ SES and to identify dependent measures of moral values, social orientation, and ethical behavior/judgments. 2
We determine the participants’ SES, employing six variables, each broken into two categories to identify high-status, upper class individuals and low-status, lower class individuals. We thus follow the recent work by Piff et al. (2012) and Murray (2012) in dichotomizing SES. We define the status indicator income by the median split of the net income of the panel participants. We categorize financial wealth by counting the presence of assets in four categories: savings, risky investments, long-term and life insurance, and real estate investments. This count ranges from 0 to 4, and status is broken at the median split, with 0 and 1 indicating low status, and 2, 3, and 4 indicating high status. 3 To measure occupational prestige, we indicate high-status job type by academic or professional jobs; commercial, other mental, and manual work (skilled and unskilled) in their current (or last) job indicates low status. We define high-status employment permanence by a permanent employment contract, by self-employment, by being an independent professional, or by holding directorship in one’s own company. Temporary contracts indicate low status. Occupational status may be relative, rather than absolute, in the perception of the individual. Thus, we include a variable supervisor that indicates whether the participant supervised any employees in her current/last job. Even for lower class individuals, supervisory responsibilities may lead to perceived high status in the relevant reference group and, thus, to effects on ethical behavior. High education indicates that the individual holds a college or university degree. Finally, an aggregate status measure informs the data analysis: SES_6 counts the number of times that an individual scores as high status on our six dimensions.
Piff et al. (2012) conjectured that unethical behavior by the upper class may be driven by more positive attitudes toward greed and that economic- or business-oriented training may proxy for such attitudes. We thus define an indicator economics training for a participant who has any training in economics or business.
In Appendix A, we present summary statistics of the variables used in this article. In Appendix B, we report pairwise correlations of these seven measures.
Differences in Moral Values Within and Between Classes
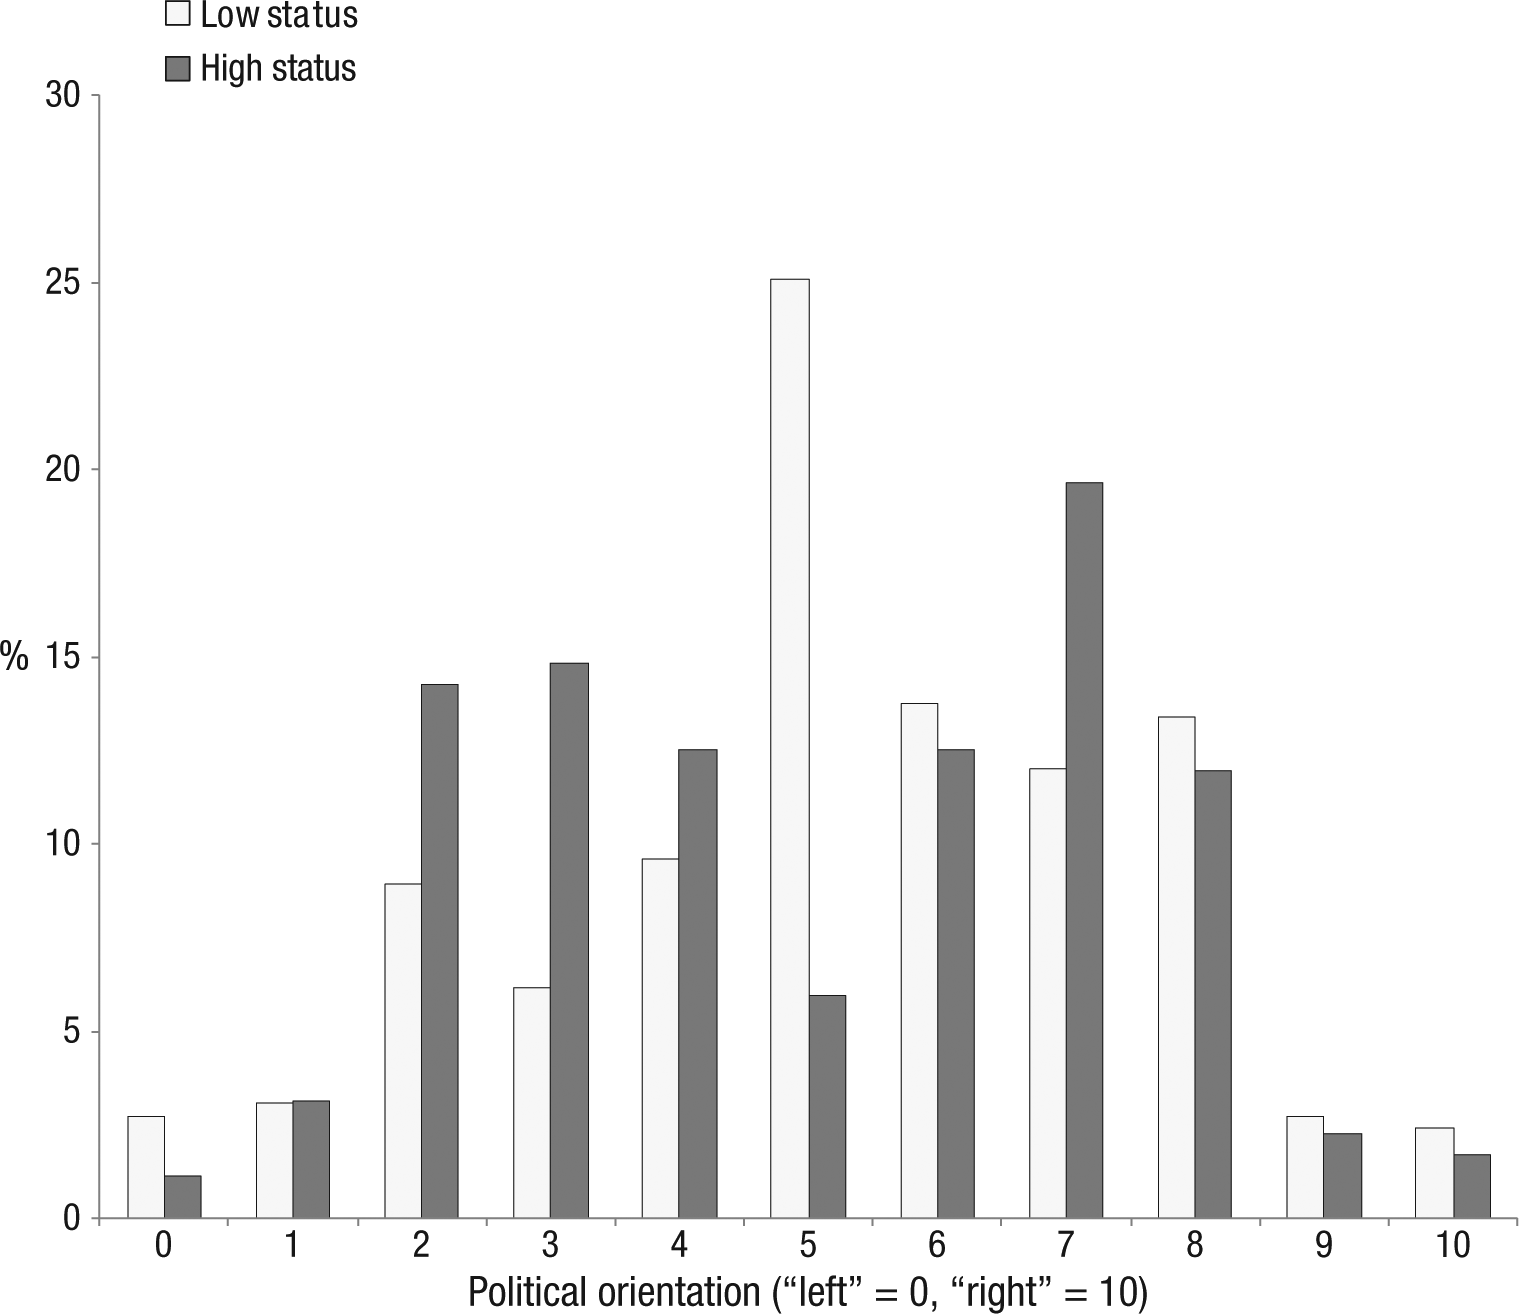
We posit that, in addition to differences between classes, differences also emerge within classes in terms of moral values and the understandings of what is correct behavior. In this section, we examine political attitudes (which are related to moral views), preferences for redistribution, and volunteering. We determine political orientation by a question that asks panel members to place themselves along a scale ranging from 0 (left, liberal) to 10 (right, conservative). We also have available voting intentions of the participants, asking them which party they would vote for if elections were held today. As a validity check of our measure for political orientation, we map answers to the political orientation question on the voting intentions for the 10 main Dutch political parties. The answers coincide strongly with the general population’s perception of where the parties lie in the political spectrum. (See Table S1 in the supplementary materials at http://pps.sagepub.com/supplemental.) We believe that this measure successfully taps into political orientation.
Figure 1 shows the histogram of political orientation for the lowest two categories and the highest two categories of the summary status indicator SES_6. The groups have similar means but very different distributions. The low-status group is roughly bell shaped, with most people located near the middle of the political spectrum, and has a mean of 5.3, indicating a slight tendency toward the right (conservative). The high-status group is more polarized: It is bimodal and fairly symmetrical, with a more liberal subgroup and a more conservative subgroup, with few people exactly in the middle; yet, it has a mean of 5.0. This polarization effect shows up in differences among the various dimensions of status measure.
Status and political orientation.
Table 1 shows, for each status measure, the sign and the effect size of the partial correlation (after controlling for age and gender) with the political-attitude measure. We find that economics training, a supervisory job, wealth, and a permanent employment contract are associated with a more conservative orientation. An academic/professional job and high education are associated with a less conservative orientation than the complementary low-status group. Income status is associated with a less conservative orientation but insignificantly so.
Politics, Redistribution, and Volunteering

Note: Entries are the signs (positive and negative) and effect sizes of the partial correlation from a regression analysis controlling for age and gender. Regressions for pro-redistribution and volunteering additionally control for political attitudes. Results remain robust in the absence of these controls.
Denotes significance at the 10% level. **Denotes significance at the 5% level. ***Denotes significance at the 1% level.
We posit strong effects of political orientation on a wide range of ethical behaviors. Note that the reported effects of status on political orientation therefore imply class differences in such behavior, differences that depend on which dimension/definition of status is being employed. Table 1 also shows how status affects attitudes toward redistribution and on volunteering, after controlling for political orientation. Higher status reduces support for redistribution for all six measures of status. There thus seems to be a component common to all status dimensions that leads to less positive attitudes toward redistribution.
Is this effect due to selfishness and greed, as suggested by Piff et al. (2010; Piff et al., 2012)? The results on volunteering indicate that it is not. The last column of Table 1 shows that highly educated people and professionals volunteer more than poorly educated and low-status workers, although their opportunity costs (lost earnings in volunteer hours) are greater. This result replicates classic findings by Anheier and Salamon (1999). Volunteering results do not indicate more selfish behavior by higher status individuals. The only high-status people to volunteer somewhat less (at the marginal significance level of 10%, two-sided) are those in permanent, as opposed to temporary, jobs. This contrary result nicely demonstrates the role of costs and benefits in doing good (or bad), one of our prime explanations for ethical (unethical) behavior. It is likely that people in permanent jobs have less time on average to spare than people in temporary jobs. Moreover, people in temporary jobs might be seeking the informal networking opportunities that come when involved in volunteering (Anheier & Salamon, 1999). Such networking could also explain greater volunteering by some professionals, such as lawyers seeking contacts.
We report the effect of the aggregate status measure SES_6 on each of the three dependent variables considered in Table 1. Higher status is correlated with less conservative orientation (p < .05) but also with less preference for redistribution (p < .001). Higher status is associated with more volunteering but insignificantly so (p = .17). Table 1 shows that these aggregate findings obscure important differences among the different dimensions of status.
Social Class and Patterns of Social Orientation
Researchers using convenience samples have shown that priming class influences performance on social orientation tasks (Grossmann & Varnum, 2011; Kraus et al., 2010; Kraus & Keltner, 2009; Kraus et al., 2011; Lammers et al., 2012). Using objective status measures, we confirm strong effects of actual class on social orientation. We study participants’ reports on their guiding life principles and on two trust measures. To elicit their guiding life principles, we asked participants to indicate on a scale ranging from 1 (minimum) to 7 (maximum) how important certain principles are in their lives. These included the items responsible, helpful, obedient, polite, and independent, which directly relate to the previously found differences in interpersonal engagement and self-focus between upper and lower classes (Grossmann & Varnum, 2011; Kraus et al., 2010; Kraus & Keltner 2009; Kraus et al., 2011; Lammers et al., 2012). In contrast to moral values, these items relate more to people’s social capacities and how they perceive their social environment. We provide more details about the measurement of these items in the supplementary materials.
To investigate whether engagement and self-focus vary between classes in our sample, we define the variable independent, indicating less engagement with others, as the average score on the five items, with the first four items reverse coded; for example, people who are more polite are less independent. We also define two measures of trust. First, a binary question coming from the EVS survey on the LISS panel is called trust EVS. 4 Second, the average measure on three statements regarding trust coming from another survey on the panel, relating to social capital and measured on a 7-point Likert scale, is called trust indicator. 5 Previous studies have found that higher SES individuals in the United States have higher self-reported levels of trust toward an unspecified other, as indicated by the binary EVS question (Alesina & La Ferrara, 2002).
Table 2 shows strong evidence that higher status individuals feel more independent/less engaged and are more trusting. These tendencies point in the same direction for all types of status, but they are most pronounced for status related to education, professional jobs, income, and wealth, and they are less pronounced for supervisory and permanent employment status. Regression analyses that use the aggregate status measure confirm the positive relationships between status and independence and trust (ps < .001). We also find that older people are less independent, and older, and more conservative, people are less trusting in the trust indicator.
Trust and Independence
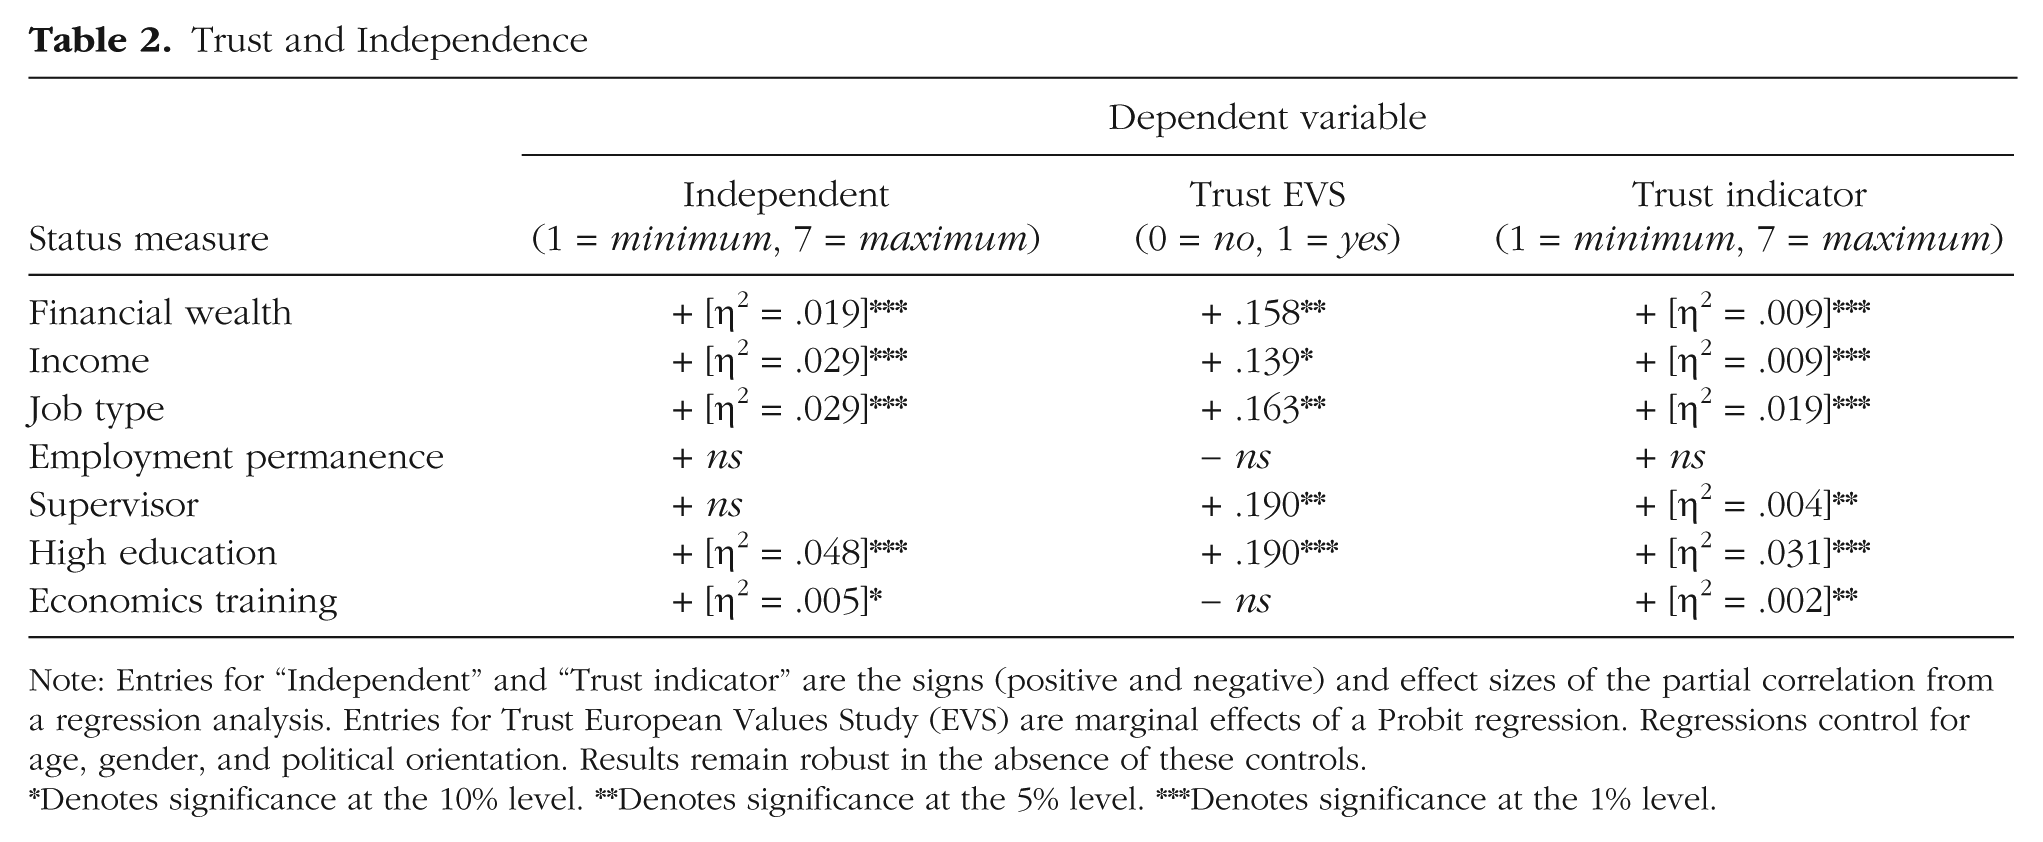
Note: Entries for “Independent” and “Trust indicator” are the signs (positive and negative) and effect sizes of the partial correlation from a regression analysis. Entries for Trust European Values Study (EVS) are marginal effects of a Probit regression. Regressions control for age, gender, and political orientation. Results remain robust in the absence of these controls.
Denotes significance at the 10% level. **Denotes significance at the 5% level. ***Denotes significance at the 1% level.
Social Class and Ethics: Betrayal
Our results show some pronounced differences in moral values and in social orientation between the upper and lower class, with reasonable consistency across different class measures. However, we do find differences in other areas across types of high status, most notably with respect to political orientation. Such differences suggest that observed ethical behaviors and judgments may also vary across status measures, making it less likely to observe general tendencies in ethics between higher and lower classes. Moreover, as we have argued earlier, we expect strong differences in the costs and benefits that individuals of different status experience in their lives. Here, we present data on an experimental social decision task that abstracts away from many possible cost-benefit confounds that would likely show up in the field.
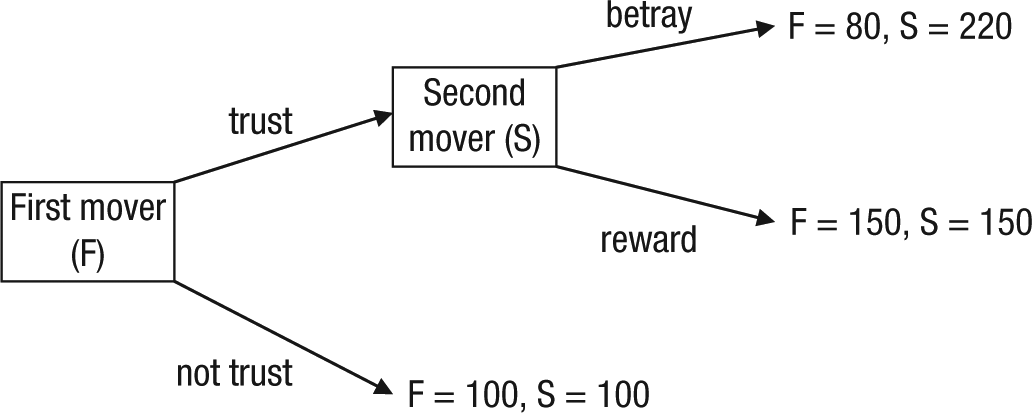
For 470 panel participants, we observe their decision as a trustee (second mover) in a trust game played with another (real) panel participant for monetary payments. The trust game (see Figure 2) is defined as follows. The first mover chooses between two actions: not trust, which directly yields 100 points for each player, and trust, which increases the total payoff for the two players to 300 but turns responsibility for dividing it over to the second mover, whom we call the trustee. After the first mover’s choice of trust, the trustee (the second mover) then has to decide between action reward, which yields 150 points for each player, and action betray, which yields 80 points for the first mover and 220 points for the second mover (i.e., herself or himself). Each point is worth 5 eurocents, roughly 6.5 American cents. In the experiment, second movers have to indicate what they will do if given responsibility, without knowing yet whether the first mover acts trustfully. Actions are neutrally labeled as Actions A and B for the first mover and as 1 and 2 for the second mover. Terms such as trust and reward are never used. The game is one-shot, nonrepeated, and anonymous; therefore, the second mover has no strategic incentive to reward if the first mover does trust. However, many observers think it unethical to betray (cut the payoff to) a first mover who has expanded the pie in the hope that the second player will reward trust, thus leading to greater payoffs for both (Bohnet & Zeckhauser, 2004; Trautmann & Vieider, 2012). Participants are matched at random and are paid according to the two players’ choices. Original instructions are given in Appendix C.
Trust game.
Table 3, column 1, gives the results for the effect of status on the propensity to betray. In this table, numbers are differences in average behavior between high-status and low-status individuals. Thus, any positive numbers indicate betrayal by upper class individuals, the unethical choice. Column 1 results indicate that there are no significant differences in the trustee behavior across classes, with a maximum disparity of 5% in percentage of betrayers across classes. 6 Moreover, the majority of differences have a negative sign (indicating that the upper class behaves more ethically). Probit regressions confirm the absence of status effects for betrayal, both for each status measure separately and for the aggregate measure. Older people are less likely to betray trust (.61% points, p = .027, less betrayal per life year), but this effect is insignificant when political orientation is controlled for (.45% points, p = .150, less betrayal per life year). This age effect replicates previous studies in which the trust game was used (Bellemare & Kröger, 2007; Fehr, Fischbacher, von Rosenbladt, Schupp, & Wagner, 2002; Sutter & Kocher, 2007), showing that the current game successfully taps into attitudes toward betrayal. We find no effect of economics training on betrayal.
Unethical Behavior and Judgments: Differences Between Responses of High- and Low-Status Individuals
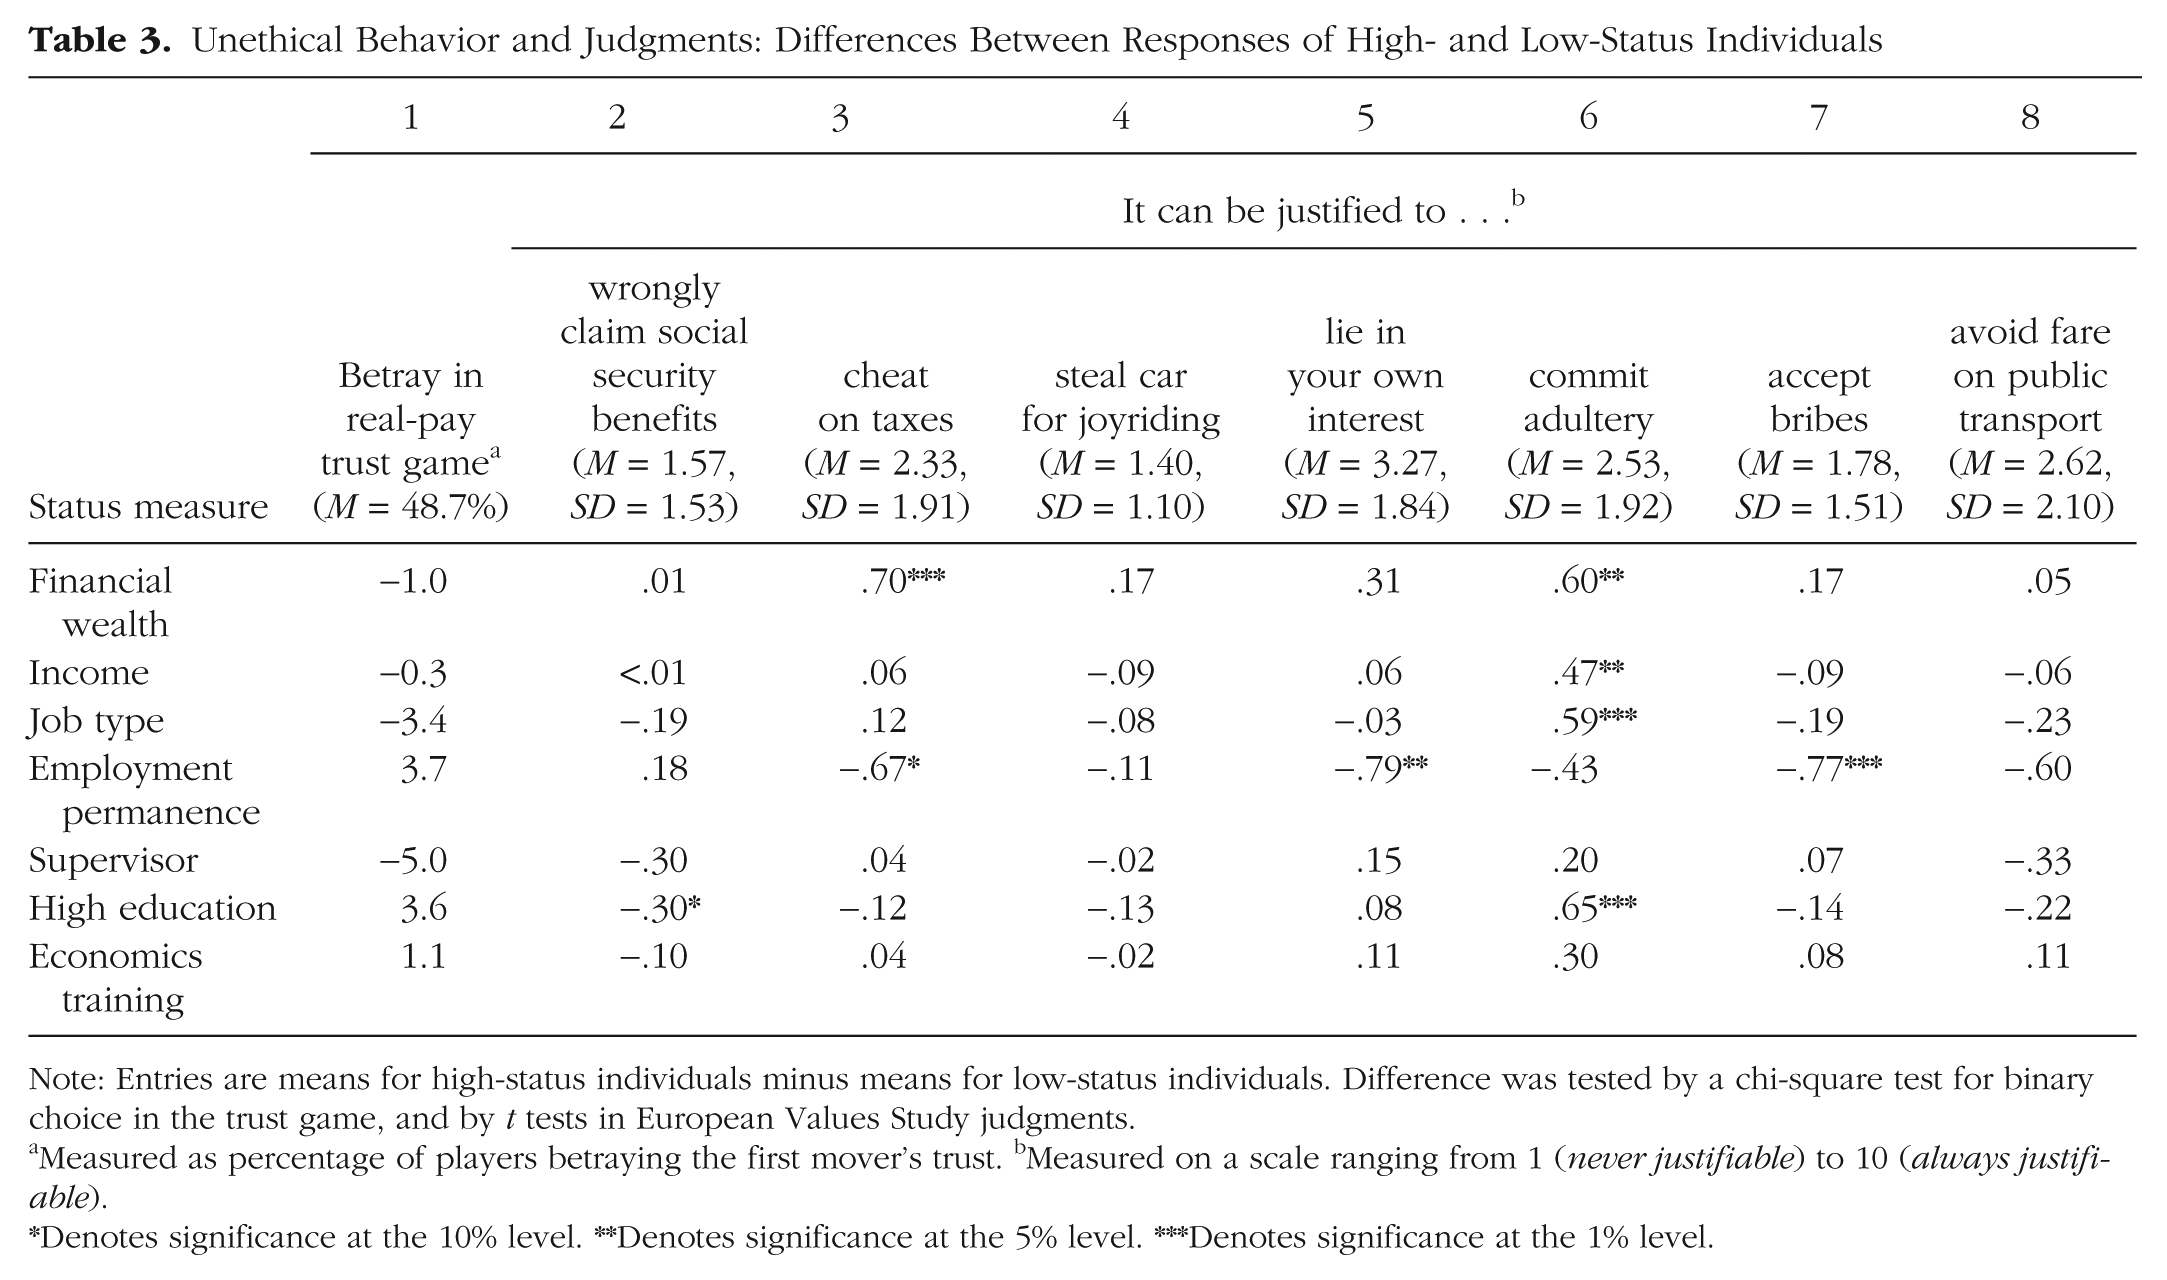
Note: Entries are means for high-status individuals minus means for low-status individuals. Difference was tested by a chi-square test for binary choice in the trust game, and by t tests in European Values Study judgments.
Measured as percentage of players betraying the first mover’s trust. bMeasured on a scale ranging from 1 (never justifiable) to 10 (always justifiable).
Denotes significance at the 10% level. **Denotes significance at the 5% level. ***Denotes significance at the 1% level.
Thus, in an anonymous real-payment situation, upper class individuals are no more likely to behave unethically and betray the first mover than are lower class individuals. This result contradicts some demonstrations of strong differences in ethical behavior between upper and lower class individuals in laboratory studies in which convenience samples were used (Piff et al., 2010; Piff et al., 2012). However, this result directly accords with findings on sharing decisions in which no differences across SES were found (Kraus & Keltner, 2009, p. 101). Payoffs in the current task ranged from €5 to €11. These amounts are far from life changing for either the low- or the high-status individuals. It is therefore unlikely that these amounts are perceived very differently by the different classes. Piff et al. (2012) demonstrated high status leading to unethical behavior in taking candy, when “taking candy would reduce the amount that would otherwise be given to children” (p. 4087), in a situation without anonymity. Both payoff size and the size of the harm imposed on others are very similar in Piff et al.’s study and the current trust experiment, with anonymity in our study being the main difference. The absence of status effects in the anonymous setting supports the importance of social costs in ethical behavior. These costs differ strongly among classes.
Social Class and Ethics: Ethical Judgments
The trust-game results indicate that there is no general tendency of the upper class to behave less ethically than the lower class in a situation in which the context does not create large cost and benefit differences for unethical behavior across or within social classes. A second measure of ethical behavior is distilled from the answers to seven questions from the EVS that asked 337 participants whether certain instances of lying, cheating, and stealing can be justified (see Table 3, columns 2–8). In contrast to the trust-game behavior, these questions are nonincentivized and self-reported. However, if reports are honest, they have immediate external validity, unlike the real-pay decision in the abstract trust game. Moreover, they concern situations in which we would expect that people typically make cost-benefit tradeoffs when considering ethical or unethical activities.
Positive numbers in Table 3 indicate more unethical behavior by upper class participants; negative numbers indicate more by lower class participants. Columns 2–8 clearly show that there is no general tendency of one class to be more or less ethical across a wide variety of situations. There are a few effects: Wealthy people find cheating on taxes more acceptable, and people with low employment status (that is, temporary jobs) are less ethical on a number of items. Higher status in terms of wealth, income, education, and job type is correlated with a less negative attitude toward infidelity. This result confirms findings by Lammers, Stoker, Jordan, Pollmann, and Stapel (2011), who found that people who stand higher in their organization’s hierarchy are more likely to intend to and to commit adultery. Also consistent with their findings, we find the strongest effects are for status related to occupational prestige and education. Murray (2012) reported similar findings for the United States, showing the robustness of the effect with regard to cultural differences.
We apply aggregate measures of status and ethical judgments to identify tendencies for different types of status and ethical behavior. First, aggregating and normalizing over the seven moral judgments, we find that wealthy people are less ethical when controlling for age and gender (t = 1.74, p < .1), but we find no effects for the other status measures. Additionally, controlling for political orientation, none of the status measures imply a general tendency for high-status individuals to be less ethical. Second, using the SES_6 measure, we test for each ethical judgment whether higher overall status is correlated with less ethical behavior. High-status individuals are less accepting of wrongly claiming social security benefits when controlling for gender and age (t = 2.38, p < .05). This effect is robust when controlling for political orientation. None of the other ethical judgments relate significantly to status. It is noteworthy that the only transgression that is predicted by the general status indicator is thus a “victimless” transgression that hurts the community but no single identifiable individual. This suggests that relative to the lower class, upper class individuals may put more weight on the community in their ethical judgment, supporting the view that people live in different moral matrices (Haidt, 2012). It is an open question for future research how the ethics of upper versus lower classes change if more serious transgressions are considered.
Regarding the role of demographics, we find a general tendency for older people to be more ethical and for men to be less ethical (−.02, p < .008, effect per life year, and +.50, p < .001, for men, on the aggregate ethics measure when controlling for political orientation). 7 The age effect is consistent with the lower rates of betrayal in the trust game reported earlier. There is no general tendency in ethics observed for political orientation. However, conservatives are less forgiving about adultery.
Conclusions
Our framework for studying ethical behavior and social class builds on two premises. First, the differences in ethical behavior are the outcome of differences across classes in their moral values and beliefs about what is correct, in their patterns of social orientation, and in the costs and benefits they anticipate. Second, social class is far from a univariate construct, and dimensions such as wealth, income, education, or occupation can have fundamentally different psychological impacts and behavioral implications. We validated this framework using data from a large representative population sample and by defining status and class in terms of objective measures of financial, educational, and occupational prestige. This approach offers advantages over prior literature, which used convenience samples within which status varied little or which were manipulated subjectively to yield perceived class.
We find significant class differences in moral values, social orientation, and ethical behavior. Some of these differences apply however the upper class is defined, but others vary strongly across different dimensions of class. Class differences in moral rules and the patterns of social orientation are more predictable than class differences in ethical behavior and judgment, for which few general tendencies can be identified. This finding is consistent with the current framework. The conventional understanding of ethical behavior in terms of disposition (i.e., a person is either ethical or not) proves unreliable. Individuals tend to be less ethical when temptations are great and the payoffs to unethical behavior are greater. This suggests an implicit benefit/cost approach to choosing one’s ethics. Thus, given their wealth, an antiques dealer would be much less likely to shoplift but would be much more likely to cheat on taxes than a Walmart clerk. Furthermore, a professor who travels around to conferences and has more opportunities would be more accepting of infidelity than that clerk. At the same time, each person may condemn unethical behavior that is not available, or too costly, for himself/herself and therefore outside his/her own range of activities (Dunning et al., 2004; Pronin, 2008).
Having available a framework to separately account for status effects in moral values, patterns of cognition, and behavior is crucial once we move beyond static noncomparative analyses. Status effects on each dimension are likely to differ across cultures, in particular when comparing WEIRD 8 countries, such as the Netherlands or the United States, with non-Western societies (Haidt, 2012; Henrich, Heine, & Norenzayan, 2010). Even within the set of WEIRD countries, however, there will be significant differences in how status translates into each of the dimensions. An important factor could be inequality per se, 9 and how high status in terms of wealth, income, or education is perceived as being deserved or undeserved. For example, Alesina, Glaeser, and Sacerdote (2001, Figure 6) showed that there are pronounced differences in people’s beliefs about whether social status is mostly affected by luck or by hard work. Whereas in the United States only about 30% believe luck is the prime factor, in the Netherlands, about 55% believe it to be so. Similar effects to those leading to cross-country differences arise when seeking to explain ethical differences in behavior over time. Do the moral rules that people apply change? Or are changes in the costs and benefits of ethical behaviors the explanatory factor? In the current article, we lay out a framework to make such determinations.
Our results accord with most prior studies. They differ strongly, however, with prior studies that make general statements about how class affects ethical behavior. As our framework implies, the relation between class and ethical behavior represents a complex mosaic rather than a simple pattern. We applied our framework to publicly available survey questions and experimental decisions. In follow-up investigations, researchers can test and sharpen hypotheses that flow from the experiments and surveys that address separate aspects of the current analysis. For example, are the same status effects obtained with participants primed with high educational status and with high financial status? Do people react to an experimentally induced change in the cost and benefits of moral behavior? Thus, future researchers can, and should, recognize this complexity as they seek to explain the processes that underlie ethical behavior.
Footnotes
Acknowledgements
The authors contributed equally to this article. Devjani Roy provided valuable research assistance. In this article, use is made of data of the Longitudinal Internet Studies for the Social Sciences panel administered by CentERdata (Tilburg University, the Netherlands).
Declaration of Conflicting Interests
The authors declared that they had no conflicts of interest with respect to their authorship or the publication of this article.
Funding
Stefan T. Trautmann and Gijs van de Kuilen’s research was supported by VENI grants from the Netherlands Organization for Scientific Research.
Notes
Appendix A: Summary Statistics
| Variable | No. of participants a | % b | M c |
|---|---|---|---|
| Status measures (high status) | |||
| Financial wealth | 4,361 | 26.2 | |
| Income | 4,805 | 63.6 | |
| Job type | 4,485 | 37.1 | |
| Employment permanence | 3,232 | 84.3 | |
| Supervisor | 3,092 | 27.9 | |
| Education | 4,613 | 29.5 | |
| SES_6 (0 = minimum, 6 = maximum) | 2,395 | 2.95 | |
| Economics training | 4,720 | 15.2 | |
| Dependent variables | |||
| Political orientation (0 = left, 10 = right) | 3,878 | 5.4 | |
| Volunteering (hours per week) | 4,699 | 2.1 | |
| Pro-redistribution (0 = minimum, 5 = maximum) | 4,209 | 3.8 | |
| Independent (0 = minimum, 5 = maximum) | 1,368 | 2.9 | |
| Trust EVS (0 = not trust, 1 = trust) | 282 | 63.1 | |
| Trust indicator (1 = minimum, 7 = maximum) | 3,069 | 3.1 | |
| Components of SES/demographics | |||
| Income (€, net per month) | 4,805 | 1,517.92 | |
| Presence of savings | 4,361 | 89.5 | |
| Presence of risky investments | 4,361 | 16.1 | |
| Presence of long-term and life insurance | 4,361 | 14.4 | |
| Presence of real estate investments | 4,361 | 3.9 | |
| Men | 5,062 | 46.5 | |
| Age (years) | 5,062 | 49.6 | |
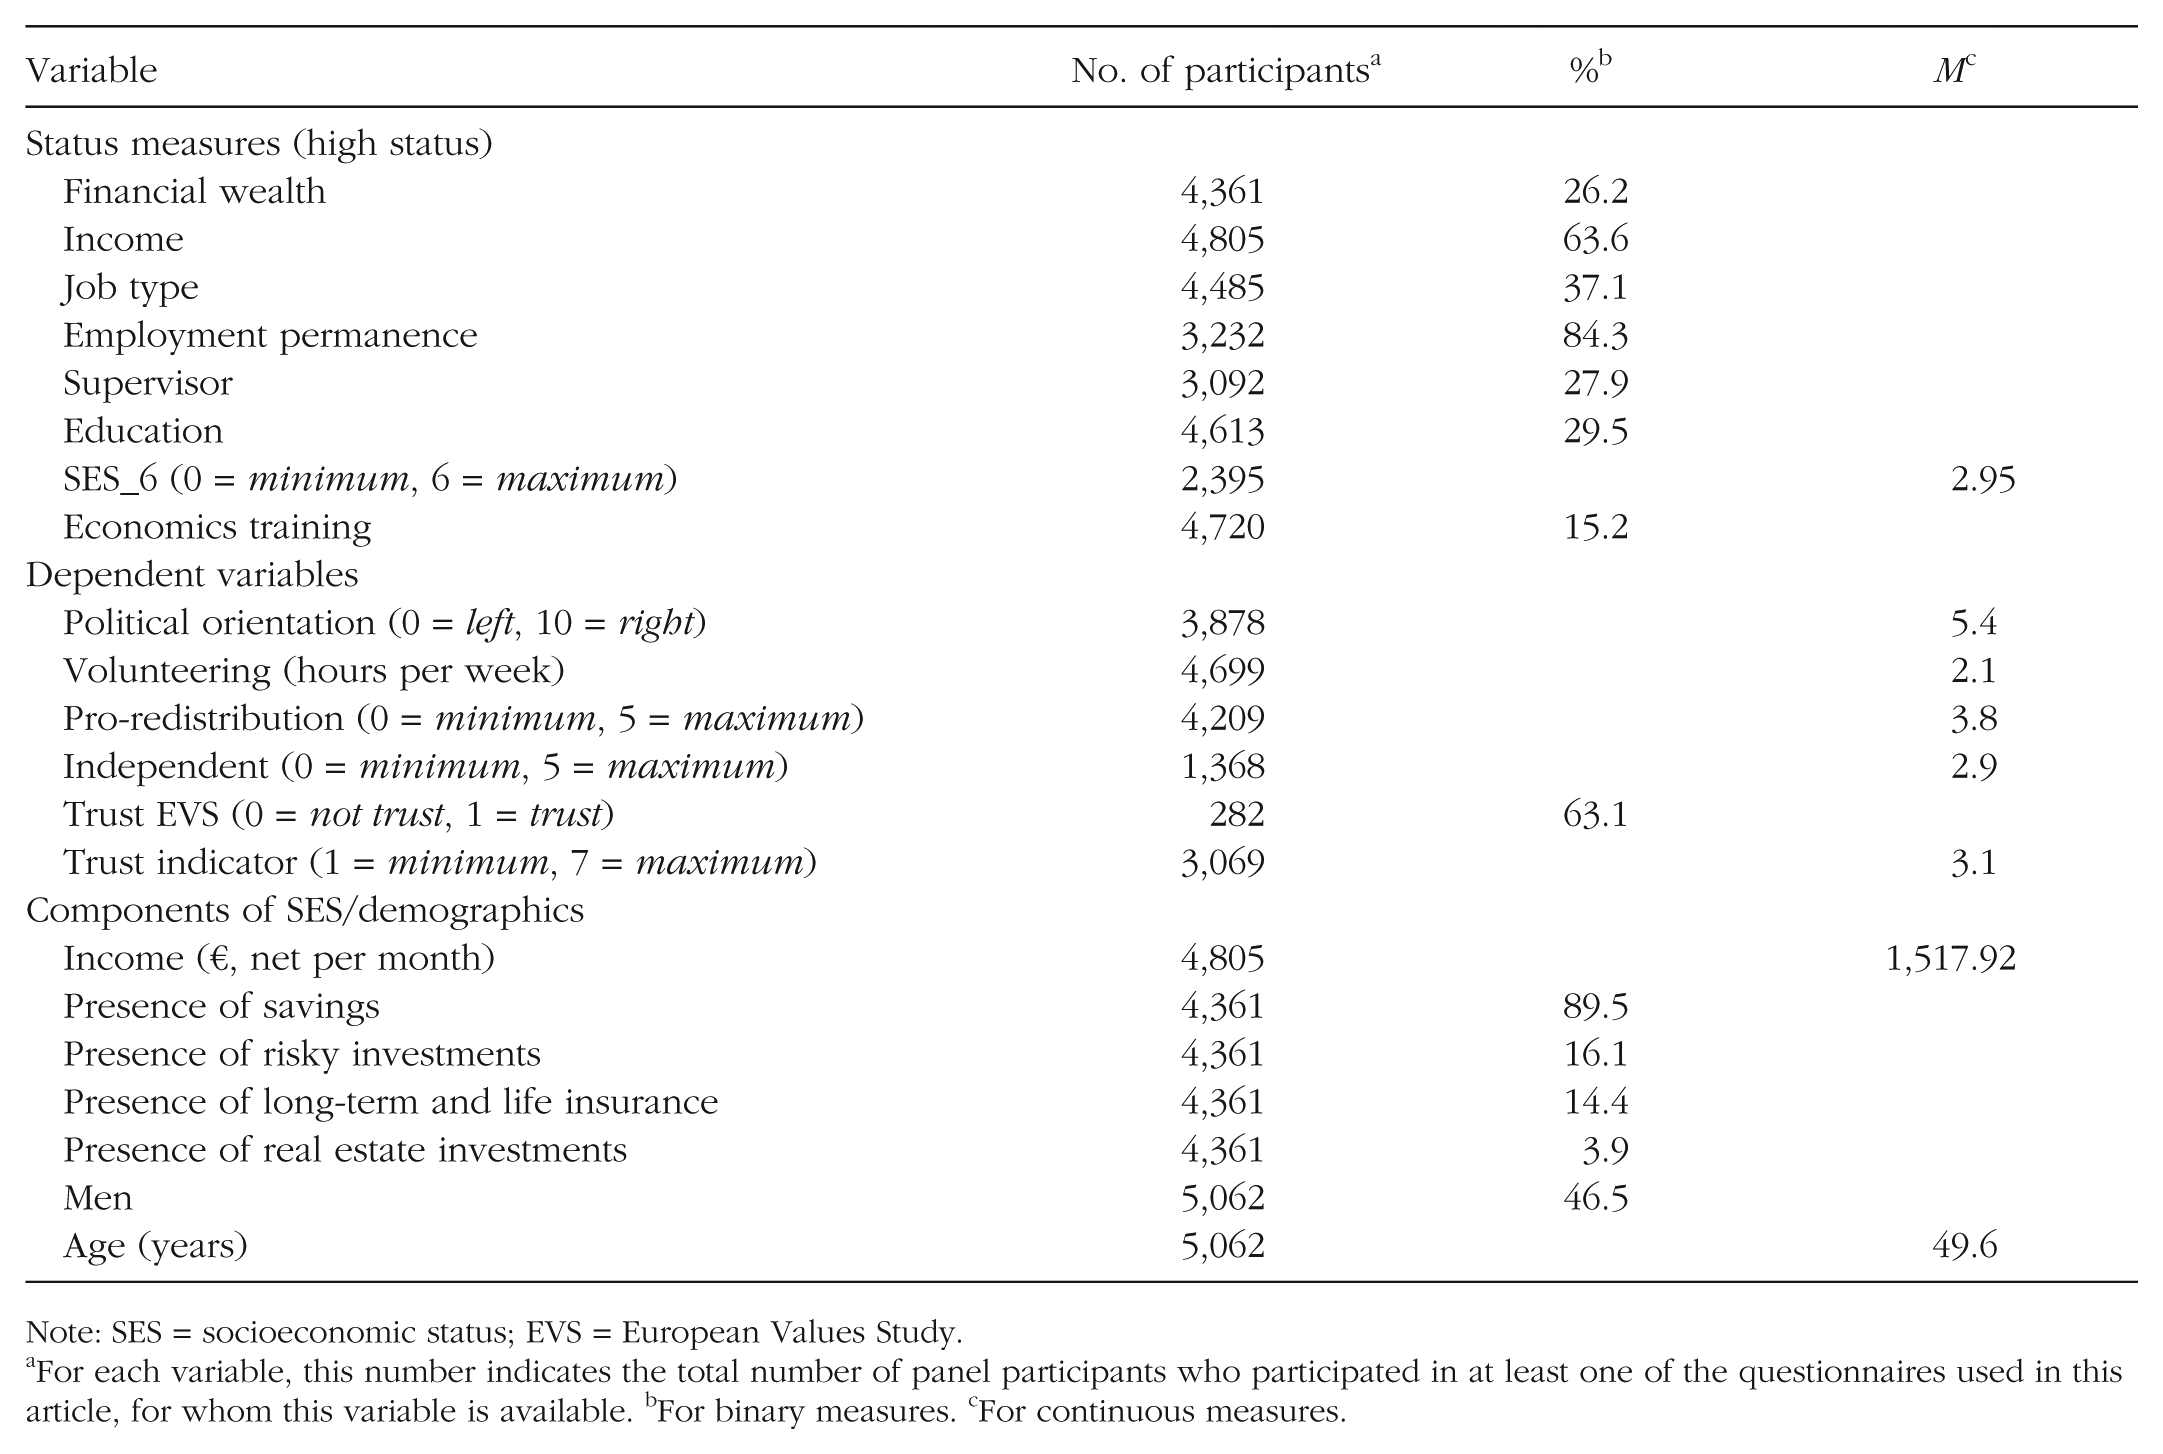
Note: SES = socioeconomic status; EVS = European Values Study.
For each variable, this number indicates the total number of panel participants who participated in at least one of the questionnaires used in this article, for whom this variable is available. bFor binary measures. cFor continuous measures.
Appendix B: Pairwise Correlations Between Status Measures
| Status measure | 1 | 2 | 3 | 4 | 5 | 6 | 7 | 8 | 9 |
|---|---|---|---|---|---|---|---|---|---|
| 1. Financial wealth | — | ||||||||
| 2. Income | .22 | — | |||||||
| 3. Job type | .17 | .25 | — | ||||||
| 4. Employment permanence | .15 | .27 | .10 | — | |||||
| 5. Supervisor | .09 | .20 | .07 | .13 | — | ||||
| 6. High education | .23 | .30 | .54 | .05 | .06 | — | |||
| 7. Economics training | .09 | .07 | −.08 | .04 | .08 | .04 | — | ||
| 8. Age | .14 | .46 | .03 | .31 | .10 | −.02 n | −.07 | — | |
| 9. Gender (men) | .15 | .26 | .01 n | .08 | .24 | .06 | .03 | — |

Note: Values are Pearson correlation coefficients. All entries are significant at the 5% significance level, except those marked by a superscript “n.”
Appendix C: Experimental Instructions for Second Movers in the Trust Game
At the end of the experiment, your answers will be matched with the answers of another participant. For convenience, we will call this participant
In this part of the experiment you can earn a number of points, depending on your choice between two options (1 or 2) and the Situation (A or B) as determined by Participant X; see the table below.
As you can see, your choice between options 1 and 2 only affects the earnings in Situation B. The moment you make your choice, you do not know which situation, A or B, applies. This is determined by Participant X. We ask you to choose between option 1 and 2. Depending on which situation applies, your earnings and the earnings of Participant X will be determined as described in the table above at the end of the questionnaire.
If you need more explanations, you can click on
If the instructions are clear, you can click
References
Supplementary Material
Please find the following supplemental material available below.
For Open Access articles published under a Creative Commons License, all supplemental material carries the same license as the article it is associated with.
For non-Open Access articles published, all supplemental material carries a non-exclusive license, and permission requests for re-use of supplemental material or any part of supplemental material shall be sent directly to the copyright owner as specified in the copyright notice associated with the article.