
Abstract
From drop-down computer menus to department-store aisles, people in everyday life often choose from simultaneous displays of products or options. Studies of position effects in such choices show seemingly inconsistent results. For example, in restaurant choice, items enjoy an advantage when placed at the beginning or end of the menu listings, but in multiple-choice tests, answers are more popular when placed in the middle of the offered list. When reaching for a bottle on a supermarket shelf, bottles in the middle of the display are more popular. But on voting ballots, first is the most advantageous position. Some of the effects are quite sensible, whereas others are harder to justify and can aptly be regarded as biases. This article attempts to put position effects into a unified and coherent framework and to account for them simply by using a small number of familiar psychological principles.
Keywords
The aim of this article is to account for all position effects in simultaneous choice. In developing this account, my unorthodox narrative will also follow a secondary thread. I wish to show how the final account eluded me for years because of the arbitrary order in which I had encountered position effects. It is, if you will, a tale of two effects: of position effects in simultaneous choice and of my own self-induced blindness. My tale will be told chronologically, inviting readers to construct their own account as it unfolds. In hindsight, we know, the tale will seem more obvious than ever it was (Slovic & Fischhoff, 1977)—to me, to my coauthors, to my seminar audiences, and to you, my readers.
In the Beginning—Multiple Choice Tests (MCTs)
At the turn of this century, I supervised a doctoral student on a comprehensive study, consisting of both laboratory and field data, to explore how test takers answer multiple-choice questions when circumstances compel them to guess (Attali & Bar-Hillel, 2003; Bar-Hillel & Attali, 2002). Standard psychometric models assume that guessing test takers choose one of the available answers “at random,” with all possibilities receiving equal probabilities (Lord & Novick, 1968). Attali discovered that this unlikely assumption is false. The fact is that guessing test takers tend to gravitate to middle answers. To give some examples, (a) when given an isolated “impossible” four-choice question (namely, one that can only be answered by guessing), as many as 80% of the guesses are b. or c.; (b) in real tests, about 55% of all answers go to the middle answers; and (c) the rate of respondents answering a question within such real tests correctly when the correct answer is placed in the middle can be higher by up to 35% than when it is placed in any other position (Attali & Bar-Hillel, 2003).
Even more interesting than what test takers do was the discovery of what test makers do. It turned out that among people asked to write a single four-choice question, around 80% choose to place the correct answer in one of the two middle positions. Before Attali’s work, entire item banks of professional testing organizations had more middle-keyed items than edge-keyed ones. Thus, test makers and test takers alike exhibit what we called a middle bias or edge aversion 1 (Attali & Bar-Hillel, 2003).
One may well argue that edge aversion among test takers is a rational, even optimal, response to edge aversion in answer keys. But blaming middle bias on test makers only shifts the locus of the question: wherefrom comes their predilection to place correct answers in the middle?
Searching the literature for other position biases revealed edge aversion cropping up repeatedly in a multitude of different contexts, real-world and laboratory, and with physical objects and virtual ones (described later). Thus, oddly enough, we ended up lumping together one’s choice of a cereal box from the middle of a shelf display of identical boxes (Christenfeld, 1995) with one’s choice of an answer in MCTs, simply because both exhibited middle bias. Middle bias in MCTs seemed to be but another manifestation of a prevalent position effect, explained more by its seeming generality than by any specific characteristics of its own or any higher order principle that could also encompass all findings. The very fact that tasks so clearly different yielded the same effect lead us to conclude, erroneously, that edge aversion was the rule in choice from simultaneous displays.
The Menu Study
Some years later, I supervised another student in studying position effects in menu choice. Menus are encountered not only in restaurants, but in many Internet sites as well, making them an intrinsically interesting context where position effects had not, to the best of our knowledge, been studied before. However, we found guidance manuals that give advice on menu design. A couple of them suggested that if one wants to enhance the popularity of certain dishes, one should place them at the beginning or at the end of the list of options—not in the middle. This suggestion was either based on no research at all (Main, 1998) 2 or on the serial position effect (Panitz, 2000).
The serial position effect is among the most robust results in psychology. It has been known for decades and is backed by hundreds of studies. In a typical study, respondents hear a list of words and are then asked to recall them, preferably in the same order. Typically, results show an advantage to words placed at the beginning and/or end of the ordered list. We, however, deemed it irrelevant to restaurant menu listings, because they are quite different from the kind of lists used in studies of the serial position effect. Most notably, menu listings are usually presented to the diner visually and all together, whereas the lists used for studying the serial position effect are presented one at a time. In other words, the first offers a simultaneous display, like a buffet, where all options are present at the time of choice, whereas the second offers a sequential display, like an audition.
Table 1 shows the many ways in which a typical serial position study differs from a typical simultaneous-choice study and from our menu-choice study in particular. Most obviously, in serial position studies, “position” is temporal and temporary, whereas in simultaneous choice studies, the options are positioned in space (i.e., in “locations”) and endure there. Moreover, in serial position studies, the dependent variables are memory or learning measures, whereas in simultaneous presentation, the dependent variable is choice or preference.
Comparing Typical Studies of Serial Position Effects Versus Simultaneous Choice
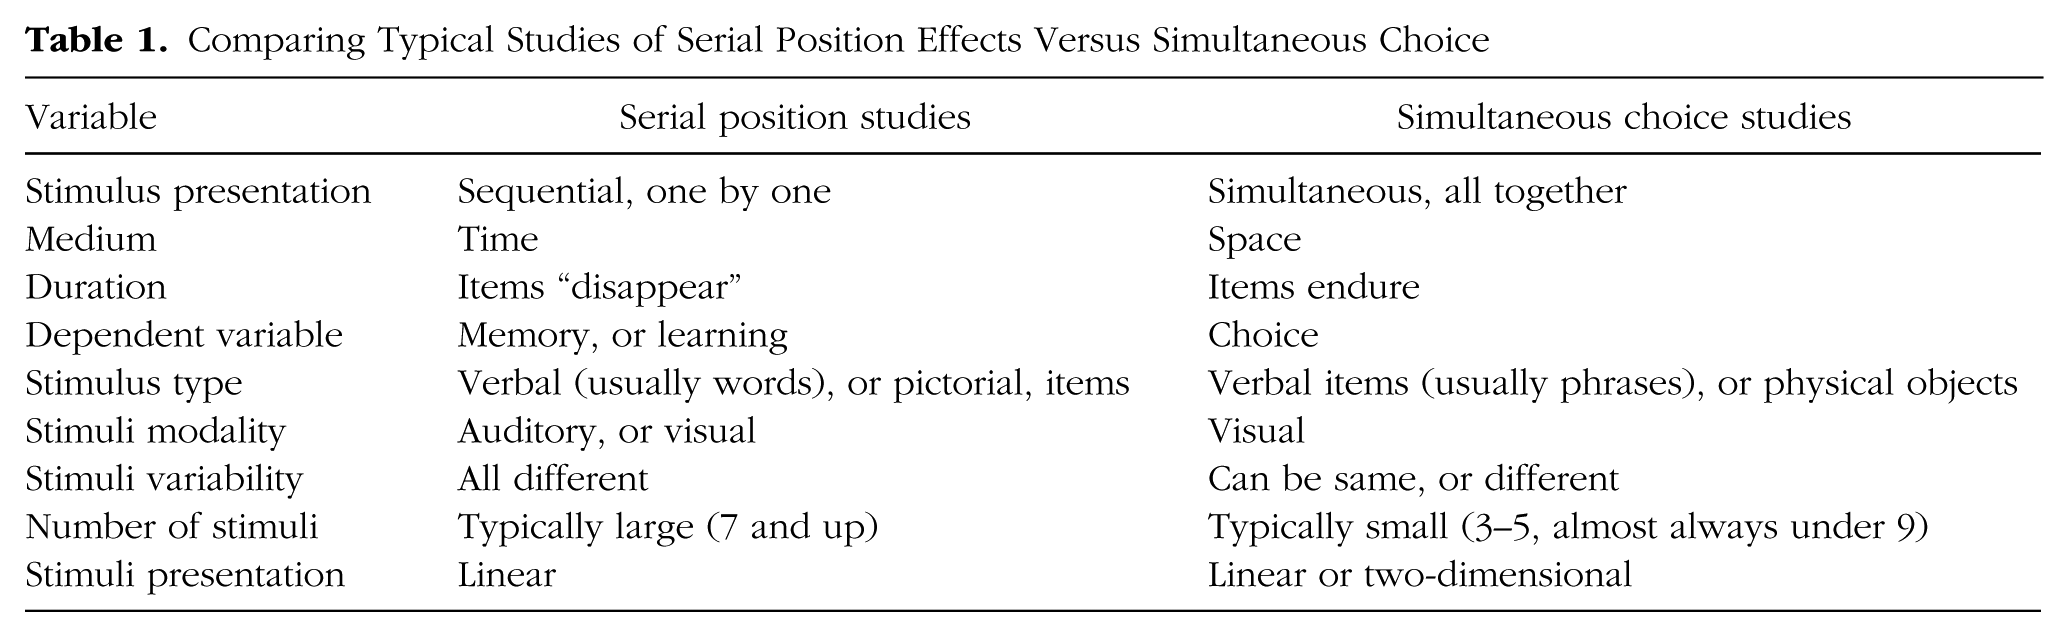
All in all, there seemed to be no good reason for menu planners to expect results pertaining to memory for items presented in sequence to be predictive of choice from items presented simultaneously. I accepted that in sequential stimuli presentation, middle positions in the sequence were disadvantaged as stated by the serial position effect and for well-understood reasons. In contrast, so I believed, in simultaneous presentation, the middle locations in a spatial arrangement seemed to enjoy an advantage, though one lacking a theoretical underpinning. My commitment to that belief doubtlessly contributed to my skepticism of those practical nonacademic “how to” manuals that suggested that menus are subject to edge advantage.
When Dayan and I embarked on our empirical study of position effects in menu choice (Dayan & Bar-Hillel, 2011), we fully expected to document another case of edge aversion. To our great surprise, we found the opposite: a clear and symmetrical (albeit small) bias favoring items at the beginning or end of the menu listings.
Shrugging our findings off as a fluke was not a serious option. We had too much data: one fully controlled lab study and one partly controlled real-world field study, involving hundreds of observations each; small menu categories (4 items), large categories (10 items), and middle-sized ones; familiar items (“Coca Cola”) and items that required a lengthy description (“Lambada – peppers, aubergine and zucchini roasted to perfection, caressed by olive oil, and topped by Feta and Mozzarella cheeses”); and different categories including appetizers, entrees, coffee drinks, and desserts. In all these, a menu item listed at the beginning or at the end of its category was more popular than when it was listed in the middle of its category. We had to take this result seriously.
The Triple Conundrum
By then, I was aware of a few other exceptions to middle bias in simultaneous choice. In one—a large literature on election ballots (e.g., Koppell & Steen, 2004)—being first, but not last, conferred the most advantage. In a couple of others—Wilson and Nisbett’s (1978) stocking choice study and Christenfeld’s (1995) route choice study—being last, but not first, conferred the most advantage.
In Bar-Hillel (2011), I attempted a literature review of position biases in choice from simultaneous displays. Although edge aversion consistently characterized nearly all of the studies I surveyed, no serious theory in the literature covered all the examples. There was, to be sure, psychological theory to explain the “compromise effect” in Likert-type scales (thus called due to the scales being ordered on some semantically meaningful ordinal scale, so that the physical middle of the list also holds the values which are the compromise of the extreme values at the edges). But I had excluded Likert-type choices, where the response stimuli are ordered on a semantically ordinal scale rather than arbitrarily. A compromise effect can certainly not explain preference for the middle stalls in a four-door public restroom or for the middle rolls from the four-roll toilet-paper dispensers within them (Christenfeld, 1995).
In particular, Bar-Hillel (2011) failed to answer three questions:
Why do MCTs show edge aversion?
Why do menus show edge advantage?
Why do such similar tasks (by the parameters of Table 1) show opposite effects?
Reframing the Conundrum
And then I had an epiphany: I had been making a wrong assumption. Because of my particular history, sketched above, I had assumed that edge aversion was the rule in simultaneous choice (albeit an unexplained rule) and that the menu results were the exception. But in fact it was the other way around: The menu results followed a well-understood psychological rule, and the MCTs were the exception to be explained.
This was the “correct” framing for no better reason than because I could provide the explanation. In hindsight, the epiphany seems obvious enough: It doesn’t really matter that menu items or MCT answers are presented simultaneously to the decision maker’s eye. As they need to be read and processed, both of which are sequential, they are not presented simultaneously to the decision maker’s mind. Whereas simultaneous versus sequential presentation is a feature of the choice architecture (namely, of the way the choice situation and the choices it offers are designed and presented), how the mind takes in the stimuli is a feature of the chooser’s psychology.
Although memory for listed items is no doubt aided by simultaneous presentation, the need to silently read items to oneself in sequential order renders them essentially the same as items read aloud to participants in serial position studies. That spatial presentation, like auditory presentation, is also subject to the serial position effect was already suggested and shown by Jensen (1962). In short, the display is simultaneous, but the intake is sequential. That sequential intake would be subject to serial position effects now follows naturally. So although this still leaves a conundrum to be solved, the conundrum is now not why menus differ from MCTs, but why MCTs differ from menus.
Classifying Studies of Position Effects in Simultaneous Choice
Two further realizations were needed, which came to me belatedly. One was that MCTs were as different from cans on a shelf as their obvious dissimilarities suggest. The middle bias characterizing both, as well as my ambition to abstract a single generalization from different specific examples, had blinded me to this fact. The other was that MCTs were actually quite different from menus, their superficial similarities notwithstanding. They differed because, importantly, MCTs, but not menus, can be viewed as a game of hide and seek. Test makers design their questions so as to hide the correct answer from unknowledgeable test takers, whereas the latter, knowledgeable or not, always seek to find it.
Figure 1 aims to categorize all studies of position effects in simultaneous choice presently known to me. The body of research surveyed, although larger than in Bar-Hillel (2011), is subject to the same constraints: Choice is from 3 alternatives or more (there can be no middle bias in binary choice), and Likert-type scales (where middle bias is confounded with the compromise effect) are excluded.
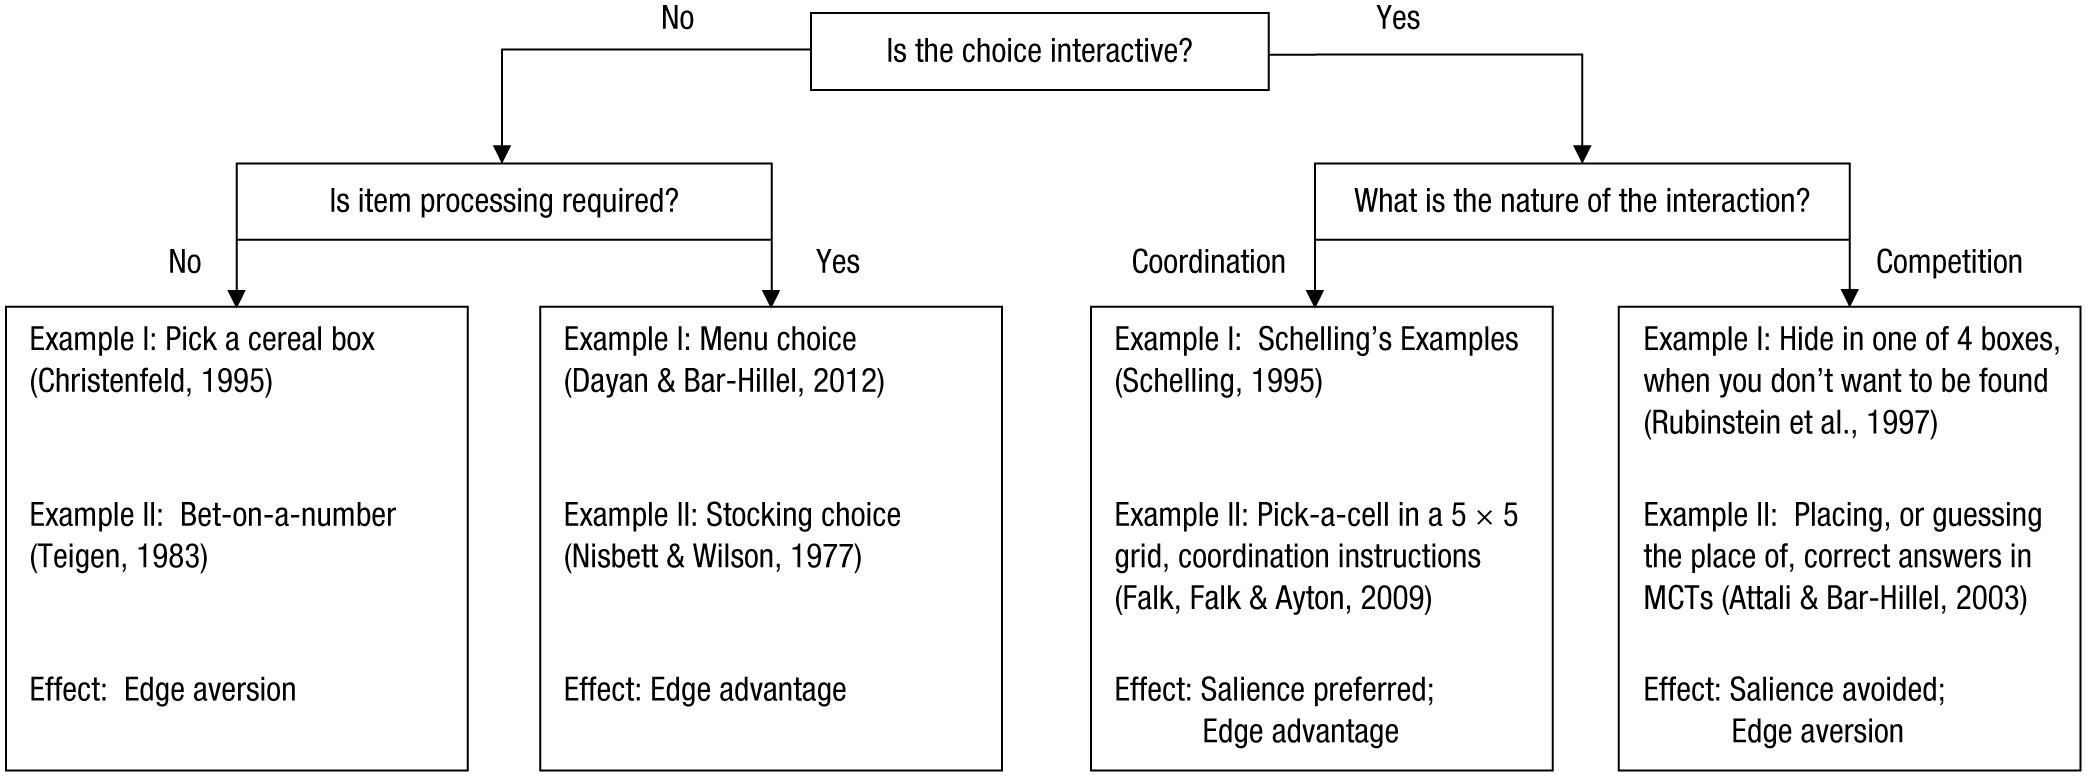
A classification scheme for simultaneous choice. The effects noted are typical, but subject to manipulation.
Tasks will be categorized into one of four boxes, and will be explained from just a small number of extant psychological effects (clarifications to follow): (a) reachability, for motor choices; (b) good representation, for mental choices; (c) serial position effects, for verbal choices; (d) focality, for interactive choices.
The first distinction the chart draws is whether the task facing the chooser involves individual decision making or interactive decision making. Interactive decision making is the subject of game theory and differs from individual decision making inasmuch as the payoff for one’s decision is affected by that of at least one other interested player (as agents are called in game theory). For example, when playing Rock, Paper, Scissors, no choice taken by the individual player is more or less valuable in itself—payoff is determined post hoc by the joint choices of both players.
The second distinction incorporates my belated insight that sequential processing, as in reading, imposes sequential intake on simultaneous displays. As we shall see, this distinction only matters (in the sense of leading to different position effects) when the task is not interactive.
The third distinction, necessarily, pertains only to tasks that are interactive and divides them into competitive games, such as chess or tennis, where one’s loss is the other’s win, versus games of coordination, in which the players can both win, as when trading or collaborating. 3 The distinctions, and the psychological principles relevant to them, will be elaborated upon as we classify the studies into the four outcome boxes of Figure 1.
Choice That Neither Requires Processing Nor Is Interactive (Leftmost Box)
Two kinds of choice objects in the literature require no processing: those that are evidently identical, and those that are evidently equivalent. By “evidently” I mean that their identity, or equivalence, is so obvious that it is realized automatically. And inasmuch as all intake requires some processing, here I mean it in the sense of “figuring out.” For example, one immediately sees that several soda cans are identical but needs some processing to figure out what’s in them.
Evidently identical items
In 1995, Christenfeld wrote a paper titled “Choices From Identical Options”—the kind of choosing that Ullmann-Margalit and Morgenbesser (1977) called “picking”. To his title I would add the adjective “evidently,” to distinguish it from the case in which the items in the choice set are indeed identical, but the participants don’t know it (e.g., Wilson & Nisbett’s, 1978, stockings, to which we shall return). Christenfeld focused on evidently identical options because of his interest in choice that has no differential consequences and requires no deliberation.
Christenfeld (1995) used a wide variety of stimuli in his paper. In one study, in a real-world supermarket, he recorded choice from shelf displays of as many as 40 kinds of identical products (cans, boxes, bottles, packets, etc.). The number of identical products displayed simultaneously ranged from 3 to 8. In another, he recorded real-world choice of stalls in a four-stall men’s public restroom, which stretched away from the entrance, and choice of toilet-paper from a four-roll horizontal lineup on the right wall of the stalls. And in a third study, he asked laboratory subjects to mark an X in one of a row of 3 circles or to circle one X from a row of 4 Xs. A discussion of his final study, choice of routes, is deferred till later. In all but the last, Christenfeld found that choosers “avoided the ends and tended to make their selection from the middle” (1995, p. 50). Specifically, the percent of choices of the first and the last item in the display was less, sometimes far less, than would be expected by chance.
Shaw, Bergen, Brown, and Gallagher (2000) expanded this set by asking participants to sit on one of three chairs, to pick a survey to answer from one of three piles, or to help themselves to one of three highlighters. The choice sets were displayed linearly, “directly in front of the participants … so that they clearly occupied left, middle, and right positions” (p. 159). Overall about two thirds of the choices were of the middle item.
Christenfeld tentatively speculated “that minimizing mental effort is the common principle” (Christenfeld, 1995, p. 55), saying little about what that means, exactly, or even about how it accounts for his restroom stalls results. Shaw et al. (2000), after ruling out two alternative explanations, agreed that Christenfeld’s principle “[t]hough reasonable, remains speculative” (p. 161).
However, it is not necessarily mental effort that is being minimized, but also physical effort: Note that these tasks are all perceptual-motor tasks. In Shaw et al.’s (2000) experiments, the displays were designed to be symmetrical with respect to the subject’s body. Christenfeld’s (1995) lab experiments were similarly symmetrical, but the restroom doors were explicitly not, and nothing is reported about the shoppers’ orientation with respect to the supermarket products. It is a likely guess, however, that shoppers turn to face them at the time of actual choice, no matter in which direction they were walking. Eye-tracking studies show that items in the center of a horizontal array receive more visual attention and “that the indirect impact of horizontal centrality on choice is through visual attention” (Atalay, Bodur, & Rasolofoarison, 2012, p. 849). Taken together, this suggests that central items were located symmetrically with respect to the chooser’s body and visual field.
This brings us to the psychological principle of reachability (Bar-Hillel, Peer, & Acquisti, 2014). This principle states that when other things are equal—as when choosing from evidently identical objects—the object located where it is easiest to reach or to reach for will be favored, and this holds in the mental and physical domains alike. In the physical domain, “easiest to reach” will typically be the object closest in space (or in time) to the choosing agent. In the mental domain, it can be the mental object that runs first through the mind or is taken in first by the mind, in the same sense that the first word of “Jack and Jill went up the hill” (“Jack”) mentally precedes, say, the 5th word, “up”.
In almost all of the tasks described above, items placed in the middle of the array of possibilities were more reachable than those at the right end or the left end, because they were closer to the agent. When reaching for something within a small symmetrical display (vis-à-vis the chooser) by extending one’s arm, the middle is most reachable not only geometrically, but in another sense as well: It is less sensitive to fine motor tuning and more robust to inaccuracies. Not needing fine tuning enhances reachability—a tennis ball is more reachable than an aspirin pill (or, for that matter, a basketball), if location is held constant. If one had to pick an object from an array of identical objects and reached for its middle, one could be almost assured of success even if doing so blindfolded and sloppily. Reaching for one of the ends is trickier—a slight deviation and one could miss it (see also Christenfeld, 1995, p. 52).
But Christenfeld (1995) reports two exceptions to contend with. One involves choosing a route between two points, and will be deferred to the following section where it belongs (since the routes, Christenfeld’s title notwithstanding, were not identical). The other concerns the restroom stalls. There, reachability presumably decreases with the stall’s distance from the entrance, so the first door should have been the most popular choice. 4 At 22%, it was not. But from there on, the second stall (31%) was more popular than the third (29%), which was more popular than last (17%), which was both the least reachable and the least popular door, as it should have been.
I can only speculate ad hoc about the restroom doors. Although all doors are identical ex ante (but for their location), ex post the most popular doors will lead to the least clean stalls. Possibly what crosses a user’s mind as she makes a dash for the toilet is “I’ll skip the first door, because everyone else will have preferred it.” This type of thinking, myopic as it is in the strategic sense, nonetheless originates from a valid reachability intuition. It also suggests that if one knows that the restrooms have just reopened after having been cleaned, one might hit the first door first, as predicted by reachability. 5 In other words, sometimes choice of a restroom stall may actually involve interactive reasoning, thus placing it outside this box.
Christenfeld (1995) mentions quite casually, and without data, that “It is the nature of shoppers to take items only from the front of the shelf” (p. 50), even if the shelf has not been restocked and the next item back is therefore exposed. This tendency, too, is easily explained by reachability—that item is further away, therefore less reachable. This example shows that although reachability may favor middle items in a frontal lineup, it confers an advantage to being first in a receding lineup. Moreover, it could confer an advantage to any location at all in a vertical lineup, if, for example, that location were at about eye level and the other items were located either too high or too low to be reached for comfortably. Indeed, when Dreze, Hoch, and Purk (1995) in a controlled but real supermarket study, moved toothbrushes “from the top shelf (72 inches above the floor) to a shelf that was at eye level (56 inches)” (p. 307), sales increased by 8%.
To conclude, if choice among identical items in a horizontal physical display is implemented by motor action, the choice will be biased by reachability: Often, but not necessarily, this favors central items, because the choice is made from a symmetrical position vis-à-vis the display. Of course, the choice architecture can be such that it is not the middle items in a line that are most reachable.
Evidently equivalent items
The prototypical task requiring choice among evidently equivalent items involves choosing a number or numbers, as when playing the Lotto or Powerball, where all the numbers in the choice set are known to be equiprobable and only nominal. In these tasks, choice may be implemented not by motor action, but mentally (and usually expressed orally). Excluding cases where one endows some of the numbers with special personal meanings (“my lucky number,” “my birthday,” etc.), even purely nominal numbers are “contaminated” by the properties of ordinal and cardinal numbers and, like them, are better represented by numbers occupying central positions than by extreme positions (namely, smallest or largest). The middle is inherently perceived as less biased, in a manner of speaking, than the edges, perhaps because it doesn’t involve “taking sides.”
Teigen (1983) asked participants to guess what number would come up in a random draw of one of a dozen tickets marked from 1 to 12. “While the draw itself was purely random, the guesses were clearly not. … the four central values (5, 6, 7, 8) [were] the most popular ones … chosen by 58.9% of the subjects” (p. 14). Attaching a small monetary prize to a correct prediction, raised the popularity of the four middle numbers to 76%. When Tickets 1–6 were of one color and Tickets 7–12 of another, it was the middle numbers in each color category that were most popular, replacing the numerical middle of the entire set. Unlike the case of evidently identical items, choice in this task is not spontaneous. Teigen believes his respondents deliberately aimed for a representative number, taking the trouble to “… eschew numbers with prominent, “non-random” properties, which at the same time are highly available to the subjects” (p. 13).
Earlier, Kubovy and Psotka (1976) had similarly proven that deliberation is involved in such a number-choosing task. “When asked to report the first digit that comes to mind, a predominant number of the respondents choose 7… [However], if 7 is mentioned by the experimenter as an example of a response, its frequency drops significantly … [I]f a number in the 20s is requested, … 27 is [again the predominant choice]., but if a number in the 70s is requested, 77 is chosen only by 15.5%. All these results [and others they report] are consistent with the idea that subjects choose the response such that it will appear to comply with the request for a spontaneous response” (p. 291, italics in original). In the present terminology, respondents choose the response that best represents the choice set at hand. This number is often in the middle of the ordered mental choice set though not necessarily in its dead center. A middle number can lose its “good representation” quality once it is singled out as special (the dead center, where there is one).
A real-life example can be found, of all places, in fraudulent tax returns. The income reported in honest tax returns complies with the surprising and unintuitive Benford’s Law (Benford, 1938). “… [A]lso called the First-Digit Law, [it] refers to the frequency distribution of digits in many (but not all) real-life sources of data. In this distribution, the number 1 occurs as the leading digit about 30% of the time, [with the digits 2–9 decreasing in frequency monotonically, until] … 9 as the first digit [occurs] less than 5% of the time” (http://en.wikipedia.org/wiki/Benford's_law). Fraudulent tax returns, not being naturally occurring numbers but rather fabricated by dishonest humans ignorant of Benford’s Law, do not conform to this distribution. If the leading digit in such data were chosen at random, one might expect it to be uniformly distributed. However, the distribution reflects the modal individual’s bias to fabricate a representative-looking fraudulent number, consequently showing marked edge aversion (see Fig. 2): “… in general, fraudulent or concocted data appear to have far fewer numbers starting with 1 and many more starting with 6 than do true data” (Hill, 1998, p. 363).
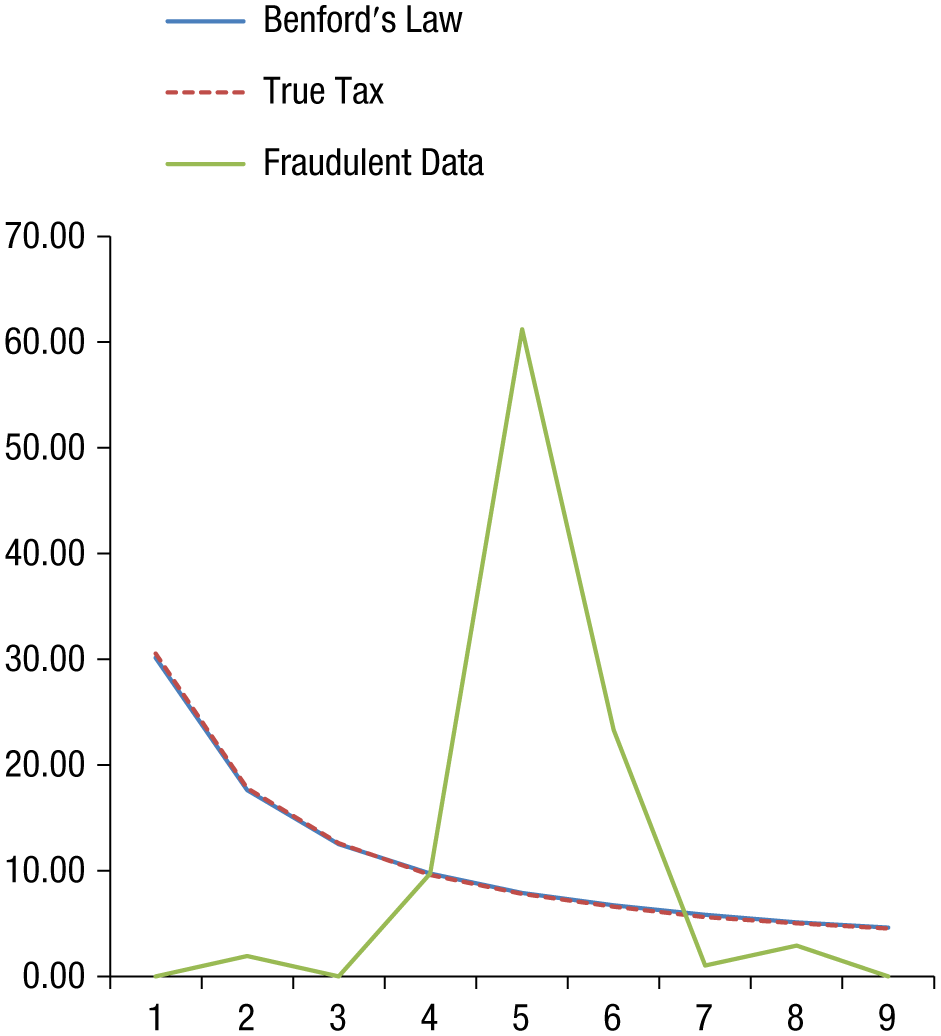
Distributions of real versus fraudulent tax data (from Hill, 1998, p. 363). At this resolution, the True Tax line is indistinguishable from Benford’s Law.
Recall that Teigen’s dozen numbers were written on a blackboard from left to right, so their abstract numerical order was fully correlated with their concrete spatial location. But what happens when numbers are chosen in a game of roulette, where their location on the physical wheel does not mimic their ordinal properties (see the wheel in Fig. 3)? Sundali and Croson (2006) collected data on roulette gambling in a real American casino, reporting the frequency of bets placed on each of the 36 roulette numbers. Roulette bets were placed physically on a 3×12 grid drawn on the green felt roulette table (see Fig. 3a) around which gamblers sit or stand. Ten numbers are in its spatial middle (flanked on all sides by other numbers), and the other 26 numbers are on the edges (have one or two exposed sides). This grid, like the wheel, destroys the agreement between physical and numerical middle.

a. A schematic diagram of an American Roulette betting table. b. Number of bets placed on the 36 numbers in a real game of roulette. The more bets placed, the darker the color (based on Bar-Hillel & Zultan, 2012).
Had Sundali and Croson (2006) imposed their data on the betting table, they surely would not have missed the evidence for spatial edge aversion. The two most popular positions were numbers 17 and 20 (but not 18 and 19) in the center of the betting table. The least popular were 1, 3, 4, and 6 (but not 2 and 5) on the left side edge. On average, each of the 10 spatially central positions (which exclude some of the arithmetically central numbers) got at least 40% more bets than each of the 26 edge positions (3.6% vs. 2.5%). These data are displayed in Figure 3b, imposed on the betting table. Clearly, the center of the betting table is the most popular betting location. But the right-hand side reveals a more complex story, which is pertinent to our concern.
Implementing a bet in roulette involves motor action. It is somewhat harder for gamblers on the right side to reach the center of the table than for gamblers on the top and bottom sides, even though that is where the most representative numbers are. Gamblers don’t stand on the left side of the table, because that is where the wheel is. The figure shows what happens when all this is put together, with good representation and reachability playing in tandem. The edges are not popular, because—though easily reachable—that is not where the representative numbers are. The right side has its own little secondary “center” to serve those who find it hard to reach the numbers in the primary center. The left side is altogether unpopular, because it is hard to reach for all gamblers, as none are actually standing there. Finally, the lower edge is more popular than the upper edge, presumably because the table’s center is just a bit further to reach for people standing there than it is for people at the upper edge.
Christenfeld’s (1995) routes and mazes study, in which respondents were presented with hypothetical choices from schematic maps, or with real choices in real walks, also belongs in this box, because the choice objects were equivalent rather than identical. For example, participants in one experiment chose hypothetically one of three possible routes between two points in a schematic sketch (Fig. 4). The three routes had the same total length and number and sequence of left and right turns, but differed in where along the route the turns were presented. “The clearest pattern … is people’s preference for the last available route” (p. 54, italics added). The first two routes, but not the third, presented the navigator with a binary choice between continuing to walk straight ahead or turning. However, in the third and last route, the turns, by the time they were made, were no longer optional. That was the preferred route. A similar result was found in the other conditions as well.

One of the route choice tasks studied by Christenfeld (1995, p. 54).
Christenfeld (1995) again attributed the advantage of the last route to his notion of mental ease, which here meant “not worrying about where to turn until one has to” (p. 55). His data can also be viewed in a manner consistent with my notion of reachability: a path continued without turning is arguably more reachable, by reason of physical inertia, than is a path one needs to turn onto.
In the previous section, I noted that reachability, being a function of choice architecture, need not always favor central items. Christenfeld’s routes provide such an example.
To conclude, if choice among evidently equivalent items is made mentally (as from sets of nominal numbers), it will be biased by aiming for good representation. If its implementation also requires motor action (e.g., placing roulette bets or walking a route), 6 it will also be affected by reachability. Reachability, depending on choice architecture, could conflict with good representation.
Choice Which Requires Processing but Is Not Interactive (Second Box)
Dayan and Bar-Hillel’s (2011) menu study is the prototypical study of a choice requiring processing but not interactive reasoning. Menus must be read and comprehended, but are not likely to cause one to second guess the menu designer. Menu listings are most likely read, as verbal text is, from top to bottom, which determines the order of the sequential intake. Due to the obvious need to control for the intrinsic popularity of some items over others, we did not directly compare the popularity of items on the edges of the list to items in its middle, but rather the popularity of items when listed on the edges to their own popularity when listed in the middle. Even though the menu items were all present simultaneously, the lists consisted of more than can be held simultaneously in short-term memory. Once one needs to remember all listed items, the advantage the edges have in memory will be reflected in their reachability for the purpose of choice.
In Ert and Fleischer’s (2014) study of simulated online hotel choice (with 10 different orderings), “The screen presented 10 [real] four-star hotels … with a close range of review scores … and prices” (p. 4). Their results agreed with the menu study: “[H]otels … listed at the top and bottom of the list were more likely to be chosen than those listed in the middle” (p. 1).
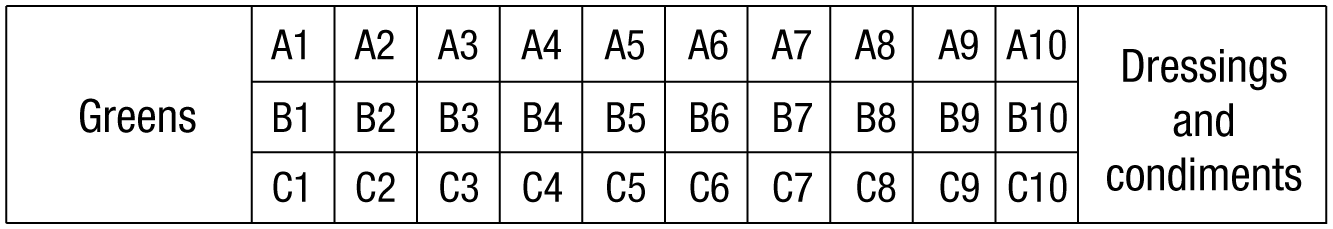
Another study in this box involved choice of items from a salad bar, which was laid out under a sneeze guard, as in Figure 5—a spatio-physical menu, if you will. Rozin et al.’s (2011) salad bar was self-service and pay-by-ounce. As in our menu study, from day to day, trays were moved around experimentally from the middle row to the sides and vice versa. Thus, item popularity could be compared within items across locations, controlling for differences in their base-rate popularity. The salad bar study is classified into this box because the content of the different trays presumably had to be processed in order to figure out what food they held. Although we don’t know in what order that happened, it is unimportant due to the motor implementation of the choice. The results showed an edge advantage, which in this case means that an item was more popular if placed in Rows A and C as compared with the less reachable row B 7 between them.
The edge advantage shown in the menu and hotel choices versus that shown in the salad bar choices result from different psychological principles. In the latter, where choice is implemented by a motor action, the edge advantage results from motor reachability. In the former, where choice is determined mentally, it is governed by the serial position effect.
This box also houses a large class of studies concerning the effect on voting of candidate name order in election ballots. Its reliance on real-world data makes it particularly interesting. On the one hand,“[p]olitical professionals have long taken for granted that the top spot on the ballot provides an advantage” (Koppell & Steen, 2004, p. 267)—an opinion supported by the empirical evidence. Alas, however, in a survey of ballot position effects, Darcy and McAllister (1990) concluded “that much of the current literature is methodologically flawed, fails to take into account competing explanations for the effects which are found, or presents evidence from case studies that have little in common” (p. 5). Miller and Krosnick (1998) concurred: “Although a number of studies have been conducted to test for name-order effects on voting, these studies turn out to be of limited value” (p. 295). This was primarily because voters were not assigned at random to different name orders.
Fortunately, sometimes life presented quasi-controlled studies of real voting data. For example, Miller and Krosnick (1998) analyzed 1992 election returns from Ohio, in which name order was rotated. Name-order effects, when found, “nearly always advantage[ed] candidates listed first” (p. 291). Koppell and Steen (2004), used data from vertical ballots from the 1998 Democratic primaries in NYC “that rotate[d] precinct-by-precinct the order in which candidates’ names are listed” (p. 268), and they reported that “In 71 of 79 individual nominating contests, candidates received a greater proportion of the vote when listed first than when listed in any other position” (p. 267).
The first position advantage is explainable with Krosnick’s (1991) satisficing theory. This theory states that “when optimally answering a … question would require substantial cognitive effort, some respondents simply provide a satisfactory answer instead. … Satisficing may lead respondents to employ a variety of response strategies, including choosing the first response alternative that seems to constitute a reasonable answer” (Krosnick, 1991, p. 213). Often, for one reason or another, names on ballots are largely unfamiliar to a sizable part of the voters, who are credited with the effect that name position has. Such uninformed voters “may simply settle for the first name listed, because no reason is apparent suggesting that the candidate is unacceptable” (Miller & Krosnick, 1998, p. 295).
First name advantage can also be explained in terms of reachability. For uninformed voters, the ballot presents a choice among options that should be processed but are essentially (though not evidently) equivalent, inasmuch as these voters know nothing about them. Giving up on processing the names, they then reach for the first one simply because it is the one reached first. It is not that they judge the first candidate to be best for them, it is that they decide it is best for them to settle for the first candidate.
Miller and Krosnick also predicted that “when voters can retrieve only reasons to vote against competitors” (1998, p. 295) the last name will have the advantage. This, too, can be accounted for by reachability. In this condition, people are driven to continue reading down the list, since every name they read evokes rejection, not acceptance. Once the end of the list is reached and no name has been accepted, the last name, being the most recently considered, is the most reachable. Again, it is not that the last candidate is judged best, but that it is deemed to be best to choose it once one has reached the last candidate.
A similar account might well explain the result of a famous study by Nisbett and Wilson (1977; for more detail, see Wilson & Nisbett, 1978), in which being last—but not first—was best. Store customers “were invited to evaluate … four identical pairs of nylon stockings … to say which … was the best quality … . There was a pronounced left-to-right position effect, with the right-most [and last] stockings being preferred over the left-most by a factor of almost four to one [12%, 17%, 31%, 40%].” (Nisbett & Wilson, 1977, p. 243). This study highlights the fact that what matters is not whether the choice items are in fact identical, but whether they are evidently identical. The respondents in this task were not told that all stockings were identical and were led by the demand characteristics to believe that they were not. Wilson and Nisbett speculated that the “last was best” effect is “a temporal order effect rather than a spatial position effect. Subjects almost universally “read” the stockings from left to right, probably because they were labeled A, B, C, D.” (Wilson & Nisbett, 1978, p, 124). Since differences would have been hard to detect (there weren’t any, objectively), these shoppers are like those voters forced to hear all the candidates’ names without really being able to detect differences among them: They are biased by reachability to choose the last one. Notably, whereas physical reachability typically favors middle items (when the spatial display is horizontal and symmetrical), mental reachability typically favors one end or the other because of the serial nature of processing or of recall.
To conclude, if item intake is sequential (menus) and choice is mental, it is subject to the serial position effect. If circumstances involve near-impossible distinctions (ballots for uninformed voters, identical stockings for misinformed shoppers), choice is biased by mental reachability. All these favor one edge or another over the other positions. In addition, as always, if the implementation requires motor action (salad bar), it will also be affected by physical reachability as determined by the choice architecture.
I wish to note that I am not rejecting the specific accounts offered by authors for their specific position effects. I do not reject Christenfeld’s (1995) mental ease idea, Krosnick’s (1991) satisficing theory, Nisbett and Wilson’s (1977) “consumer’s habit” speculation, or Rozin et al.’s (2011) term, accessibility. I merely show how a single principle, reachability, which applies to the physical and as well as to the mental, subsumes all of them (as well, we shall see later, as the center-stage hypothesis), at least in the present contexts. None of those authors aspired to explain all position effects, and none, dare I say, would have succeeded doing so with their own specific account.
Interactive Choice (Righthand Boxes)
The boxes on the right side of Figure 1 comprise choices made in the course of interactive interactions. The studies in these two boxes were mostly carried out with game theory explicitly in mind. A notable exception are MCTs, first construed as a competitive game in Bar-Hillel and Attali (2002). I shall discuss both cooperative and competitive interactive choices together simply because they were usually studied together and because contrasting them with each other within studies is illuminating.
Schelling (1960): Coordination games
In one of the earliest experimental studies of games, Schelling (1960) informally reports on an “unscientific sample of respondents” (p. 55), and, I might add, an unscientific sample of tasks. Some required a bit of item processing, but most did not. I shall ignore those tasks that did not involve position effects. Schelling focused on coordination games, where the two players are best off if they make the same choices. He aimed to demonstrate that people could coordinate their choices far better than chance, without any exchange among them, based on common intuitions “of prominence or conspicuousness” (p. 57). Common here means both “commonplace” and “held in common”. Schelling no doubt designed his tasks guided by intuition, making coordination pretty easy. I detail some of Schelling’s examples below.
Example 1: “Name ‘heads’ or ‘tails’. If you and your partner name the same, you both win a prize” (p. 56). Of 42 respondents, 36 named “heads.” Schelling’s intimates that by just being first, “heads” is more salient than “tails” (see Bar-Hillel et al., 2014).
Example 2: “Circle one of the numbers listed in the line below. You will win if you all succeed in circling the same number” (p. 56). The numbers shown were: 7, 100, 13, 261, 99, and 555 (in that order). The three most popular choices, in descending order, were 7, 100, and 13, which together accounted for 37 choices out of 41 (Schelling gives no more detail). Again, since no stimulus is more clearly salient than the alternatives, advantage accrues to being first.
Example 3: “Put a check mark in one of the sixteen squares [of a 4-by-4 array of empty squares]. You win if you all succeed in checking the same square” (p. 56). Of 41 respondents, 24 chose the top-left square, arguably one of the four most salient cells in the array (i.e., the corner cells) and the “first” cell by reading habits.
Example 9: Following a tie in a ballot vote, a “second ballot is about to be taken. … you will be rewarded if someone gets a majority … and you vote for [him].” (p. 57). Of 18 respondents, 16 gave their vote to the first of the two tied candidates.
In present terms, Schelling’s stimuli were “evidently equivalent.” Had participants been only asked to pick one stimulus, without the coordination instructions, the task provided little if any reason to prefer one over the other. In that case, a “representative” stimulus would have been most likely to be chosen, which would not have been at the edges. But the fact that coordination with another player is called for is a game changer, to turn a phrase. Participants are now seeking a pointed tie breaker, which could serve as the focal choice (Schelling’s term) on which to coordinate. The guiding principle here is to escape from the ordinary, from the humdrum, from the representative, and move toward the unique, the special, the standout. 8
When the options are not seen as equivalent, then content salience could trump position salience, perhaps obviating position effects. Schelling’s other examples demonstrate that. One can only speculate which choice would have been the favorite had Schelling presented a number sequence such as 2, 4, 6, 8, 10, 13, or 2, 4, 6, 13, 8, 10. Position only serves as tie breaker where there is a tie. In these two hypothetical examples there isn’t one—13 breaks it.
Rubinstein, Tversky, and Heller (1997): Games of four positions
Coordination games, especially when they have an intuitive focal point, are fairly easy to play, because the focal solution is at so-called equilibrium. This means that if you think the other player thinks like you, it bolsters the appeal of your own inclination. In contrast, in a competitive game, such as Matching Pennies, neither of the choices is an equilibrium. If you think the other player thinks like you, you can settle on neither Heads nor Tails. Only the breakthrough idea of randomization achieves equilibrium.
Rubinstein et al. (1997) looked not only at coordination games, but also at other incentive structures. In a within-subject design, they “investigate[d] the behavior of players in a series of 6 two-person … games. One player “hides” a treasure in one of four [lined up] locations, and the other player “seeks” the treasure” (p. 394). In each game, one of the four locations was made experimentally salient by marking it separately from the other three (e.g., by labeling the locations Polite, Rude, Honest, and Friendly).
The subjects playing a coordination game were told “both players receive $10 if they select the same item, and nothing if they select different items” (p. 396). Between 54% and 88% of the time (with an overall mean of 78%, compared with 25% expected by chance) these participants chose the focal item, regardless of its position, which gave them both a high probability of “earning” the reward.
The competitive group was told “The seeker wins if her choice matches the hider’s choice [i.e., she finds the hidden treasure]; the hider wins if it does not” (Rubinstein et al., 1997, p. 394). Here, the favored choice was no longer the focal item. Rather,“[a]voiding the endpoints in all six games was the single most common pattern” (p. 399). Hiders chose a middle item 72% of the time; seekers chose a middle item 69% of the time. 9 Finally, in a slight variation in which none of the four options was salient, hiders chose the middle 57% of the time, and seekers chose it 64% of the time. This pattern benefits seekers only—it is detrimental to hiders.
A third condition was termed discoordination by Rubinstein et al. (1997). A pair of subjects were rewarded only if they selected different items. In this condition, the middle items were chosen 57% of the time, and the focal items were chosen 30% of the time—both higher than chance. These results are a washed-down version of those in the competitive game, as indeed a discoordination game itself is.
From the point of view of game theory, Rubinstein et al.’s (1997) respondents did better playing the coordination games than the competitive games, which is hardly surprising in light of what was earlier said about equilibrium choices. “As expected, they selected the focal item in the coordination games … In the competitive games, however, the players … [were] not guided by valid strategic reasoning … [but by] a common response tendency” (p. 402).
Falk, Falk, and Ayton (2009): Games of 5-by-5 positions
In Falk et al. (2009)’s comprehensive study of position effects in interactive choice, participants chose three cells (or, in a task variation, one cell) of a 5 × 5 cell matrix. There were seven sets of instructions—of which the four that were interactive (the first four of the seven listed below) also assigned participants a game role of hider or seeker. 10 The three noninteractive conditions actually belong on the left side of Figure 1, but are discussed here because the seven conditions produce a coherent narrative.
Competitive hiders: Mark X in a cell, so that it would be hard to find
Competitive seekers: Find the cells in which the Xs were hidden
Cooperative hiders: Place X in a cell where you want it to be found
Cooperative seekers: Find the cells meant for you to find
Indefinite: Mark X in a cell
Randomization: Mark X in a cell chosen as if blindly
Aesthetic: Mark X in a cell “so as to get a pleasant looking pattern” (Falk et al., 2009, p. 207).
In light of what we have learned so far, cooperative hiders and seekers and the aesthetic instructions group should resemble each other and act differently than the competitive and randomization groups, which should also resemble each other. This because the former are expected to seek the salient and the symmetrical, whereas the latter are expected to shy away from the salient and the symmetrical and instead seek the representative and middling. It is hard to predict the indefinite group within the present account, as there is neither an incentive structure nor is the task a motor-perceptual one. If, in the absence of incentives, they therefore choose to just please themselves, they would presumably resemble the aesthetic group.
The results were clear and decidedly nonuniform. Falk et al. (2009) summarized them thus: “People [in all conditions] agree on salient and on nonsalient options, both of which are preferred under different instructions” (p. 203). Specifically, there is a universal agreement that the dead center is the most salient cell, followed by the four corner cells. That leaves 12 “ordinary” edge cells, and 8 “ordinary” middle cells. The salient cells were favored by cooperating hiders and seekers and eschewed by the competing hiders and seekers. The “aesthetic” and “indefinite” respondents most closely resembled the cooperative respondents (their favorite cell was the dead center), and the “randomizers” most closely resembled the competitive respondents (their favorite cell was one of the two cells just above the dead center on the diagonals). Besides all this, all respondents in all seven conditions, for one cell as well as for three cells, by and large preferred the 8 “ordinary” middle cells (9 minus the dead center) to the 12 ordinary edge cells (16 minus the 4 corners). This is roughly as would be expected on the basis of what we already saw in Schelling (1960) and in Rubinstein et al. (1997).
Attali and Bar-Hillel (2003): MCTs
The three previous studies, while requiring little if any processing, required the same level of processing from each player. The case of MCTs shows elegantly why it doesn’t matter how much processing is required, as the test takers, whose choices necessitate thorough processing, and the test makers, whose choices do not, show the same tendencies. Indeed, the position biases shown in MCTs resemble those shown in the explicit hide-and-seek games of Rubinstein et al. (1997). Question designers, like hiders, tend to place the correct answer in whatever position seems like “the best hiding place.”
It is possible to deprive test takers of the possibility of processing answers, as in the following, admittedly bizarre, task. The question “What is the capital of Norway?” was followed by 4 wordless positions A, B, C, and D. Of 69 guessers, 88% circled positions B or C (Attali & Bar-Hillel, 2003, p. 112).
In contrast, in a task that was not hide-and-seek, but more like a blind menu choice, or like a meaningless ballot, Coney (1977) asked a total of 272 respondents “to choose the ‘best brand’ from four beers labeled A, B, C, or D” (p. 386)—the brands were presented in four different orders, so that each letter was in each position once. No other information was given. Overall, Brand A was the most popular (40%), and Brand D was the least popular (17%), irrespective of their position. In contrast, when the beers were labeled H, L, M, and P, the first position was most popular (32%), and the last was least popular (17%), irrespective of which letter was in that position. As Coney pointed out, A, B, C, and D have connotations, but H, L, M, and P do not. When there are connotations, they determine the popular choice. When there aren’t, reachability does—hence popularity declines with ordinal position.
Note that edge aversion in MCTs differs from that found in the leftmost box inasmuch as it does not arise from automaticity and indifference, but from the opposite: a deliberate desire to thoughtfully choose a good place wherein to hide (or seek) the correct answer. Putting the correct answer in the middle of a list of distractors is anything but minimally effortful. Minimal effort would have test makers place the correct answer in the first position—they have it in mind before they come up with the distractors, and they might as well get it out of the way—rather than retaining it in memory while inventing distractors. 11
Valenzuela and Raghubir (2009): The center-stage effect
I had suggested earlier that restaurant patrons seldom wonder why a menu is ordered as it is (if and when they do, menu choice would move to the right, rather than the left, of Fig. 1). Consider, for example, the day’s special. If one believes that the restaurant highlights its winners in the specials, one might be inclined to order a special, whereas if one believes that the restaurant uses the specials to get rid of its losers, one might avoid ordering from them. Alas, there are no empirical studies that test these predictions. But the next set of studies did look at what happens when subjects approach a noninteractive situation with strategic beliefs in mind. 12 The situations are not interactive inasmuch as the other “player” is static and is not assumed to actually be playing an interactive game with the respondents. They are strategic inasmuch as the respondents are hypothesized by the researchers to be second guessing that other player.
Valenzuela and Raghubir (2009) showed, that “when consumers’ [sic] believe that the order-of-presentation of items reflects retailers’ strategy they expect that retailers place the most popular item in the middle of an array. When their purchase goals are consistent with purchasing the most popular item, then this inference translates into an item in the center being more likely to be chosen” (p. 194). In their Study 1, for example, “Participants were told that as a token of appreciation for their participation they were going to receive a packet of chewing gum. They could choose from three varieties: Spearmint (S), Peppermint (P) and Winterfrost (W) that were presented in three different orders. Participants’ choice was unobtrusively recorded. … The chewing gum variety placed in the middle was chosen half the time” (p. 188). The authors add much experimental evidence to support the validity of the center-stage belief, that people really hold it, and that it is this belief rather than alternative explanations that accounts for this middle bias. I take no issue with their account or evidence, but I wish to point out that reachability would have predicted the same more parsimoniously. Ironically, Valenzuela and Raghubir believe that theirs is the more parsimonious account, saying “The belief-based model parsimoniously explains earlier findings by Christenfeld, 1995 and Shaw, 2000, which showed consumers’ preference for the middle option among an array of identical items” (p. 194). But what does it mean that people believe the most popular item is placed in the middle of an array when the items are all identical?
Had the chewing-gum task not utilized motor choice from among physical objects (as I infer it did from the words “choice was unobtrusively recorded,” p. 188), but rather were verbally selected from objects described to the individual, the authors would still have predicted a middle bias, whereas reachability would have predicted an edge advantage. This “critical experiment” has not, however, been conducted.
Of course, once people entertain beliefs about how store displays come about (a possibility I dismissed when classifying Christenfeld’s supermarket study into the leftmost box), reachability might well be overridden by strategic reasoning. Suppose, for example, that one believes that the yogurt display in one’s supermarket is restocked by pushing the old containers to the front to make room for the new ones in the back. Then one might well extend one’s arm deep into the display in order to access the newer, fresher, containers, in spite of that location’s diminished reachability.
In an earlier study, Raghubir and Valenzuela (2006) applied the “center-stage effect” to derive interesting predictions about social-psychological variables such as impression formation and people judging. There, the center-stage effect was not about product placement in stores, but rather about the belief that “important people sit in the middle” (p. 66). Again the authors added much experimental evidence to support the validity of this version of the center-stage belief, that people really hold it, and that it is this belief rather than alternative explanations which accounts for this middle bias.
Be that as it may, I reiterate that it is not clear that there is added value to the center-stage idea in itself for predicting position effects. There are obvious reasons why important people would indeed be assigned to center stage in many kinds of horizontal arrays (they would no doubt be assigned to first place in queues, such as for lifeboats on the Titanic), but from then on the predictions require so much additional psychology as to no longer even be about position per se. For example, although the center of horizontal arrays gets the most visual attention (Atalay et al., 2012), Raghubir and Valenzuela (2006) argue (in their article title, no less) that center stage is the “center-of-inattention.”
To conclude, when simultaneous choice is strategic, focal choices, including salient positions, are a draw when coordinating and are a drawback when competing. Surprisingly, this holds for both players, although any bias shared by both players is, in the case of hide-and-seek, to the detriment of the hiders. Thus, players of coordination games will tend to favor special positions such as first, last, or dead center, where those exist, whereas competitive players will tend to shy away from those very same positions.
Solving the Conundrum
The triple conundrum posed earlier in this article (Why do MCTs show edge aversion? Why do menus show edge advantage? Why do such similar tasks show opposing effects?) has been solved. Menus show edge advantage because they are perused sequentially, taken in serially, and are therefore subject to the serial position effect. MCTs, although probably processed similarly to menus, are games of hide-and-seek—therefore, test takers and test makers alike shy away from “special” positions, such as first and last, and prefer the fuzzy middle. These two tasks differ because with menus, once processed, no strategic reasoning follows, whereas with MCTs, strategic reasoning overrides any prior processing effects.
On the way to solving the conundrum, we have seen that the highly prevalent middle bias found in so many studies (in this article, middle bias examples outnumber edge advantage examples by about 2 to 1) derives from not one, but at least three different psychological principles: (a) middle positions are more reachable in perceptual-motor tasks, (b) they are more representative in mental choice tasks, and (c) they are felt to be better hiding places in games of hide-and-seek.
I had naively hoped that position effects in choice could be summarized as neatly as hypothesized by Valenzuela and Raghubir (2009): “It is possible that an extremity advantage exists for choices containing sequentially presented options, whereas a centrality advantage exists for simultaneously presented ones” (p. 195). I later thought that the generalization might be that an extremity advantage exists for choices requiring sequential processing, whereas a centrality advantage exists for items requiring no processing. In truth, however, these simplistic dichotomies are insufficient: Position effects are determined by features of the choice architecture, by the dynamics of the task, and by a number of psychological principles. The same effect (e.g., edge aversion) may have different causes in different cases (e.g., choice of toilet paper rolls vs. guessing a multiple-choice question), whereas different effects (e.g., edge aversion vs. edge advantage) can be caused by the same psychological principle (reachability under different spatial displays).
An intuition common across all tasks concerns which positions in a specific case are more reachable; which positions are more “salient,” “focal,” or “representative”; and whether the incentive structure—if one exists—directs one toward or away from those positions. Specific position effects then follow.
I feel compelled to note that there are some findings that I could not account for, or could do so only ad hoc, as they seemed to defy my own predictions. One is Christenfeld’s (1995) finding that the closest door to the restroom entrance was not the most popular. Another is Rubinstein et al.’s (1997) finding that competitive players’ mild attraction to the one differently marked option (out of four) from which they should have shied away. Neither were explained by the original authors either.
Postscript
At the conclusion of my 2011 paper, I stated that “if asked to predict the outcome of a new study of position effects in a new setting, all I have done and read might be of little help” (p. 233). I now feel prepared to meet the challenge of predicting the outcome of new studies in new settings. Indeed, the principles of this article should be generalizable beyond simultaneous choice to sequential choice and beyond choice from three or more options to binary choice. However, both take us beyond the boundaries of the present article. And of course, one should never forget what experience teaches: There is no guarantee that new data will not baffle me again.
Footnotes
Acknowledgements
My deep gratitude to Bobbie Spellman, editor par excellence, both supportive and constructive. I thank Tom Noah, student par excellence, who made the figures comprehensible. I thank the readers, audiences, and referees whose comments on earlier versions of this article greatly improved it. I am ever awed by the collaborative nature of my scientific community.
Declaration of Conflicting Interests
The author declared no conflicts of interest with respect to the authorship or the publication of this article.