



Abstract
Self-control is positively associated with a host of beneficial outcomes. Therefore, psychological interventions that reliably improve self-control are of great societal value. A prominent idea suggests that training self-control by repeatedly overriding dominant responses should lead to broad improvements in self-control over time. Here, we conducted a random-effects meta-analysis based on robust variance estimation of the published and unpublished literature on self-control training effects. Results based on 33 studies and 158 effect sizes revealed a small-to-medium effect of g = 0.30, confidence interval (CI95) [0.17, 0.42]. Moderator analyses found that training effects tended to be larger for (a) self-control stamina rather than strength, (b) studies with inactive compared to active control groups, (c) males than females, and (d) when proponents of the strength model of self-control were (co)authors of a study. Bias-correction techniques suggested the presence of small-study effects and/or publication bias and arrived at smaller effect size estimates (range: gcorrected = .13 to .24). The mechanisms underlying the effect are poorly understood. There is not enough evidence to conclude that the repeated control of dominant responses is the critical element driving training effects.
Successful self-control is associated with a host of positive outcomes in life, including academic success, stable personal relationships, financial security, and good psychological and physical health. By contrast, poor self-control is associated with more aggression, substance use, and crime, among others (Duckworth & Seligman, 2005; Gottfredson & Hirschi, 1990; Tangney, Baumeister, & Boone, 2004). It is readily conceivable that how well people fare in these domains has not only important personal consequences but also consequences for society at large. Research shows that self-control assessed very early in life predicts a variety of important life outcomes (Daly, Delaney, Egan, & Baumeister, 2015; Moffitt et al., 2011). These findings seem to suggest that self-control is a stable trait being shaped early in life. However, other research perspectives highlight the possibility of self-control change by targeted interventions (e.g., Piquero, Jennings, Farrington, Diamond, & Gonzalez, 2016). Over the past 15 years, researchers have designed controlled psychological interventions that tested the effect of self-control training on self-control success across diverse domains (Berkman, 2016). Given the importance of self-control in various life domains, there is a tremendous demand for such interventions that promise to reliably, appreciably, and enduringly improve self-control. The present article provides a meta-analysis of this self-control training literature.
What Self-Control Is and Why It Should (Not) Be Possible to Improve It
One prominent conceptualization defines self-control as the “ability to override or change one’s inner responses, as well as to interrupt undesired behavioral tendencies (such as impulses) and refrain from acting on them” (Tangney et al., 2004, p. 274). In line with this definition, the exertion of self-control is typically seen as deliberate, conscious, and effortful.
The main theoretical rationale for why training self-control should be beneficial comes from the strength model of self-control (Baumeister & Vohs, 2016b; Baumeister, Vohs, & Tice, 2007). This influential model proposes that all self-control efforts draw on a general capacity. This capacity is used and depleted regardless of in which domain a person exerts self-control (e.g., attention control, control of food intake, control of emotional expression). Because of its generality, improvements in the general self-control capacity should benefit all kinds of self-control behavior across various domains.
The strength model posits that the capacity to exert self-control works akin to a muscle. This assertion has two important implications: First, exerting self-control will lead to temporary exhaustion and make subsequent self-control failure more likely (ego depletion). 1 Second, repeated practice will strengthen the self-control muscle (training hypothesis). This will result in either a general increase in absolute muscle strength (i.e., improved self-control strength) and/or increased resistance to fatigue when confronted with demands (i.e., improved self-control stamina). Both increases in strength and stamina should benefit self-control in a broad range of domains in the laboratory and in everyday life.
From the perspective of the strength model, the crucial aspect of a training regimen lies in the repeated overriding of dominant responses. In typical self-control training studies that are examined in the present meta-analysis, participants are asked to complete everyday activities with the nondominant hand such as brushing teeth or using the computer mouse (Miles et al., 2016), to refrain from using highly prevalent slang words (Finkel, DeWall, Slotter, Oaten, & Foshee, 2009), or to work on computerized tasks requiring the control of dominant responses (Cranwell et al., 2014). After the training (typically 2 weeks long), laboratory or everyday-life indicators of self-control strength or stamina are compared to a control group. Training effects have been investigated on outcome variables such as success in quitting smoking (Muraven, 2010b), laboratory aggression (Denson, Capper, Oaten, Friese, & Schofield, 2011), or physical persistence (Cranwell et al., 2014).
The hypothesis that training self-control leads to broad improvements in self-control across domains is both intriguing and risky: It is intriguing because the trainability of self-control has implications for many subfields of psychology and is of high practical importance. Among other benefits, it would open the possibility of helping people deal with self-control problems in one domain by practicing self-control in a completely different domain. For instance, consider an obese person having gone through countless unsuccessful diets, still wishing to lose weight. At this point, any new intervention directly concerned with restraining eating behavior may be difficult, because dieting is closely associated with frustration and feelings of personal failure. The self-control training hypothesis is intriguing in that it suggests this person could succeed at dieting by practicing self-control in unrelated and emotionally uncharged activities.
The self-control training hypothesis is a risky hypothesis because other literatures on training psychological capabilities are not very encouraging concerning appreciable and broad benefits in people’s lives. Consider the literature on cognitive training of executive functions such as working memory capacity or task-shifting (Miyake & Friedman, 2012). This literature shows that the transfer of improvements in the specific training tasks to other tasks measuring the same construct (i.e., from one working memory task to the other) is sometimes found (near transfer). By contrast, transfer rarely emerges to related constructs (i.e., from working memory to task-shifting) or behaviors that should benefit from improving the focal construct (far transfer; Melby-Lervåg & Hulme, 2013; Melby-Lervåg, Redick, & Hulme, 2016; Owen et al., 2010; Shipstead, Redick, & Engle, 2012). The empirical studies that have been conducted to date to test the self-control training hypothesis have exclusively focused on far transfer—training took place in one domain (e.g., controlling speech and/or posture) and dependent variables were collected in different domains (e.g., persistence, aggression).
Within the self-control literature, related but distinct conceptualizations of self-control stress the importance of learning essential self-control skills early in life (Heckman, 2006; Mischel et al., 2011; Moffitt et al., 2011). For example, preschoolers can learn to conceive desired objects as less tempting by focusing on their nonconsummatory features (Mischel & Baker, 1975). Recent meta-analytic evidence suggests that teaching such self-control skills is effective in children and adolescents to improve self-control (g = 0.32) and to reduce delinquency (g = 0.27; Piquero et al., 2016). The self-control training interventions reviewed in the present meta-analysis focus on repeatedly overriding dominant responses without teaching strategies on how to do so. This approach might be less effective to appreciably and enduringly improve self-control.
Previous Meta-Analyses
Two peer-reviewed meta-analyses have previously summarized evidence relating to the self-control training hypothesis. The first meta-analysis included a total of nine published studies and revealed a large average effect of d+ = 1.07 (Hagger, Wood, Stiff, & Chatzisarantis, 2010). Among these nine studies were three studies with exceptionally large effects sizes up to d+ > 8 (sic!) and unclear methodology (Oaten & Cheng, 2006a, 2006b, 2007), leading to a very wide 95% CI for the estimated average effect size [0.10, 2.03]. A more recent meta-analysis excluded these 3 studies and included a total of 10 published studies (Inzlicht & Berkman, 2015). Inzlicht and Berkman used the recently introduced p-curve method (Simonsohn, Nelson, & Simmons, 2014) to compute two estimates of the meta-analytic self-control training effect size—one based on the first dependent variable reported for a given study, the other based on the last dependent variable reported. All other effects were discarded. The first estimate was d = 0.17, CI95 [−0.07, 0.41], a small effect not significantly different from zero. The second estimate was d = 0.62, CI95 [0.13, 1.11], a stronger but also more volatile effect size. 2
The Present Meta-Analysis
The present meta-analysis aims to deliver a comprehensive summary of the published and unpublished evidence and to considerably extend previous work. In particular, we pursued three goals: First, we aimed at estimating the average self-control training effect based on the most comprehensive data base possible. With 33 studies (23 published, 10 unpublished), we included more than three times as many studies than the Hagger et al. (2010) and the Inzlicht and Berkman (2015) meta-analyses. In addition, we based our estimates on all reported dependent variables, an issue of importance given that many of the original studies reported several dependent variables. In such cases, basing effect size estimates solely on the first and/or last reported effect (Inzlicht & Berkman, 2015) inevitably implies a loss of valuable information.
Second, we sought to conduct moderator analyses to elucidate boundary conditions of the self-control training effect. Moderator analyses can be crucially informative for both theory building and for applied purposes when designing self-control training procedures.
Finally, we sought to investigate the existence of small-study effects and publication bias. Publication bias accrues when studies with a statistically significant result are more likely to be published than studies with a null result. Because publishing almost exclusively significant results is how the field worked for many years (Bakker, van Dijk, & Wicherts, 2012; Fanelli, 2012), meta-analyses tend to overestimate population effect sizes (Ioannidis, 2008; Levine, Asada, & Carpenter, 2009).
Methods
The present review followed reporting guidelines for meta-analyses outlined in the PRISMA statement (Moher, Liberati, Tetzlaff, Altman, & The PRISMA Group, 2009). The study was preregistered under the international prospective register of systematic reviews (PROSPERO; registration number CRD42016033917, http://www.crd.york.ac.uk/prospero/). Following recent recommendations for the reproducibility of meta-analyses (Lakens, Hilgard, & Staaks, 2016) and to facilitate future updates of this work, we made all data, code, full documentation of our procedures, and additional supplementary analyses available on the Open Science Framework (https://osf.io/v7gxf/).
Inclusion criteria
Studies were eligible for inclusion if they (1) implemented at least one training procedure that contained the repeated control of dominant responses, (2) included at least one control group, (3) allocated participants randomly to conditions, (4) measured at least one self-control-related outcome variable in a different domain than the domain in which the training occurred, (5) assessed the outcome variable(s) at least 1 day after the last training session, 3 and (6) included samples of mentally healthy adults. We decided to only include studies with random allocation to conditions because only random allocation allows for a causal interpretation of training effects. For studies that contained conditions and/or outcomes irrelevant to our research question, we only included the conditions and/or outcome variables that matched all criteria. In case of ambiguity about the relevance of the chosen outcome variable(s), we generally followed the arguments of the original study authors. For a detailed documentation of all decisions that were made, see the documentation available on the Open Science Framework (https://osf.io/v7gxf/).
Search strategy
We conducted a systematic literature search using three online citation-database providers—namely, EBSCO, ProQuest, and ISI Web of Science. In EBSCO, we searched the databases PsycINFO, ERIC, PsycARTICLES, and PSYNDEX, using the exact search term (TI self regulat* OR TI self control OR TI inhibit* OR TI willpower) AND (TI training OR TI practic* OR TI exercis* OR TI improv*). For ISI Web of Science, the exact search term was TITLE: ([self regulat* OR self control OR inhibition OR willpower] AND [training OR practic* OR exercis* OR improv*]). This search was restricted to entries tagged as “psychology.” In ProQuest, we searched for ([“self regulat*” OR “self control” OR “inhibition” OR “willpower”] AND [“training” OR “practice” OR “exercise”] AND “psychology”). All databases were searched from 1999 onward, the publication year of the first self-control training study (Muraven, Baumeister, & Tice, 1999). Additionally, we issued calls for unpublished data through the mailing lists of three scientific societies (SPSP, EASP, SASP) and personally corresponded with researchers that are active in the field. Finally, the literature search was complemented by unsystematic searches and reference harvesting from included studies and relevant overview articles.
Screening
Titles and abstracts of 4,075 records were screened by the second author for relevance to the present work. Of these, 4,026 were excluded. Forty-nine full-text articles were assessed for eligibility according to the inclusion criteria. Twenty-eight were included in the final database. The PRISMA flow chart in Figure 1 provides details about these steps.

PRISMA flow chart of the literature search and study coding.
Study coding
We coded several potential moderator variables of self-control training effects. One potential moderator pertains to the type of training that was implemented, some pertain to the study level, and some pertain to level of the outcome used. For further potential moderators and respective analyses, please see the Supplemental Material available online. The second author and a research assistant coded all potential moderators explained in the remainder of this section (see documentation on the OSF for details). Interrater reliability was examined using intraclass correlation (ICC) for continuous moderators—ICC(1,1) (Shrout & Fleiss, 1979) and Cohen’s Kappa for categorical moderators (Cohen, 1968). Interrater reliability for the study coding was high by common standards (Cicchetti, 1994), mean κ = 0.83, mean ICC(1,1) = 0.92.
Treatment-level moderator
Type of training
Some training procedures may be more effective than others. For example, training procedures that require more deliberate and effortful behavioral control (e.g., repeatedly squeezing a handgrip over several weeks) may differ in effectiveness from training procedures that require more frequent but less rigorous behavioral control (e.g., using one’s nondominant hand for everyday activities).
Study-level moderators
Length of training
Longer training procedures may lead to stronger training effects. Length of treatment was coded in days. Length of training was coded as a study-level (instead of a treatment-level) moderator because in all studies with more than one treatment condition treatment length was equal across conditions.
Publication status
Studies with statistically significant results are more likely to be published, possibly leading to an overestimation of the average effect size. Published and in press studies were coded as published and all others as unpublished. (For a more comprehensive treatment of potential publication bias, see below.)
Research group
The self-control training hypothesis was derived from the strength model of self-control (Baumeister et al., 2007). Perhaps researchers from this group are more experienced and more skilled at operationalizing relevant variables than other researchers. Alternatively, they may also be more biased in favor of the self-control training hypothesis. Given the criticisms to the strength model, it is also possible that researchers from other research groups are biased against the hypothesis. Following Hagger et al. (2010), a study was coded “Strength model research group” if one of the authors or committee members of a dissertation or master’s thesis was Roy Baumeister or one of his known collaborators (alphabetically: DeWall, Gailliot, Muraven, Schmeichel, Vohs). All other studies were coded “other.”
Control group quality
Intervention effects that are based on comparisons of training conditions with inactive control groups can result from multiple different working mechanisms (e.g., demand effects, stronger engagement in the study in the intervention group, etc.). Active control groups narrow down the range of plausible working mechanisms and provide a more conservative test of the self-control training hypothesis. Control groups were coded as active when they worked on any task while the intervention group received treatment; all other control groups were coded as inactive.
Gender ratio
Meta-analytic evidence suggests that trait self-control is more strongly linked to the inhibition of undesired behaviors in males than in females (de Ridder, Lensvelt-Mulders, Finkenauer, Stok, & Baumeister, 2012). Thus, to the extent that self-control training improves trait self-control, training may show stronger effects in males than in females. We coded the gender ratio as the percentage of males in the sample.
Outcome-level moderators
Type of outcome
Training effects on some outcome variables may be stronger than on others. We grouped outcome variables into clusters representing different content domains (e.g., physical persistence, health behaviors, academic behaviors).
Lab versus real-world behavior
For some outcomes, the relevant behavior is performed in the laboratory (e.g., computerized performance tasks). For others, the relevant behavior refers to real-world behavior performed outside the laboratory (e.g., “How often have you done X during the last week?”) and may also be assessed outside the laboratory (e.g., daily diaries). Behavior assessed in the laboratory may provide more experimental control, and variables that reflect real-world behavior or experience may have higher external validity. Outcomes were coded as “lab behavior” or “real-world behavior.”
Stamina versus strength
Some outcomes were assessed without a preceding effortful task, others after an effortful task. Outcomes were coded as “self-control stamina” (i.e., resistance to ego depletion) when they were preceded by an effortful task and as “self-control strength” when they were not preceded by an effortful task.
Maximum versus realized potential
Some dependent variables require the participant to perform as well as possible (i.e., realize their full self-control potential; e.g., Stroop task or keep hand in ice water for as long as possible). When not prompted, people may not always access their maximum potential but realize only a part of it in a given situation. Self-control training may differentially affect the maximum potential people can exert and the realized potential they do willingly exert.
Follow-up
Training effects may deteriorate with increasing time between the end of training and outcome measurement. Follow-up was coded as the number of days between the last day of training and the outcome measurement. If the outcome measurement spanned across a period of time, the middle of this time period was used to calculate follow-up.
Effect size coding
We computed Hedges’ g effect sizes and respective variances (Var g ) for all effects (Hedges, 1981). Hedges’ g is similar to Cohen’s d but corrects for small sample bias. Two design types were prevalent: pretest-posttest-control designs (PPC) and posttest-only-control designs (POC). For continuous dependent variables, we first computed Cohen’s d and its variance Var d and then applied Hedges’ correction factor for small sample bias to compute g and Var g . For PPC designs, Cohen’s d was defined as the difference of mean improvement between the training group and the control group, divided by the pooled pretest standard deviation (SD):
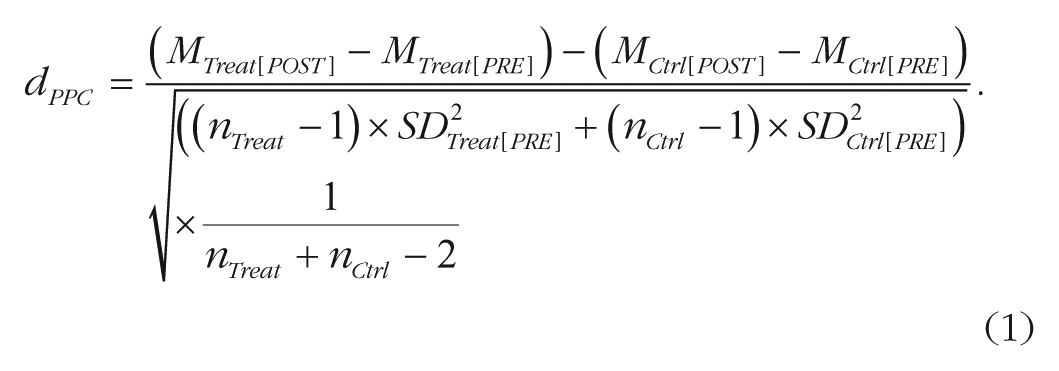
Thus, the numerator in the Cohen’s d fraction was a difference of differences—that is, the difference of the mean improvement (Mpost – Mpre) between the two conditions. Standardizing by pooled pretest SD rather than pooled posttest SD or pooled total SD has been shown to yield a more precise estimate of the true effect, as interventions typically cause greater variation at posttest (Morris, 2008).
For POC designs, Cohen’s d was defined as the difference in means divided by the pooled posttest standard deviation.
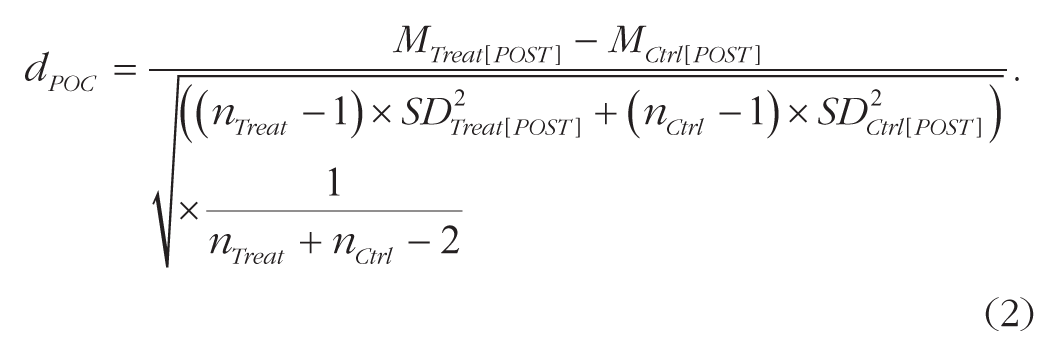
For noncontinuous variables, appropriate effect sizes for the respective scale level were computed and then transformed to Hedges’ g (Hedges, 1981). When possible, effect sizes were computed from descriptive statistics and sample sizes. We contacted the authors if required information was missing in the manuscript. Eighteen out of 23 responded to our inquiry. If authors did not respond or could not provide the required information, we approximated the effect size as closely as possible using the information provided in the original manuscript.
Some studies included more than one treatment group or control group (e.g., using self-control training tasks and/or control tasks from different domains). When multiple treatment and/or control groups were implemented, we compared each treatment group separately against each control group. For studies that included multiple outcomes, we computed one effect size per outcome for each comparison. For example, a study reporting two treatment groups, two control groups, and three outcomes would contribute a total of 12 effect sizes (2 treatments × 2 controls × 3 outcomes). Some studies reported multiple measurements of the same outcomes after training. In these cases, we only included the measurement temporally most proximate to the training phase (exception: follow-up moderator analysis; see next paragraph).
For the moderator analysis “follow-up,” we contrasted outcome variables measured directly after the training (posttraining, see above) with later measurement occasions (follow-up). If a study included both posttraining and follow-up measurements, we included effect sizes for both time points. When multiple training and/or control groups were implemented, we combined them, respectively, before computing the effect sizes, as type of training/control group was not of interest in this particular analysis.
Meta-analytic procedure
We deviated from the path of data analysis outlined in the preregistration because we followed valuable reviewer suggestions made in the editorial process (i.e., reliance on the robust variance estimation, RVE, approach; see below). All analyses were conducted using random effects models because self-control training interventions, control groups, and outcome variables varied considerably between studies. Hence, it was unreasonable to expect one true, “fixed” population effect.
Conventional meta-analytical techniques assume that effect sizes are statistically independent. Including multiple effect sizes stemming from multiple outcomes or comparisons per study violates this assumption (Lipsey & Wilson, 2001). Several approaches have been proposed to address this issue and to arrive at a set of independent effect sizes (for an overview, see Marín-Martínez & Sánchez-Meca, 1999). One widely used approach averages and adjusts effect sizes based on the correlation of the combined effect sizes (Borenstein, Hedges, Higgins, & Rothstein, 2009). More specifically, the effect size variance estimate is more strongly reduced if the combined outcomes are weakly correlated compared to when they are highly correlated. This reflects the idea that uncorrelated outcomes contain broader informational value than highly correlated outcomes. One downside of this approach is that averaging effect sizes leads to a loss of information because analyses on the level of effect sizes are no longer possible. To illustrate, consider a study reporting treatment effects on reading and mathematics achievement. Averaging these effect sizes delivers one study summary effect. The single summary effect prohibits a moderator analysis investigating effects of the treatment on different outcomes such as reading versus mathematic achievement across several studies in the meta-analysis.
The recently developed RVE approach for meta-analysis (Hedges, Tipton, & Johnson, 2010) solves this issue. It permits conducting random effects meta-regression on dependent effect sizes, thus offering many advantages over the previously described averaging approach. Unfortunately, there are some drawbacks to RVE as well. First, RVE estimates the correlation matrix of dependent effect sizes rather than accounting for it directly. It will therefore generally yield less precise results than approaches that incorporate the empirical correlation structure (e.g., the procedure proposed by Borenstein et al., 2009). Second, because the approach is relatively novel, the validity of some key meta-analytical techniques has not yet been validated in the RVE context, such as regression-based tests for small-study effects, Trim and Fill procedures, or power analyses. Third, although it is possible to calculate point estimates of true variance in the effect sizes in RVE (i.e., I2), there are currently no significance tests of these estimates available. Hence, researchers must rely on conventions when interpreting the true variance of effect sizes (Higgins & Green, 2011).
Considering the respective (dis)advantages of the Borenstein approach and the RVE approach, we adopted the following threefold strategy for the present meta-analysis: First, we computed the global summary effect of self-control training based on RVE and provide the parallel estimate based on the Borenstein approach for converging evidence. Second, all moderator analyses were run based on RVE. Third, all tests to detect and correct for small study effects were run based on the Borenstein approach, as the validity of these procedures has not yet been investigated in the RVE context. We also ran these analyses within the RVE approach for converging evidence. These latter analyses should be interpreted with caution, however. Please refer to the Supplemental Material available online for details of the Borenstein approach. We relied on the MAd package to implement the approach (Del Re & Hoyt, 2014).
RVE
All RVE models were fitted using the robumeta package for R (Fisher, Tipton, & Hou, 2016). We ran the RVE analyses with the following specifications: First, standard RVE has been shown to perform satisfactorily with a minimum of 10 studies when estimating summary effects and with a minimum of 20–40 studies when estimating slopes in meta-regression (Hedges et al., 2010; Tipton, 2013). When the number of studies falls below these limits, significance tests tend to have inflated Type I error rates. We therefore implemented significance tests that incorporate small sample corrections for all RVE models (Tipton, 2015; Tipton & Pustejovsky, 2015). Specifically, we conducted Approximate Hotelling-Zhang tests for testing multiple parameters (Tipton & Pustejovsky, 2015, abbreviated HTZ in the clubSandwhich package that we employed to run these analyses, Pustejovsky, 2016) and t tests for single parameters (Tipton, 2015). Both HTZ and t values had small-sample-corrected degrees of freedom and adjusted variance-covariance matrices. It is important to note that the single-parameter t test (but not the multiple parameter HTZ test) may provide inaccurate results when degrees of freedom fall below df = 4. Consequently, we caution the reader to interpret the results when this was the case, and we refrained from reporting p values and confidence intervals in the figures depicting analyses with df < 4.
Second, meta-analysts using RVE need to decide how to weight the effect sizes. Following recent recommendations (Tanner-Smith & Tipton, 2014), we set the weights to account for the type of dependence that is likely to be most prevalent in the dataset (i.e., dependence due to correlated rather than hierarchical effects). Third, we estimated the average correlation of effect sizes by first averaging all Fisher z-transformed outcome correlations per study, averaging these means across all studies, and then transforming the value back to a Pearson correlation. This procedure returned a mean outcome correlation of r = .18. We additionally conducted sensitivity analyses for all models by varying the correlation estimate from r = 0 to r = 1 in steps of r = .2. This did not appreciably influence the conclusions drawn from the models. For example, the overall mean estimate of self-control training effectiveness only changed by Δg = 0.0002 when going from r = 0 to r = 1.
In order to compute the overall summary effect, we fitted an intercept-only random-effects RVE model to the set of dependent effect sizes. The regression coefficient of this model can be interpreted as the precision-weighted mean effect size of all studies, corrected for effect-size dependence. The corresponding significance test probes whether the estimate is significantly different from zero. To estimate the variance of true effects, we computed T 2 (DerSimonian & Laird, 2015), which estimates the true heterogeneity of effects in the same metric as the original effect size. For a more interpretable measure of heterogeneity, we also computed I2 (Higgins, Thompson, Deeks, & Altman, 2003), which reflects the estimated proportion of true variance in the total observed variance of effect sizes.
To examine the convergence of RVE and the more conventional approach (Borenstein et al., 2009), we also computed an overall summary effect from the set of independent effect sizes by fitting a conventional random-effects model to the data using the metafor package (Viechtbauer, 2010, 2016). To test the dispersion of observed effect sizes for significance, we computed Cochran’s Q (Cochran, 1954) that is defined as the ratio of observed variation to the within-study error. Q follows a χ2 distribution. A significant Q value provides evidence that the true effects vary. We again computed T 2 and I 2 to estimate true heterogeneity. The summary effect was computed as the precision-weighted mean of all independent effect sizes. Weights were set to the inverse of the sum of the respective effect size variance (Var g ) and the estimated true heterogeneity (T 2).
Moderation analyses
To test for moderation, we employed mixed-effects RVE models. RVE offers the advantage that several moderators can be analyzed simultaneously while taking dependence of predictors (moderators) and outcomes (effect sizes) into account. These models logically extend standard multiple regression to meta-analysis. Accordingly, methodological concerns relevant in multiple regression are also relevant to meta-regression, especially overfitting of models, confounding among predictor variables, and low power. The number of studies and effect sizes was not large enough to include all coded moderators in a single model. We therefore followed a stepwise procedure to analyze the effect of moderators on the summary self-control training effect. In a first step, we separately tested the bivariate relationship of each moderator with the effect sizes. Categorical predictors were dummy coded, and continuous predictors were entered without transformation. This step delivers evidence for moderators without accounting for the influence of other, potentially correlated moderators.
In a second step, we entered multiple predictors simultaneously into the model to control for possible confounds between moderators. To avoid overfitting of the model, it was necessary to preselect predictors. Because we had no a priori theoretical rationale for the relative importance of the various moderators, we examined the converging evidence of a twofold strategy to determine the most suitable set of predictors. The first strategy was to select all moderators with p values of .100 or smaller in the bivariate tests (see previous paragraph). The second strategy was to fit models for all possible combinations of predictor variables. From this set, we retrieved the 100 models that explained the largest amount of true heterogeneity in the effect sizes as indicated by I2. Next, we scored the relative importance of each moderator according to the following rule: A moderator received a score of 100 if it was included in the best model (i.e., the model explaining the largest amount of true heterogeneity), a score of 99 if it was included in the second best model, and so forth. Scores per moderator were summed up to create indices of relative importance. Thus, the maximum importance score was 5,050 for a moderator that was included in all of the hundred most potent models. We then chose moderators to be included in the model based on their importance indices. This approach should be less susceptible to chance patterns in the data biasing the model than simply selecting the model with the single lowest I2 because relative importance across multiple models is taken into account. We developed this method of selecting predictors based on the idea of all-subsets methods in multiple regression (Hocking, 1976), as there are currently no other methods for model building in meta-analysis available.
Small-study effects and publication bias
Publication bias results if studies with certain characteristics (e.g., significant effects, large effect sizes) are systematically more likely to be submitted for publication by authors and/or accepted for publication by journals than studies with nonsignificant or negligible effect sizes. If this happens, the published literature is not representative of the full body of research and overestimates the population effect size (Ioannidis, 2008). Publication bias is a pervasive problem in the social sciences including psychology (Bakker et al., 2012; Franco, Malhotra, & Simonovits, 2014, 2016).
When a given literature is affected by publication bias, there will likely be a negative relationship between studies’ effect sizes and their precision (or sample size): More precise studies with larger samples yield smaller effect sizes. This relationship is found in many meta-analyses (Levine et al., 2009). Small studies are more likely than larger studies to be excluded from the published literature due to nonsignificance or to be influenced by questionable data analysis methods that lead to significant findings at the cost of a factually increased Type I error (e.g., p-hacking; Simmons, Nelson, & Simonsohn, 2011). Therefore, several statistical methods to detect and correct for publication bias investigate the relation between effect size and precision. These assume that in an unbiased literature small studies (on average) should be no more likely to deliver strong effects than larger studies.
It is important to note that a negative relationship between effect size and precision may also result from unproblematic causes other than publication bias. For example, smaller studies may have used other populations that may be more strongly affected by the intervention. Further, it is possible that certain particularly effective interventions are more readily applied in small than in large studies. Also, experimental manipulations may be more rigorously (and therefore more effectively) applied in small than in large studies (Sterne et al., 2011). These kinds of small-study effects reflect true heterogeneity of effect sizes. This heterogeneity may be quantified and potentially explained by statistical analyses such as moderator analyses. Importantly, they are not a problematic sign of publication bias. In case of an empirically negative association of effect size and study precision, meta-analysts therefore need to reflect about possible reasons for this relationship with respect to the specific body of research that is being investigated.
We applied two methods to detect publication bias (Funnel plot, Egger’s regression test) and two further methods to correct for publication bias (Trim and Fill; Precision Effect Estimation With Standard Error, PEESE). In the way they have been developed and validated, these techniques require statistical independence, so we applied them to the set of independent effect sizes (Borenstein approach). However, the logic of Egger’s regression test and PEESE can be readily extended to RVE. We report both approaches for these procedures, but caution is warranted in interpreting the RVE variants until the techniques have been thoroughly validated in RVE.
Funnel plot
A funnel plot provides a graphical depiction of the relation between effect size and study precision. Effect size is plotted on the x axis and precision (as indicated by the standard error of the study effect size) on the y axis with highest precision on top. Funnel plots feature a triangle that is centered on the empirical fixed effect estimate. The width of the triangle is 1.96 standard errors to either side such that 95% of studies would be expected to fall within the triangle in the absence of small study effects and heterogeneity. Studies are expected to spread symmetrically around the estimated effect and increasingly closer to the actual population effect as precision increases. Asymmetry of the funnel plot indicates small study effects that may be indicative of publication bias. Importantly, the funnel plot assumes homogeneous effect sizes—that is, all interventions share the same underlying population effect size. This is an assumption that is unlikely for research in the social sciences (Borenstein et al., 2009). Under the more realistic assumption of a random-effects model and true heterogeneity, funnel plots may overestimate small study effects and, ultimately, publication bias (Lau, Ioannidis, Terrin, Schmid, & Olkin, 2006).
Egger’s regression test
Egger’s regression test investigates whether there is a statistically significant relationship between effect sizes and study precision. The currently advocated variant is a random-effects meta-regression of study effect size on study standard error with an additive between-study error component (Sterne & Egger, 2005). A significant regression weight for the studies’ standard error indicates the presence of small-study effects and potentially publication bias. Similar to other regression-based methods, Egger’s regression test suffers from low statistical power when the number of studies is small (Kromrey & Rendina-Gobioff, 2006). The test also performs unsatisfactorily under conditions of heterogeneity. However, this downside is partly compensated for by the advantage that the approach can incorporate other study characteristics (that may account for heterogeneity). This allows investigating whether a possible relation between study precision (as indicated by the study standard error) and effect size remains significant after controlling for other potential influences on effect sizes (Sterne & Egger, 2005). Extending the idea of the test, we additionally investigated the relationship of effect size and standard errors in a mixed-effects RVE meta-regression with dependent effect sizes.
Trim and Fill
The Trim and Fill method (Duval & Tweedie, 2000a, 2000b) investigates asymmetry in a funnel plot. The algorithm removes extreme studies until the funnel plot is symmetric, yielding (in theory) an unbiased overall effect size estimate. It then imputes mirror images of the trimmed studies to estimate the correct variance of the overall distribution of studies. The Trim and Fill method suffers from the funnel plot’s problematic assumption of truly homogeneous studies and a fixed effect size. In fact, simulation studies showed that Trim and Fill may even adjust for publication bias when factually none exists; reversely, it may adjust insufficiently when in fact publication bias is strong—especially when a few precise studies diverge from the overall meta-analytic estimate (Inzlicht, Gervais, & Berkman, 2015; Moreno et al., 2009; Terrin, Schmid, Lau, & Olkin, 2003). Another problem is that the method assumes publication bias to be driven by weak effects, whereas indeed it is more likely that it is driven by statistical nonsignificance (Simonsohn et al., 2014). Large studies with significant results but weak effects are more likely to be published than smaller studies with big, but nonsignificant, effects.
PEESE
PEESE (Stanley & Doucouliagos, 2014) computes a meta-regression in which the squared standard errors of the effect sizes (an indicator of precision) predict the effect sizes. If there is a significant relationship, this may indicate small study effects and potentially publication bias. The intercept of this regression line is thought to indicate the effect size of a “perfect” study with a standard error of zero that is used as an indicator of the bias-corrected overall meta-analytic effect size. Because PEESE is based on linear regression, it works best in meta-analyses with large numbers of studies. We fitted an additive error random-effects model to derive the intercept for PEESE. 4 Additionally, we extended the logic of this test to RVE and investigated the intercept in a mixed-effects RVE model that regressed (dependent) effect sizes on squared standard errors.
Results
Characteristics of included studies
The search identified 4,075 articles, of which 28 were eligible for inclusion, contributing a total of 33 studies. See Figure 1 for a PRISMA flow chart and the documentation on the Open Science Framework (https://osf.io/v7gxf/) for (a) a list of excluded studies with reasons for exclusion and (b) full references for all included studies. Out of these 33 studies, 10 were unpublished as of December, 14, 2016. Publication dates ranged from 1999 to 2016 (Mdn = 2014). Self-control training was operationalized through a diverse set of training paradigms. For instance, participants were prompted to use their nondominant hand for everyday tasks, to complete multiple sessions of computerized inhibitory control tasks, or to control their diet. The majority of training procedures lasted 2 weeks (m = 19 effect sizes). In total, the analysis included data from 2,616 participants who were on average 21.63 years old. The average total sample size per study was n = 79, comprising mostly student samples (k = 27 studies) and females (Mfemale = 67%). A wide array of outcomes was used to measure self-control-related constructs after (k = 16) or both before and after the training (k = 17). Nine studies also included a follow-up measurement. Training effects were predominantly evaluated through inhibitory control tasks (m = 18) or in the domains of physical persistence (m = 15), health behavior (m = 16), and affect and well-being (m = 29).
Main analyses
Outlier treatment
Initial examination of the data showed that no effect deviated markedly from the rest of the distribution (zmin = −2.80, zmax = 2.78). Leave-one-out analyses showed that sequential removal of each effect size, respectively, did not strongly influence the RVE point estimate or precision of the summary effect (Δgmin = −0.022, Δgmax = 0.021, ΔI2min = −2.09%, ΔI2max = 1.24%). We therefore did not replace any effect sizes for the RVE analyses.
Examination of the independent study-level effect sizes (Borenstein approach) showed that one study (Davisson, 2013; g = −0.67) deviated markedly from the rest of the distribution as indicated by several influence statistics, z = −2.61 (next closest: z = −1.27), rstudent = −3.53 (next closest: rstudent = −1.13), DFFITS = −0.45 (clearly detached from the distribution), Cook’s D = 0.16 (clearly detached from the distribution). The study also had a strong influence on the heterogeneity estimate (ΔI2 = −12.21%). We therefore replaced this outlier effect size with the next most extreme effect size (g = −0.16) for all analyses based on independent study-level effect sizes.
Summary effect
The RVE random-effects mean effect size of self-control training was g = 0.30, CI95 [0.17, 0.42], p < .001, a small to medium effect size according to the conventions by Cohen (1988). More than half of the variance in observed effect sizes was estimated to reflect true differences in effect sizes (I 2 = 59.13%, T 2 = 0.093). According to common conventions, this amount of heterogeneity can be classified as moderate-to-substantial (Higgins et al., 2003).
We also computed a summary effect from the set of independent effect sizes by fitting a conventional intercept-only random-effects model (Borenstein approach). This analysis largely replicated the results of the RVE model in terms of the point estimate (g = 0.28, CI95 [0.19, 0.38], p < .001) and heterogeneity (I2 = 48.47%, Q[32] = 62.10, p = .001, T 2 = 0.032). Study statistics and results of this analysis are depicted in Figure S1 in the Supplemental Material available online.
Moderator analyses
Descriptive statistics, confidence intervals, and inferential statistics of all categorical moderator variables are provided in Table 1. Numbers of effect sizes per group (m) are provided in parentheses. Results of the meta-regressions for continuous moderators are provided in Table 2.
Results of Moderation Analyses for Categorical Moderators

Note: df = associated small sample corrected degrees of freedom; g = effect size; kstudy = number of studies that contributed to the respective moderator level; LL = lower limit of the 95% CI; meffect = number of effect sizes in the respective moderator category; p = p value associated with the t value and df in the same row; t = t value associated with the g value in the same row testing statistical significance in the respective moderator level; UL = upper limit of the 95% CI. Statistic (test of moderation): t value for single parameter tests or Hotelling-T-approximated (HTZ) test statistic for multiple parameter tests. Significant test statistics indicate significance of the overall model. I2 reflects the proportion of true variance in the total observed variance of effect sizes after accounting for the respective moderator. For some moderator models the values for I2 can become be larger than for the global summary-effect model because of missing values or differences in effect size computation. Note that for three subgroups in the type of training analysis, degrees of freedom fell below 4. Significance tests for the summary effects should thus not be interpreted. Accordingly, we did not report CI95 and p values for the respective subgroups.
Results of Moderation Analyses for Continuous Moderators
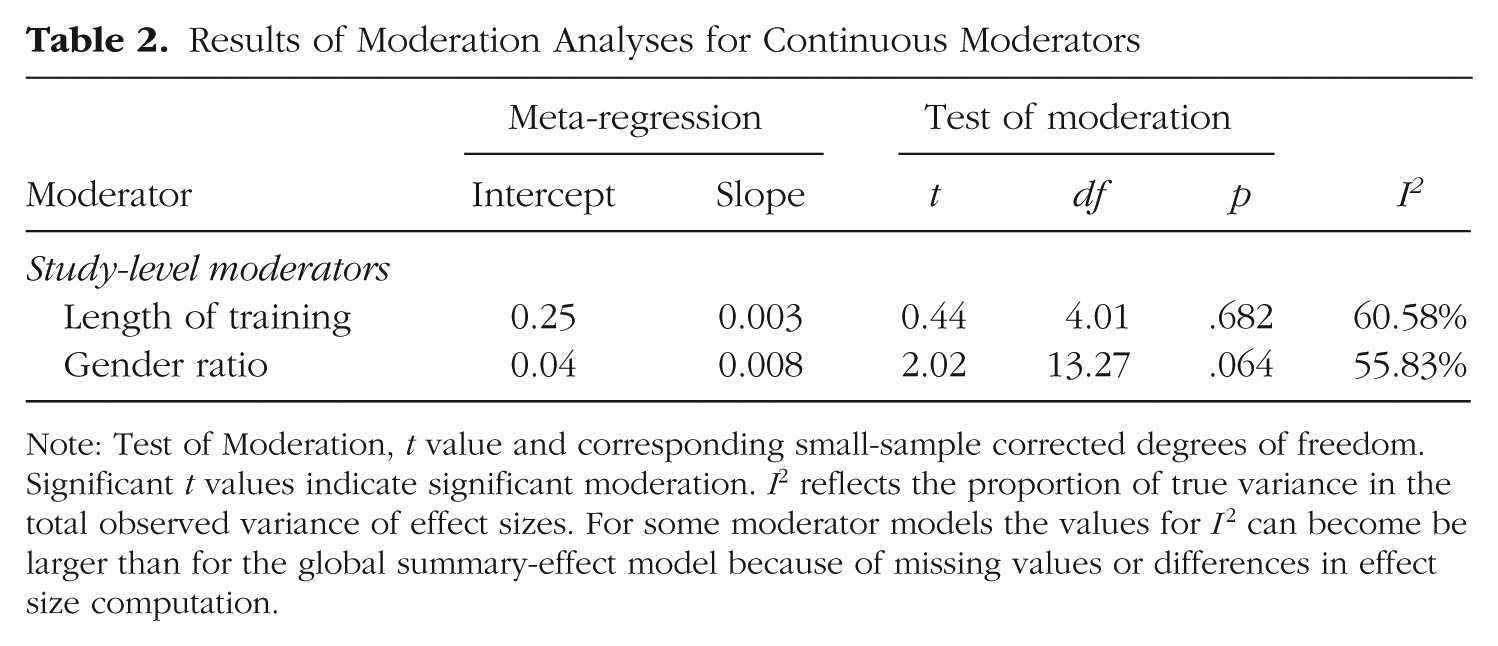
Note: Test of Moderation, t value and corresponding small-sample corrected degrees of freedom. Significant t values indicate significant moderation. I2 reflects the proportion of true variance in the total observed variance of effect sizes. For some moderator models the values for I2 can become be larger than for the global summary-effect model because of missing values or differences in effect size computation.
Treatment-level moderator
Type of training
Five types of training procedures were applied in at least five studies. The most effect sizes originated from studies that used repeated sessions of computerized inhibitory control training (g = 0.21, m = 56), followed by training procedures prompting participants to use their nondominant hand for everyday tasks (g = 0.42, m = 49). Other common procedures required participants to repeatedly press and squeeze a hand strength training device until failure (g = 0.37, m = 21), to continuously regulate their posture by sitting and walking upright (g = 0.23, m = 11), or to continuously regulate their diet (g = −0.01, m = 8). Despite substantial descriptive differences, the overall analysis between the subgroups was not significant, HTZ(7.37) = 1.11, p = .421 (Fig. 2).
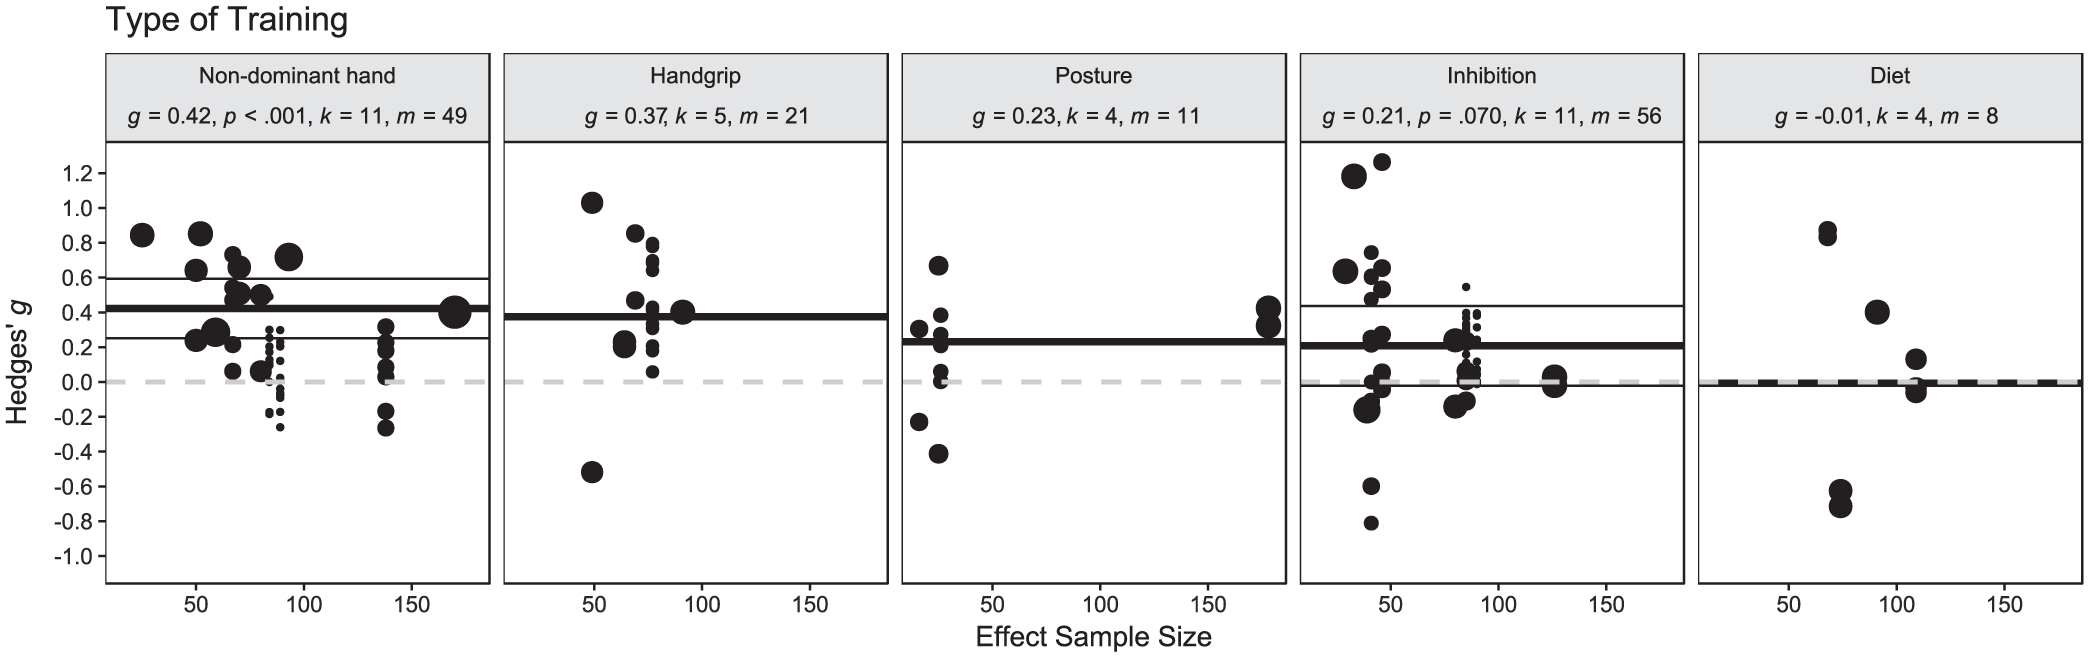
Moderation by type of training, HTZ[7.37] = 1.11, p = .421. g = Hedges’ g summary effect within the respective subgroup; k = number of studies in a subgroup; m = number of effect sizes in a subgroup; p = p value testing Hedges’ g against zero. Black dots represent individual effect sizes. The thick black horizontal lines represent the meta-analytic summary effects within the subgroups. The thin black horizontal lines represent the borders of the 95% CI around the subgroup summary effect. The dashed grey horizontal line represents the null effect at g = 0. For informational purposes, the sample size that was used to calculate the respective effect size is depicted on the x axis, but the moderating role of this attribute is not investigated in this analysis. Circle size represents the weight of the respective effect size in the meta-analytic RVE mixed-effects model depicted here. Diet: control one’s diet; handgrip: repeated use of a handgrip squeezer; inhibition: computerized inhibition control training procedures; non-dominant hand: use of non-dominant hand for everyday tasks; posture: keep an upright posture in everyday life. Note that for three subgroups in this analysis, degrees of freedom fell below 4. The corresponding significance tests for the summary effects should thus not be interpreted. Accordingly, we did not report CI95 and p values for the respective subgroups.
Study-level moderators
Length of training
The majority of studies used a training procedure with a duration of 2 weeks (m = 19; 58%). Thus, there was little variability in training duration, precluding a meaningful test of this moderator. Consequently, there was no significant moderation effect of the length of the training duration, b1 = 0.003, t(4.01) = 0.44, p = .682 (Fig. S2 in the Supplemental Material available online).
Publication status
On average, effect sizes were almost three times larger for published (g = 0.37, m = 131) than for unpublished studies (g = 0.13, m = 27). This difference was close to conventional levels of statistical significance, t(16.47) = 1.76, p = .098 (Fig. S3 in the Supplemental Material available online).
Research group
Significantly larger effects were found by the “strength model research group” (g = 0.51, m = 22) compared to other research groups (g = 0.22, m = 136), t(12.53) = 2.49, p = .028 (Fig. 3).
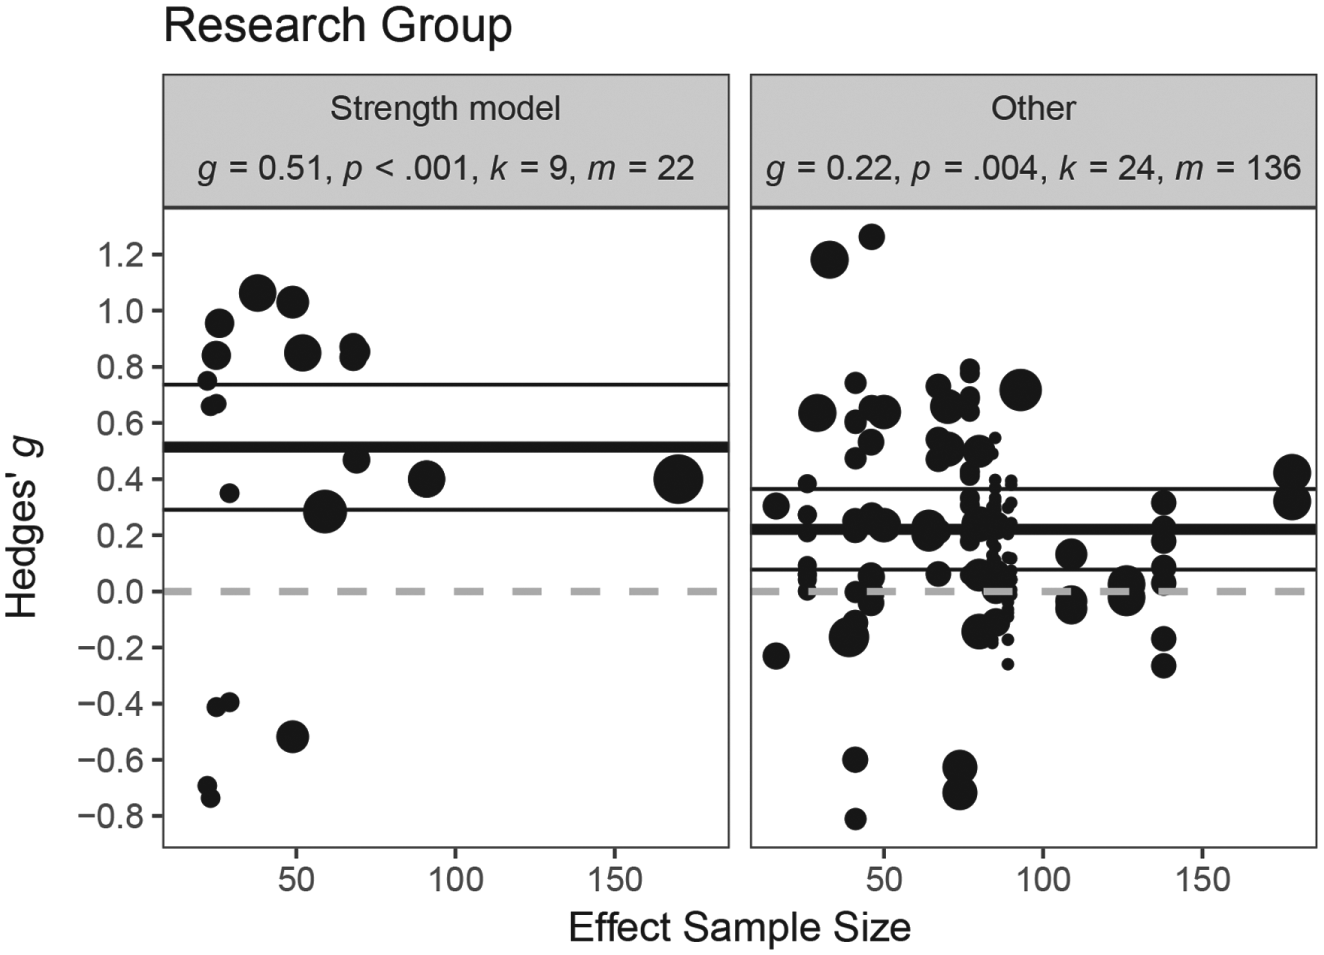
Moderation by research group, t(12.53) = 2.49, p = .028. g = Hedges’ g summary effect in subgroup; k = number of different studies within subgroup; m = number of effect sizes within subgroup; p = p value testing Hedges’ g against zero. Black dots represent individual effect sizes. Thick black horizontal line, meta-analytic summary effect within subgroup; thin black lines, 95% CI; dashed grey line, null effect at g = 0. The associated sample size for each effect size is depicted on the x axis for informational purposes. Circle size represents effect size weight for the subgroup analysis.
Control group quality
Descriptively smaller effects were evident in studies with active control groups (g = 0.23, m = 79) compared to studies with inactive control groups (g = 0.43, m = 79). The difference was close to statistical significance, t(20.79) = 1.73, p = .099 (Fig. S4 in the Supplemental Material available online).
Gender ratio
We imputed two missing values for this moderator by fitting the linear model based on all but the respective two effect sizes and then entering the two effect sizes in the regression equation, thus predicting the missing values from the effect sizes. The moderating effect of the percentage of males in the study samples was close to statistical significance, b1 = 0.008, t(13.27) = 2.02, p = .064, such that Hedges’ g was predicted to increase by Δg = 0.08 per 10% more males in the sample (Fig. 4). Percentages ranged from 0% to 64% across studies, so any interpretation of this slope should be limited to this range.
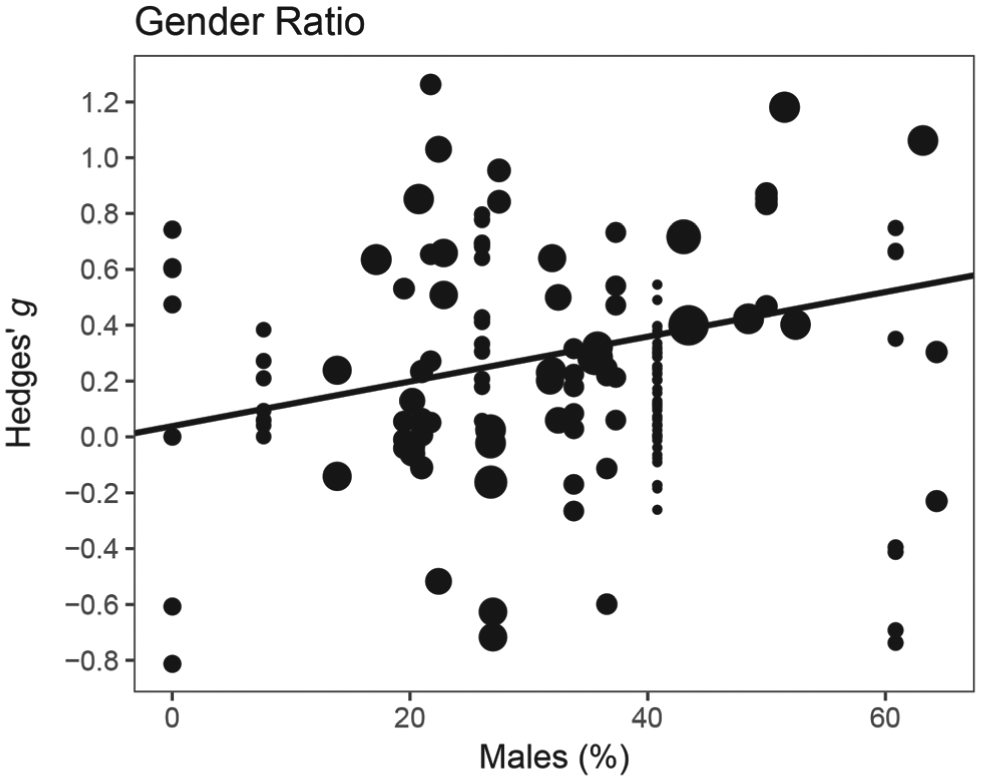
Moderation by gender ratio. The line represents the weighted RVE meta-regression of effect size on gender ratio, b1 = 0.008, t(13.27) = 2.02, p = .064. Circle size represents effect size weight.
Outcome-level moderators
Type of outcome
In total, the included studies featured 94 unique dependent variables. We grouped these variables into theoretically homogeneous clusters. Note that degrees of freedom for significance tests of subgroup summary effects are dependent on the number of studies and effect sizes within the respective cluster. Significance tests are only interpretable when df > 4 (Tipton & Pustejovsky, 2015). Additionally, small clusters in subgroup analyses can bias tests of other clusters and the full model because they tend to increase imbalance in categorical predictors. Thus, it was necessary to exclude small clusters from the analysis to arrive at a model for which all parameters are interpretable. To do so, we sequentially removed clusters with the lowest degrees of freedom, until all degrees of freedom for the single parameter tests were four or larger. This procedure retained five outcome clusters in the final model. These were affect and wellbeing (g = 0.30, m = 29), inhibitory control (g = 0.17, m = 18), physical persistence (g = −0.06, m = 15), health behavior (g = 0.12, m = 16), and inhibitory control after depletion (g = 0.48, m = 9). The difference between these outcome clusters was not significant, HTZ(10.40) = 1.55, p = .259 (Fig. 5).
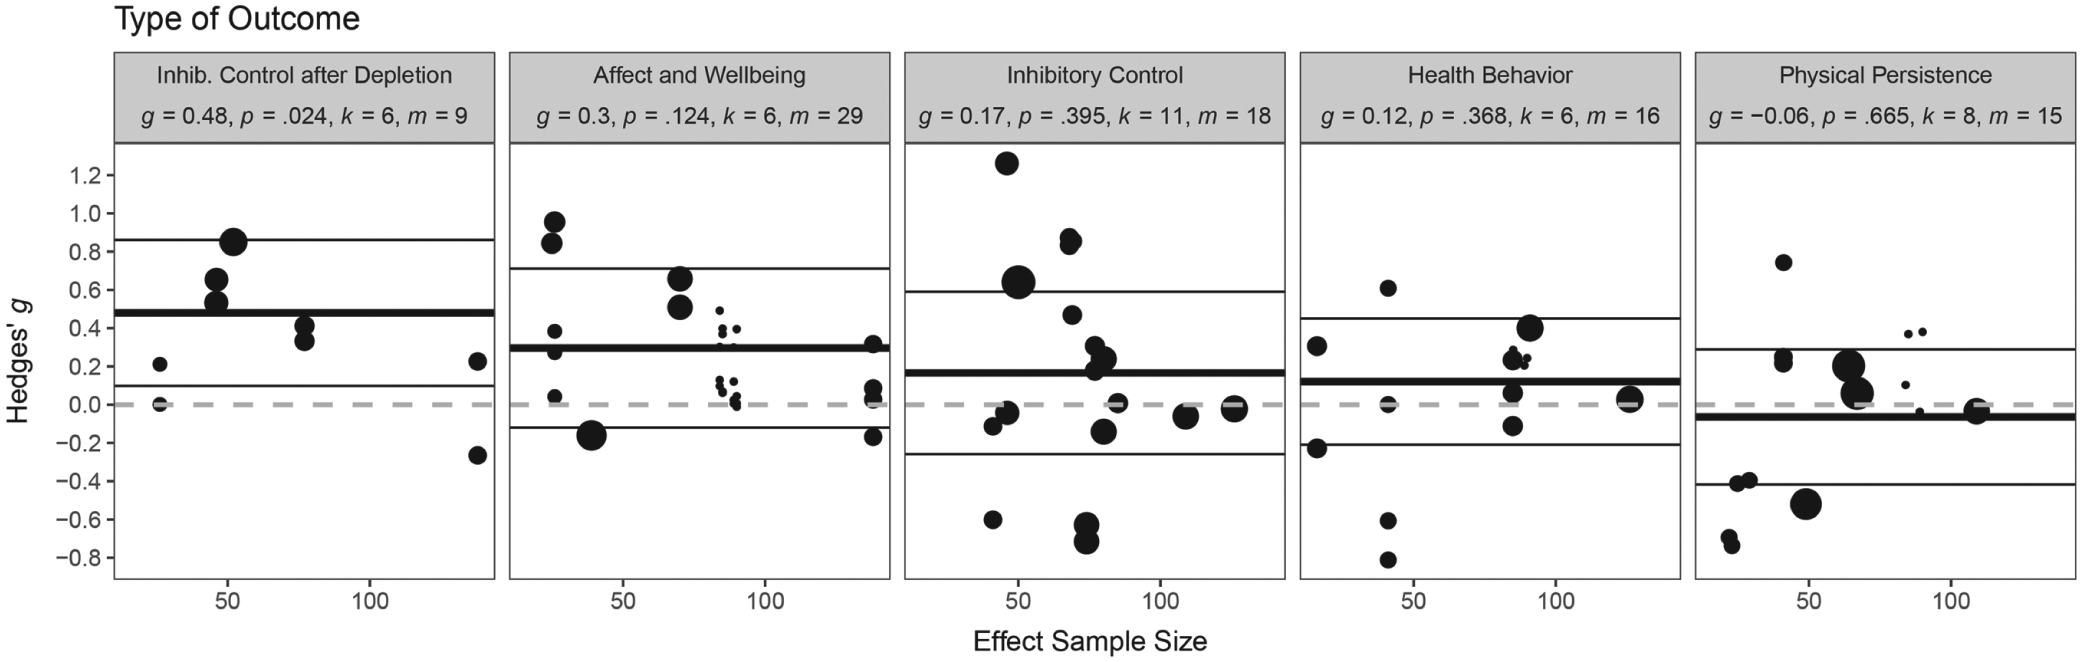
Moderation by type of outcome, HTZ(10.40) = 1.55, p = .259. g = Hedges’ g summary effect in subgroup; k = number of different studies within subgroup; m = number of effect sizes within subgroup; p = p value testing Hedges’ g against zero. Black dots represent individual effect sizes. Thick black horizontal line, meta-analytic summary effect within subgroup; thin black lines, 95% CI; dashed grey line, null effect at g = 0. The associated sample size for each effect size is depicted on the x axis for informational purposes. Circle size represents effect size weight for the subgroup analysis.
Lab-based versus real-world behavior
Effect sizes for outcomes that were measured in the lab (g = 0.32, m = 79) were not significantly different from outcomes that reflect real-world behavior (g = 0.23, m = 79), t(16.32) = −0.88, p = .392 (Fig. S5 in the Supplemental Material available online).
Stamina versus strength
Effects for outcomes that were preceded by an effortful task (stamina; g = 0.60, m = 29) were remarkably larger than for outcomes that were not preceded by an effortful task (strength; g = 0.21, m = 129), t(17.52) = −2.84, p = .011 (Fig. 6).
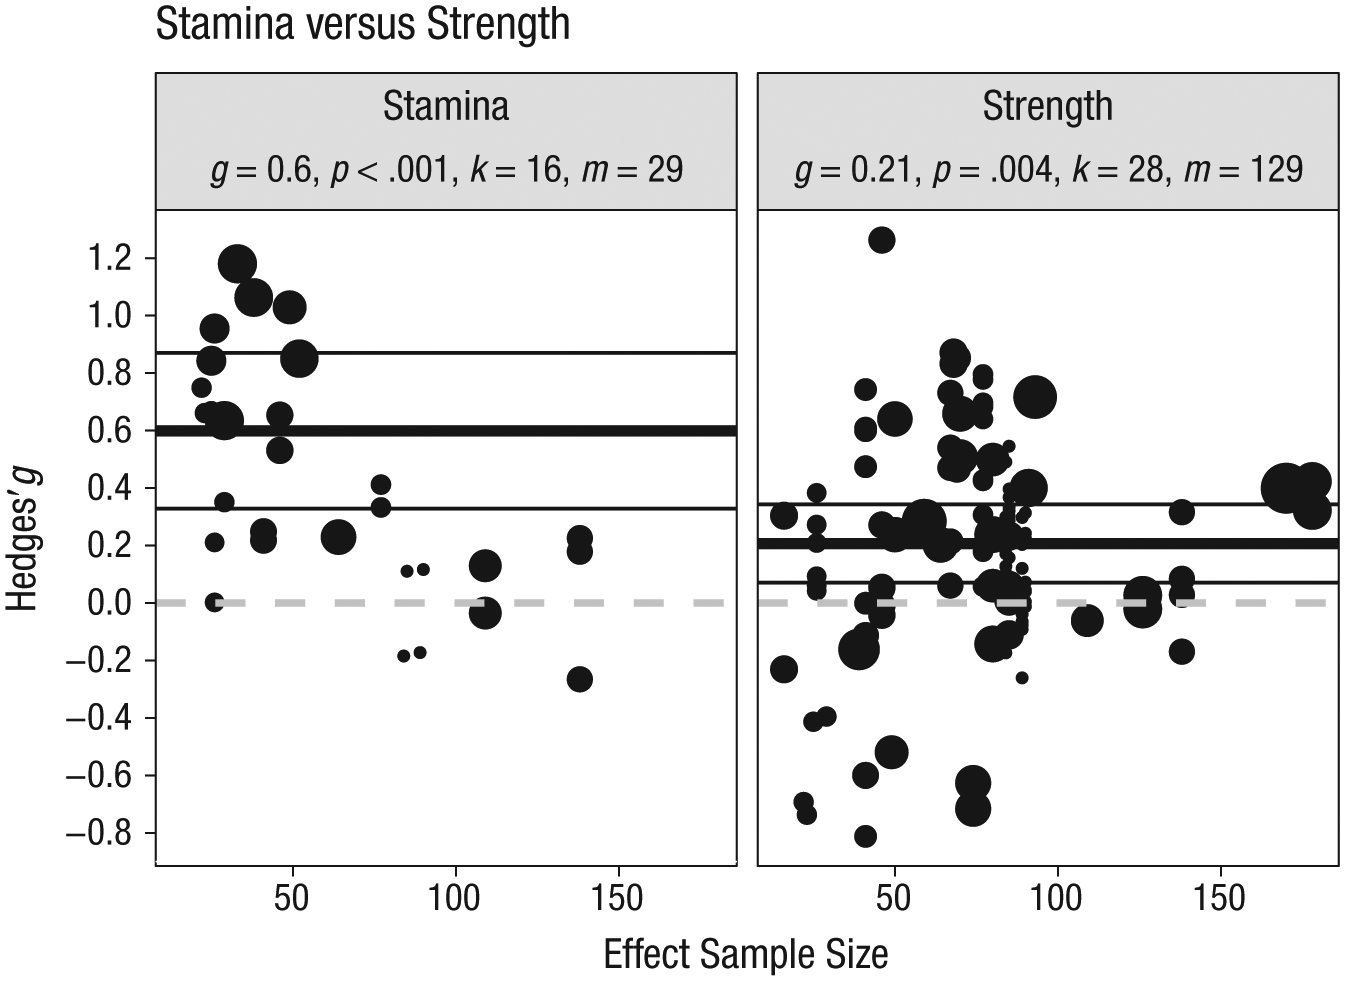
Moderation by strength versus stamina, t(17.52) = −2.84, p = .011. g = Hedges’ g summary effect in subgroup; k = number of different studies within subgroup; m = number of effect sizes within subgroup; p = p value testing Hedges’ g against zero. Black dots, individual effect sizes; thick black horizontal line, meta-analytic summary effect within subgroup; thin black lines, 95% CI; dashed grey line, null effect at g = 0. The associated sample size for each effect size is depicted on the x axis for informational purposes. Circle size represents effect size weight for the subgroup analysis.
Maximum versus realized potential
Whether outcomes reflected maximum self-control potential (g = 0.30, m = 54) or realized self-control potential (g = 0.30, m = 104) had no effect on effect sizes, t(27.75) < 0.01, p = .997 (Fig. S6 in the Supplemental Material available online).
Follow-up
The distribution of the time-lags between the last day of the training and the time of outcome measurement was discontinuous with very large variance and therefore inept for a regression analysis. We therefore ran a categorical moderation analysis comparing posttest shortly after training with follow-up measurements (see Effect Size Coding). The follow-up measurements took place Mdn = 9.5 days after the last day of training (M = 42, SD = 65, min. = 3.5, max. = 184). Outcome measures that were assessed directly after the training yielded descriptively larger effect sizes (g = 0.31, m = 74) compared to outcomes measured at later time points (g = 0.18, m = 28). This difference was not significant, t(9.69) =1.12, p = .291 (Fig. S7 in the Supplemental Material available online).
Multiple moderators
Testing multiple moderators simultaneously allows estimating the unique moderating role of each predictor while controlling for the overlap with other moderators. For this analysis, it was necessary to select a subset of moderators in order to avoid overfitting the model. Several moderators had to be excluded a priori from this process (e.g., due to missing values or restricted variance; please see the Supplemental Material available online for a full list of excluded moderators and reasons for exclusion).
As outlined in the Methods section, we employed two approaches to select the most appropriate moderators for this combined analysis: One approach relied on the findings from the bivariate moderator analyses; the second approach was a data-driven bottom-up approach seeking to explain a high degree of heterogeneity with a small number of predictors.
Results of the bivariate analyses suggested entering four moderators with p values of p = .100 or smaller in the respective bivariate analysis into the combined model: control group quality, stamina versus strength, research group, and gender ratio. The data-driven bottom-up approach delivered converging evidence: We fitted multimoderator models for all possible combinations of predictor variables, resulting in 29 = 512 models, and retrieved the 100 models that explained the greatest amount of true heterogeneity (i.e., reduction in I2). Figure S8 in the Supplemental Material available online reports the relative importance of the nine examined moderators and can be interpreted akin to a Scree plot in factor analysis. There was a relatively large gap in importance between the fifth (gender ratio) and sixth (subjectivity of outcome measurement) most important moderators—suggesting entering the first five moderators in the combined analysis. Four of these five moderators match those identified in the bivariate analyses. Maximum versus realized potential emerged as an additional important moderator despite being far from significance in the bivariate analysis (p = .996). This suggests that this moderator binds residual variation in the other predictors and thereby contributes to explaining heterogeneity (suppression effect; Conger, 1974). In summary, the approach based on the bivariate analyses and the data-driven bottom-up approach provided converging evidence for the relevance of four moderators, and the latter approach unveiled the contribution of one additional moderator potentially acting as a suppressor variable.
The full model including all five predictors was significant, HTZ(13.46) = 3.32, p = .036 (Table 3). The model explained ΔI2 = 13.87% more true effect size variance than the intercept-only model. The moderator stamina versus strength again emerged as significant (p = .027). For research group, there still was a trend toward significance (p = .097). The p value for control group quality was almost unchanged compared to the bivariate analysis (p = .097). By contrast, gender ratio did not border on significance anymore (p = .169). The alleged suppressor variable, maximum versus realized potential, was also not significant (p = .248). These findings suggest that three of the four moderators that were at least marginally significant in the bivariate tests tended to explain unique portions of effect size heterogeneity, even when controlling for the influence of the other most potent moderators.
Summary of RVE Mixed-Effects Meta-Regression Model Predicting Effect Sizes From Multiple Moderators
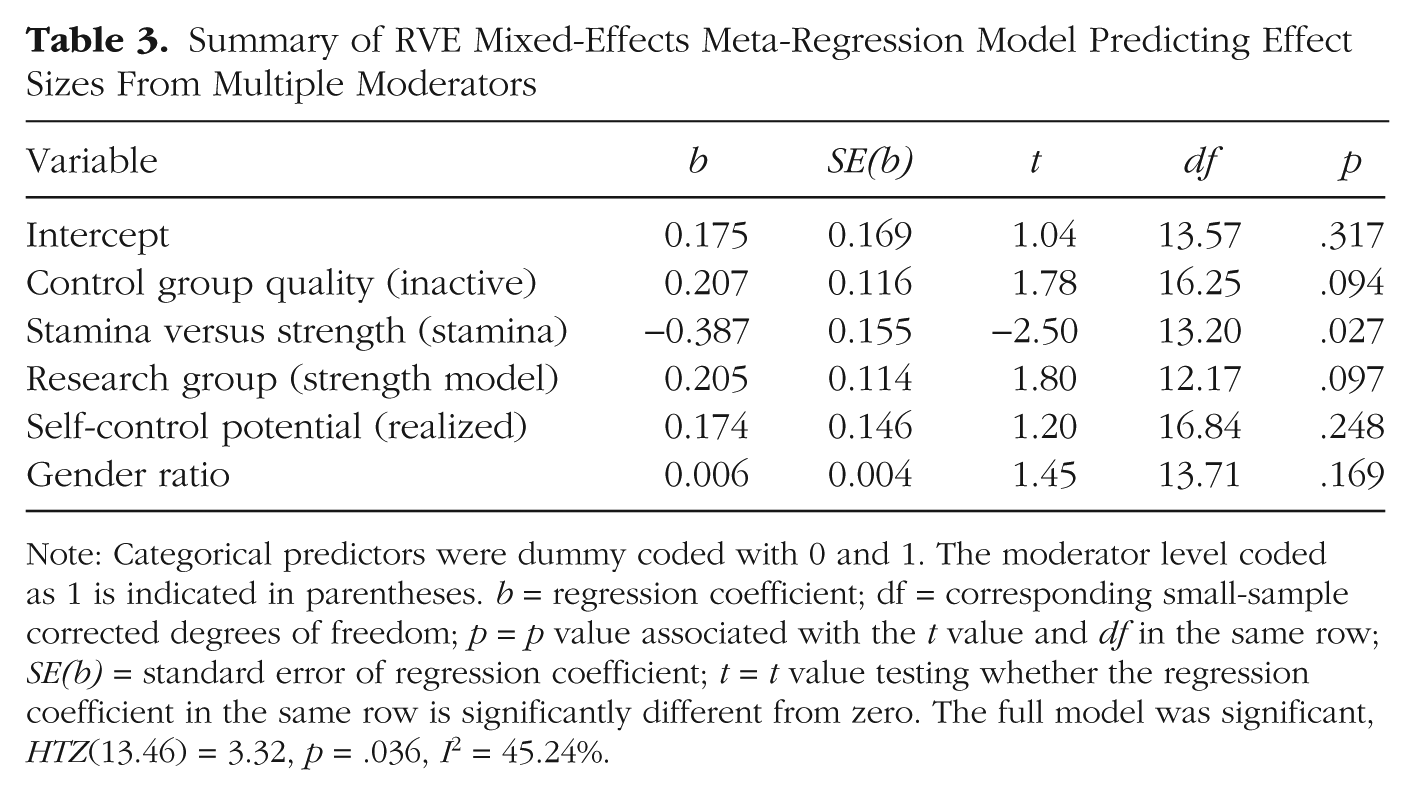
Note: Categorical predictors were dummy coded with 0 and 1. The moderator level coded as 1 is indicated in parentheses. b = regression coefficient; df = corresponding small-sample corrected degrees of freedom; p = p value associated with the t value and df in the same row; SE(b) = standard error of regression coefficient; t = t value testing whether the regression coefficient in the same row is significantly different from zero. The full model was significant, HTZ(13.46) = 3.32, p = .036, I2 = 45.24%.
Note that in this regression, shared variance between predictors contributes to the overall model fit but is not assigned to any predictor specifically. Hence, to the extent that a predictor has a causal claim for parts of the nonassigned shared variance, even nonsignificant predictors may be important for the overall model. Nonsignificance of predictors should therefore not be overinterpreted as indicating that this predictor is unimportant in explaining heterogeneity.
Small-study effects and publication bias
Funnel plot
Visual inspection of the funnel plot for the set of independent effect sizes (i.e., Borenstein approach, not RVE) revealed that the effect sizes were relatively symmetrically distributed around the summary effect (Fig. S9 in the Supplemental Material available online). For perfect symmetry, a set of studies with small-to-negative effect sizes and low precision was missing (see Trim and Fill below). Six studies fell out of the interval in that 95% of studies would be expected for any given level of precision. This analysis suggests a moderate degree of small-study effects and potentially publication bias.
Egger’s regression test
The slope for the meta-regression of independent effect sizes on standard errors was significant, bse = 1.51, SE = 0.61, z = 2.49, p = .013, indicating a significant funnel plot asymmetry. We additionally entered covariates to examine whether standard errors had unique predictive value beyond other moderators (Sterne & Egger, 2005). We considered all moderators that were included in the multiple-predictor model reported above but could only enter gender ratio and research group. For the remaining moderators, several studies realized more than one moderator value, precluding this moderator from the analysis (e.g., featuring both an active and an inactive control condition). The effect of standard errors remained significant when controlling for gender ratio and research group, bSE = 1.29, SE = 0.62, z = 2.08, p = .038. Thus, Egger’s regression test suggests a significant degree of small-study effects and potentially publication bias.
The RVE equivalent of Egger’s regression test showed a similar yet nonsignificant relationship between standard errors and effect sizes, bSE = 1.37, SE = 0.80, t(15.15) =1.70, p = .109. After reducing heterogeneity by controlling for all five moderators from the multiple moderator analysis reported above, the effect of standard errors was clearly not significant anymore, bSE = 0.36, SE = 0.70, t(11.86) = 0.52, p = .614. Follow-up analyses revealed that the notable change to the standard-error-only model in the p value was primarily due to the fact that effect sizes for self-control stamina (vs. strength) and effect sizes for inactive (vs. active) control groups tended to have greater standard errors. When these two moderators were not controlled for, the p value of the standard error predictor remained largely unchanged compared to the standard-error-only model (p = .136).
Trim and Fill
After the previously reported bias-detection techniques, we turned to bias-correction techniques. The Trim and Fill method indicated that four studies were missing on the left of the mean meta-analytic effect size in order to obtain a fully symmetrical funnel plot (Fig. 7). Imputing these studies and adding them to the model delivered a bias-corrected random-effects summary estimate of g = 0.24, SEg = 0.051, CI95 [0.14, 0.34], p < .001, that can be most adequately compared to the corresponding uncorrected summary effect size estimate based on independent effect sizes (g = 0.28). This analysis suggests a moderate degree of small-study effects and potentially publication bias.
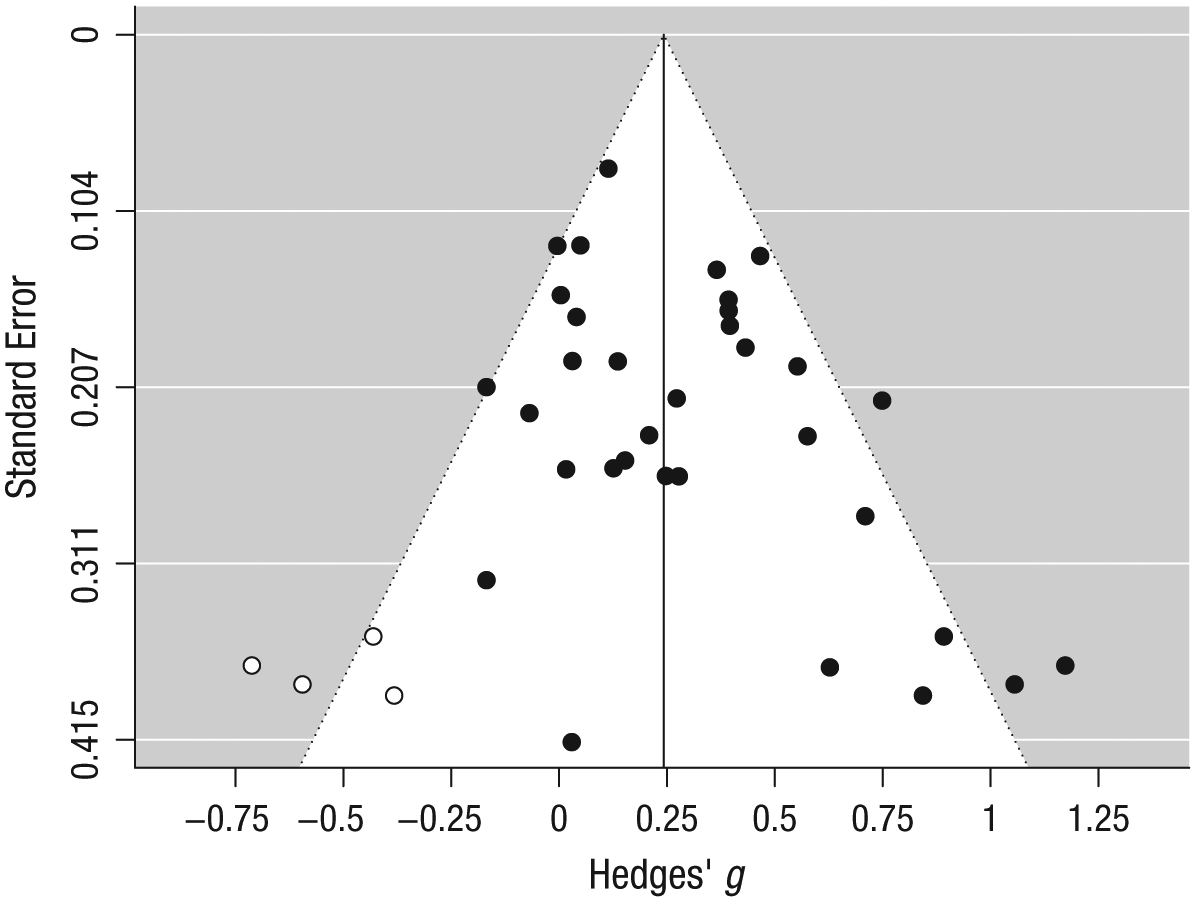
Funnel plot after Trim and Fill bias correction. Note that this analysis is based on the study-level effect sizes (Borenstein approach). Compared to the original funnel plot (see the Supplemental Material available online), four studies were imputed to achieve symmetry (i.e., white circles). This resulted in a bias-corrected summary effect size of g = 0.24, CI95 [0.14, 0.34] that is slightly smaller than the original (Borenstein approach) estimate of g = 0.28, CI95 [0.19, 0.38].
PEESE
The meta-regression of independent effect sizes on squared standard errors was significant, b1 = 3.41, p = .008. The intercept that is thought to reflect the unbiased true meta-analytic summary effect was close to statistical significance, b0 = 0.13, SEb = 0.07, CI95 [−0.01, 0.27], z = 1.86, p = .064. This corrected estimate is less than half of the size of the uncorrected summary effect (g = 0.30 based on RVE, g = .28 based on the Borenstein approach). The PEESE analysis suggests substantial small-study effects and potentially publication bias. Regressing dependent effect sizes on squared standard errors in an RVE mixed-effects model yielded a nonsignificant intercept, b0 = 0.12, SEb = 0.11, CI95 [−0.12, 0.36], t(16.31) = 1.08, p = .295.
Summary
Both the funnel plot as well as Egger’s regression test suggest that there are small-study effects in the dataset that may be indicative of publication bias. The Trim and Fill method delivered a moderately adjusted bias-corrected effect size estimate. By contrast, the bias-corrected PEESE estimate was less than half of the initial summary effect and only marginally significant. Extending the logic of Egger’s regression test and PEESE to the RVE framework provided largely converging evidence, but the PEESE estimate for the summary effect was clearly nonsignificant. Taken together, all available evidence suggests that there are small-study effects that may at least partly reflect publication bias. Unfortunately, the severity of this bias is difficult to estimate based on currently available methods, especially because the available methods do not closely converge.
Discussion
The present meta-analysis summarized studies testing the hypothesis that practicing self-control in one domain will lead to benefits in self-control performance in other domains. A random-effects meta-analysis based on 33 studies, 158 effect sizes, and more than 2,600 participants revealed an overall effect size of g = 0.30, CI95 [0.17, 0.42]. Three comparisons help putting this effect size into perspective: First, it ranges between a small (0.2) and a medium (0.5) effect size according to the conventions by Cohen (1988), gravitating more toward a small than to a medium effect. Second, the effect size found here is a little larger than half of the average effect size found in a meta-analysis of 302 meta-analyses of a broad range of psychological, educational, and behavioral treatments (d = 0.50, Mdn = 0.47; Lipsey & Wilson, 1993). Third, the current effect size ranges between the fourth and fifth decile of effect sizes in social psychology according to a meta-analysis of 322 meta-analyses in social psychology that revealed a mean effect of d = .43 (Mdn = .37; Richard, Bond, & Stokes-Zoota, 2003). In sum, the present meta-analysis suggests that repeated practice improves self-control with an effect size that is somewhat smaller than common treatment effects in general and effects in social psychology in particular.
The analysis also revealed a moderate to high degree of heterogeneity, with about 60% of the variance estimated to be due to real differences in effect sizes. What are the underlying moderators that account for these differences? Training effects were stronger when they were assessed after performing an initial demanding self-control task, thus reflecting self-control stamina, as compared to assessments without such an initial task (reflecting self-control strength). This finding suggests that self-control training effects may be more pronounced when self-control demands accumulate (i.e., ego depletion).
Effects were also stronger when proponents of the strength model were involved compared to those conducted exclusively by other researchers. The origin of this effect is unclear. Possibly, proponents of the strength model operationalized treatments and instructed participants in particularly effective ways. Alternatively, strength model proponents may have been biased in favor of the hypothesis, or other researchers may have been biased against the hypothesis.
Effects also tended to be stronger in studies with inactive control conditions. This finding is plausible considering that inactive control conditions allow all kinds of mechanisms to drive training effects, while active control conditions narrow down the range of possible driving mechanisms. Finally, self-control training tended to be more effective in males than in females. One reason for this effect could be that men have stronger potentially problematic behavioral impulses, as has been suggested by previous research (Baumeister, Catanese, & Vohs, 2001; de Ridder et al., 2012). Men may therefore profit more from improved self-control through self-control training.
In an analysis that examined the most potent moderators simultaneously, stamina versus strength, control group quality, and research group remained at least marginally significant moderators. Gender ratio was no longer significant. Finally, it is noteworthy that even the comprehensive multimoderator model explained only a moderate amount of heterogeneity (ΔI2 = 13.89%, remaining I2 = 45.24%). This suggests that we either missed plausible moderating factors or that the bulk of variance in effect sizes is study-specific and not systematic.
In the course of working on this meta-analysis, we learned about another team of researchers working on a non-peer-reviewed analysis focusing on the effectiveness of self-control training to change health behavior (Beames, Schofield, & Denson, in press). Their work is related to the present analysis, as the databases overlap. Yet there are notable differences between the two projects: They rely on different meta-analytic approaches (RVE vs. conventional random-effects meta-analysis), the calculation of effect sizes differs for some study designs, and they investigate different moderator variables. Despite these differences, it is noteworthy and reassuring that both analyses arrive at similar estimates for the uncorrected mean effectiveness of self-control training (g = .30 in the present analysis vs. g = 0.36 in the work by Beames et al., in press).
Small-study effects and publication bias
The Trim and Fill method indicated a moderate degree of bias and delivered a corrected effect size estimate of g = 0.24. By contrast, PEESE indicated a much greater degree of bias and delivered an estimate of g = 0.13 that was not significantly different from zero. Note that an association between effect size and study precision (as detected by Trim and Fill and PEESE) can result from publication bias, p-hacking, and other biases, but it may also partly or completely be due to mundane reasons that cause small-study effects. For example, in the medical sciences, samples that are particularly receptive to an intervention due to a certain health condition may show particularly strong effect sizes. Such samples may also be difficult to recruit and therefore form smaller sample sizes than samples consisting of more readily available (and less susceptible) participants. Concerning the present database, we were unable to come up with analogous mundane reasons for small-study effects in the self-control training literature. Given how the field worked for many years (e.g., difficulty to publish nonsignificant findings), we deem it likely that there is publication bias in the investigated literature, but the severity of this bias is difficult to estimate. This is because none of the currently available techniques performs consistently well under conditions typical for (social) psychological literatures including heterogeneity and publication bias (Gervais, 2015; Inzlicht et al., 2015). Thus, the degree to which the bias-corrected estimates are biased themselves is unknown.
Mechanisms underlying training effects
The present meta-analysis suggests that self-control training may lead to slight improvements in self-control in other domains. The strength model postulates that the repeated control of dominant responses strengthens the “self-control muscle” (Baumeister & Vohs, 2016b). This metaphor is vivid and descriptive, but it is of limited explanatory value for the observed effects because it does not specify the psychological mechanisms explaining training success. What do we know about mechanisms underlying training effects? One may approach this question from two perspectives. First, one may try to identify the crucial elements in a self-control training that make it effective. Second, one may think about the psychological processes that mediate self-control training effects.
The strength model claims that the repeated exertion of self-control by overcoming a dominant response is the driving “ingredient” of the self-control training. However, effect sizes stemming from studies with inactive control groups were almost 50% larger than those from studies with active control conditions. In studies with inactive control groups, various mechanisms besides the repeated control of dominant responses can cause an intervention effect (e.g., demand effects, greater engagement with the study by the active intervention group). What is more, even in the subset of studies with active control groups, few control groups closely matched the training condition, allowing for other than the focal mechanism to drive training effects. Thus, the net training effect due to the control of dominant responses may still be smaller than indicated by the training effect obtained for the studies employing active control groups (gactive = 0.23, CI95 [0.08, 0.39]).
With regard to the mediating psychological processes, surprisingly little is known. Some studies investigated changes in self-efficacy, awareness of the concept of self-control, and implicit theories about willpower as possible mechanisms but did not find evidence for mediation (Job, Friese, & Bernecker, 2015; Klinger, 2013; Muraven, 2010a, 2010b). In one study, self-control training reduced academic effort avoidance in university students, which partly mediated the effect of training on participants’ grade point average (Job et al., 2015). This study suggests that motivational variables might play a mediating role. Future research has to test whether changes in effort avoidance may account for training effects in other domains than academic achievement.
One hitherto unexplored possibility is that training and control conditions differentially affect participants’ expectations, thus allowing for placebo effects without actual changes in the trained constructs (Boot, Simons, Stothart, & Stutts, 2013; Foroughi, Monfort, Paczynski, McKnight, & Greenwood, 2016). Expectations regarding possible improvements on the dependent variables may differ between groups if they are not measured or, better, experimentally controlled—even in studies with active control groups. Hence, more knowledge is needed about how participants believe the (training or control) intervention is affecting them. What do participants believe their training regimen to be good for? What are their ideas about the researchers’ goals for the study, and which expectations about improvement on the measured constructs do participants hold?
In sum, little is known about the crucial elements of a training intervention. The literature to date does not deliver conclusive evidence that exerting self-control by repeatedly overriding dominant responses is the dominant causal mechanism that improves self-control over time and across domains. Even less is known about the psychological processes that are affected by a self-control training and lead to improved self-control performance.
How to move forward?
We will briefly discuss recommendations for future work concerning both methodological and theoretical developments. On the methodological level, future research should, first, conduct direct, high-powered, and preregistered replications. The set of the present 33 studies is very diverse, containing no close replications that would bolster confidence in obtained findings. Second, it will be important to more consistently use pre-post designs to increase statistical power. Based on the mean parameters evidenced by the current meta-analysis (g = .30, Naverage = 79, α = .05, rpre-post = .70 within control groups), power for studies with pre-post designs is adequate (1-β = .92). However, in post-only designs the same parameters result in a poor power of 37%, even with a one-tailed test. Note that it is possible that the true training effect is smaller than g = .30, which further increases demands on sample size. Third, future studies should employ (a) longer and (b) more varying training durations as well as (c) more consistently include follow-up measurements with (d) varying time lags. Only 9 of the analyzed 33 studies included a follow-up measurement (median time lag, 9.5 days). Effect sizes posttraining were considerably larger (g = 0.31) than at follow-up (g = 0.18). Although nonsignificant, this difference raises concerns about the practical utility of self-control training in the way it has been implemented to date. Researchers may want to consider ways to foster more sustainable self-control training, for example, by reminding participants of the training principles or implementing brief training refreshments after the main training period.
On the theoretical level, self-control training should only lead to performance improvements in activities that actually require self-control for a given person. This is not the case if a person has no goal to control a behavior. In this case, enacting such behaviors does not constitute a self-control failure. People who strive to achieve a certain goal or change a specific behavior—but are unsatisfied with their success in doing so (e.g., alcohol or nicotine consumption, eating behavior)—are the ones who are most likely to profit from a self-control training. For these people, a self-control training may constitute a welcome means to work on the goal and provide a motivational boost by conveying the possibility that the training may help to achieve the respective goal (even if the person has no elaborate idea about how the training may do so). Ideally, a training sets in motion recursive motivational processes that help to build and keep up adaptive routines that may then contribute to lasting changes in behavior (Walton, 2014).
In addition, it will be important to control for differences in expectations about the consequences of a training regimen because different expectations may drive training effects (Boot et al., 2013). Such placebo effects are interesting in their own regard, but they limit researchers’ ability to draw causal conclusions about a proposed working mechanism of self-control training. However, from the perspective of people who are interested in self-control improvements, making progress toward goal attainment is more pressing than identifying the underlying processes. If placebo effects do the trick and do so reliably, one may pragmatically advocate to let them do it. Researchers may interpret such, at first, poorly understood effects as an opportunity to investigate the underlying (motivational) processes in depth and apply this knowledge to new training interventions.
Limitations
The present work suffers from some limitations that future research may want to ameliorate. First, with 33 studies the available evidence on self-control training is still moderate. In light of the analyses presented here, it is premature to draw far-reaching conclusions. Several moderator analyses delivered substantial descriptive differences that did not reach significance, potentially due to low power.
A second limitation is that we could not calculate publication bias-corrected effect size estimates to the extent we had initially planned. Some techniques proved very unsatisfactory in simulation studies in that they severely underestimated true effect sizes under almost all realistic conditions (PET; Gervais, 2015; Inzlicht et al., 2015). Several other recently introduced techniques appear promising (Simonsohn et al., 2014; van Assen, van Aert, & Wicherts, 2015) but cannot be applied in a reasonable way to the current literature. These procedures rely exclusively on significant and published effect sizes with only one reported p value per study entering the computation. For the present meta-analysis, this would have led to an excessive loss of information (see Note 5). Also, they assume a homogeneous distribution of effect sizes, an assumption clearly not valid in the present literature. Future developments in meta-analytic techniques may be able to deliver valid publication bias-corrected effect size estimates for literatures with similar characteristics as the present one.
Conclusion
Self-control is believed to be a domain-general capacity. The self-control training hypothesis suggests that practicing self-control in one domain improves self-control in other domains as well. The present random-effects meta-analysis found a small-to-medium self-control training effect. Bias-corrected estimates indicate a smaller effect. The working mechanisms underlying these far-transfer training effects are poorly understood and require further attention. We hope this meta-analysis will inspire researchers to further engage in this theoretically intriguing and practically relevant field of psychological research.
Footnotes
Acknowledgements
The first and second author contributed equally to this work. We thank Alexander Hart for his assistance in coding the studies included in the meta-analysis; Joanne Beames, Tom Denson, and Martin Hagger for their valuable input and comments; and Zachary Fisher as well as Elizabeth Tipton for their advice with the implementation of the RVE approach to analyze the data. We are indebted to all primary authors who generously provided us with additional information about their studies.
Declaration of Conflicting Interests
The authors declared that they had no conflicts of interest with respect to their authorship or the publication of this article.
Funding
This work was supported by German Research Foundation (DFG) Grant FR-3605/3-1 (to M.F.).
Supplemental Material
Additional supporting information may be found at http://journals.sagepub.com/doi/suppl/10.1177/1745691617697076. All data, code, full documentation of procedures, and additional analyses are available at  .
.
Notes
References
Supplementary Material
Please find the following supplemental material available below.
For Open Access articles published under a Creative Commons License, all supplemental material carries the same license as the article it is associated with.
For non-Open Access articles published, all supplemental material carries a non-exclusive license, and permission requests for re-use of supplemental material or any part of supplemental material shall be sent directly to the copyright owner as specified in the copyright notice associated with the article.
