
Abstract
Regional payers are important stakeholders with a strong influence on the use of prescription drugs. As regional payers are complex organizations that are numerous and diverse in their profiles and behaviours, it is infeasible to develop a unique strategy for each. A cluster analysis of regional payers can identify segments with similar potential, which can be addressed with common strategies. This paper presents an innovative clustering methodology that is suitable for the complexities of the regional payer environment and shows how the methodology can be applied to an actual market context.
Introduction
There are many factors that determine the commercial success of a new product launch in the healthcare industry: level of unmet needs, innovativeness, efficacy and safety, commercial efforts and so forth. In recent years, the importance of developing a robust payer strategy to achieve market access has also been identified as a key success factor. Healthcare companies have therefore increased their efforts to develop and use economic evidence to show that their products are cost-effective, or at least that their budget impact will be limited.
In the USA, the need to segment that health insurance market is well recognized. While just 16 companies constitute half of the market, an additional 109 companies make up the next 40%. 1 Healthcare companies are familiar with this complexity and have, for many years, segmented the different insurer types (health maintenance organization, pharmacy benefit manager, Medicaid, federal and employer). Indeed, such payer segmentation approaches have previously been published in this journal. 2
In Europe, such efforts have largely been directed towards national payers, with the health technology appraisal (HTA) the focal point for the development of comprehensive, carefully constructed value dossiers containing well-referenced value messages and sophisticated health economic models. These efforts are often subject to intense criticism by the payers: evidence may be incomplete or weak, data may be missing or invalid, models may poorly characterize the impact of the therapy on the healthcare system or payer budget. Partly, this is due to differing requirements from payers for analysis and evidence: what is suitable for one may be irrelevant for another. In the UK, the quality-adjusted life year (QALY) is used extensively by the National Institute for Health and Clinical Excellence (NICE) to measure health effects and determine whether or not the NHS will pay for new therapies. 3 In Germany, the QALY is rejected as a concept and instead the efficiency frontier is used. 4 Other countries have other methods, and a ‘one-size fits all’ approach towards national payers is unworkable.
Payer Responsibilities

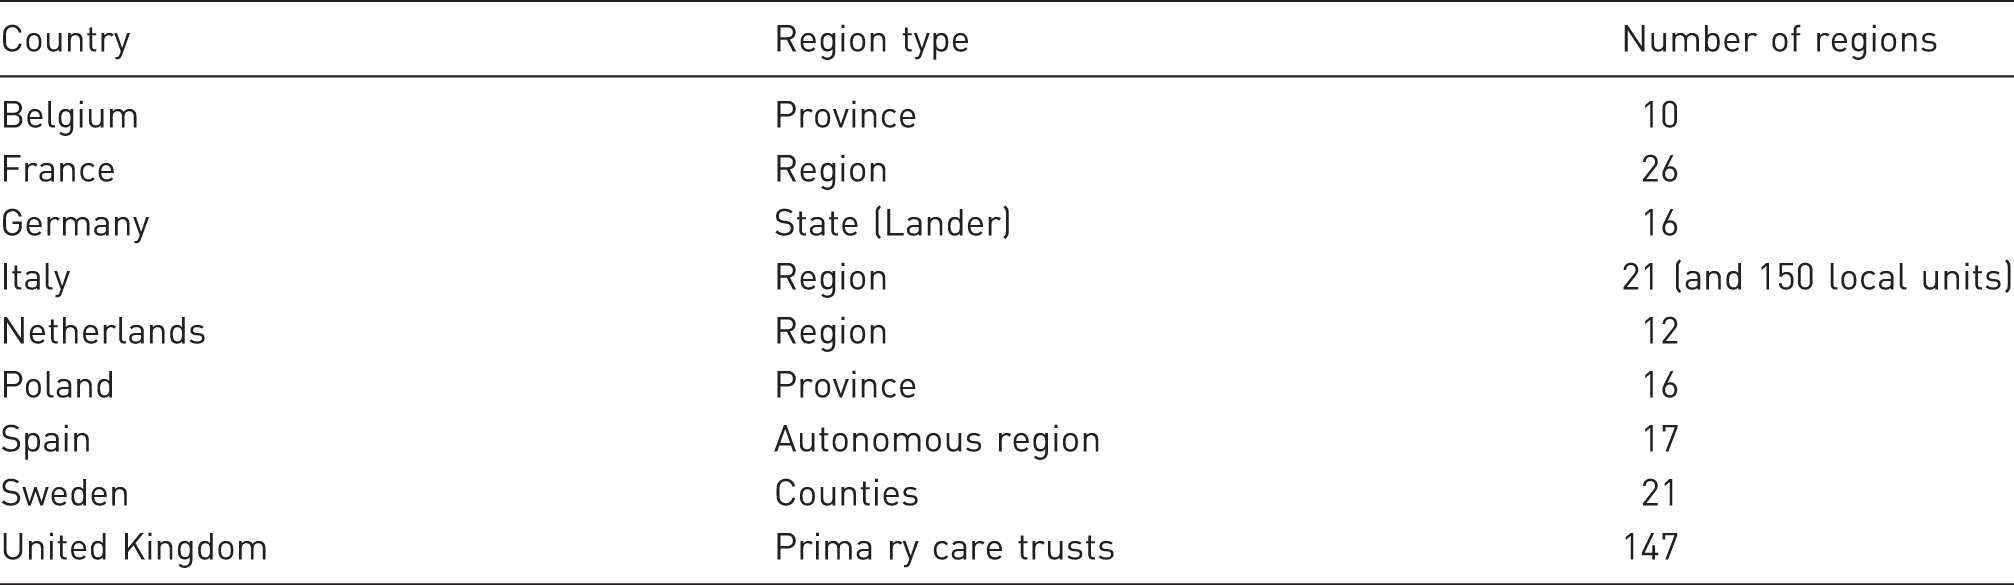
The growth of regional payer importance creates a ‘double hurdle’ for companies, where a favourable national decision must be replicated at a regional level, among payers with different concerns, budgets and levels of sophistication. 5 That regional payers may have different budgets is evident, as they differ in size. However, where funding for health care is derived in whole or in part from regional taxation, the healthcare budget may vary depending on the wealth of the region. Demography and epidemiology also differ by region, with important consequences for payers. As with countries, regional payers may use different methods to evaluate health technologies, with some focusing exclusively on the budget impact of new products, while others are interested in establishing whether or not a new therapy is cost-effective for use in their particular region, based on local epidemiology, costs and practices. In Italy, for example, 16 of the 21 regions use binding national formularies, while eight of the regions undertake some sort of local HTA. 6
The power of regional payers is far from theoretical. Although the term ‘post code prescribing’ is used by the UK press to describe inequalities in healthcare provision among primary care trusts (PCTs) in that country, regional differences are observed in most European markets. Countries with more developed regional systems may monitor such differences, but do little to prevent it. In egalitarian Sweden, such differences are stark: five-year survival rates for some cancers differ almost twofold among counties, while 28-day stroke fatality rates vary from 17% to 27%. 7 In Italy, the national health authority, Agenzia Italiana del Farmico (AIFA), recently acted to limit extreme regional differences in the availability of medicines, 8 but in most countries, the tendency is for more regional power, leading to more regional variation.
Regions in Selected European Markets
Given the diversity and impact of regional payers on the use of different therapies, it is obvious that they require strategic attention from any pharmaceutical companies. However, it is infeasible to develop a market access strategy for each region, as the costs of local adaptation can be high and the local requirements for data analysis and support can be quite specific. As a consequence, it is necessary to find ways to segment regional payers – to identify groups that can be addressed with similar strategies.
Study objectives
In marketing, segmentation consists of grouping people or organizations that are similar in terms of how they respond to a particular marketing mix or in other ways that are meaningful for marketing planning purposes.
10
Our study objectives were to:
demonstrate that segmentation is also appropriate for regional payers, either nationally or at a European level; develop an innovative clustering methodology that would be suitable for the complexities of the regional payer environment; and validate the methodology by applying the methodology to a real company facing regional market access challenges, to benefit from its experience.
This cluster analysis study was undertaken among PCTs in the UK. In this market, one can observe significant local barriers to drug usage, including:
limits to prescribing within the drug class; different levels of PCT interest in treating different diseases; different resources to manage different diseases; and differences in PCT management with a direct impact on drug usage.
As a result, healthcare companies must identify the different PCT types and develop strategies specific to each type. As there are 152 different PCTs in England alone, individual strategies are not feasible and some sort of segmentation approach a is required. Consequently, the UK was seen as a suitable market for the project.
To validate this approach, we collaborated with a global pharmaceutical company actively marketing its products in the UK. The therapeutic area chosen for the study was depression because this category is subject to almost all the regional and local hurdles and there are large variations in the approach to treating depression among PCTs. The company had also determined that, in this area, PCT differences were impacting on the company's sales and believed that identifying PCT segments could have a positive impact on their performance. The anticipated use of the segmentation scheme by the company was therefore to analyse gaps between segment potential and results and to develop segment-specific action plans to maximize market access (formulary inclusion, usage conditions, etc.) and ultimately drive sales of the company's antidepressant drug.
Context and rationale
The $2.4 billion market for antidepressants in Europe is crowded and mature, with numerous off-patent generic medicines already available, and even branded extended-release formulations (e.g. Effexor XR) now face generic competition. 11 The two leading drug classes, serotonin–norepinephrine reuptake inhibitors (SNRIs) and selective serotonin reuptake inhibitors (SSRIs), are forecast to decline most, with only the N6A9 class of antidepressants experiencing strong growth. Tricyclic antidepressants, despite being generic, have largely been displaced from the market owing to side-effects and overdose risks, in favour of SSRIs. The European market is forecast to be flat or decline in the coming years, with the UK most impacted, declining by over 2% year on year from 2010 to 2019. 11 Today, the UK accounts for 2.1% of the global market, at $258 million; by 2019 it will be just $214 million. 11
In the UK, generic SSRIs were the first drug therapy to be recommended by NICE, 12 and PCTs largely follow this recommendation in their local formularies and guidelines. For manufacturers of branded antidepressants, the market access challenge is therefore usually justifying a second (or third)-line positioning for patients who do not respond to generic SSRI therapy. The number of alternatives available means that companies compete for inclusion in PCT formularies. Severely restricted inclusion or non-inclusion is a significant barrier to uptake in the UK market. Overcoming these hurdles requires an understanding of the numerous factors that affect the inclusion decisions for PCT formularies and guidelines, as well as understanding how these guidelines are applied. The route to success lies first in identifying and grouping PCTs where the factors are similar and can be influenced in similar ways, and second in defining effective strategies to achieve access.
Available information
National Health Service Structures in the United Kingdom
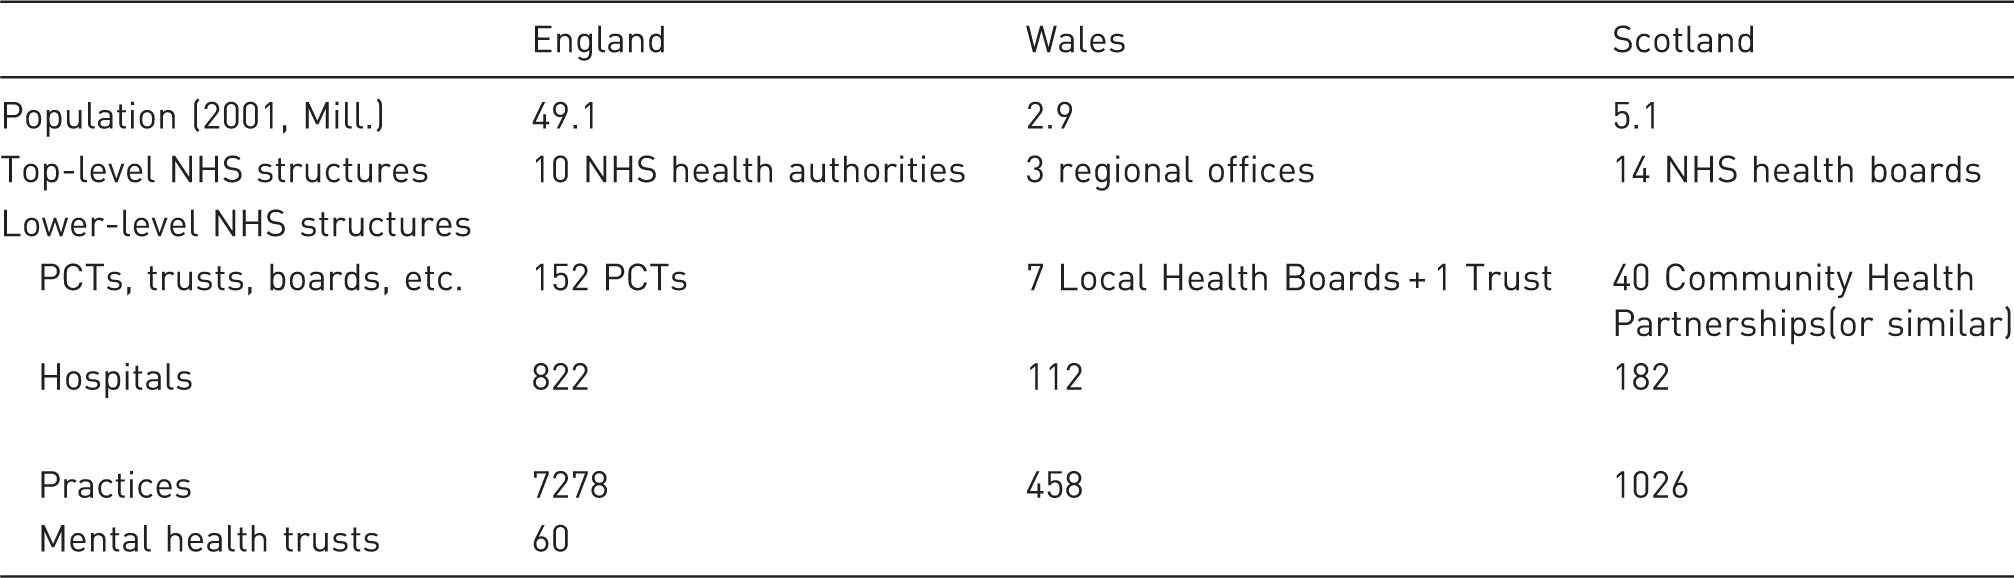
Additionally, we were able to extract data for some of the countries of the UK as follows:
financials of the PCT (England and Scotland only); size of the Medicines Management Team (England); percentage of items prescribed generically (Scotland and Wales); PCT prescribing costs and prescribing of ‘black triangle’ (new drugs) (England); PCT prescribing costs and items for antidepressants (England and Scotland); PCT recommendation for use of antidepressants; scores of use of branded antidepressants based on quotes from the PCT websites; GPs or practitioners with special interest in mental health (England and Scotland); and local enhanced services for mental health (England and Scotland).
In order to most effectively consolidate the PCT data that were publicly but not readily available, we turned also to the proprietary OneKey+ database of Cegedim Dendrite (available by subscription only at http://www.onekeyplus.co.uk/). OneKey+ collects and analyses information from all local NHS organizations, including all information from pharmacy, primary, secondary and tertiary care levels in a single database. A total of 25 datasets were purchased for the prior-year period, including some that were redundant with the publicly available previously collected.
Once received, we undertook a review of the data available and the potential of each country market. Owing to changes in NHS structures in Scotland and Wales, as well as different and more limited datasets, full segmentation analysis could not be performed. A decision was therefore taken to focus the analysis on England, for which we had the largest population and most consistent dataset.
Description of variables
Main Segmentation Variables

Methodology: principal component analysis and multiple correspondence analysis
A primary care trust (PCT) is a large organization and decisions related to product use within the PCT are complex, with numerous factors influencing the decision. The 64 variables collected were quite exhaustive and provided data on PCT processes, actual practice, performance and population. The variables were often linked to each other, but no data were redundant. In order to perform the clustering analysis, there were two options: to represent correlated variables with only one variable, or to run data mining analysis and to represent correlated variables with the coordinates of the axis on which they were projected. The second option was chosen, as each variable had an intrinsic value and its deletion may have led to a loss of information. By choosing the second approach, the maximum level of information was preserved.
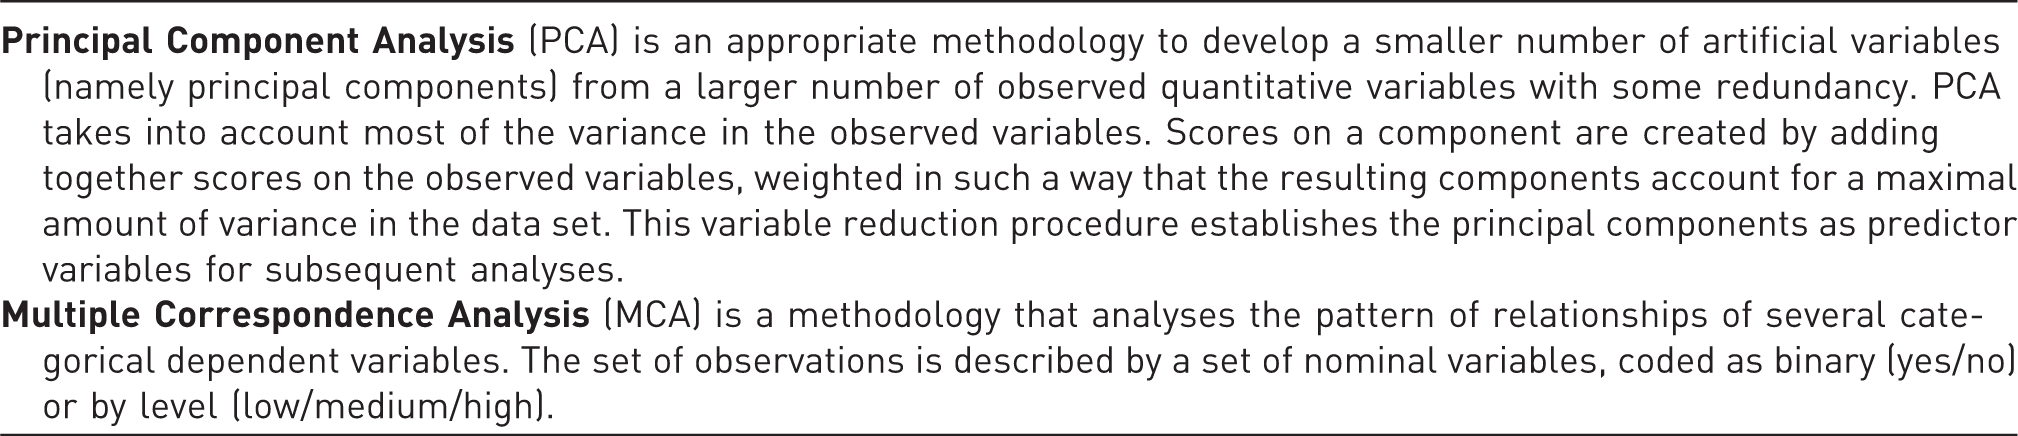
We first ran a principal component analysis (PCA) on quantitative variables and then a multiple correspondence analysis (MCA) 13,14 on qualitative variables. These mathematical procedures transformed a number of possibly correlated variables into a smaller number of uncorrelated variables. Brief descriptions of the two methods can be found in Box 1.
We then performed a disjoint cluster analysis on the merged results. This clustering method is often called a k-means model because the cluster centres are the means of the observations assigned to each cluster when the algorithm is run to complete convergence. Each iteration reduces the least-squares criterion until convergence is achieved.
The methodology is innovative and, to our knowledge, has not previously been applied to pharmaceutical marketing. It permits us to mix quantitative and qualitative variables and also to transform variables. Consequently, the analysis can account for the all the information available, whereas other methodologies would have been less integrative.
Results and descriptions of clusters
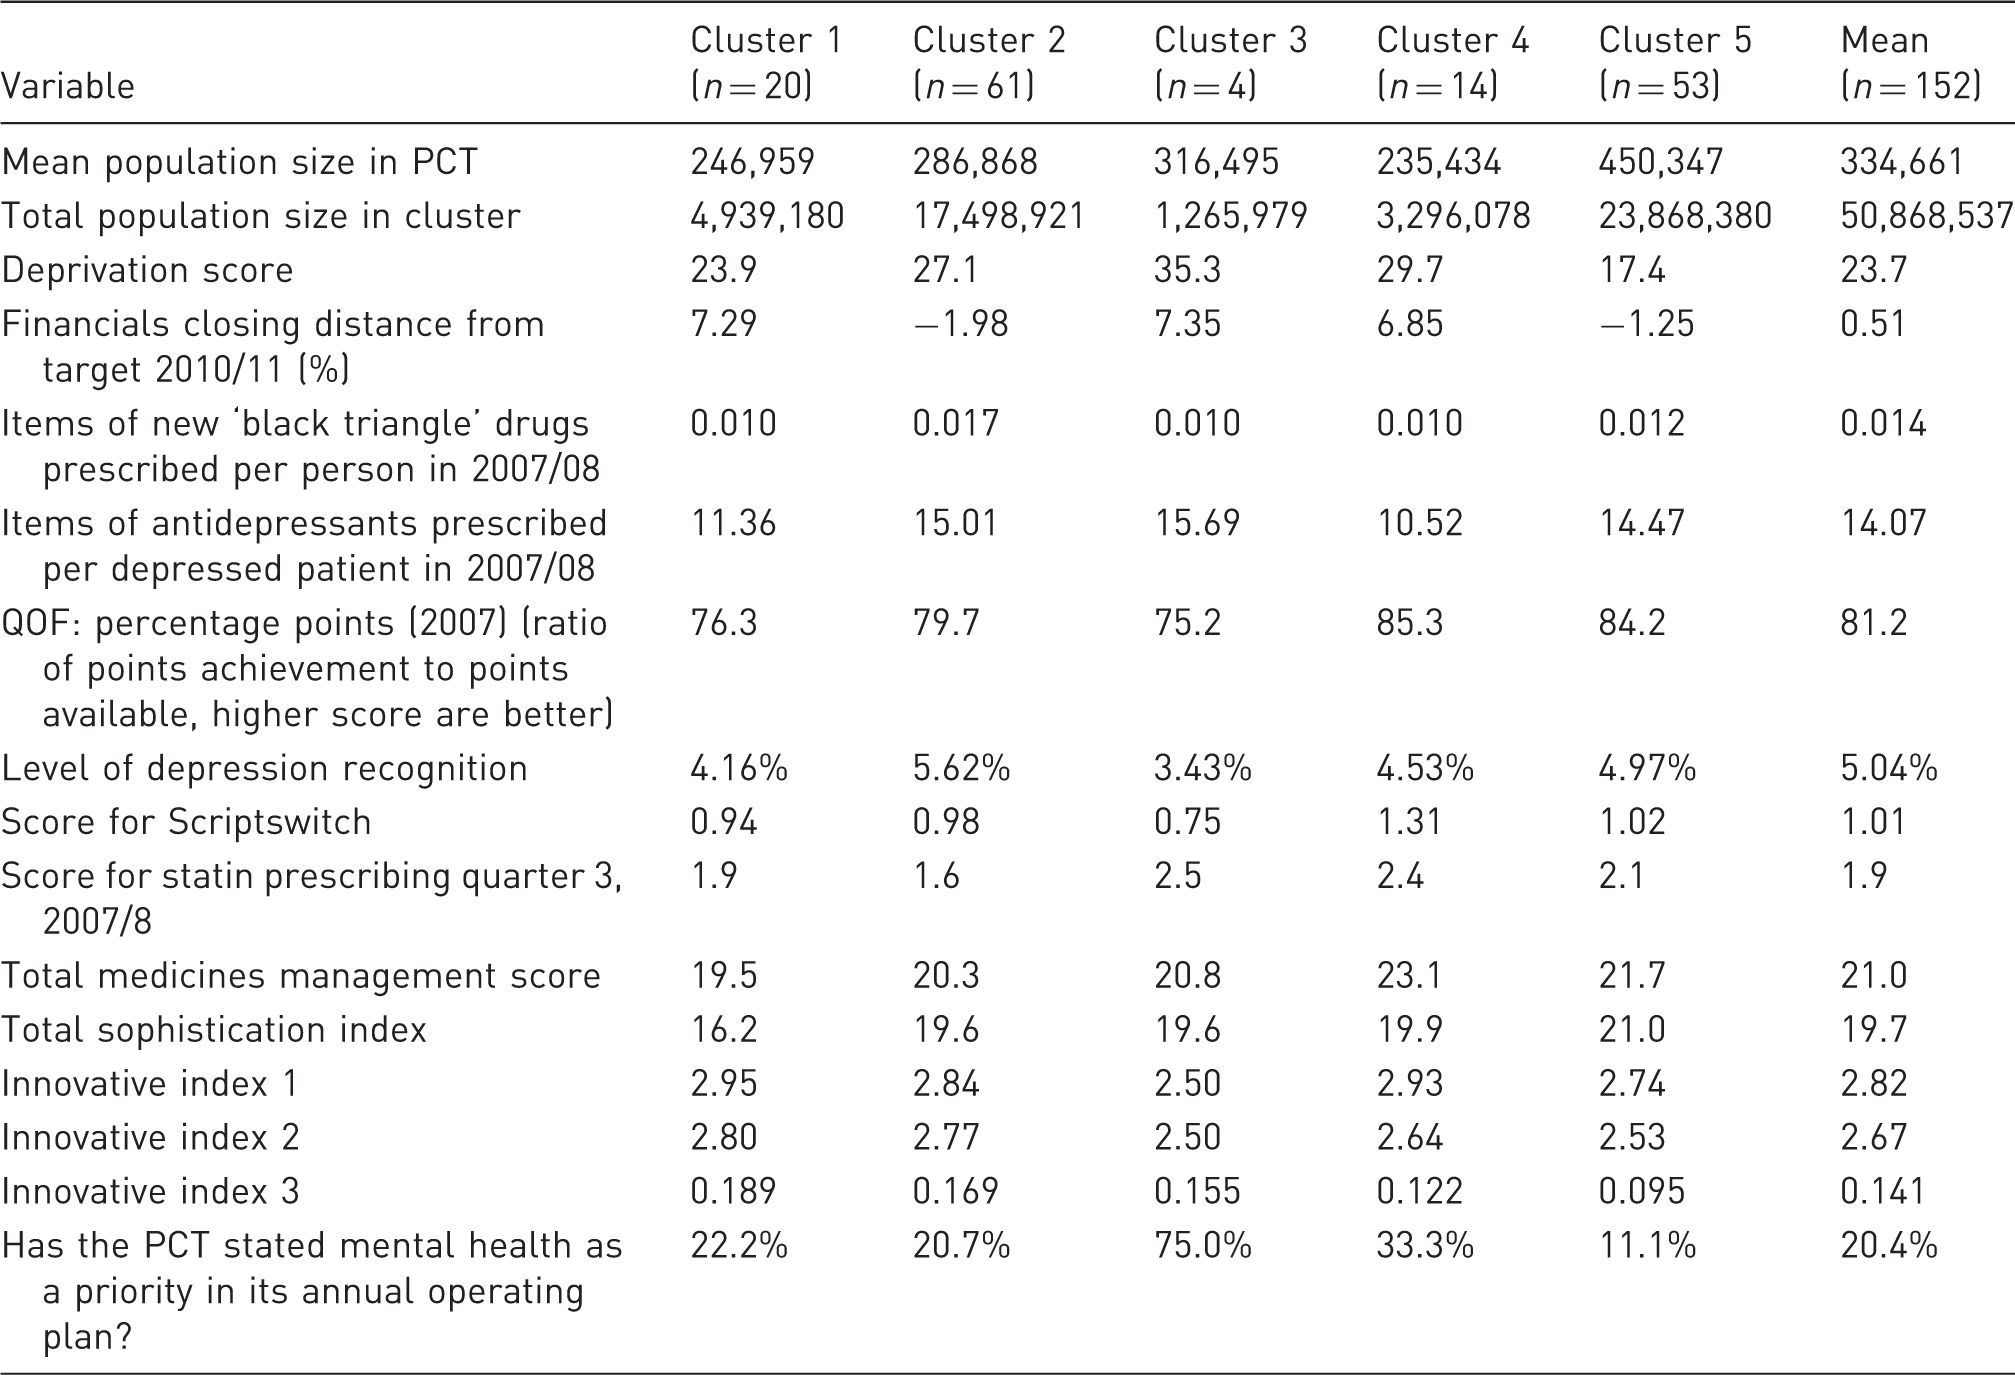
Results of Cluster Analysis
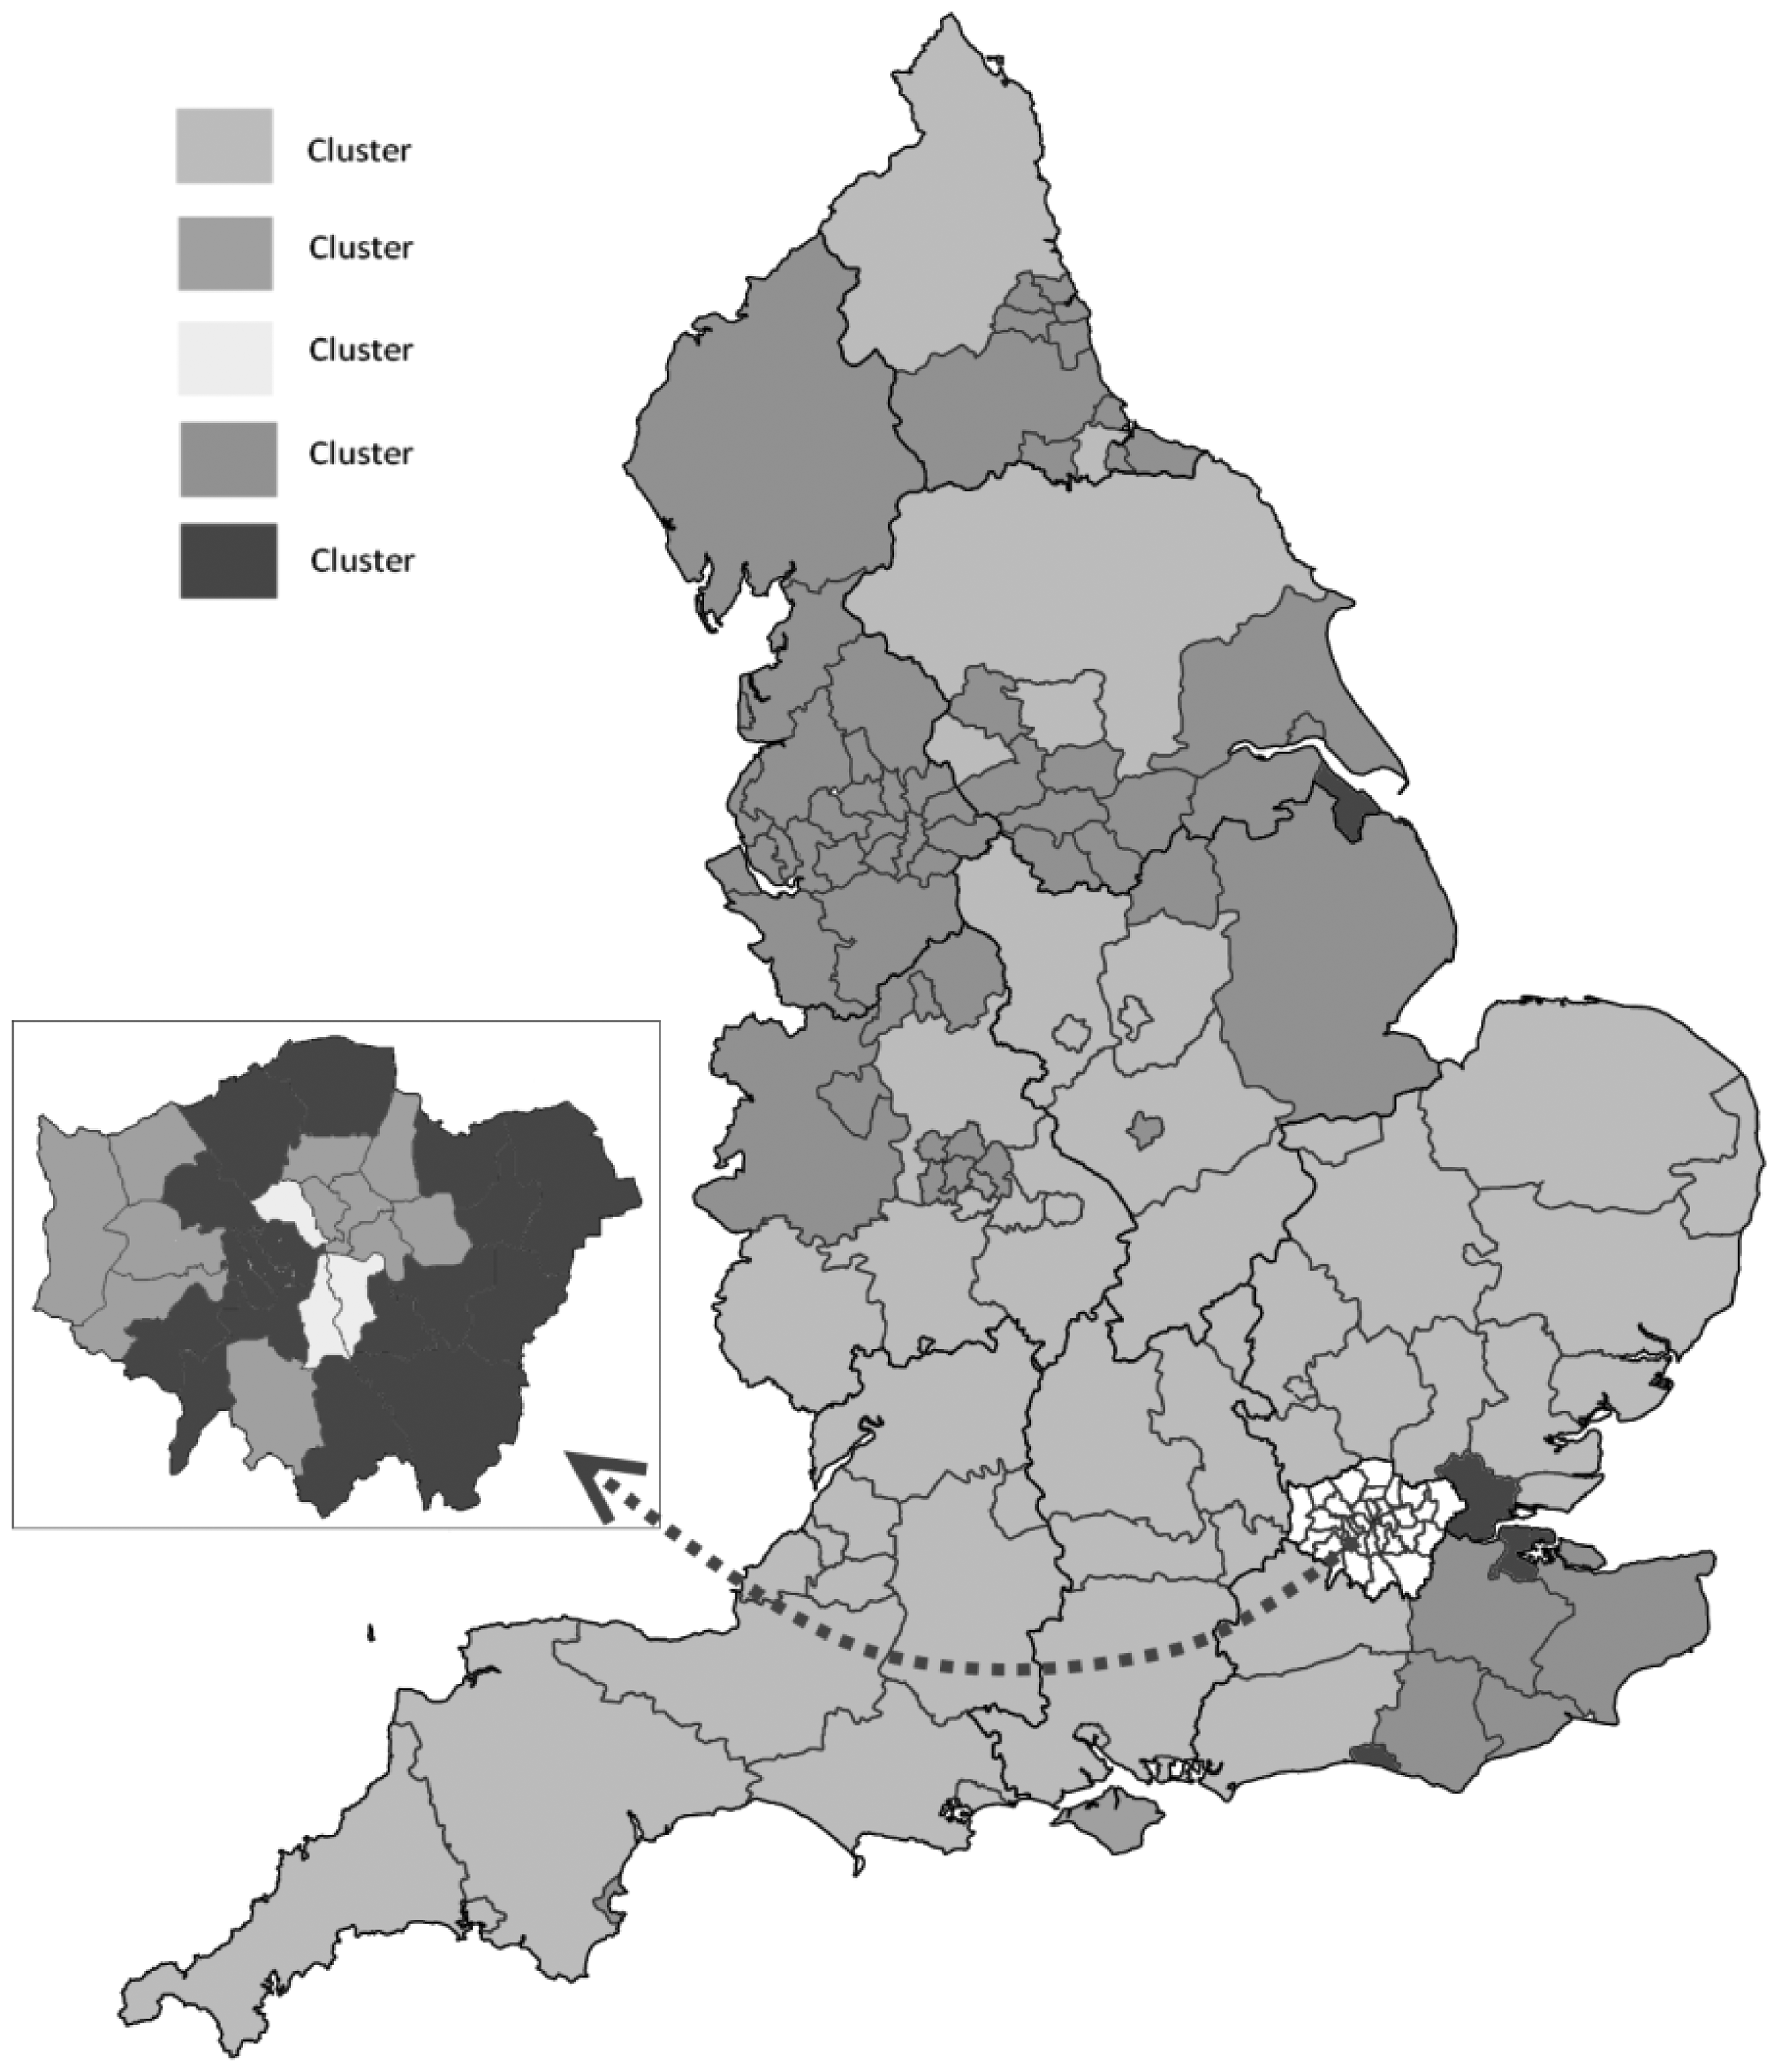
Distribution of Clusters in England.
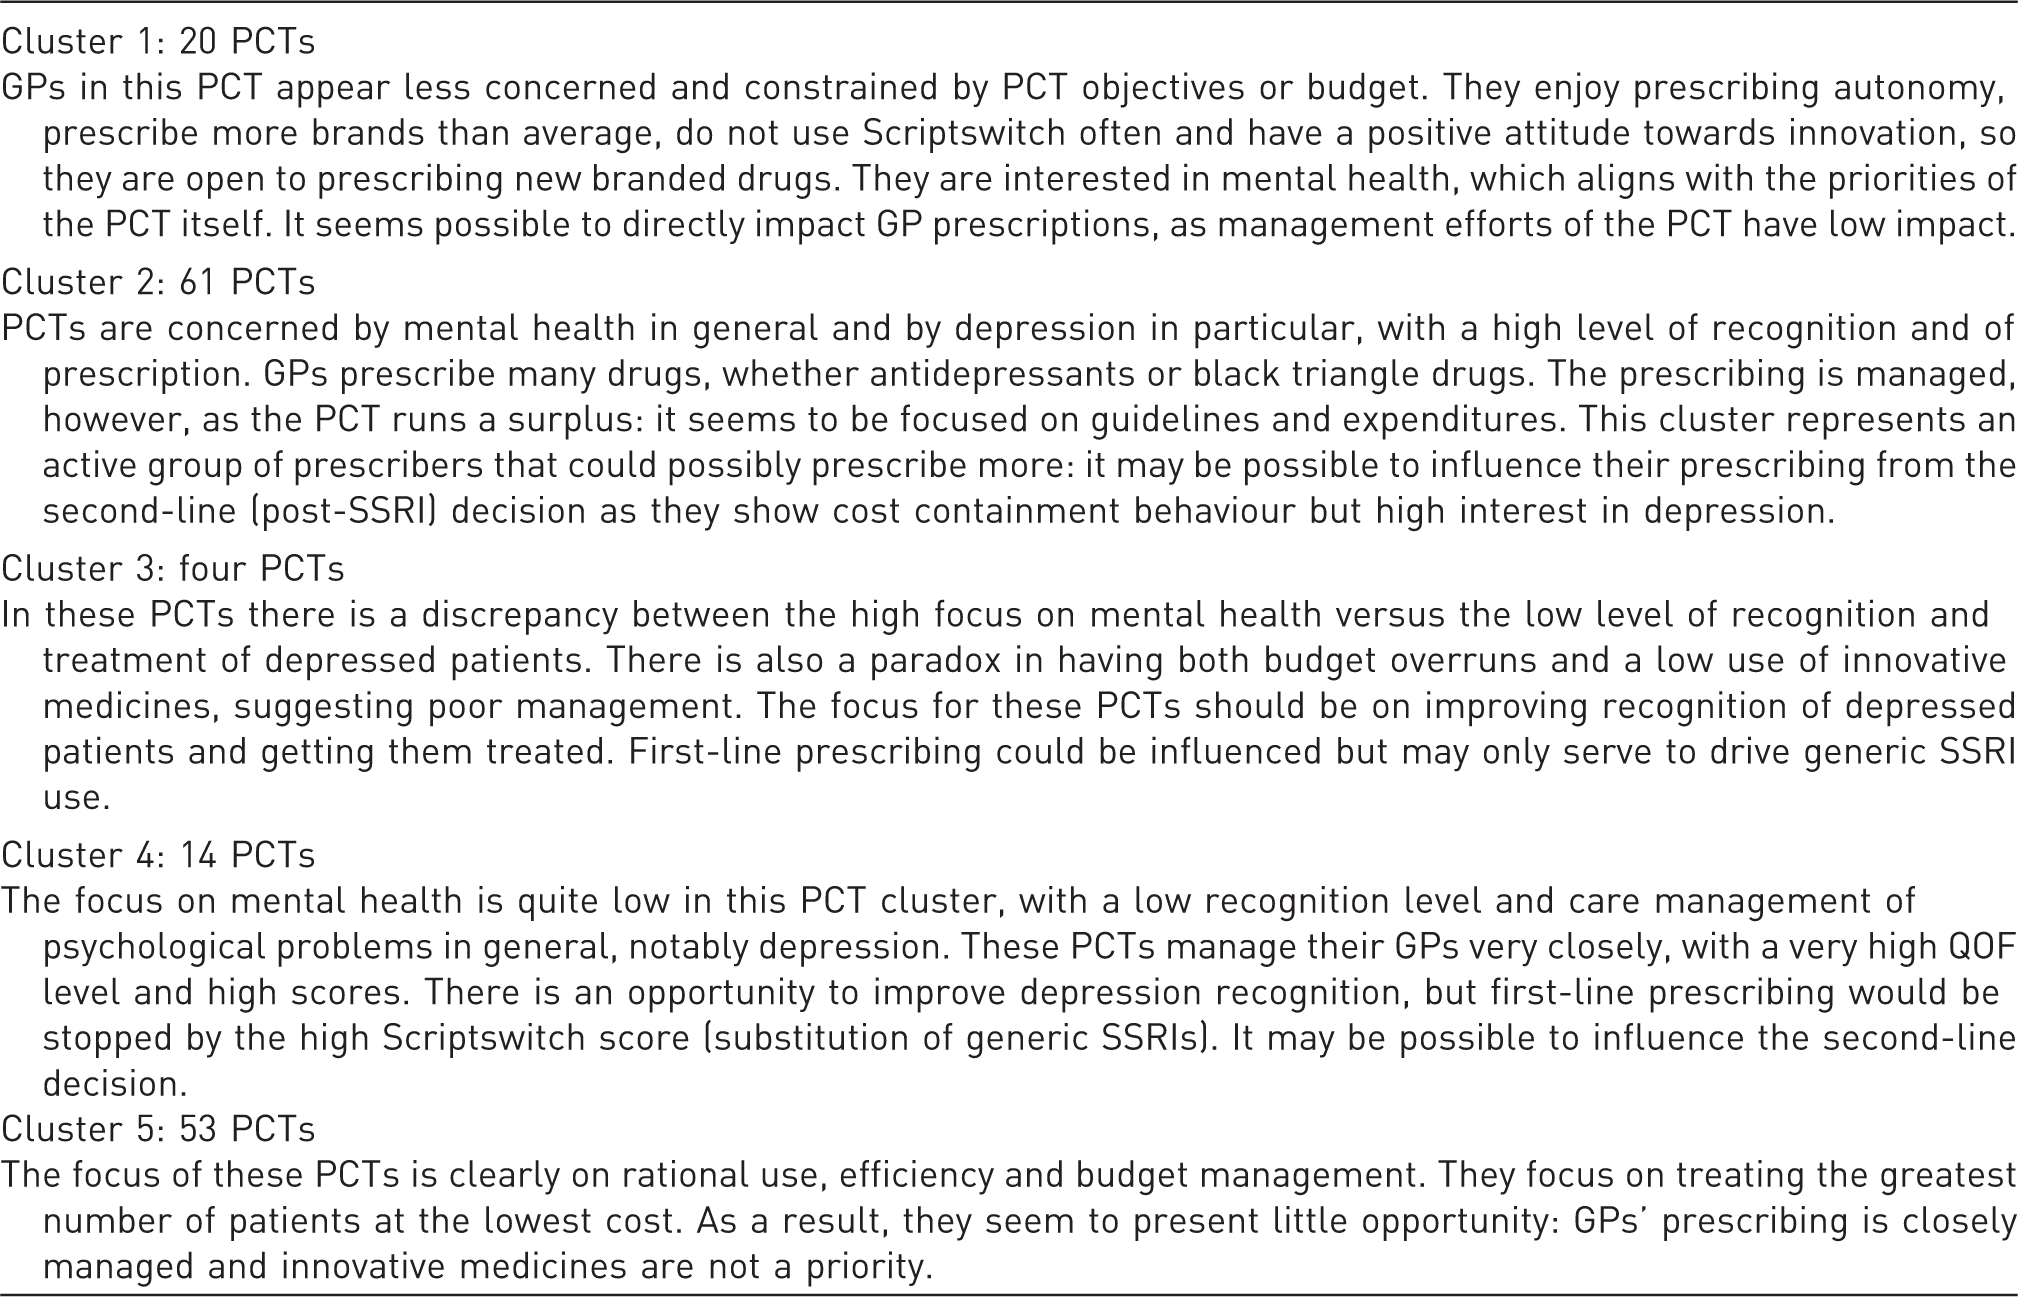
Cluster Descriptions
Methods of Analysis Used
Improving sales: applying the strategic levers
The cluster analysis was used to advise on the opportunities to increase sales of branded drugs versus SSRI generics through two strategies:
increase company brand market share where clusters are open to drug prescribing; increase total antidepressant prescribing (by driving disease recognition, prescriptions per patient, etc.).
Priorities for the first strategy were given by the cluster analysis: cluster 1 and 2 were identified as having the highest potential in this regard, although some progress could be anticipated in all but cluster 5. However, the five clusters are each different in potential and profile and the specific approach (method, message, outcome anticipated) was unique.
For the second strategy, a specific analysis of the potential was performed. Both level of depression recognition and number of antidepressants prescriptions per treated patient impact the number of antidepressant prescriptions written per year.
A solid indicator of depression recognition, and a proxy of prevalence, is the ratio of number of registered depressed patients to total list of patients.
To test the impact of improving recognition, three scenarios were considered: the ratio remains unchanged, the ratio increases to the mean of 5% (for PCTs in which the level was below the mean) or the ratio equals 5.6% (the maximum average level of cluster 2).
A second analysis of the number of antidepressant prescriptions per treated patient based on the ratio of number of antidepressant prescriptions to number of registered depressed patients Excluding any change in depression recognition, increasing the number of prescriptions per treated patient was shown to be the most effective strategy for clusters 1 and 4, with little or no impact on the other clusters. Increasing depression recognition to 5% or 5.6% alone was not more effective for clusters 1 and 4. However, this was a very effective strategy for cluster 3. Simultaneously increasing the number of prescriptions per treated patient and depression recognition significantly improved sales in cluster 1 (more than doubling the predicted result in the optimal case) and cluster 4 (increasing the predicted result by more than 50%). Cluster 3 results were in fact slightly worse when prescriptions per patient increased; this was because of the strong policy of generic SSRI prescribing. In cluster 2, where scores were already above average, predicted sales were unaffected by changes. This indicated that the maximum potential of PCTs in this cluster had already been achieved: despite GPs being open to prescribing the drug, management was unlikely to allow additional prescribing to occur. Cluster 5 predicted results were low across all scenarios; only in the optimal case did prescribing increase by more than 15%. As noted, this cluster was determined to have the least potential in previous analysis.
As a result of these analyses, our recommendation was to ‘invest’ in cluster 1 with direct GP targeting and in cluster 4 by pushing for second-line formulary inclusion. Cluster 3 was also identified for investment in disease education. Cluster 2 was recommended as a ‘maintain’ while cluster 5 was recommended for ‘disinvestment’.
Limitations of the study
As a final step, we considered some of the limitations of regional payer segmentation.
Limited availability of data
This analysis is feasible in any market for which data on regional payers and regional health are available. In most countries, regional health data are available or can be purchased from commercial providers. Although the UK is uniquely transparent in publishing detailed statistics of regional payer performance, some level of public accountability exists in most European countries. Therefore, we believe it possible to replicate this research in most regionalized European markets.
Methodological limitations
There are several limitations to the methodology chosen. The data do not give evidence on actual health status of the PCT population and the associated outcomes. As a result, the clusters do not consider underlying reasons for antidepressant prescribing, and the strategies are not based on population needs (e.g. for better recognition or longer treatment duration). Another limitation is the assumption that treatment duration is similar across PCTs, which has not been tested. A PCT where average therapy length is 6 months may have the same number of patients as a PCT where therapy length is 2 months, but treatment is very different. This information was not available for analysis.
The clustered PCTs appeared to be homogeneous and the clusters themselves heterogeneous. However, no statistical tests were performed on the clusters to test for differentiation. We considered the differences to be relevant irrespective of statistical tests.
Ability to develop cluster-specific strategies
An objection often raised is that company resources are finite and, if regions are highly diverse, it is not possible to develop a strategy for each. There are two answers to this. First, our analysis identified some regions where disinvestment could free resources for use elsewhere. Clustering can be used purely to reallocate resources within a fixed pool, from regions with little potential to regions with unexploited potential. Second, and more promisingly, if cluster analysis is done across multiple countries, clusters may be found that permit common strategies among the markets. Thus, a region in Italy may be similar to an autonomous region in Spain, and could benefit from similar strategies.
Changing regional landscape
In markets where healthcare reform is under way, cluster analysis may quickly become obsolete. This limitation is of direct concern in England, where the 152 existing PCTs will be abolished by 2013, to be replaced by GP consortia. Although the structure of these consortia is in development, it is known that their sizes will vary. The first consortia cover between 40,000 and 70,000 lives, whereas the Royal College of General Practitioners has recommended a size of up to 500,000. As a result, there may be as few as 102 or as many as 1002 GP consortia. Regardless of their number, GP consortia will also be too numerous to address uniquely, and so clustering will be required. In our view, healthcare reform may limit available data, but increases the need for cluster analysis.
Discussion
The cluster analysis, our scenario predictions and recommendations were shared with the company's commercial team and complemented by a further analysis of current PCT sales per cluster. This analysis validated the recommendations and permitted the company to take action to streamline the commercial activity of the affiliate and change market access efforts to match the PCT profiles. Additionally, the company was able to shift resources from cluster 5 (primarily rural) to clusters 1 and 4 (primarily urban), where potential remained unexploited.
The cluster analysis identified real opportunities for different business approaches and resulted in concrete changes to the company's commercial strategy with which we shared our analysis. This analysis shows that segmentation of regional payers is worthwhile, and can help with both strategy choice and resource allocation.
In theory, clustering could be done internally based on the expertise of marketing, market access and sales teams. The advantages of the proposed methodology over an expertise-based approach are as follows:
It makes objective use of market data to overcome biases based on personal opinion, historical conditions or other subjective considerations. It does not require company expertise, and therefore can be used by companies entering a new geographic or therapeutic market. It allows for rational decision-making in segmentation of regional payers.
In situations where a company has national market expertise, such an approach can deliver significant additional value as a complementary analysis, to support internal discussions about regional payer strategies. In situations where a company faces similar regional payer types in multiple countries, this approach is a robust way to cluster the payers for common strategies.
Footnotes
a
In common parlance, segmentation and clustering are often used interchangeably. In this case, we use clustering to refer to the methods used to produce internally homogeneous and externally heterogeneous groups, while segmentation refers to the description and analysis of the potential of each cluster.
b
These names have been omitted for confidentiality reasons.
Author’s Biographies
Mondher Toumi is Chair of Market Access at the Université Claude Bernard Lyon 1, where he established the European Market Access University Diploma (EMAUD). He is Vice-President of Regulatory Affairs of the French Society of Health Economics (SFES), and President of the International Society for Systems Sciences in Health Care (ISSSHC). He is also the founder of Creativ-Ceutical. Professor Toumi is a medical doctor, with a Master's degree in biological sciences and a PhD in economic sciences. He has more than 50 publications in international peer-reviewed journals, and has contributed to many books.
Steven Flostrand is Pricing and Market Access Director at Creativ-Ceutical. He is responsible for developing and delivering strategic pricing, reimbursement and market access projects for healthcare companies. Steven has 10 years of marketing and market access experience in the pharmaceutical industry and more than 5 years' consulting experience in the fields of marketing and market access. He holds an MBA from INSEAD.
Aurélie Millier is Associate Project Manager at Creativ-Ceutical. Her field of expertise is biostatistics and econometrics. She holds a Master's degree in biostatistics from the Institut de Statistiques de l'Université de Paris, where she now lectures on health economics. She has strong experience in statistical methods applied to healthcare. Before consulting in biostatistics and epidemiology, she worked on handling missing data at INSERM and on very large health insurance databases at CNAMTS. Her fields of expertise are large-claim databases, epidemiology and decision sciences.